Article

Validating Reference Gene Expression Stability in Human Ovarian Follicles, Oocytes, Cumulus Cells, Ovarian Medulla, and Ovarian Cortex Tissue

by
Jesús Cadenas
*,
Susanne Elisabeth Pors
,
Dmitry Nikiforov
,
Mengxue Zheng
,
Cristina Subiran
,
Jane Alrø Bøtkjær
,
Linn Salto Mamsen
,
Stine Gry Kristensen
and
Claus Yding Andersen
Laboratory of Reproductive Biology, The Juliane Marie Centre for Women, Children and Reproduction, University Hospital of Copenhagen, Rigshospitalet, 2100 Copenhagen, Denmark
*
Author to whom correspondence should be addressed.
Int. J. Mol. Sci. 2022, 23(2), 886; https://doi.org/10.3390/ijms23020886
Submission received: 17 December 2021 / Revised: 8 January 2022 / Accepted: 11 January 2022 / Published: 14 January 2022
(This article belongs to the Special Issue Molecular Regulation in Female Reproduction)

Abstract

:
Human ovarian cells are phenotypically very different and are often only available in limited amounts. Despite the fact that reference gene (RG) expression stability has been validated in oocytes and other ovarian cells from several animal species, the suitability of a single universal RG in the different human ovarian cells and tissues has not been determined. The present study aimed to validate the expression stability of five of the most used RGs in human oocytes, cumulus cells, preantral follicles, ovarian medulla, and ovarian cortex tissue. The selected genes were glyceraldehyde 3-phosphate dehydrogenase (GAPDH), beta-2-microglobulin (B2M), large ribosomal protein P0 (RPLP0), beta-actin (ACTB), and peptidylprolyl isomerase A (PPIA). Overall, the stability of all RGs differed among ovarian cell types and tissues. NormFinder identified ACTB as the best RG for oocytes and cumulus cells, and B2M for medulla tissue and isolated follicles. The combination of two RGs only marginally increased the stability, indicating that using a single validated RG would be sufficient when the available testing material is limited. For the ovarian cortex, depending on culture conditions, GAPDH or ACTB were found to be the most stable genes. Our results highlight the importance of assessing RGs for each cell type or tissue when performing RT-qPCR analysis.

1. Introduction

Human ovarian function is still not completely understood, especially the hormonal mechanisms underlying follicle and oocyte growth and maturation. Understanding these biological processes is particularly relevant in the context of fertility preservation, where procedures such as in vitro follicle culture and oocyte in vitro maturation (IVM) are being developed to augment the outcome of fertility restoration [1,2,3].
The technique of quantitative real-time polymerase chain reaction (RT-qPCR) is considered the benchmark for gene expression analysis and has become the mainstream method to monitor potential improvements during many experimental conditions [4,5,6,7]. Briefly, this method is based on the expression of target genes in relation to endogenous reference genes (RGs), also called housekeeping genes, which are considered to have constant expression. RGs are used to correct sample-to-sample variations, including the amount and integrity of RNA, enzymatic efficiency, and presence of contaminating DNA [8,9]. Ideally, RGs should be universally expressed with a constant level in any cell type and biological or experimental condition [10]. However, no universal RG has been detected so far. Literature shows that RG expression may in fact vary between different tissues, cell types, and experimental conditions [11,12,13,14,15]. Hence, selecting the appropriate RGs is crucial in any experimental design to interpret data generated by RT-qPCR with the best accuracy [16].
Three statistical algorithms have been widely used to assess the stability of RG expression: geNorm [17], BestKeeper [18], and NormFinder [19]. Among them, the NormFinder software is the only one that estimates not only the overall variation of the candidate RGs but also the variation between sample subgroups, which is particularly relevant, for instance, when testing different culture conditions, when a variety of cell types/tissues are involved, or when the samples come from a diverse group of patients.
Despite the fact that RG expression stability has been validated in oocytes and other ovarian cells and tissues from several animal species [20,21,22], no one has, to our knowledge, evaluated human ovarian tissue including oocytes and preantral follicles. However, most studies use a single RG to normalize RT-qPCR data without any preliminary evaluation of appropriateness [4,5,23]. Access to human ovarian tissue is very limited, especially oocytes, and only a few studies have validated RGs in biopsies from normal, cancerous, and/or polycystic ovaries [10,24,25,26], or pieces of cryopreserved vs. non-cryopreserved ovarian cortex [16]. None of these previous studies have investigated RG expression stability in specific ovarian compartments, including oocytes, preantral follicles, cumulus cells, and medulla tissue. Hence, the present study aimed to identify the most stable RGs in order to obtain reliable RT-qPCR results in different compartments of the human ovaries. With this in mind, we selected NormFinder to assess the expression stability of five of the most used RGs in human oocytes, cumulus cells, preantral follicles, ovarian medulla, and ovarian cortex tissue. The RGs included were glyceraldehyde 3-phosphate dehydrogenase (GAPDH), beta-2-microglobulin (B2M), large ribosomal protein P0 (RPLP0), beta-actin (ACTB), and peptidylprolyl isomerase A (PPIA). Furthermore, the impact of normalizing vs. non-normalizing the RNA concentrations on the RG expression stability was evaluated in oocytes and isolated follicles, and the impact of culture conditions was evaluated in the cryopreserved ovarian cortex.

2. Results

2.1. General Expression Levels of Reference Genes

Overall, comparisons of the cycle threshold (Ct) values demonstrated a wide variation among the RGs within the same group of samples, especially for oocytes and preantral follicles with normalized RNA (Table 1). ACTB and RPLP0 showed the highest levels of expression and PPIA the lowest levels of expression in all types of samples, except for cortex tissue, where PPIA had the highest level of expression and B2M the lowest (Table 1).

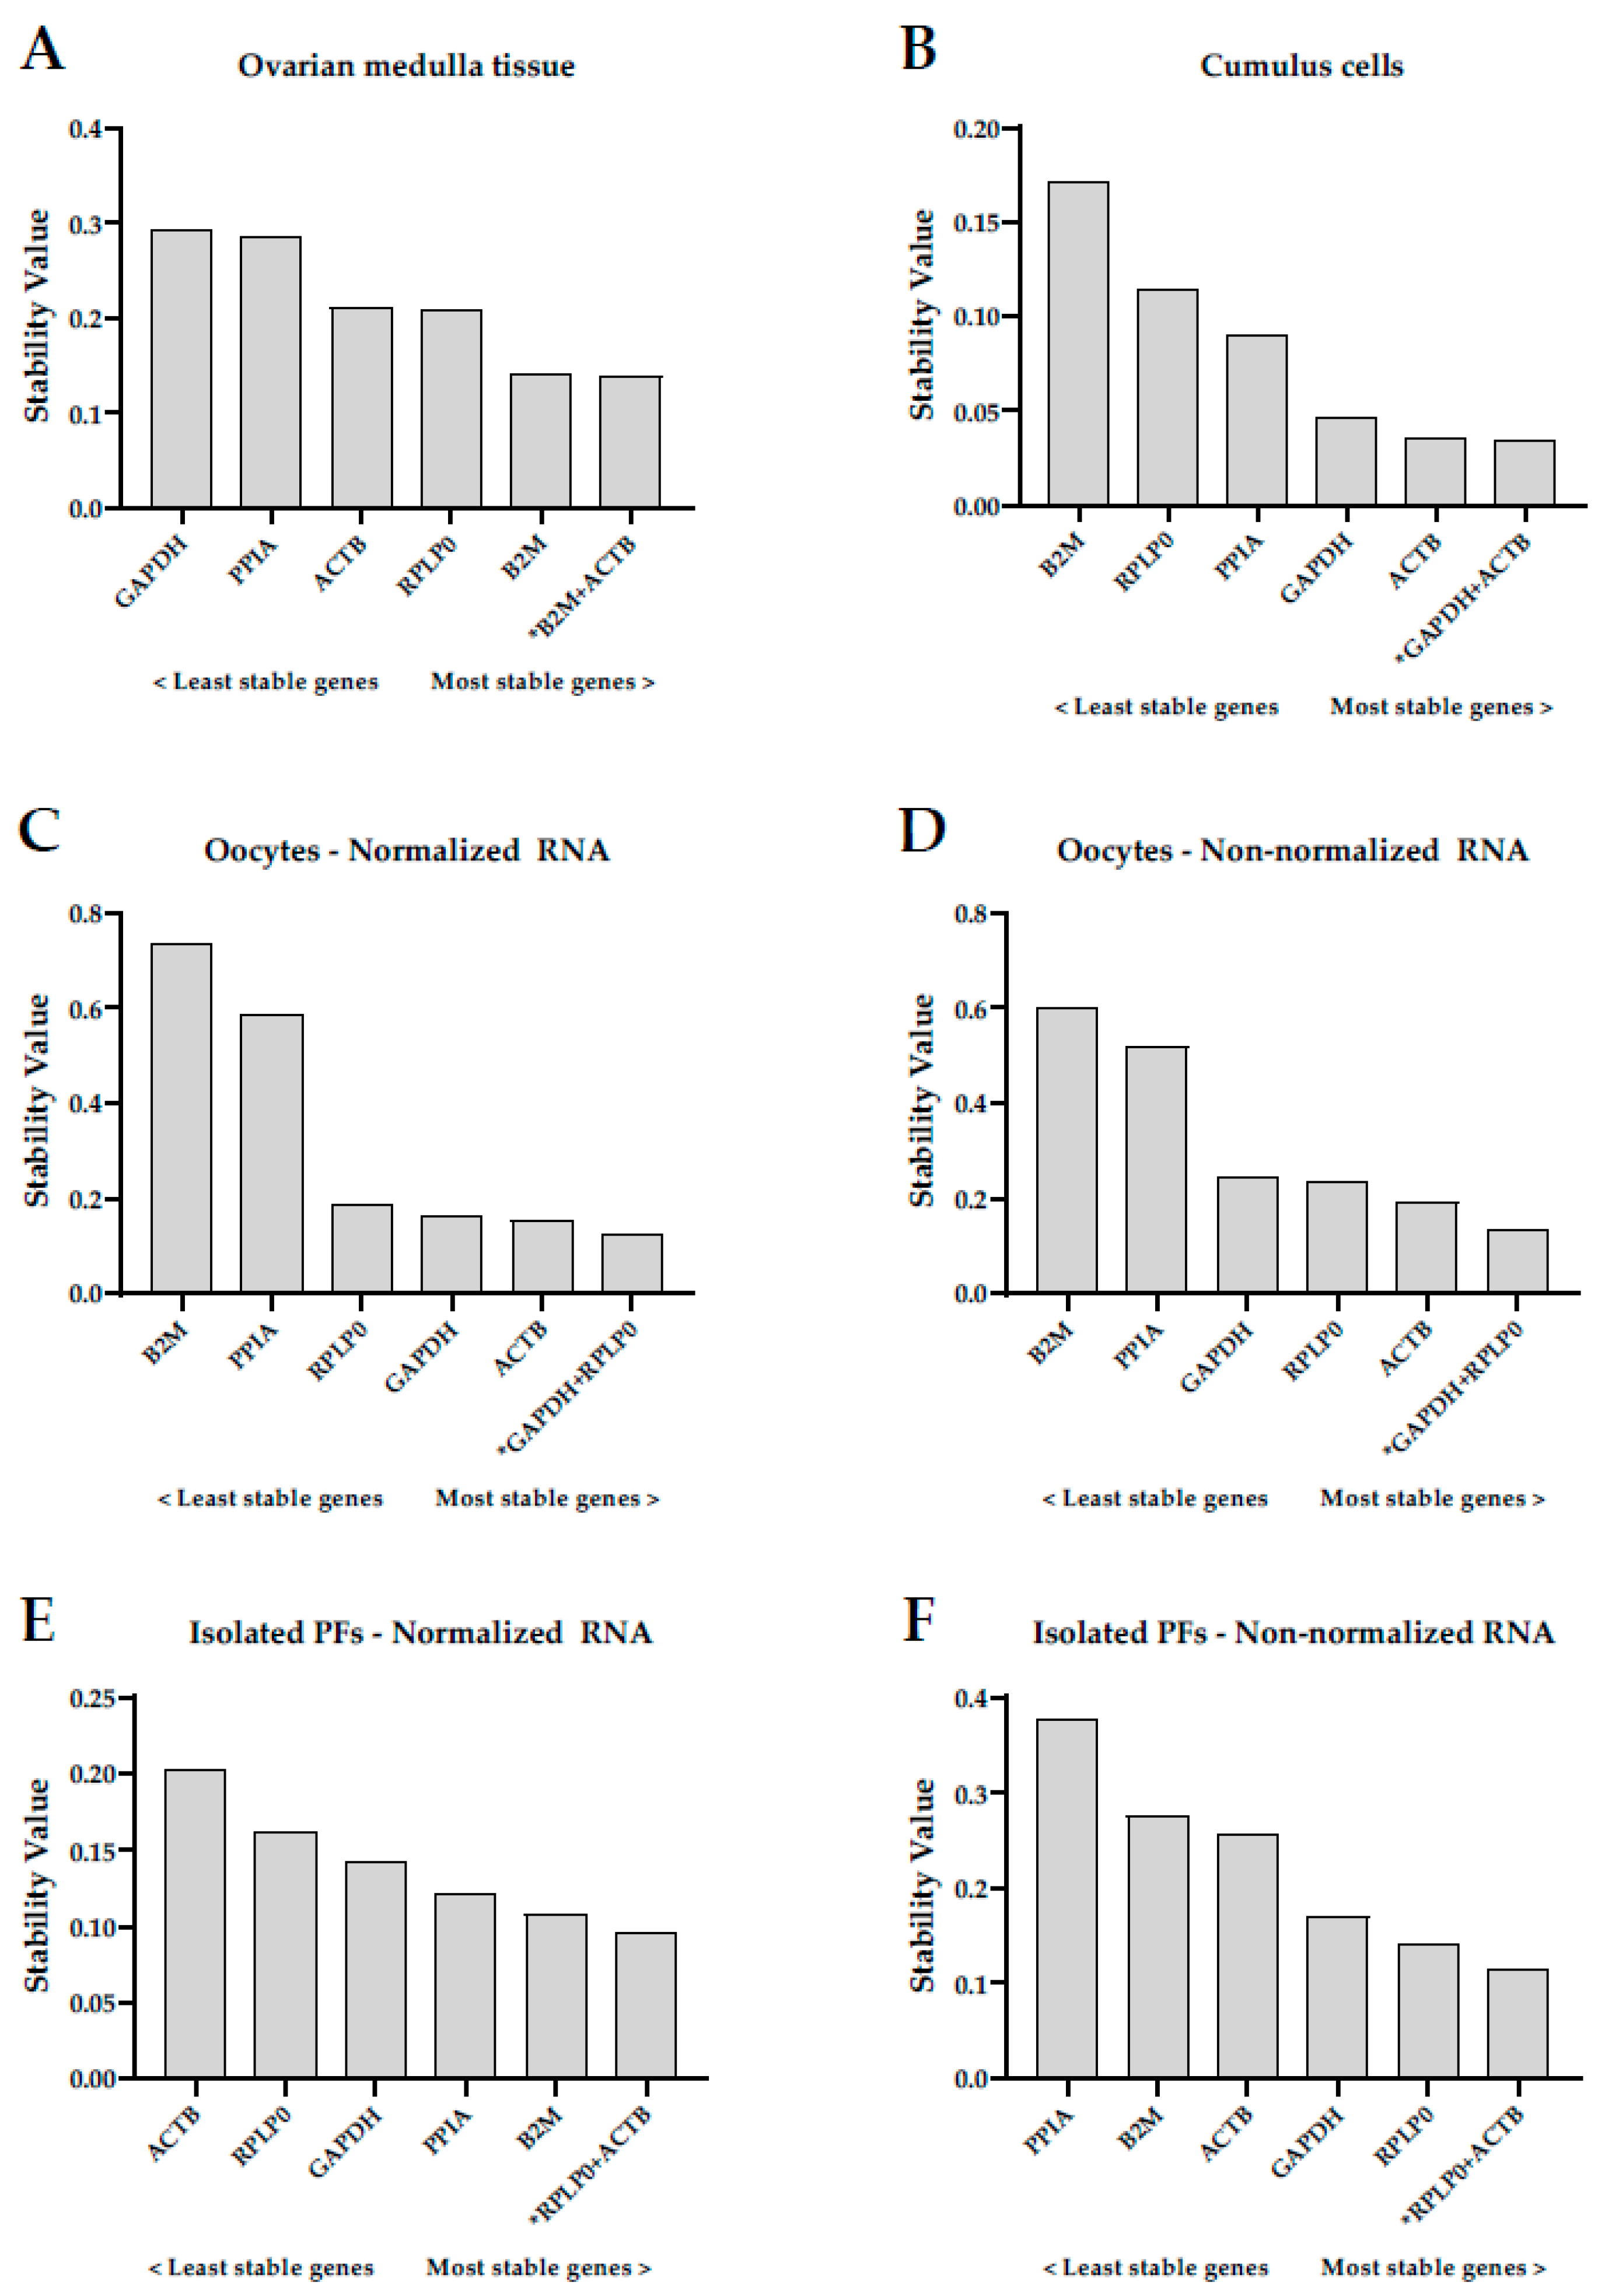
2.2. Stability of Reference Genes in Human Oocytes, Preantral Follicles, Cumulus Cells, and Medulla Tissue

The stability values for the five individual RGs and all combinations of RGs were analyzed for each of the different cell types and tissues. NormFinder ranked the RGs, with the most stable RG having the lowest stability value. The mathematical model can be found in the original publication [26].

2.2.1. Ovarian Medulla Tissue

Each patient was considered as one subgroup. The ranking of RGs was as follows (starting from the most stable to the least stable): B2M > RPLP0 > ACTB > PPIA > GAPDH (Figure 1A). The best combination of two genes was B2M and ACTB, with a combined stability value of 0.138, which was very similar to B2M alone (stability value = 0.140).

2.2.2. Cumulus Cells

Cumulus cell samples were assessed individually, and each patient was considered as one subgroup. The ranking of RGs was different from that of the medulla tissue, and was as follows (starting from the most stable to the least stable): ACTB > GAPDH > PPIA > RPLP0 > B2M (Figure 1B). The best combination of two genes was GAPDH and ACTB, with a combined stability value of 0.034, which was similar to ACTB alone (stability value = 0.036).

2.2.3. Oocytes

Since each pool of immature GV oocytes contained cells from a large group of patients, the oocyte samples were grouped according to their origin (fresh or IVM) instead of patient. The two arms of this section, i.e., (1) samples with the same RNA concentration (normalized) and (2) samples with different RNA concentrations (non-normalized), had the same number of fresh and IVM oocytes. The ranking of RGs was observed to be similar in both groups, and was as follows (starting from the most stable to the least stable): ACTB > GAPDH > RPLP0 > PPIA > B2M for normalized samples (Figure 1C), and ACTB > RPLP0 > GAPDH > PPIA > B2M for non-normalized samples (Figure 1D). The stability value of ACTB alone was 0.154 for normalized samples and 0.191 for non-normalized samples. GAPDH and RPLP0 were selected as the best combination of two genes, with stability values of 0.123 and 0.135 for normalized and non-normalized samples, respectively.

2.2.4. Isolated Preantral Follicles

Each patient was considered as a subgroup when analyzing preantral follicles. Different results were obtained depending on whether the RNA in the samples was normalized or not. The ranking of RGs was as follows (starting from the most stable to the least stable): B2M > PPIA > GAPDH > RPLP0 > ACTB for normalized samples (Figure 1E), and RPLP0 > GAPDH > ACTB > B2M > PPIA for non-normalized samples (Figure 1F). The stability values of the most stable genes were 0.108 (B2M) and 0.140 (RPLP0) for normalized and non-normalized samples, respectively. The best combination of two genes was RPLP0 and ACTB for both normalized and non-normalized samples, with combined stability values of 0.095 (normalized samples) and 0.115 (non-normalized samples).

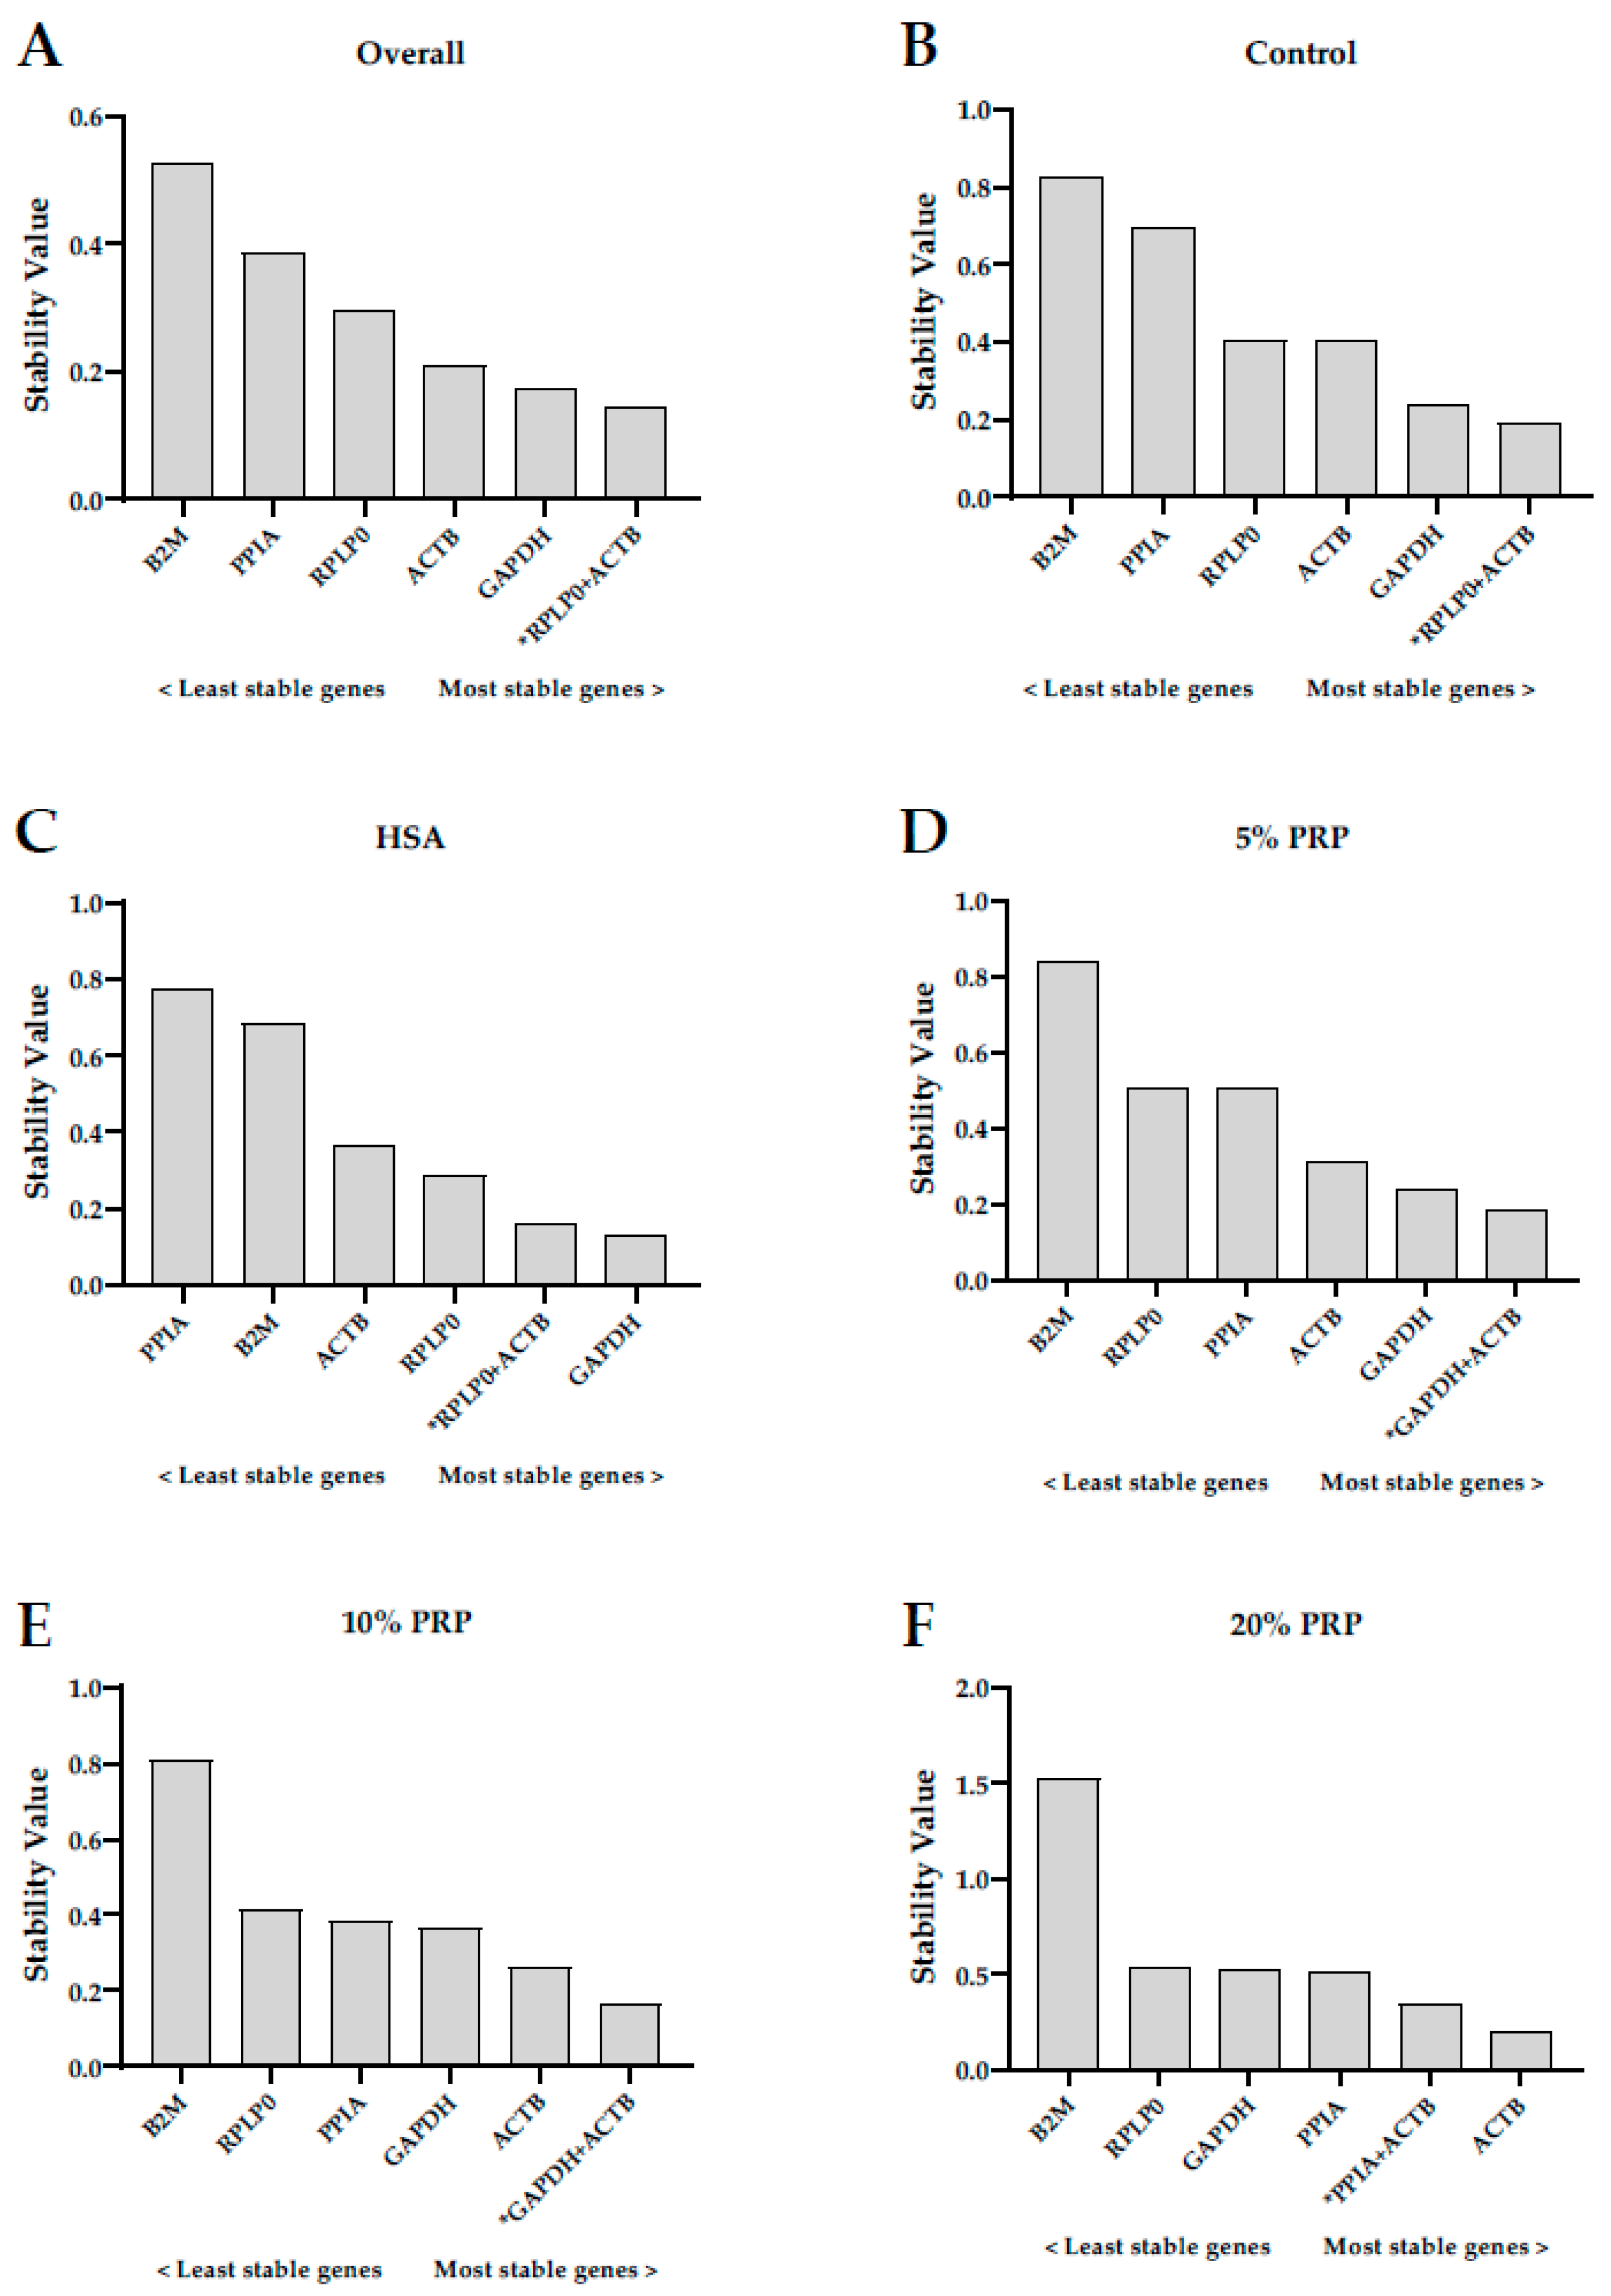
2.3. Stability of Reference Genes in Human Ovarian Cortex Cultured with Different Serum-Derived Supplements

In a separate experiment, the NormFinder software was used to validate the RG expression stability in the ovarian cortex after a 24 h culture with different serum-derived supplements. For the overall analysis, each culture condition was considered as a subgroup. For the analysis within a particular culture condition, each patient was considered as a subgroup. The overall ranking of RGs in the ovarian cortex after in vitro culture was as follows (starting from the most stable to the least): GAPDH > ACTB > RPLP0 > PPIA > B2M (Figure 2A). The best combination of two genes was RPLP0 and ACTB, with a combined stability value of 0.144 (the stability value of GAPDH alone was 0.173). The control treatment showed similar results, with GAPDH as the most stable gene, and RPLP0 and ACTB as the best combination of two genes (Figure 2B). Although there were some differences in the rankings of RGs in the HSA and 5% PRP treatments, GAPDH was also selected as the most stable gene in both treatments, with stability values of 0.131 and 0.242 for HSA and 5% PRP, respectively (Figure 2C,D). The best combinations of two genes were RPLP0 and ACTB for the HSA treatment (stability value = 0.162), and GAPDH and ACTB for the 5% PRP treatment (stability value = 0.187). Unlike the other treatments, ACTB and not GAPDH was selected as the most stable gene when the concentrations of PRP were 10% or 20%, with stability values of 0.264 and 0.194, respectively (Figure 2D,F). Here, the best combinations of two genes were GAPDH and ACTB for 10% PRP (stability value = 0.166), and PPIA and ACTB for 20% PRP (stability value = 0.342).

3. Discussion

Overall, the present study demonstrates that the RG expression stability differed according to the type of human ovarian cells and tissues and is furthermore affected by culture conditions. The NormFinder tool found ACTB to be the most stable gene for human immature oocytes and cumulus cells, and B2M to be the most stable gene for medulla tissue and isolated preantral follicles, provided a normalized RNA concentration was used. Even though ACTB is one of the most used RGs, some studies omit this as RG because its expression can be affected by biochemical stimuli, during cell growth and differentiation, or even by certain pathologies in various human cells and tissues [12], including ovarian tissue [10]. Nevertheless, our data suggest that ACTB expression in human immature oocytes is more stable than in other cell types as we obtained similar results with both fresh and in vitro cultured immature oocytes (data not shown). None of the ovaries included in this study had any apparent pathology, and all oocytes were at the same maturation stage (germinal vesicle, GV). Therefore, it is beyond the competence of this study to address whether ovarian pathologies or other maturational stages (e.g., metaphase II oocytes) affect ACTB expression.
In the case of B2M, there are no available data about its use as RG for ovarian medulla tissue or isolated follicles in any species. However, in bovine, B2M has been regarded as a stable RG for different follicle cell types, such as granulosa cells after culture [27], as well as oocytes and cumulus cells after IVM [22].
The combinations of RPLP0 and GAPDH for oocytes, along with RPLP0 and ACTB for follicles, provided marginally better stability values than ACTB and B2M alone. However, none of the cells and tissues showed marked improved stability scores by combining either one of the RGs. Nevertheless, it may be prudent to use two RGs in situations where the RNA availability is not an issue or where many treatments are tested. The principle is simple; the mean variation in the expression levels of multiple genes is smaller than in single genes [19]. Despite that, the use of more than one RG does not necessarily imply an improved expression stability. Hence, the number of genes to be included as endogenous controls should be carefully considered; the number of genes should be a balance between practical considerations and minimizing gene expression variation. For human oocytes, which are a particularly precious material that provides a very limited amount of RNA, it can be recommended to use a single validated RG, which, in many situations, may be considered sufficient.
Normalizing RNA concentration before reverse transcription, i.e., loading the same RNA concentration in all samples, is common practice in RT-qPCR. Nonetheless, the quantification of target gene expression in a single RNA sample is relative to the expression of one or more RGs in that specific sample. Therefore, for each sample, the ratio of a target gene to RG should be consistent, and then, the quantity of RNA added, at least in theory, is not critical. Nevertheless, it turns out that the efficiency of reverse transcription depends, among other things, on the total RNA concentration [28]. Accordingly, different RGs were selected as the most stable gene for isolated follicles when the RNA concentrations were normalized vs. non-normalized: B2M and RPLP0 for normalized and non-normalized, respectively. Interestingly, RNA normalization did not affect RG expression stability in oocytes, with ACTB being ranked as the most stable gene in both normalized and non-normalized samples. This may be due to the fact that the amount of RNA extracted from pools of 10 denuded oocytes is very similar, unlike isolated follicles, where it is not possible to know exactly the number of cells loaded within each 10-follicle pool. Interestingly, the same best combinations of two genes were selected for normalized and non-normalized samples. Hence, using two RGs could be a good strategy, especially when RNA concentrations cannot be normalized.
We also found that reference gene expression stability was affected by culture conditions in the human ovarian cortex, highlighting that cell manipulation may also impact gene expression. Overall, GAPDH was the most stable gene for this type of tissue. GAPDH was the most stable gene in the control, HSA, and 5% PRP treatments, whereas ACTB was the most stable gene for 10% and 20% PRP. Our results are comparable to the effect of how serum supplementation affects RG expression during culture in colon adenocarcinomas cell lines [15]. A few studies have also validated RG expression stability in biopsies from normal, cancerous, and polycystic ovaries (PCO) [10,24,25,26] or pieces of cryopreserved versus the non-cryopreserved ovarian cortex [16], with variable outcomes. GAPDH has proven to be stably expressed in normal ovarian tissues [24], whereas both GAPDH and ACTB have been poorly ranked in PCO and cancerous ovarian tissue [10,25,26]. It is worth noting that, in our study, the patient effect was considered within each treatment.
The present study has some limitations. The NormFinder tool demands the availability of a considerable amount of RNA; it requires a minimum of three genes and eight samples per group to perform the analysis [26]. Since human oocytes are scarce and small and only contain a modest amount of RNA, only five of the most commonly used RGs were evaluated. Therefore, it cannot be excluded that there can be other, more stable genes. Moreover, we only included immature oocytes and preantral follicles of around 60–80 µm in diameter. In addition, a limiting factor of the present study is that the hormonal status, age, and medical condition of each patient may affect gene expression. The components of the human ovary are only available in very limited supply, and if material from more patients can be collected, additional studies to investigate these conditions are warranted.
In conclusion, here we present the most complete evaluation of RG expression stability to date in human ovarian tissues and cells, including oocytes and preantral follicles. Our findings highlight the importance of assessing and validating RGs for each cell type or tissue to choose the most stable RGs for RT-qPCR. Moreover, for some cell types, the combination of two RGs only provided a modest increment of the stability value, which indicated that using a single validated RG can be recommended when the available testing material is limited. Hence, in our study conditions, we suggest using ACTB for oocytes and cumulus cells, and B2M for medulla tissue and isolated follicles. For the ovarian cortex, culture conditions affected the RG expression stability; depending on the treatment, GAPDH or ACTB were found to be the most stable genes.

4. Materials and Methods

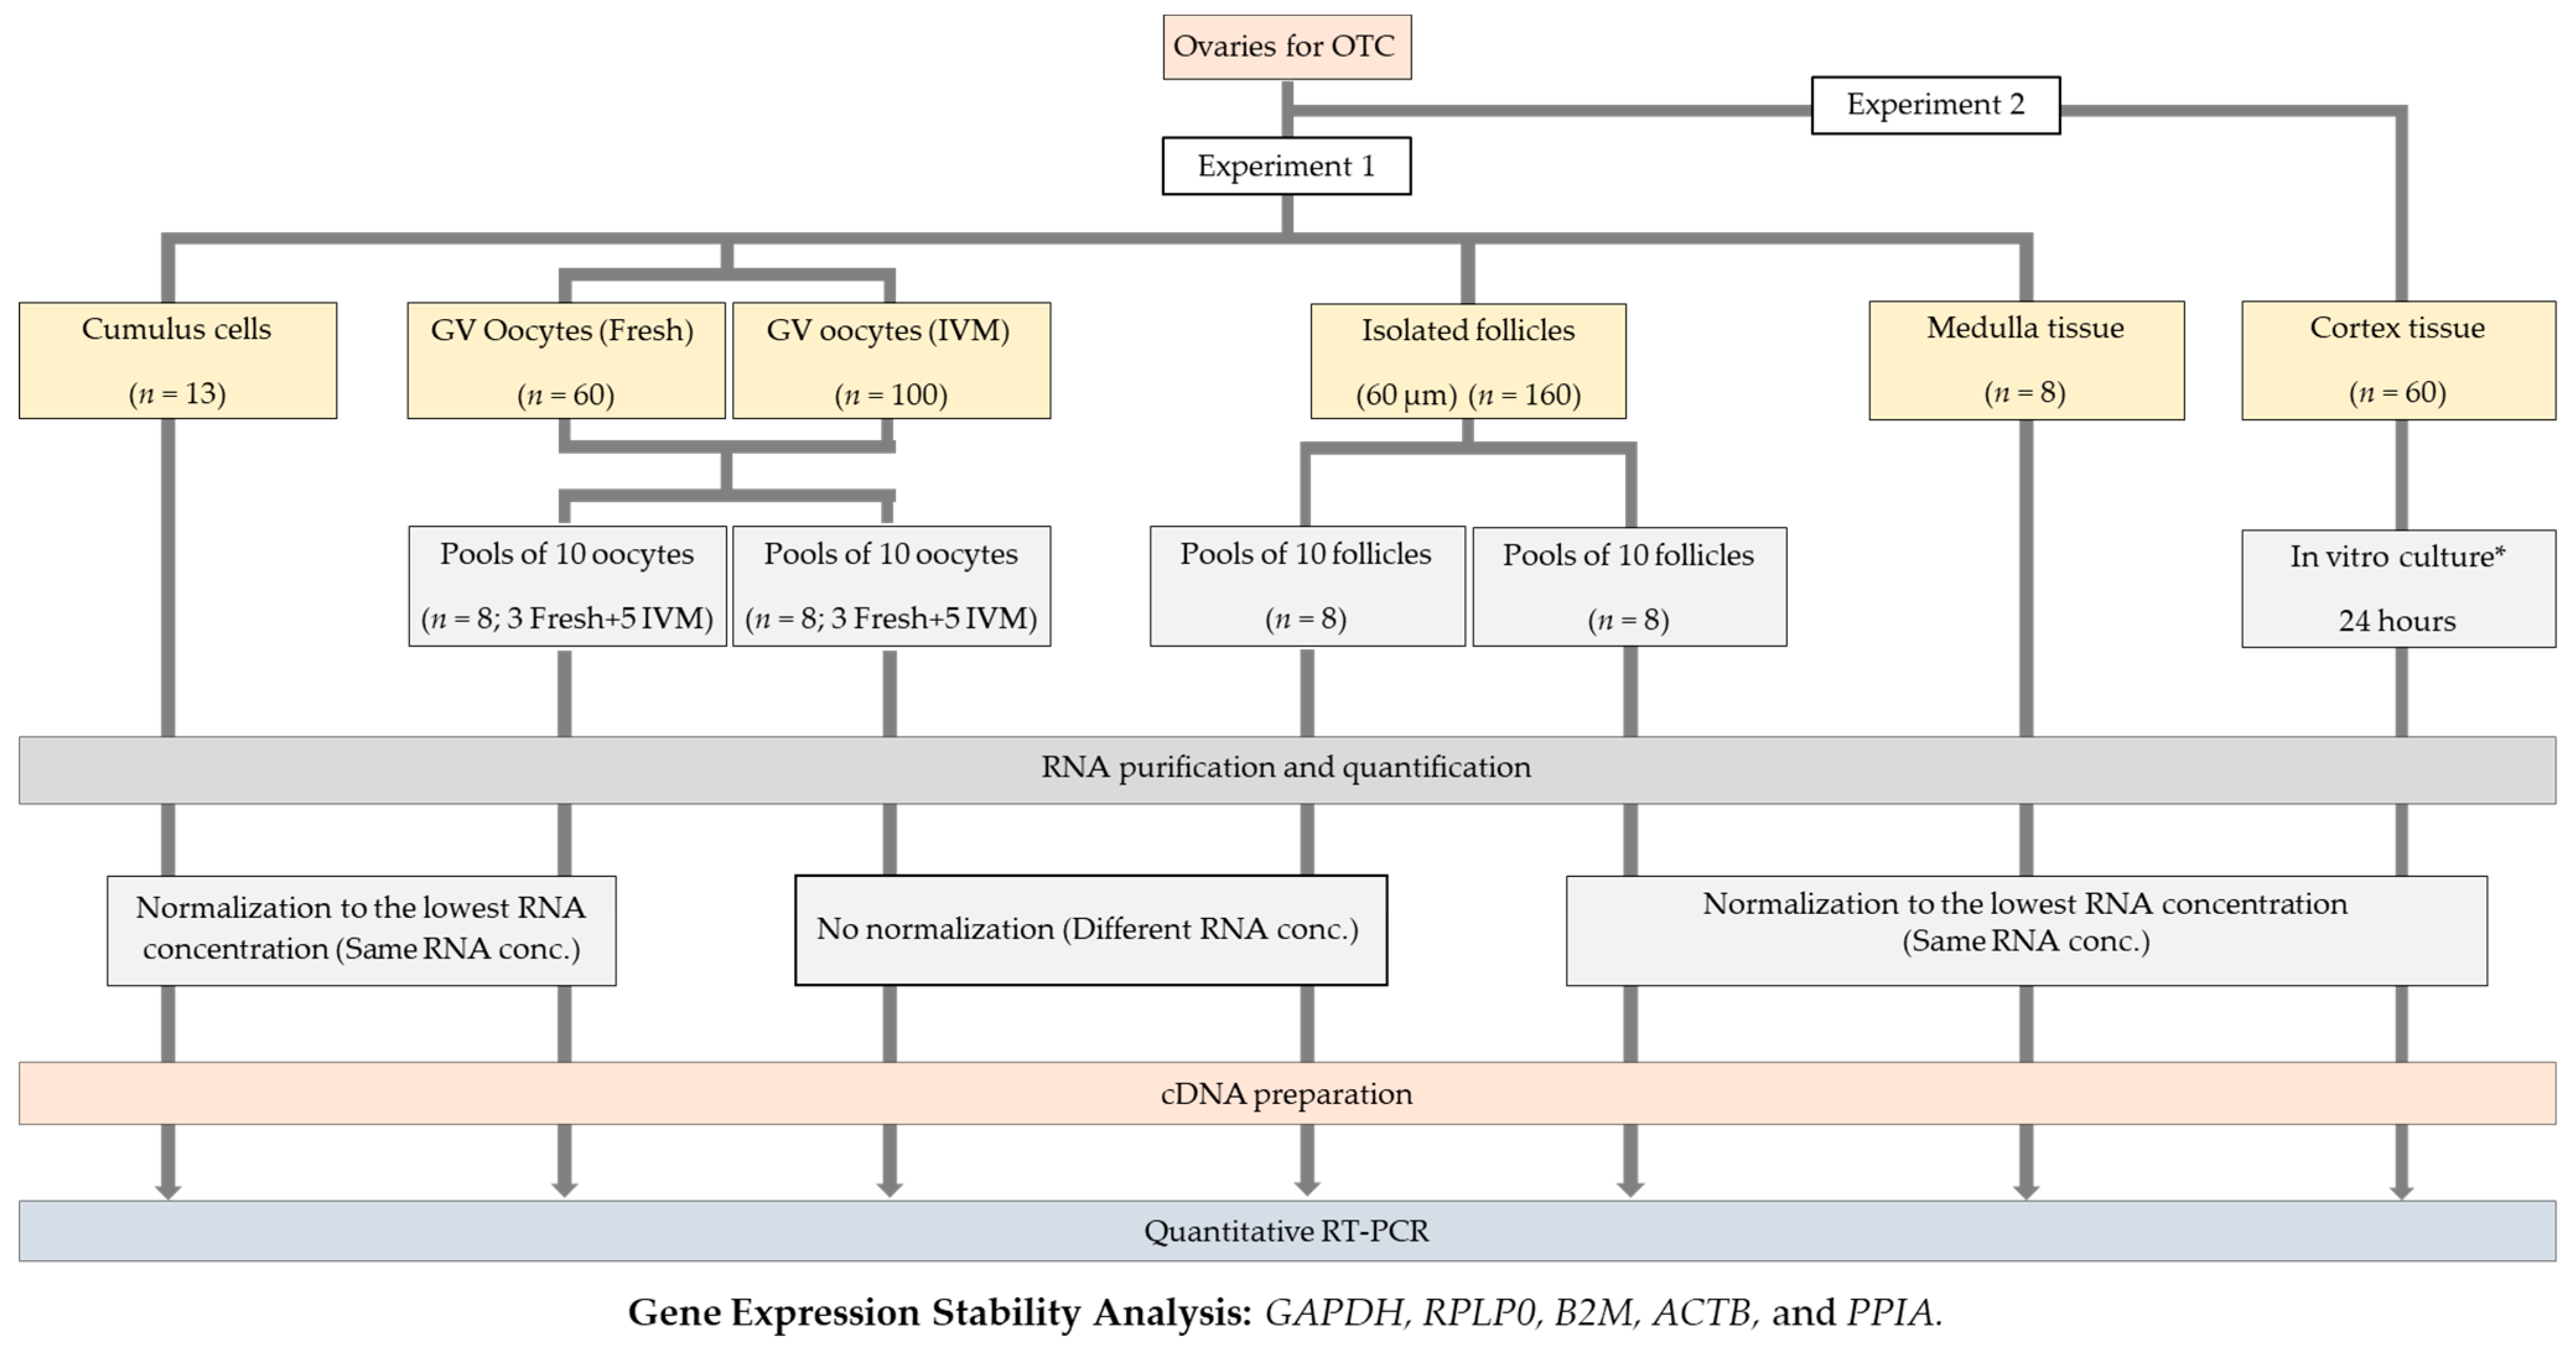
4.1. Experimental Design

The experimental design is shown in Figure 3. The stability of five of the most commonly used reference genes (RGs) (i.e., GAPDH, B2M, RPLP0, ACTB, and PPIA) was analyzed by the NormFinder software. The study had two arms assessing either the stability of RGs in isolated ovarian cells and tissues or under different culture conditions. In experiment 1, the gene expression stability of the five RGs was analyzed in human oocytes, isolated preantral follicles, cumulus cells, and ovarian medulla tissue. In experiment 2, the stability of the five RGs was assessed in pieces of ovarian cortex after 24 h of culture.
Within experiment 1, oocytes and follicles were subdivided into two groups depending on whether the RNA concentrations before cDNA synthesis were normalized or not, i.e., half of the samples had the same RNA concentration converted into cDNA (normalized), and the other half had a different RNA concentration within each sample converted into cDNA (non-normalized). The RNA concentrations in cumulus cells, ovarian medulla tissue, and ovarian cortex were all normalized.

4.2. Patients and Collected Material

A total of 29 patients (aged 28 years on average; range 14–36) undergoing unilateral oophorectomy and OTC for fertility preservation [29] were included in the study. None of the patients presented with pathologies in the ovaries. The indications for fertility preservation were Hodgkin lymphoma (n = 3), non-Hodgkin lymphoma (n = 1), breast cancer (n = 17), sarcoma (n = 3), and various benign diseases (n = 5). All samples used in the present study (oocytes, cumulus cells, isolated preantral follicles, ovarian medulla tissue, and ovarian cortex) were collected in association with other research projects, i.e., only a fraction of the samples collected from a single patient was allocated to this study. The type of sample used from each patient is shown in Supplementary Table S1. In experiment 1, immature oocytes (n = 160) at germinal vesicle (GV) stage were collected from 22 patients, including 60 fresh oocytes (Fresh-GV) from 7 patients, and 100 oocytes after IVM (GV-IVM) from 15 patients; preantral follicles (n = 160) from 7 patients; cumulus cells (n = 13) from 3 patients; and medulla tissue (n = 8) from 4 patients. In experiment 2, sixty pieces (2 × 2 × 2 mm) of ovarian cortex were cultured from 4 patients (15 pieces of ovarian tissue from each patient). The fertility history of the patients and the phase of their menstrual cycle were not recorded.

4.3. Ovary Transport and Oocyte Collection

Ovaries were transported to the laboratory in IVF flushing medium (Origio A/S, Måløv, Denmark) or in Custodiol® HTK (Dr Franz Köhler Chemie GmbH., Bensheim, Germany), either on crushed ice from collaborating hospitals (2–5 h transport) or at 37 °C from the local hospital (10 min transport) [30]. After isolating the ovarian cortex for cryopreservation, dishes containing the surplus medulla tissue in HEPES-buffered DMEM/F-12 medium (GIBCOTM, Life Technologies, Paisley, UK) were thoroughly examined for the presence of immature oocytes under a stereomicroscope (Leica MZ12, Wetzlar, Germany) within a flow hood with heated tabletop at 37 °C. Recovered oocytes were placed in oocyte holding medium, which consisted of McCoy’s 5α plus 25 mM HEPES (Invitrogen, GIBCOTM) with 5 mg/mL human serum albumin (HSA; 20%, CSL Behring, Marburg, Germany), 10 µg/mL insulin, 5.5 µg/mL transferrin, 6.7 ng/mL selenium (ITS; GIBCOTM, Life Technologies, Grand Island, NY, USA), 2 mM Glutamax (GIBCOTM, Life Technologies, Paisley, UK), and 0.05 mg/mL penicillin/streptomycin (GIBCOTM, Life Technologies, Paisley, UK) [6]. After that, cumulus-enclosed oocytes were mechanically denuded using a 130–133 µm denudation pipette (Vitrolife, Gothenburg, Sweden) and visualized under an inverted microscope (Carl Zeiss Axiovert 135, Wetzlar, Germany; 20× magnification). Only oocytes that showed clear signs of degeneration, such as darkened cytoplasm, were excluded from the study. Selected immature oocytes at GV stage were then washed in Dulbecco’s phosphate buffered saline (DPBS; GIBCOTM, Life Technologies, Paisley, UK), pooled in groups of 10, snap frozen, and stored at −80 °C (GV-Fresh, n = 60).
In combination with another project, oocytes that remained immature, i.e., at the GV stage after IVM, were also denuded, pooled in groups of 10, snap frozen, and stored at −80 °C (GV-IVM, n = 100).

4.4. Medulla Tissue Collection and Follicle Isolation

Eight pieces of ovarian medulla tissue were snap frozen and stored at −80 °C. The remaining pieces of surplus medulla tissue were used for follicle isolation as previously described, with some modifications [31]. Briefly, all medulla tissue pieces were collected in HEPES-buffered DMEM/F-12 medium and mechanically minced into fragments with a McIlway tissue chopper (Cavey Laboratory Engineering Co. Ltd., Guildford, Surrey, UK). Tissue pieces were transferred to a 100 mm culture dish (NunclonTM Delta, Nunc A/S, Roskilde, Denmark) containing preheated follicle holding medium that consisted of McCoy’s 5α plus 25 mM HEPES with 1 mg/mL HSA, 1% ITS, 2 mM Glutamax, and 0.05 mg/mL penicillin/streptomycin. For tissue enzymatic digestion, the holding medium was supplemented with 0.2 mg/mL collagenase IV (Sigma-Aldrich, Saint Louis, MO, USA) and 0.2 mg/mL DNase I (Sigma-Aldrich, USA), followed by incubation at 37 °C for 60 min with gentle agitation. The enzymatic digestion was terminated by adding an equal volume of McCoy’s 5α plus 25 mM HEPES with 10% fetal bovine serum (FBS, Invitrogen, GIBCOTM), and 0.05 mg/mL penicillin/streptomycin. The cell suspension was vigorously aspirated up and down with a 3 mL Pasteur pipette (Vitrolife, Sweden) to release the follicles from the digested tissue. Culture dishes were carefully examined for the presence of preantral follicles under a stereomicroscope (Leica MZ12, Wetzlar, Germany) at 37 °C. Recovered preantral follicles were placed in follicle holding medium and visualized under an inverted microscope connected to a camera (DeltaPix, Smørum, Denmark) to check basement membrane integrity and diameter. Follicles that were around 60–80 µm in diameter were pooled in groups of 10 (n = 160), washed in DPBS, snap frozen, and stored at −80 °C. Follicles with larger diameters were used in a different study.

4.5. In Vitro Culture of Human Ovarian Cortex (Experiment 2)

Four pieces of ovarian cortex (5 × 5 × 2 mm) from four patients that had been previously cryopreserved and donated for research were used. Each piece was thawed and cut into fifteen fragments (n = 60); from those, three fragments were allocated to each of the five treatment groups: base medium alone, consisting of α-minimum essential medium (α-MEM; GIBCOTM, Life Technologies, Bleiswijk, The Netherlands) with 1% ITS, 5 IU/mL heparin (Amgros I/S, Copenhagen, Denmark) and 0.05 mg/mL penicillin/streptomycin (control treatment), base medium supplemented with 5 mg/mL HSA (HSA treatment), or base medium supplemented with increasing concentrations of platelet-rich plasma (PRP) (5% PRP, 10% PRP, and 20% PRP). PRP was prepared and kindly donated by the blood bank of the University Hospital of Copenhagen, Rigshospitalet, Denmark. Each fragment was transferred into an individual well of a 48-well plate containing 300 µL of culture medium at 37 °C and 5% CO2 for 24 h. After that, the ovarian fragments were snap frozen and stored at −80 °C.

4.6. Quantitative Real-Time PCR (RT-qPCR)

Different human ovarian tissues were evaluated in two experiments: medulla tissue (n = 8), immature oocytes (n = 16 pools, 10 oocytes per pool), cumulus cells (n = 13), and isolated preantral follicles (n = 16 pool, 10 follicles per pool) (Experiment 1); and ovarian cortex (n = 60) after in vitro culture (Experiment 2). Total RNA was extracted and purified from each sample with TRIzol® reagent (Ambion, Life Technologies, Carlsbad, CA, USA) and 1-bromo-3-chloropropane (Sigma-Aldrich, USA) and, subsequently, with RNeasy® Minikit 250 (Qiagen, Denmark) according to manufacturer’s instructions. All steps were performed on ice. The quality and quantity of the isolated RNA was evaluated using Agilent RNA 6000 Pico kit and Agilent Bioanalyzer 2100 (Agilent Technologies, Santa Clara, CA, USA). Only samples with an RNA integrity value (RIN) ≥ 5 were included in the study. For each selected sample, first-strand cDNA was prepared using the High Capacity cDNA Reverse Transcription Kit (Applied Biosystems, Foster City, CA, USA) following the manufacturer’s instructions. The quantitative RT-PCR analysis was carried out by TaqMan® technology using the TaqManTM Fast Advanced Master Mix (Applied Biosystems, Foster City, CA, USA). The specific TaqMan probes used in the study are shown in Table 2. For each gene, the TaqMan probe with the best coverage was selected based on the criteria and as recommended by the manufacturer (Thermo Fisher Scientific). According to information from the manufacturer, amplification efficiency was 100% ± 10%. All samples were run in duplicates and two negative controls (a non-template RNA RT–PCR control and a non-template cDNA control) were prepared according to manufacturer’s instructions. The absolute expression levels were quantified using the LightCycler480 Software (Roche, Basel, Switzerland).

4.7. Statistical Analysis

For stability comparisons of RGs, the NormFinder algorithm was used (v0.953) according to its original publication [26]. The mRNA expression level for each of the 5 RGs was obtained using the mean RT-PCR Ct-value (cycle threshold), which is defined as the number of cycles needed for the fluorescence to exceed background levels, and is inversely proportional to the amount of target nucleic acid present in the reaction. The Ct-values were transformed to linear scale expression quantities by 2−Ct and exported to NormFinder for analysis. Comparison of the Ct-values for different genes was carried out using a linear mixed model, with Ct as outcome, gene as explanatory variable and patient as random effect when the samples were not pooled. The linear model resulted in a Wald test. Log transformation of data was used when not normal distributed. All analyses were performed in R, v3.4.3.

Supplementary Materials

The following are available online at https://www.mdpi.com/article/10.3390/ijms23020886/s1.

Author Contributions

Conceptualization, C.Y.A. and S.G.K.; methodology, J.C.; validation, C.Y.A., S.G.K., L.S.M. and S.E.P.; formal analysis, S.E.P.; investigation, J.C.; resources, J.C., D.N., M.Z. and C.S.; writing—original draft preparation, J.C.; writing—review and editing, D.N., M.Z., C.S., S.E.P., J.A.B., L.S.M., S.G.K. and C.Y.A.; visualization, J.C.; supervision, C.Y.A.; project administration, C.Y.A.; funding acquisition, C.Y.A. All authors have read and agreed to the published version of the manuscript.

Funding

This research was funded by Independent Research Fund Denmark, grant number 0134-00448.

Institutional Review Board Statement

The study was conducted according to the guidelines of the Declaration of Helsinki and approved by the Scientific Ethical Committee for the Capital Region of Denmark (H-2-2011-044, 2011).

Informed Consent Statement

Informed consent was obtained from all subjects involved in the study.

Data Availability Statement

All data are available via the corresponding author.

Acknowledgments

Sofie Lund and Anna S. Tjäder are acknowledged for excellent technical assistance. A special thank goes to the doctors and nurses at the operation theatres of the University Hospital of Copenhagen, Rigshospitalet, University Hospital of Odense, and University Hospital of Aarhus.

Conflicts of Interest

The authors declare no conflict of interest.

References

  1. Gremeau, A.S.; Andreadis, N.; Fatum, M.; Craig, J.; Turner, K.; McVeigh, E.; Child, T. In vitro maturation or in vitro fertilization for women with polycystic ovaries? A case-control study of 194 treatment cycles. Fertil. Steril. 2012, 98, 355–360. [Google Scholar] [CrossRef]
  2. Imesch, P.; Scheiner, D.; Xie, M.; Fink, D.; Macas, E.; Dubey, R.; Imthurn, B. Developmental potential of human oocytes matured in vitro followed by vitrification and activation. J. Ovarian Res. 2013, 6, 30. [Google Scholar] [CrossRef] [Green Version]
  3. Walls, M.L.; Hunter, T.; Ryan, J.P.; Keelan, J.A.; Nathan, E.; Hart, R.J. In vitro maturation as an alternative to standard in vitro fertilization for patients diagnosed with polycystic ovaries: A comparative analysis of fresh, frozen and cumulative cycle outcomes. Hum. Reprod. 2015, 30, 88–96. [Google Scholar] [CrossRef] [Green Version]
  4. Zhao, P.; Qiao, J.; Huang, S.; Zhang, Y.; Liu, S.; Yan, L.Y.; Hsueh, A.J.; Duan, E.K. Gonadotrophin-induced paracrine regulation of human oocyte maturation by BDNF and GDNF secreted by granulosa cells. Hum. Reprod. 2011, 26, 695–702. [Google Scholar] [CrossRef] [Green Version]
  5. Li, Y.; Liu, H.; Yu, Q.; Liu, H.; Huang, T.; Zhao, S.; Ma, J.; Zhao, H. Growth hormone promotes in vitro maturation of human oocytes. Front. Endocrinol. 2019, 10, 485. [Google Scholar] [CrossRef] [PubMed] [Green Version]
  6. Cadenas, J.; Nikiforov, D.; Pors, S.E.; Zuniga, L.A.; Wakimoto, Y.; Ghezelayagh, Z.; Mamsen, L.S.; Kristensen, S.G.; Andersen, C.Y. A threshold concentration of FSH is needed during IVM of ex vivo collected human oocytes. J. Assist. Reprod. Genet. 2021, 38, 1341–1348. [Google Scholar] [CrossRef] [PubMed]
  7. Bustin, S.A.; Benes, V.; Nolan, T.; Pfaffl, M.W. Quantitative real-time RT-PCR—A perspective. J. Mol. Endocrinol. 2005, 34, 597–601. [Google Scholar] [CrossRef] [Green Version]
  8. Bustin, S.A. Quantification of mRNA using real-time reverse transcription PCR (RT-PCR): Trends and problems. J. Mol. Endocrinol. 2002, 29, 23–39. [Google Scholar] [CrossRef] [PubMed]
  9. Gebeh, A.K.; Marczylo, E.L.; Amoako, A.A.; Willets, J.M.; Konje, J.C. Variation in stability of endogenous reference genes in fallopian tubes and endometrium from healthy and ectopic pregnant women. Int. J. Mol. Sci. 2012, 13, 2810–2826. [Google Scholar] [CrossRef]
  10. Asiabi, P.; Ambroise, J.; Giachini, C.; Coccia, M.E.; Bearzatto, B.; Chiti, M.C.; Dolmans, M.M.; Amorim, C.A. Assessing and validating housekeeping genes in normal, cancerous, and polycystic human ovaries. J. Assist. Reprod. Genet. 2020, 37, 2545–2553. [Google Scholar] [CrossRef]
  11. Dheda, K.; Huggett, J.F.; Chang, J.S.; Kima, L.U.; Bustin, S.A.; Johnson, M.A.; Rook, G.A.W.; Zumla, A. The implications of using an inappropriate reference gene for real-time reverse transcription PCR data normalization. Anal. Biochem. 2005, 344, 141–143. [Google Scholar] [CrossRef] [PubMed]
  12. Ruan, W.; Lai, M. Actin, a reliable marker of internal control? Clin. Chim. Acta 2007, 385, 1–5. [Google Scholar] [CrossRef]
  13. Caradec, J.; Sirab, N.; Keumeugni, C.; Moutereau, S.; Chimingqi, M.; Matar, C.; Revaud, D.; Bah, M.; Manivet, P.; Conti, M.; et al. Desperate house genes’: The dramatic example of hypoxia. Br. J. Cancer 2010, 102, 1037–1043. [Google Scholar] [CrossRef] [Green Version]
  14. Caradec, J.; Sirab, N.; Revaud, D.; Keumeugni, C.; Loric, S. Is GAPDH a relevant housekeeping gene for normalisation in colorectal cancer experiments? Br. J. Cancer 2010, 103, 1475–1476. [Google Scholar] [CrossRef]
  15. Krzystek-Korpacka, M.; Hotowy, K.; Czapinska, E.; Podkowik, M.; Bania, J.; Gamian, A.; Bednarz-Misa, I. Serum availability affects expression of common house-keeping genes in colon adenocarcinoma cell lines: Implications for quantitative real-time PCR studies. Cytotechnology 2016, 68, 2503–2517. [Google Scholar] [CrossRef] [PubMed] [Green Version]
  16. Nikishin, D.A.; Filatov, M.A.; Kiseleva, M.V.; Bagaeva, T.S.; Konduktorova, V.V.; Khramova, Y.V.; Malinova, I.V.; Komarova, E.V.; Semenova, M.L. Selection of stable expressed reference genes in native and vitrified/thawed human ovarian tissue for analysis by qRT-PCR and Western blot. J. Assist. Reprod. Genet. 2018, 35, 1851–1860. [Google Scholar] [CrossRef] [PubMed]
  17. Vandesompele, J.; de Preter, K.; Pattyn, F.; Poppe, B.; Van Roy, N.; de Paepe, A.; Speleman, F. Accurate normalization of real-time quantitative RT-PCR data by geometric averaging of multiple internal control genes. Genome Biol. 2002, 3, research0034.1. [Google Scholar] [CrossRef] [Green Version]
  18. Pfaffl, M.W.; Tichopad, A.; Prgomet, C.; Neuvians, T.P. Determination of stable housekeeping genes, differentially regulated target genes and sample integrity: BestKeeper—Excel-based tool using pair-wise correlations. Biotechnol. Lett. 2004, 26, 509–515. [Google Scholar] [CrossRef]
  19. Andersen, C.L.; Jensen, J.L.; Orntoft, T.F. Normalization of real-time quantitative reverse transcription-PCR data: A model-based variance estimation approach to identify genes suited for normalization, applied to bladder and colon cancer data sets. Cancer Res. 2004, 64, 5245–5250. [Google Scholar] [CrossRef] [Green Version]
  20. Jeong, Y.J.; Choi, H.W.; Shin, H.S.; Cui, X.S.; Kim, N.H.; Gerton, G.L.; Jun, J.H. Optimization of real time RT-PCR methods for the analysis of gene expression in mouse eggs and preimplantation embryos. Mol. Reprod. Dev. 2005, 71, 284–289. [Google Scholar] [CrossRef]
  21. Yuanyuan, S.; Qin, S.; Rongrong, X.; Yujing, G.; Chengbin, P.; Jianjun, M.; Yanzhou, Y.; Xiuying, P. Reference gene selection for real-time quantitative PCR analysis on ovarian cryopreservation by vitrification in mice. J. Assist. Reprod. Genet. 2015, 32, 1277–1284. [Google Scholar] [CrossRef] [PubMed] [Green Version]
  22. Caetano, L.C.; Miranda-Furtado, C.L.; Batista, L.A.; Pitangui-Molina, C.P.; Higa, T.T.; Padovan, C.C.; Rosa-E-Silva, A. Validation of reference genes for gene expression studies in bovine oocytes and cumulus cells derived from in vitro maturation. Anim Reprod. 2019, 16, 290–296. [Google Scholar] [CrossRef] [PubMed]
  23. Cai, J.; Li, T.; Huang, B.; Cheng, H.; Ding, H.; Dong, W.; Xiao, M.; Liu, L.; Wang, Z. The use of laser microdissection in the identification of suitable reference genes for normalization of quantitative real-time PCR in human FFPE epithelial ovarian tissue samples. PLoS ONE 2014, 9, e95974. [Google Scholar] [CrossRef] [PubMed]
  24. Ofinran, O.; Bose, U.; Hay, D.; Abdul, S.; Tufatelli, C.; Khan, R. Selection of suitable reference genes for gene expression studies in normal human ovarian tissues, borderline ovarian tumours and ovarian cancer. Mol. Med. Rep. 2016, 14, 5725–5731. [Google Scholar] [CrossRef]
  25. Li, Y.L.; Ye, F.; Hu, Y.; Lu, W.G.; Xie, X. Identification of suitable reference genes for gene expression studies of human serous ovarian cancer by real-time polymerase chain reaction. Anal. Biochem. 2009, 394, 110–116. [Google Scholar] [CrossRef]
  26. Fu, J.; Bian, L.; Zhao, L.; Dong, Z.; Gao, X.; Luan, H.; Sun, Y.; Song, H. Identification of genes for normalization of quantitative real-time PCR data in ovarian tissues. Acta Biochim. Biophys. Sin. 2010, 42, 568–574. [Google Scholar] [CrossRef] [Green Version]
  27. Baddela, V.S.; Baufeld, A.; Yenuganti, V.R.; Vanselow, J.; Singh, D. Suitable housekeeping genes for normalization of transcript abundance analysis by real-time RT-PCR in cultured bovine granulosa cells during hypoxia and differential cell plating density. Reprod. Biol. Endocrinol. 2014, 46, 2941–2946. [Google Scholar] [CrossRef] [PubMed] [Green Version]
  28. Ståhlberg, A.; Håkansson, J.; Xian, X.; Semb, H.; Kubista, M. Properties of the reverse transcription reaction in mRNA quantification. Clin. Chem. 2004, 50, 509–515. [Google Scholar] [CrossRef] [Green Version]
  29. Andersen, C.Y.; Mamsen, L.S.; Kristensen, S.G. Freezing of ovarian tissue and clinical opportunities. Reproduction 2019, 158, F27–F34. [Google Scholar] [CrossRef]
  30. Pors, S.E.; Kristensen, S.G.; Nikiforov, D.; Mamsen, L.M.; Cadenas, J.; Greve, V.H.; Dueholm, M.; Andersen, C.Y. Histidine buffered media maintains pH stabile during cooled transportation of human ovarian tissue. J. Ovarian Res. 2021, 14, 116. [Google Scholar] [CrossRef]
  31. Yin, H.; Kristensen, S.G.; Jiang, H.; Rasmussen, A.; Andersen, C.Y. Survival and growth of isolated pre-antral follicles from human ovarian medulla tissue during long-term 3D culture. Hum. Reprod. 2016, 31, 1531–1539. [Google Scholar] [CrossRef] [PubMed]
Figure 1. Evaluation of gene expression stability of glyceraldehyde 3-phosphate dehydrogenase (GAPDH), beta-2-microglobulin (B2M), large ribosomal protein P0 (RPLP0), beta-actin (ACTB), and peptidylprolyl isomerase A (PPIA) by the NormFinder software in different human ovarian cells and tissues: (A) ovarian medulla tissue; (B) cumulus cells; (C) oocytes with normalized RNA concentration; (D) oocytes with non-normalized RNA concentration; (E) isolated preantral follicles (PFs) with normalized RNA concentration; and (F) isolated PFs with non-normalized RNA concentration. The genes are ranked from the least (left) to the most (right) stable. * Best combination of two genes.
Ijms 23 00886 g001
Figure 2. Evaluation of gene expression stability of GAPDH, B2M, RPLP0, ACTB, and PPIA by the NormFinder software in pieces of ovarian cortex after 24 h incubation with different serum-derived products: (A) overall results; (B) control treatment; (C) culture medium supplemented with human serum albumin (HAS); (DF), culture medium supplemented with increasing concentrations of platelet-rich plasma (PRP; (D) 5% PRP; (E) 10% PRP; and (F) 20% PRP). The genes are ranked from the least (left) to the most (right) stable. * Best combination of two genes.
Ijms 23 00886 g002
Figure 3. Experimental design. The stability of GAPDH, B2M, RPLP0, ACTB, and PPIA was analyzed in different human ovarian cells and tissues by the NormFinder software. Two experiments were performed: In experiment 1, gene expression stability of the five RGs was analyzed in human oocytes, isolated preantral follicles, cumulus cells, and ovarian medulla tissue. In experiment 2, the stability of the five RGs was assessed in pieces of ovarian cortex after 24 h of culture in vitro under different conditions. Oocytes and follicles were subdivided into two groups depending on whether the RNA concentrations before cDNA synthesis were normalized or not, i.e., half of the samples had the same RNA concentration converted into cDNA (normalized), and the other half had a different RNA concentration within each sample converted into cDNA (not-normalized). The RNA concentrations in cumulus cells, ovarian medulla tissue, and ovarian cortex were all normalized. * Culture conditions for human ovarian cortex: base medium alone (Control treatment), base medium supplemented with 5 mg/mL HSA (HSA treatment), or base medium supplemented with increasing concentrations of PRP (5% PRP, 10% PRP, and 20% PRP treatments).
Ijms 23 00886 g003
Table 1. Mean Ct values ± SD (% deviation) of the studied reference genes in each of the different samples from human ovaries.
Preantral FolliclesOocytesCumulus CellsMedulla TissueCortex Tissue
RGsNormalizedNon-NormalizedNormalizedNon-NormalizedNormalizedNormalizedNormalized
GAPDH30.1 ± 0.5 a
(1.6%)
29.7 ± 1.1 a
(3.7%)
30.0 ± 2.2 a
(7.3%)
30.4 ± 2.5 a
(8.2%)
25.6 ± 1.2 a
(4.7%)
23.6 ± 1.5 a
(6.4%)
21.6 ± 1.0 a
(4.6%)
RPLP027.7 ± 0.4 b
(1.4%)
27.6 ± 1.0 b
(3.6%)
28.2 ± 2.4 b
(8.5%)
28.7 ± 2.3 b
(8.0%)
24.1 ± 1.1 b
(4.6%)
20.9 ± 1.6 bc
(7.4%)
21.3 ± 0.7 a
(3.3%)
B2M29.2 ± 0.6 c
(2.0%)
29.3 ± 1.6 a
(5.5%)
31.3 ± 3.3 c
(10.5%)
33.1 ± 3.1 c
(9.4%)
26.3 ± 1.3 a
(4.9%)
21.6 ± 1.6 c
(7.4%)
25.6 ± 2.5 b
(9.8%)
ACTB26.7 ± 0.8 d
(3.0%)
26.7 ± 1.5 c
(5.6%)
26.9 ± 2.2 d
(8.2%)
28.1 ± 2.4 b
(8.5%)
22.5 ± 1.1 c
(4.9%)
20.6 ± 1.3 b
(6.3%)
23.4 ± 0.7 a
(3.0%)
PPIA34.1 ± 0.4 e
(1.2%)
33.5 ± 0.8 d
(2.4%)
32.7 ± 1.6 e
(4.9%)
33.3 ± 1.7 c
(5.1%)
29.4 ± 1.5 d
(5.1%)
27.1 ± 1.7 d
(6.3%)
21.2 ± 1.4 c
(6.6%)
RGs: Reference genes. Normalized: The RNA concentration was adjusted—All samples contained the same RNA concentration within a sample type. Non-normalized: The RNA concentration was not adjusted—All samples contained different RNA concentrations within a sample type. Comparison of the Ct-values for different genes was carried out using a linear mixed model with Ct as outcome, gene as explanatory variable, and patient as random effect when the samples were not pooled. The linear model results in a Wald test. Log transformation of data was used when not normal distributed. Within a column, different lowercase letter (a–e) indicates p ≤ 0.006.
Table 2. Candidate reference genes used in the study.
Gene SymbolGene NameTaqMan Probe
GAPDHGlyceraldehyde 3-phosphate dehydrogenaseHs02786624_g1
ACTBBeta-actinHs01060665_g1
RPLP0Large ribosomal protein P0Hs00420895_gH
B2MBeta-2-microglobulinHs00187842_m1
PPIAPeptidylprolyl isomerase AHs04194521_s1
Publisher’s Note: MDPI stays neutral with regard to jurisdictional claims in published maps and institutional affiliations.

