
Excited States Computation of Models of Phenylalanine Protein Chains: TD-DFT and Composite CC2/TD-DFT Protocols

 and
and
Abstract
:
1. Introduction
2. Results and Discussion
2.1. Selection of the Functional in TD-DFT Calculations
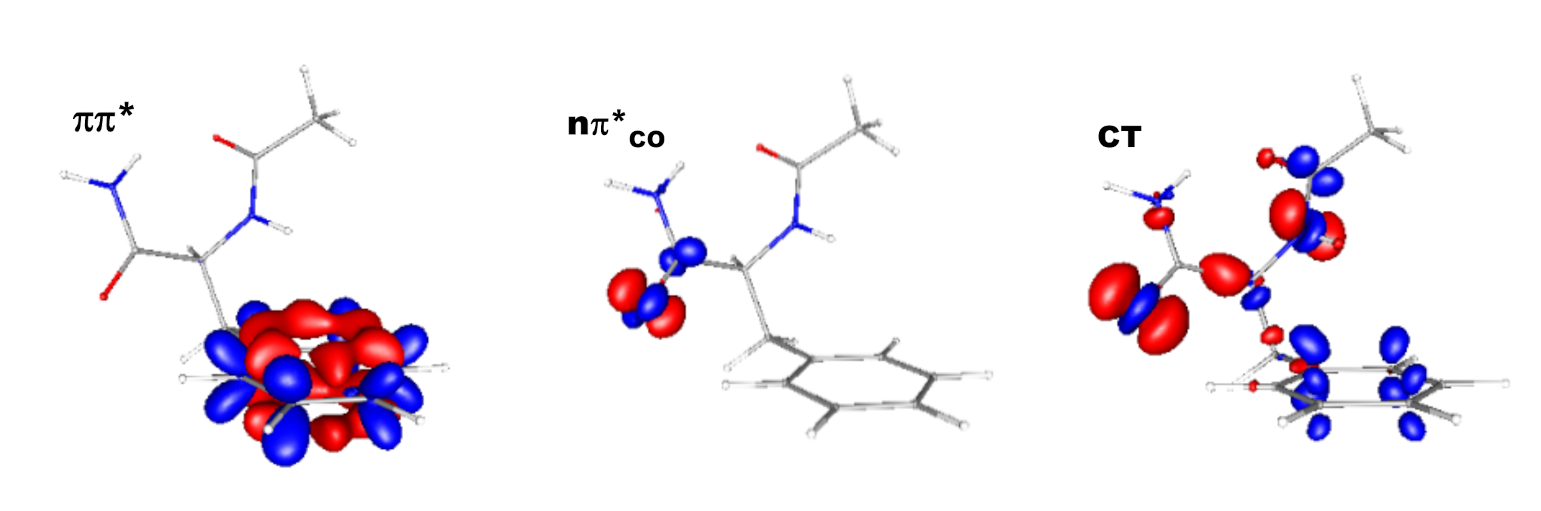
2.1.1. Nature and Vertical Excitation Energies for the Five Lowest Excited States of Fa Conformers
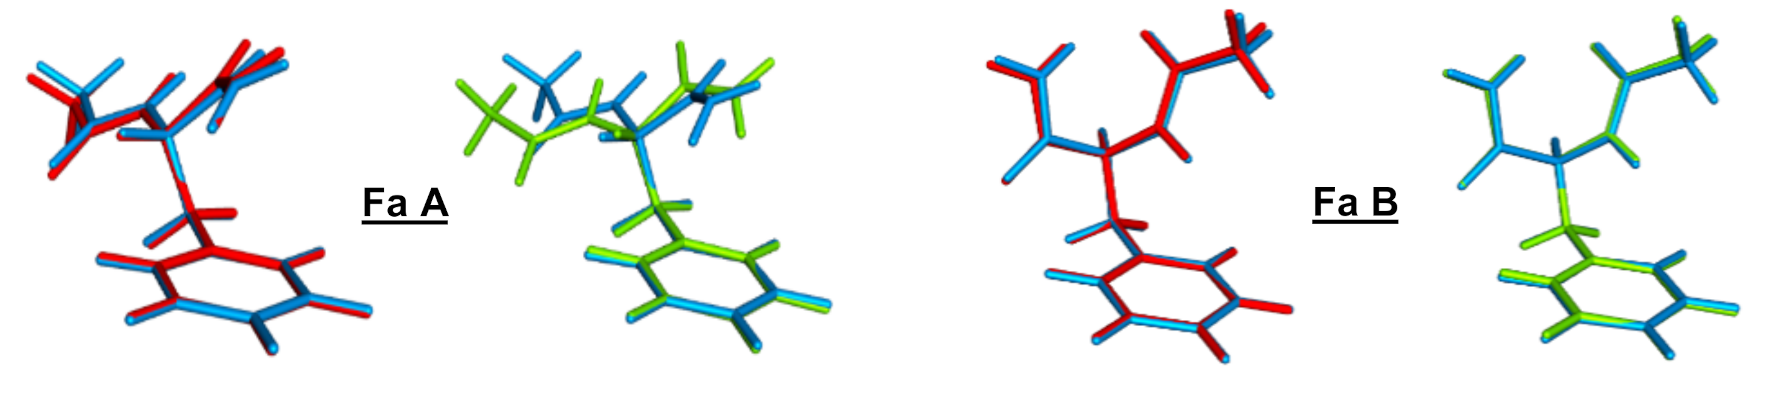
2.1.2. Geometry Optimization of the Lowest Singlet ππ*, IR Signature, and 0–0 Excitation Energy
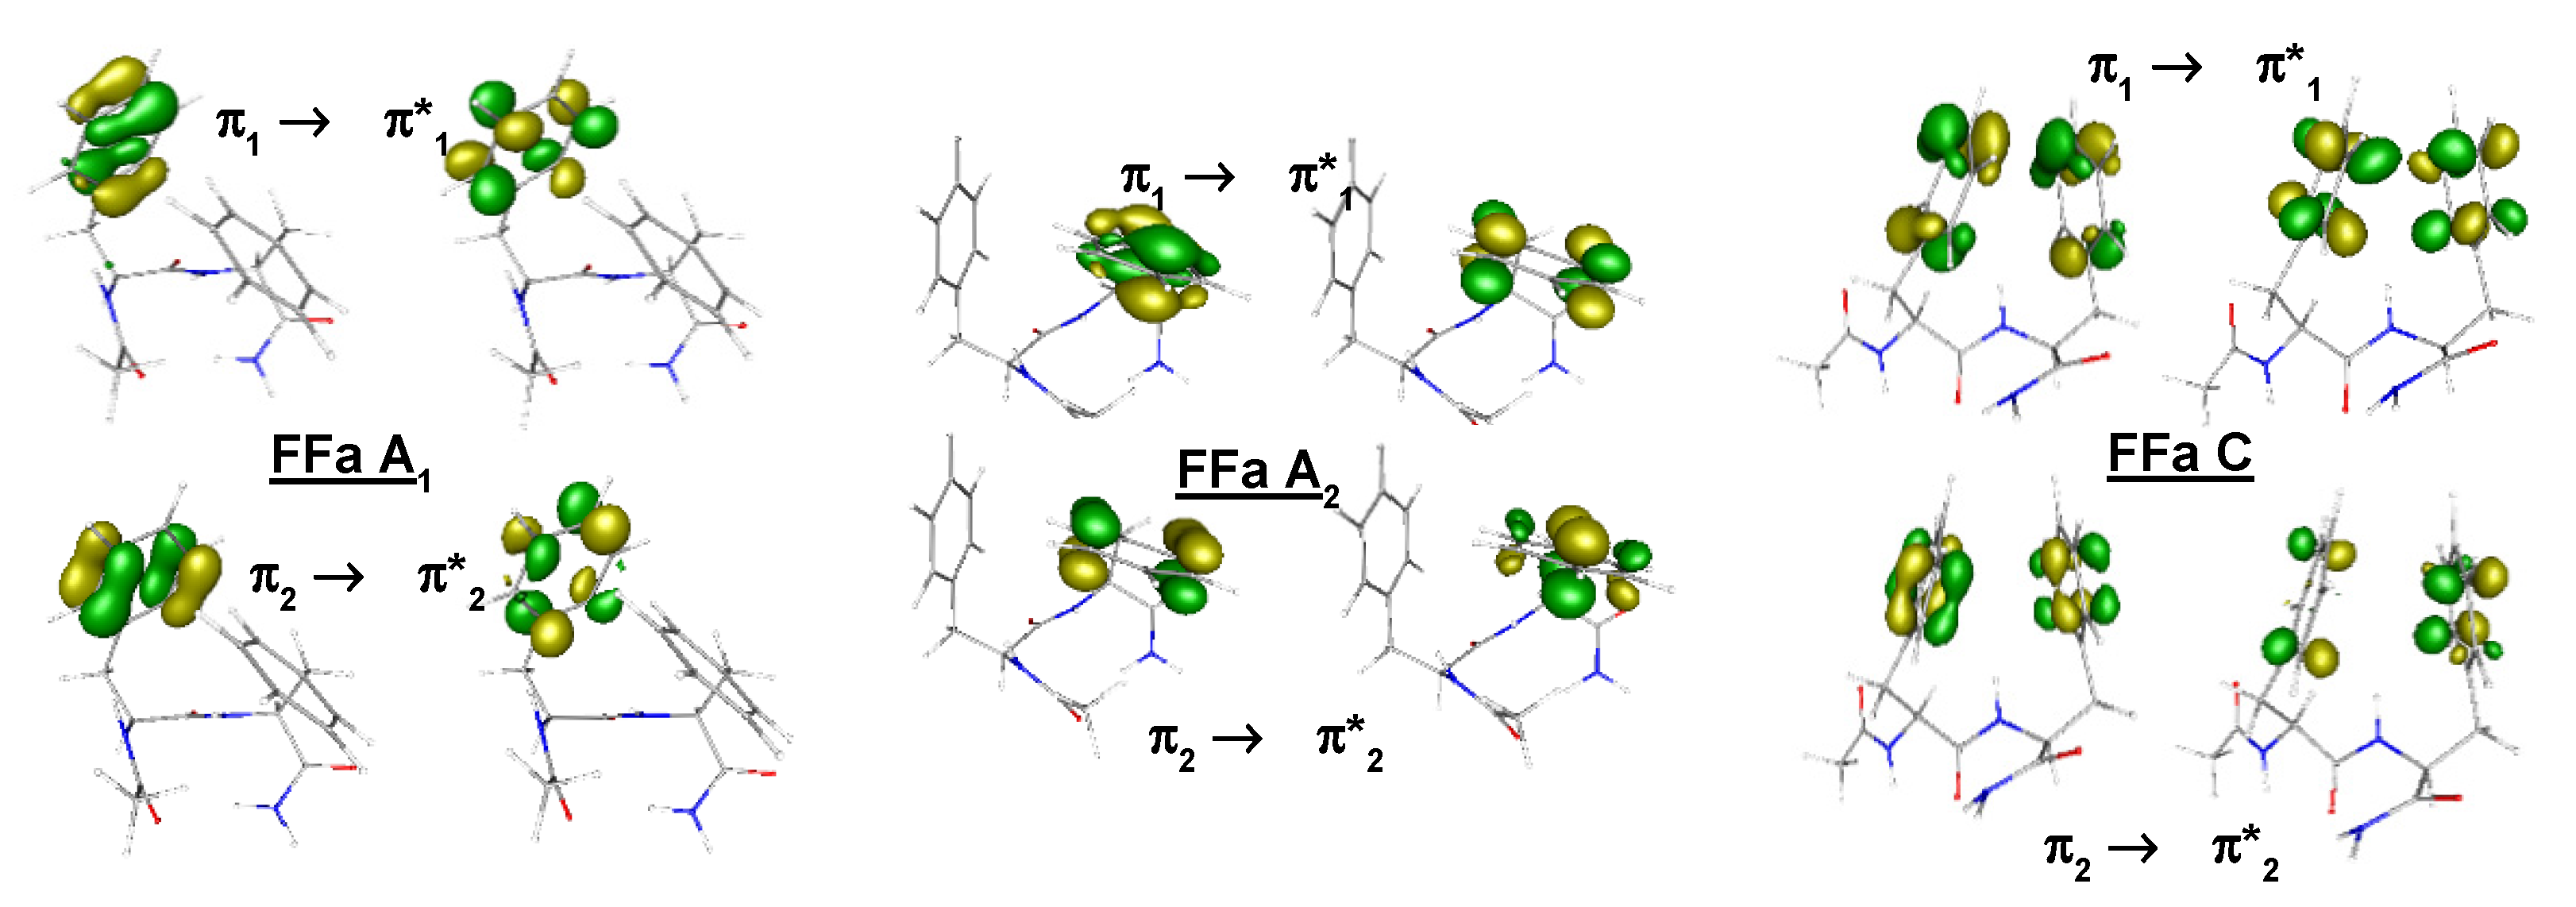
2.2. 0–0 Excitation Energies and IR Signature of the ππ* for the Series of Capped Peptides
2.3. Composite Protocols CC2-DFT/TDDFT and 0–0 Excitation Energies Calculations
3. Methods
3.1. Benchmark Set Composition
3.2. DFT/TD-DFT Calculations
3.3. Composite CC2/DFT-TDDFT Protocols for 0-0 Excitation Energies
3.4. Characterization of the Excited States
4. Conclusions
Supplementary Materials
Author Contributions
Funding
Institutional Review Board Statement
Informed Consent Statement
Data Availability Statement
Conflicts of Interest
References
- El-Khoury, P.Z.; Scharpio, I.; Huntress, M.; Melaccio, F.; Gozen, S.; Frutos, L.M.; Olivucci, M. Computational Photochemistry and Photobiology. In CRC Handbook of Organic Photochistry and Photobiology, 3rd ed.; CRC Press: Boca Raton, FL, USA, 2012; Volume 2, pp. 1029–1056. [Google Scholar]
- Worth, G.A.; Cederbaum, L.S. Beyond Born-Oppenheimer: Molecular dynamics through a conical intersection. Annu. Rev. Phys. Chem. 2004, 55, 127–158. [Google Scholar] [CrossRef] [PubMed] [Green Version]
- Levine, B.G.; Martinez, T.J. Isomerization through conical intersections. Annu. Rev. Phys. Chem. 2007, 58, 613–634. [Google Scholar] [CrossRef] [PubMed]
- Domcke, W.; Yarkony, D.R. Role of Conical Intersections in Molecular Spectroscopy and Photoinduced Chemical Dynamics. Annu. Rev. Phys. Chem. 2012, 63, 325–352. [Google Scholar] [CrossRef] [PubMed]
- Yarkony, D.R. Nonadiabatic Quantum Chemistry-Past, Present, and Future. Chem. Rev. 2012, 112, 481–498. [Google Scholar] [CrossRef]
- Runge, E.; Gross, E.K.U. Density-functional theory for time-dependent systems. Phys. Rev. Lett. 1984, 52, 997–1000. [Google Scholar] [CrossRef]
- Marques, M.A.L.; Gross, E.K.U. Time-dependent density functional theory. Annu. Rev. Phys. Chem. 2004, 55, 427–455. [Google Scholar] [CrossRef] [Green Version]
- Dreuw, A.; Head-Gordon, M. Single-reference ab initio methods for the calculation of excited states of large molecules. Chem. Rev. 2005, 105, 4009–4037. [Google Scholar] [CrossRef]
- Casida, M.E.; Huix-Rotllant, M. Progress in Time-Dependent Density-Functional Theory. Annu. Rev. Phys. Chem. 2012, 63, 287–323. [Google Scholar] [CrossRef] [Green Version]
- Maitra, N.T. Perspective: Fundamental aspects of time-dependent density functional theory. J. Chem. Phys. 2016, 144, 220901. [Google Scholar] [CrossRef]
- Tawada, Y.; Tsuneda, T.; Yanagisawa, S.; Yanai, T.; Hirao, K. A long-range-corrected time-dependent density functional theory. J. Chem. Phys. 2004, 120, 8425–8433. [Google Scholar] [CrossRef]
- Malis, M.; Loquais, Y.; Gloaguen, E.; Biswal, H.S.; Piuzzi, F.; Tardivel, B.; Brenner, V.; Broquier, M.; Jouvet, C.; Mons, M.; et al. Unraveling the Mechanisms of Nonradiative Deactivation in Model Peptides Following Photoexcitation of a Phenylalanine Residue. J. Am. Chem. Soc. 2012, 134, 20340–20351. [Google Scholar] [CrossRef]
- Malis, M.; Loquais, Y.; Gloaguen, E.; Jouvet, C.; Brenner, V.; Mons, M.; Ljubic, I.; Doslic, N. Non-radiative relaxation of UV photoexcited phenylalanine residues: Probing the role of conical intersections by chemical substitution. Phys. Chem. Chem. Phys. 2014, 16, 2285–2288. [Google Scholar] [CrossRef]
- Loquais, Y.; Gloaguen, E.; Alauddin, M.; Brenner, V.; Tardivel, B.; Mons, M. On the near UV photophysics of a phenylalanine residue: Conformation-dependent pi pi* state deactivation revealed by laser spectroscopy of isolated neutral dipeptides. Phys. Chem. Chem. Phys. 2014, 16, 22192–22200. [Google Scholar] [CrossRef]
- Loquais, Y.; Gloaguen, E.; Habka, S.; Vaquero-Vara, V.; Brenner, V.; Tardivel, B.; Mons, M. Secondary Structures in Phe-Containing Isolated Dipeptide Chains: Laser Spectroscopy vs Quantum Chemistry. J. Phys. Chem. A 2015, 119, 5932–5941. [Google Scholar] [CrossRef]
- Sohn, W.Y.; Brenner, V.; Gloaguen, E.; Mons, M. Local NH-pi interactions involving aromatic residues of proteins: Influence of backbone conformation and pi pi* excitation on the pi H-bond strength, as revealed from studies of isolated model peptides. Phys. Chem. Chem. Phys. 2016, 18, 29969–29978. [Google Scholar] [CrossRef]
- Ben Amor, N.; Hoyau, S.; Maynau, D.; Brenner, V. Low-Lying excited states of model proteins: Performances of the CC2 method versus muitlreference methods. J. Chem. Phys. 2018, 148, 184105. [Google Scholar] [CrossRef]
- Dupuy, M.-S.; Gloaguen, E.; Tardivel, B.; Mons, M.; Brenner, V. CC2 Benchmark for Models of Phenylalanine Protein Chains: 0–0 Transition Energies and IR Signatures of the ππ* Excited State. J. Chem. Theory Comput. 2020, 16, 601–611. [Google Scholar] [CrossRef]
- Brenner, V.; Very, T.; Schmidt, M.; Gordon, M.; Hoyau, S.; Ben Amor, N. Model protein excited states: MRCI calculations with large active spaces vs CC2 method. J. Chem. Phys. 2021, 154, 214105. [Google Scholar] [CrossRef]
- Serrano-Andres, L.; Fulscher, M.P. Theoretical study of the electronic spectroscopy of peptides. III. Charge-transfer transitions in polypeptides. J. Am. Chem. Soc. 1998, 120, 10912–10920. [Google Scholar] [CrossRef]
- Christiansen, O.; Koch, H.; Jorgensen, P. The 2nd-order approximate coupled-cluster singles and doubles model CC2. Chem. Phys. Lett. 1995, 243, 409–418. [Google Scholar] [CrossRef]
- Hattig, C.; Weigend, F. CC2 excitation energy calculations on large molecules using the resolution of the identity approximation. J. Chem. Phys. 2000, 113, 5154–5161. [Google Scholar] [CrossRef]
- Hattig, C.; Kohn, A. Transition moments and excited-state first-order properties in the coupled-cluster model CC2 using the resolution-of-the-identity approximation. J. Chem. Phys. 2002, 117, 6939–6951. [Google Scholar] [CrossRef]
- Hattig, C. Geometry optimizations with the coupled-cluster model CC2 using the resolution-of-the-identity approximation. J. Chem. Phys. 2003, 118, 7751–7761. [Google Scholar] [CrossRef]
- Kohn, A.; Hattig, C. Analytic gradients for excited states in the coupled-cluster model CC2 employing the resolution-of-the-identity approximation. J. Chem. Phys. 2003, 119, 5021–5036. [Google Scholar] [CrossRef]
- Bories, B.; Maynau, D.; Bonnet, M.L. Selected excitation for CAS-SDCI calculations. J. Comput. Chem. 2007, 28, 632–643. [Google Scholar] [CrossRef]
- Ben Amor, N.; Bessac, F.; Hoyau, S.; Maynau, D. Direct selected multireference configuration interaction calculations for large systems using localized orbitals. J. Chem. Phys. 2011, 135, 014101. [Google Scholar] [CrossRef]
- Vydrov, O.A.; Scuseria, G.E.; Perdew, J.P. Tests of functionals for systems with fractional electron number. J. Chem. Phys. 2007, 126, 154109. [Google Scholar] [CrossRef]
- Yanai, T.; Tew, D.P.; Handy, N.C. A new hybrid exchange-correlation functional using the Coulomb-attenuating method (CAM-B3LYP). Chem. Phys. Lett. 2004, 393, 51–57. [Google Scholar] [CrossRef] [Green Version]
- Chai, J.D.; Head-Gordon, M. Long-range corrected hybrid density functionals with damped atom-atom dispersion corrections. Phys. Chem. Chem. Phys. 2008, 10, 6615–6620. [Google Scholar] [CrossRef] [PubMed] [Green Version]
- Maitra, N.T. Charge transfer in time-dependent density functional theory. J. Phys.-Condens. Matter 2017, 29, 423001. [Google Scholar] [CrossRef] [PubMed]
- Winter, N.O.C.; Graf, N.K.; Leutwyler, S.; Hattig, C. Benchmarks for 0-0 transitions of aromatic organic molecules: DFT/B3LYP, ADC(2), CC2, SOS-CC2 and SCS-CC2 compared to high-resolution gas-phase data. Phys. Chem. Chem. Phys. 2013, 15, 6623–6630. [Google Scholar] [CrossRef] [PubMed]
- Fang, C.F.; Oruganti, B.; Durbeej, B. How Method-Dependent Are Calculated Differences between Vertical, Adiabatic, and 0-0 Excitation Energies? J. Phys. Chem. A 2014, 118, 4157–4171. [Google Scholar] [CrossRef] [PubMed] [Green Version]
- Oruganti, B.; Fang, C.F.; Durbeej, B. Assessment of a composite CC2/DFT procedure for calculating 0-0 excitation energies of organic molecules. Mol. Phys. 2016, 114, 3448–3463. [Google Scholar] [CrossRef] [Green Version]
- Loos, P.F.; Jacquemin, D. Evaluating 0-0 Energies with Theoretical Tools: A Short Review. Chemphotochem 2019, 3, 684–696. [Google Scholar] [CrossRef] [Green Version]
- Chin, W.; Mons, M.; Dognon, J.P.; Piuzzi, F.; Tardivel, B.; Dimicoli, I. Competition between local conformational preferences and secondary structures in gas-phase model tripeptides as revealed by laser spectroscopy and theoretical chemistry. Phys. Chem. Chem. Phys. 2004, 6, 2700–2709. [Google Scholar] [CrossRef]
- Wang, J.; Durbeej, B. How accurate are TD-DFT excited-state geometries compared to DFT ground-state geometries? J. Comput. Chem. 2020, 41, 1718–1729. [Google Scholar] [CrossRef]
- Alaudin, M.; Vaquero-Vara, V.; Habka, S.; Tardivel, B.; Gloaguen, E.; Mons, M. unpublished resutls.
- Gloaguen, E.; Loquais, Y.; Thomas, J.A.; Pratt, D.W.; Mons, M. Spontaneous Formation of Hydrophobic Domains in Isolated Peptides. J. Phys. Chem. B 2013, 117, 4945–4955. [Google Scholar] [CrossRef]
- Vaquero-Vara, V.; Sohn, W.Y.; Tardivel, B.; Brenner, V.; Gloaguen, E.; Mons, M. in preparation.
- Gaussian, D.R.; Frisch, M.J.; Trucks, G.W.; Schlegel, H.B.; Scuseria, G.E.; Robb, M.A.; Cheeseman, J.R.; Scalmani, G.; Barone, V.; Petersson, G.A.; et al. Gaussian, Inc.: Wallingford, CT, USA, 2016.
- Dunning, T.H. Gaussian-basis sets for use in correlated molecular calculations.1. The atoms boron through neon and hydrogen. J. Chem. Phys. 1989, 90, 1007–1023. [Google Scholar] [CrossRef]
- Kendall, R.A.; Dunning, T.H.; Harrison, R.J. Electron-affinities of the 1st-row atoms revisited-systematic basis-sets and wave-functions. J. Chem. Phys. 1992, 96, 6796–6806. [Google Scholar] [CrossRef] [Green Version]
- TURBOMOLE v6.4-2012, v7.0-2015 & v7.2-2017, A Development of University of Karlsruhe and Forschungszentrum Karlsruhe GmbH, 1989–2007, TURBOMOLE GmbH, since 2007. Available online: http://www.turbomole.com (accessed on 12 November 2021).
- Weigend, F.; Kohn, A.; Hattig, C. Efficient use of the correlation consistent basis sets in resolution of the identity MP2 calculations. J. Chem. Phys. 2002, 116, 3175–3183. [Google Scholar] [CrossRef]
- Janssen, C.L.; Nielsen, I.M.B. New diagnostics for coupled-cluster and Moller-Plesset perturbation theory. Chem. Phys. Lett. 1998, 290, 423–430. [Google Scholar] [CrossRef]
- Nielsen, I.M.B.; Janssen, C.L. Double-substitution-based diagnostics for coupled-cluster and Moller-Plesset perturbation theory. Chem. Phys. Lett. 1999, 310, 568–576. [Google Scholar] [CrossRef]
- NAncy-EX. Available online: http://nancyex.sourceforge.net (accessed on 13 June 2014).
- Etienne, T.; Assfeld, X.; Monari, A. Toward a Quantitative Assessment of Electronic Transitions’ Charge-Transfer Character. J. Chem. Theory Comput. 2014, 10, 3896–3905. [Google Scholar] [CrossRef]
- Etienne, T.; Assfeld, X.; Monari, A. New Insight into the Topology of Excited States through Detachment/Attachment Density Matrices-Based Centroids of Charge. J. Chem. Theory Comput. 2014, 10, 3906–3914. [Google Scholar] [CrossRef]


| Fa B | Evert [a] (eV) | Nature of the State | NTOs (%, Occupied→Virtual) [b] |
|---|---|---|---|
| S1 | 5.259 | ππ* | 1–53% 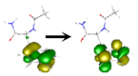 2–47% 2–47% 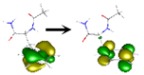 |
| S2 | 5.781 | nπ*CO(2) | 1–98%  |
| S3 | 5.905 | nπ*CO(1) | 1–99% 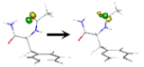 |
| S4 | 6.534 | ππ* | 1–73% 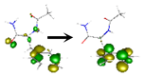 2–25% 2–25%  |
| S5 | 6.787 | n(1,2) [π*π*CO(1)] + ππ* | 1–80%  2–12% 2–12%  |
| ΔνS1/S0 (cm−1) | CC2 [17] | CAM-B3LYP | ωB97X-D | Experiment | |
|---|---|---|---|---|---|
| Fa A | NHPhe | +11/+9 | −6 | +10 | −1 |
| NH2 sym. | −15/−10 | −29 | −9 | −9 | |
| NH2 anti. | −18/−9 | −22 | −8 | −6 | |
| Fa B | NHPhe | −44/−37 | −44 | −25 | |
| NH2 sym. | −5/−4 | −5 | −6 | ||
| NH2 anti. | −1/−1 | −2 | −3 | ||
| Fa C | NHPhe | −44/−37 | −38 | −44 | −24 |
| NH2 sym. | −3/−1 | −8 | −2 | −1 | |
| NH2 anti. | −1/−1 | −1 | +2 | −1 | |
| Fa D | NHPhe. | 0/0 | −1 | −1 | |
| NH2 sym. | −2/−2 | 0 | −7 | ||
| NH2 anti | 0 | 9 | −1 |
| ΔEadia (eV) | Fa A | Fa B | Fa C | Fa D |
|---|---|---|---|---|
| CC2/aug(N,O,π)-cc-pVDZ//CC2/cc-pVDZ [17] | 4.754 | 4.770 | 4.767 | 4.791 |
| CAM-B3LYP/aug(N,O,π)-cc-pVDZ//CAM-B3LYP/cc-pVDZ | 5.168 | 5.167 | 5.142 | 5.192 |
| ωB97XD/aug(N,O,π)-cc-pVTZ//ωB97XD/cc-pVDZ | 5.140 | 5.161 | 5.160 | 5.174 |
| Experiment [a] | 4.650 | 4.663 | 4.653 | 4.666 |
| Calculation Systems | MAE | ME | MAE | ME | |
|---|---|---|---|---|---|
| Level | CC2 | CC2 | Exp. | Exp. | |
| DFT/TD-DFT | Fa A-D | 0.40 | +0.40 | 0.50 | +0.50 |
| DFT/TD-DFT | Bs | 0.39 | +0.35 | 0.50 | +0.43 |
| P1 | Bs | 0.15 | +0.14 | 0.33 | +0.22 |
| P2 | Bs | 0.03 | +0.02 | 0.14 | +0.11 |
| ΔEadia (eV) | GFa A | GFa B’ | FFa A1 | FFa A2 | FFa C | QFa A | QFa C |
|---|---|---|---|---|---|---|---|
| CC2 | |||||||
| aug(N,O,π)-cc-pVDZ// | |||||||
| cc-pVDZ [17] | 4.754 | 4.771 | 4.714 | 4.729 | 4.479 | 4.803 | 4.793 |
| ωB97XD | |||||||
| aug(N,O,π)-cc-pVTZ// | |||||||
| cc-pVDZ | 5.178 | 5.178 | 5.154 | 5.149 | 4.219 | 5.207 | 5.162 |
| Experiment [a] | 4.648 | 4.644 | 4.648 | 4.658 | 4.630 | 4.662 | 4.658 |
| ΔνS1/S0 (cm−1) | CC2 [17] | ωB97X-D | Experiment | |
|---|---|---|---|---|
| GFa A | NHGly | −7/−6 | −2/−2 | −2 |
| NHPhe | −18/−15 | −10 */−9 | −18 | |
| NH2 sym. | −5/−3 | +3 */+2 | +3 | |
| NH2 anti. | 0/0 | +1/+1 | −9 | |
| GFa B’ | NHGly | 0/0 | −1/−1 | +1 |
| NHPhe | −21/−18 | −4/−4 | −18 | |
| NH2 sym. | +1/+1 | +1/+1 | +2 | |
| NH2 anti. | 0/0 | +1/+1 | +1 | |
| FFa A1 | NHPhe1 | −41/−35 | −40/−36 | −33 |
| NHPhe2 | −9/−8 | −7/−6 | 0 | |
| NH2 sym. | −4/−3 | +3/+2 | −1 | |
| NH2 anti. | −2/−1 | 0/0 | 0 | |
| FFa A2 | NHPhe1 | −5/−4 | −6 */−5 | −1 |
| NHPhe2 | −34/−29 | −21 */−19 | −24 | |
| NH2 sym. | −2/−1 | +3/+2 | −1 | |
| NH2 anti. | −1/−1 | 0/0 | 0 | |
| FFa C | NHPhe1 | −12/−10 | −9/−8 | |
| NHPhe2 | −74/−63 | −60 */−55 | ||
| NH2 sym. | −30/−21 | −21 */−15 | ||
| NH2 anti. | −11/−6 | −7/−6 | ||
| QFa A | NHGln | −2/−2 | −6/−5 | |
| NHPhe | −12/−10 | −22/−20 | ||
| NH2 sym./C-term | +5/+3 | −2/−1 | ||
| NH2 anti./C-term | +8/+4 | 0/0 | ||
| NH2 sym./cChain | −2/−1 | 0/0 | ||
| NH2 anti./Chain | −2/−1 | 0/0 | ||
| QFa C | NHGln | −9/−8 | −9/−8 | |
| NHPhe | −16/−14 | −32/−29 | ||
| NH2 sym./C-term | −2/−1 | −2/−1 | ||
| NH2 anti./C-term | 0/0 | 0/0 | ||
| NH2 sym./cChain | −1/−1 | −2/−1 | ||
| NH2 anti./Chain | +1/+1 | +3/+2 |
| ΔEadia (eV) | CC2 [17] | DFT/TD-DFT ωB97XD | P1 | P2 | Experiment [a] |
|---|---|---|---|---|---|
| Fa A | 4.754 | 5.140 | 4.953 | 4.778 | 4.650 |
| Fa B | 4.770 | 5.161 | 4.972 | 4.798 | 4.663 |
| Fa C | 4.767 | 5.160 | 4.971 | 4.793 | 4.663 |
| Fa D | 4.791 | 5.174 | 4.983 | 4.809 | 4.666 |
| GFa A | 4.754 | 5.178 | 4.867 | 4.814 | 4.648 |
| GFa B’ | 4.771 | 5.178 | 4.979 | 4.802 | 4.644 |
| FFa A1 | 4.714 | 5.154 | 4.962 | 4.771 | 4.648 |
| FFa A2 | 4.729 | 5.149 | 4.954 | 4.773 | 4.658 |
| FFa C | 4.479 | 4.219 | 4.023 | 4.451 | 4.630 |
| QFa A | 4.803 | 5.207 | 5.014 | 4.825 | 4.662 |
| QFa C | 4.793 | 5.162 | 4.965 | 4.779 | 4.658 |
Publisher’s Note: MDPI stays neutral with regard to jurisdictional claims in published maps and institutional affiliations. |
© 2022 by the authors. Licensee MDPI, Basel, Switzerland. This article is an open access article distributed under the terms and conditions of the Creative Commons Attribution (CC BY) license (https://creativecommons.org/licenses/by/4.0/).
Share and Cite
Lebel, M.; Very, T.; Gloaguen, E.; Tardivel, B.; Mons, M.; Brenner, V. Excited States Computation of Models of Phenylalanine Protein Chains: TD-DFT and Composite CC2/TD-DFT Protocols. Int. J. Mol. Sci. 2022, 23, 621. https://doi.org/10.3390/ijms23020621
Lebel M, Very T, Gloaguen E, Tardivel B, Mons M, Brenner V. Excited States Computation of Models of Phenylalanine Protein Chains: TD-DFT and Composite CC2/TD-DFT Protocols. International Journal of Molecular Sciences. 2022; 23(2):621. https://doi.org/10.3390/ijms23020621
Chicago/Turabian StyleLebel, Marine, Thibaut Very, Eric Gloaguen, Benjamin Tardivel, Michel Mons, and Valérie Brenner. 2022. "Excited States Computation of Models of Phenylalanine Protein Chains: TD-DFT and Composite CC2/TD-DFT Protocols" International Journal of Molecular Sciences 23, no. 2: 621. https://doi.org/10.3390/ijms23020621
APA StyleLebel, M., Very, T., Gloaguen, E., Tardivel, B., Mons, M., & Brenner, V. (2022). Excited States Computation of Models of Phenylalanine Protein Chains: TD-DFT and Composite CC2/TD-DFT Protocols. International Journal of Molecular Sciences, 23(2), 621. https://doi.org/10.3390/ijms23020621