
Wheat Flour-Based Edible Films: Effect of Gluten on the Rheological Properties, Structure, and Film Characteristics


 and
and 
Abstract
1. Introduction
2. Results and Discussion
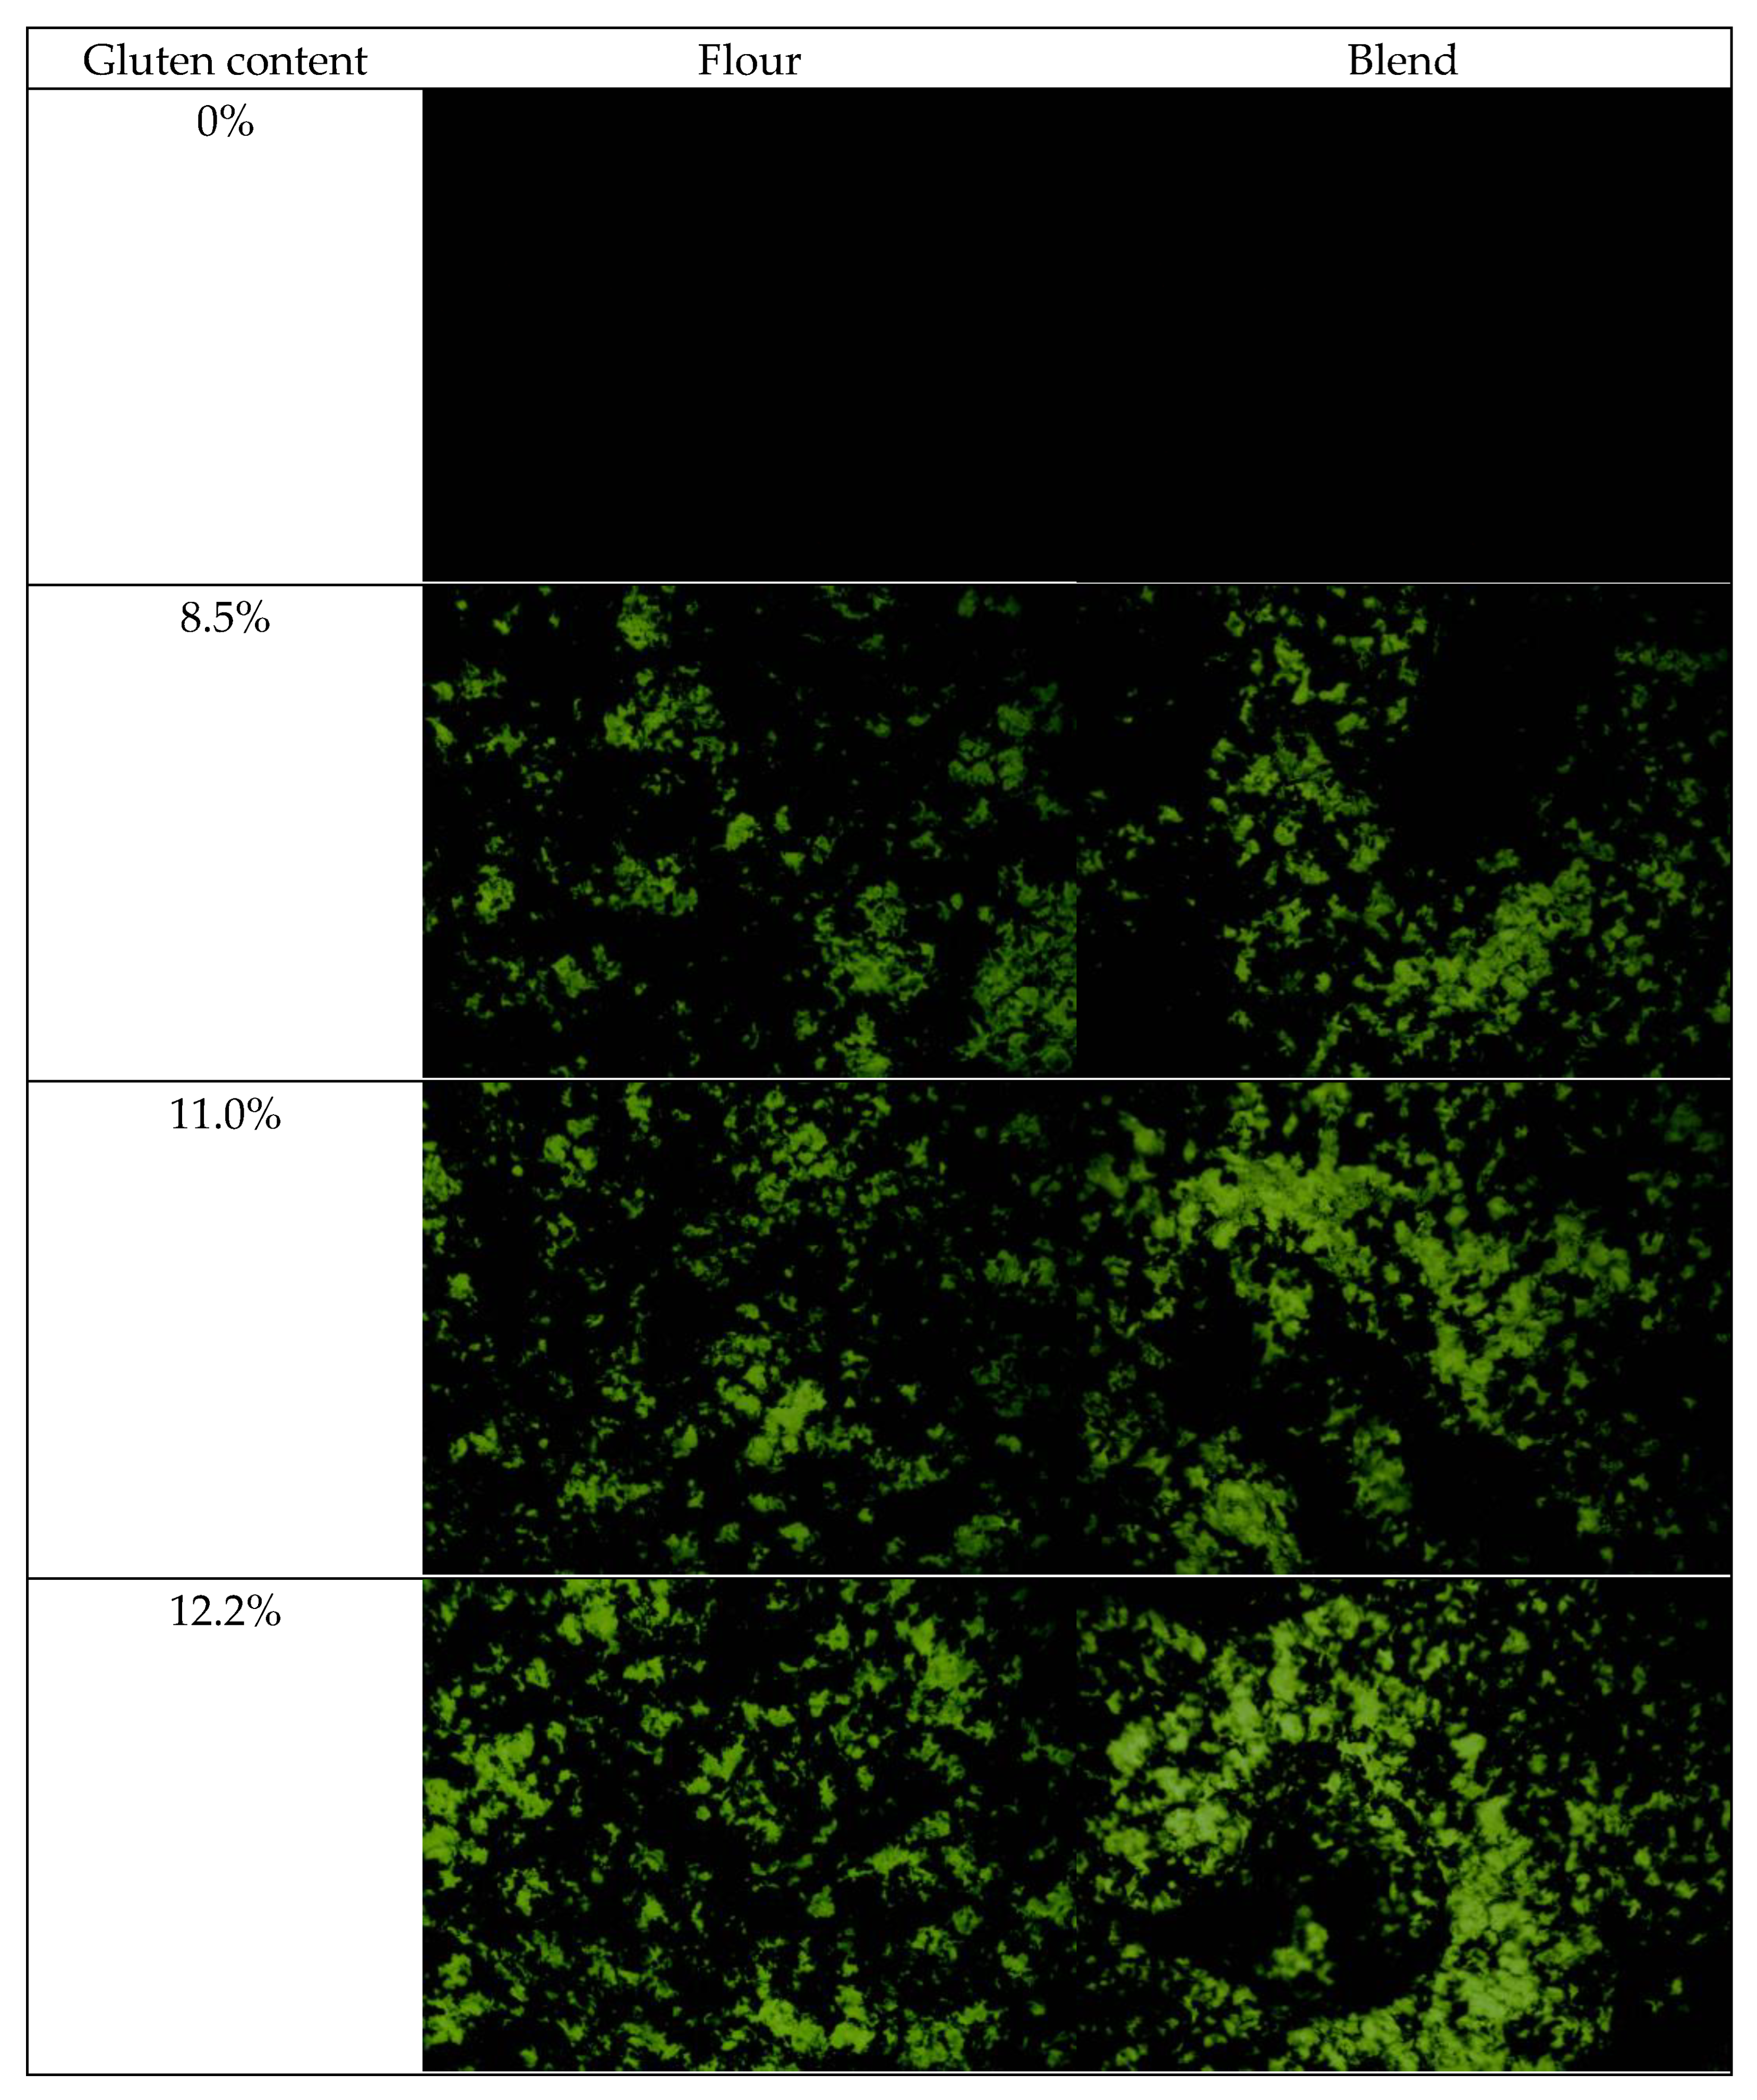
2.1. Morphology of Film-Forming Matrix System
2.2. Rheological Properties of Film-Forming Matrices
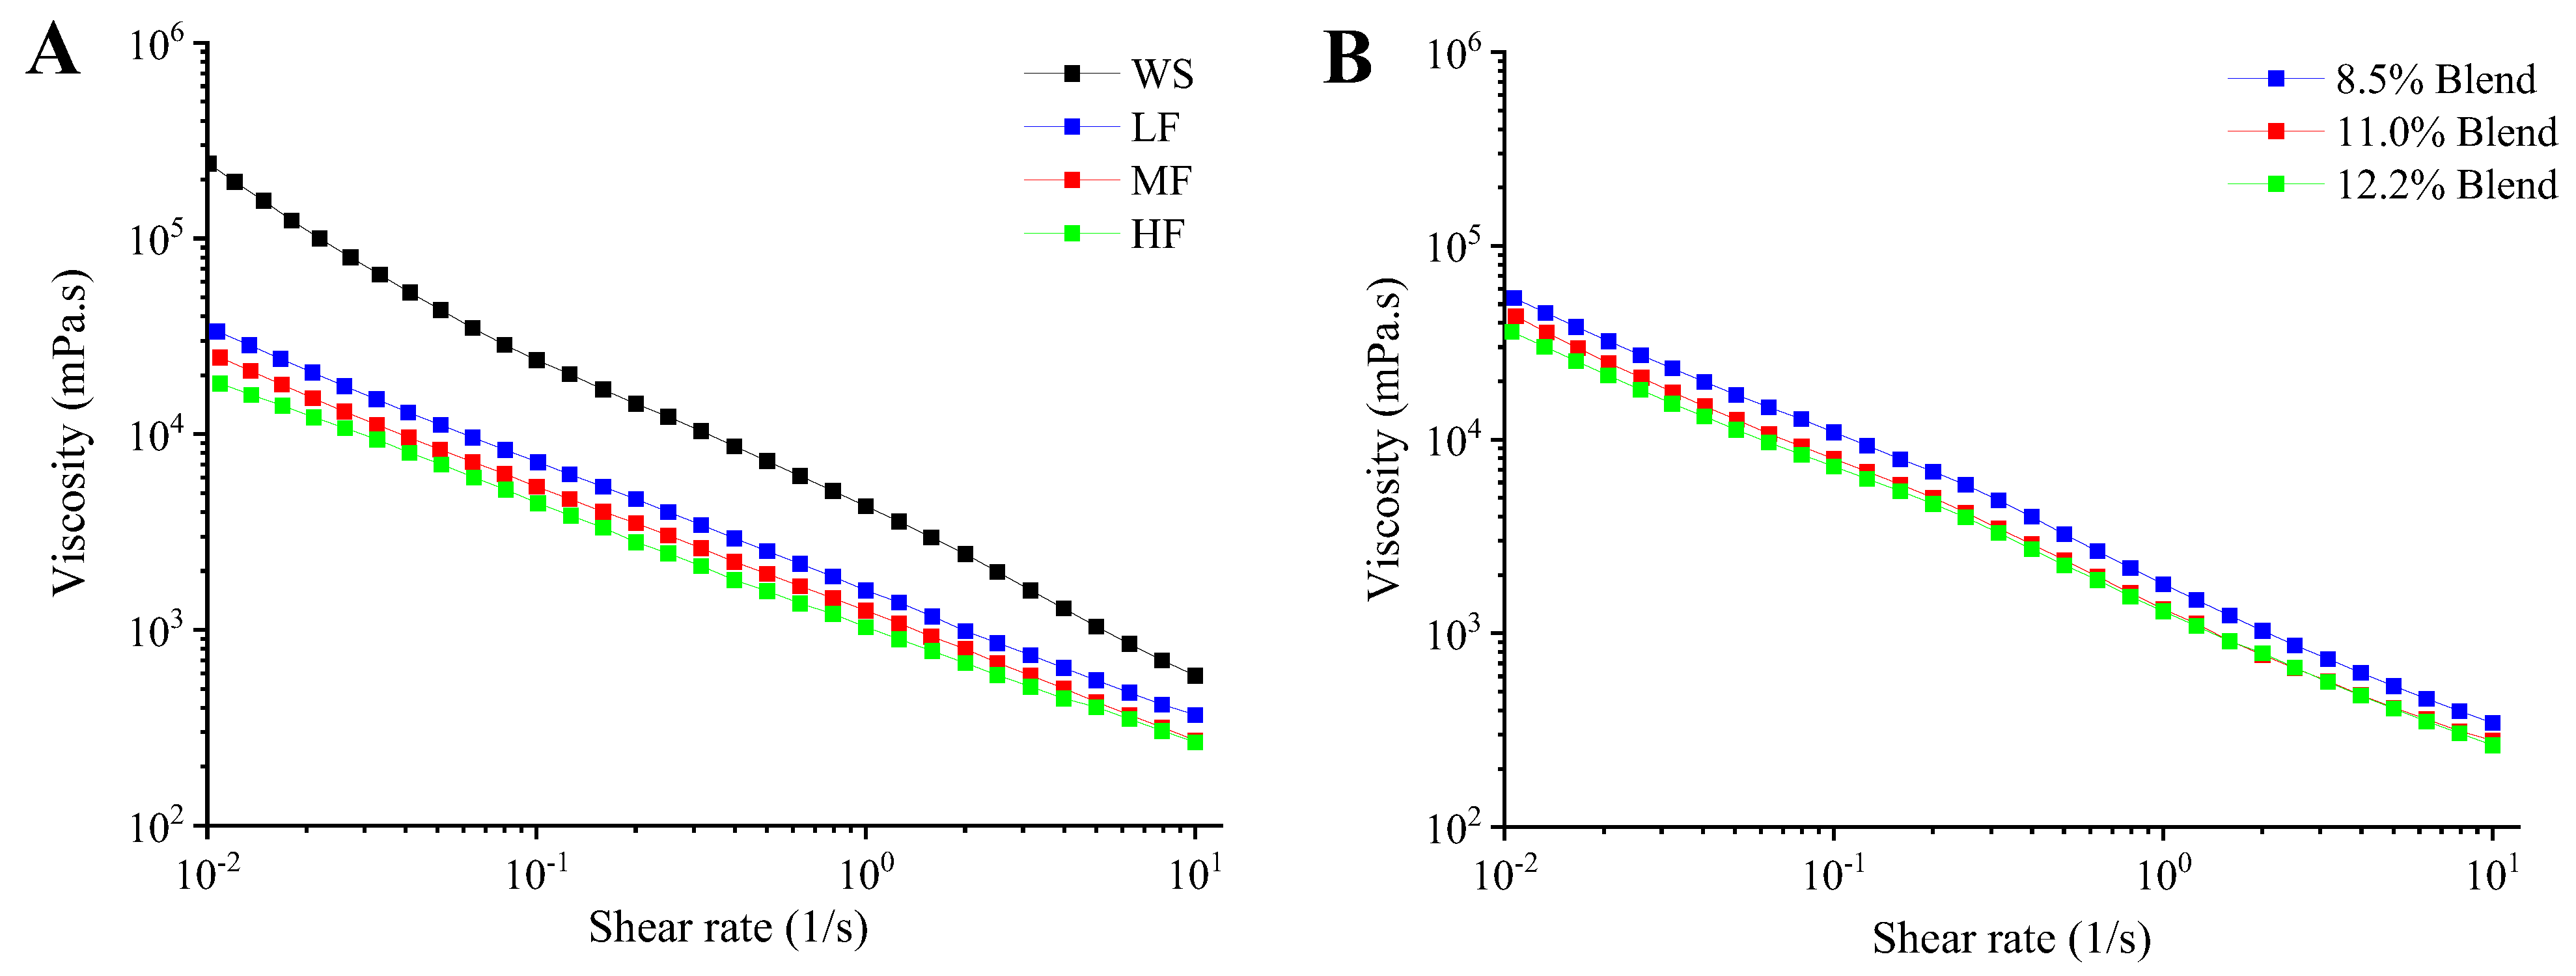
2.2.1. Steady Rheological Properties
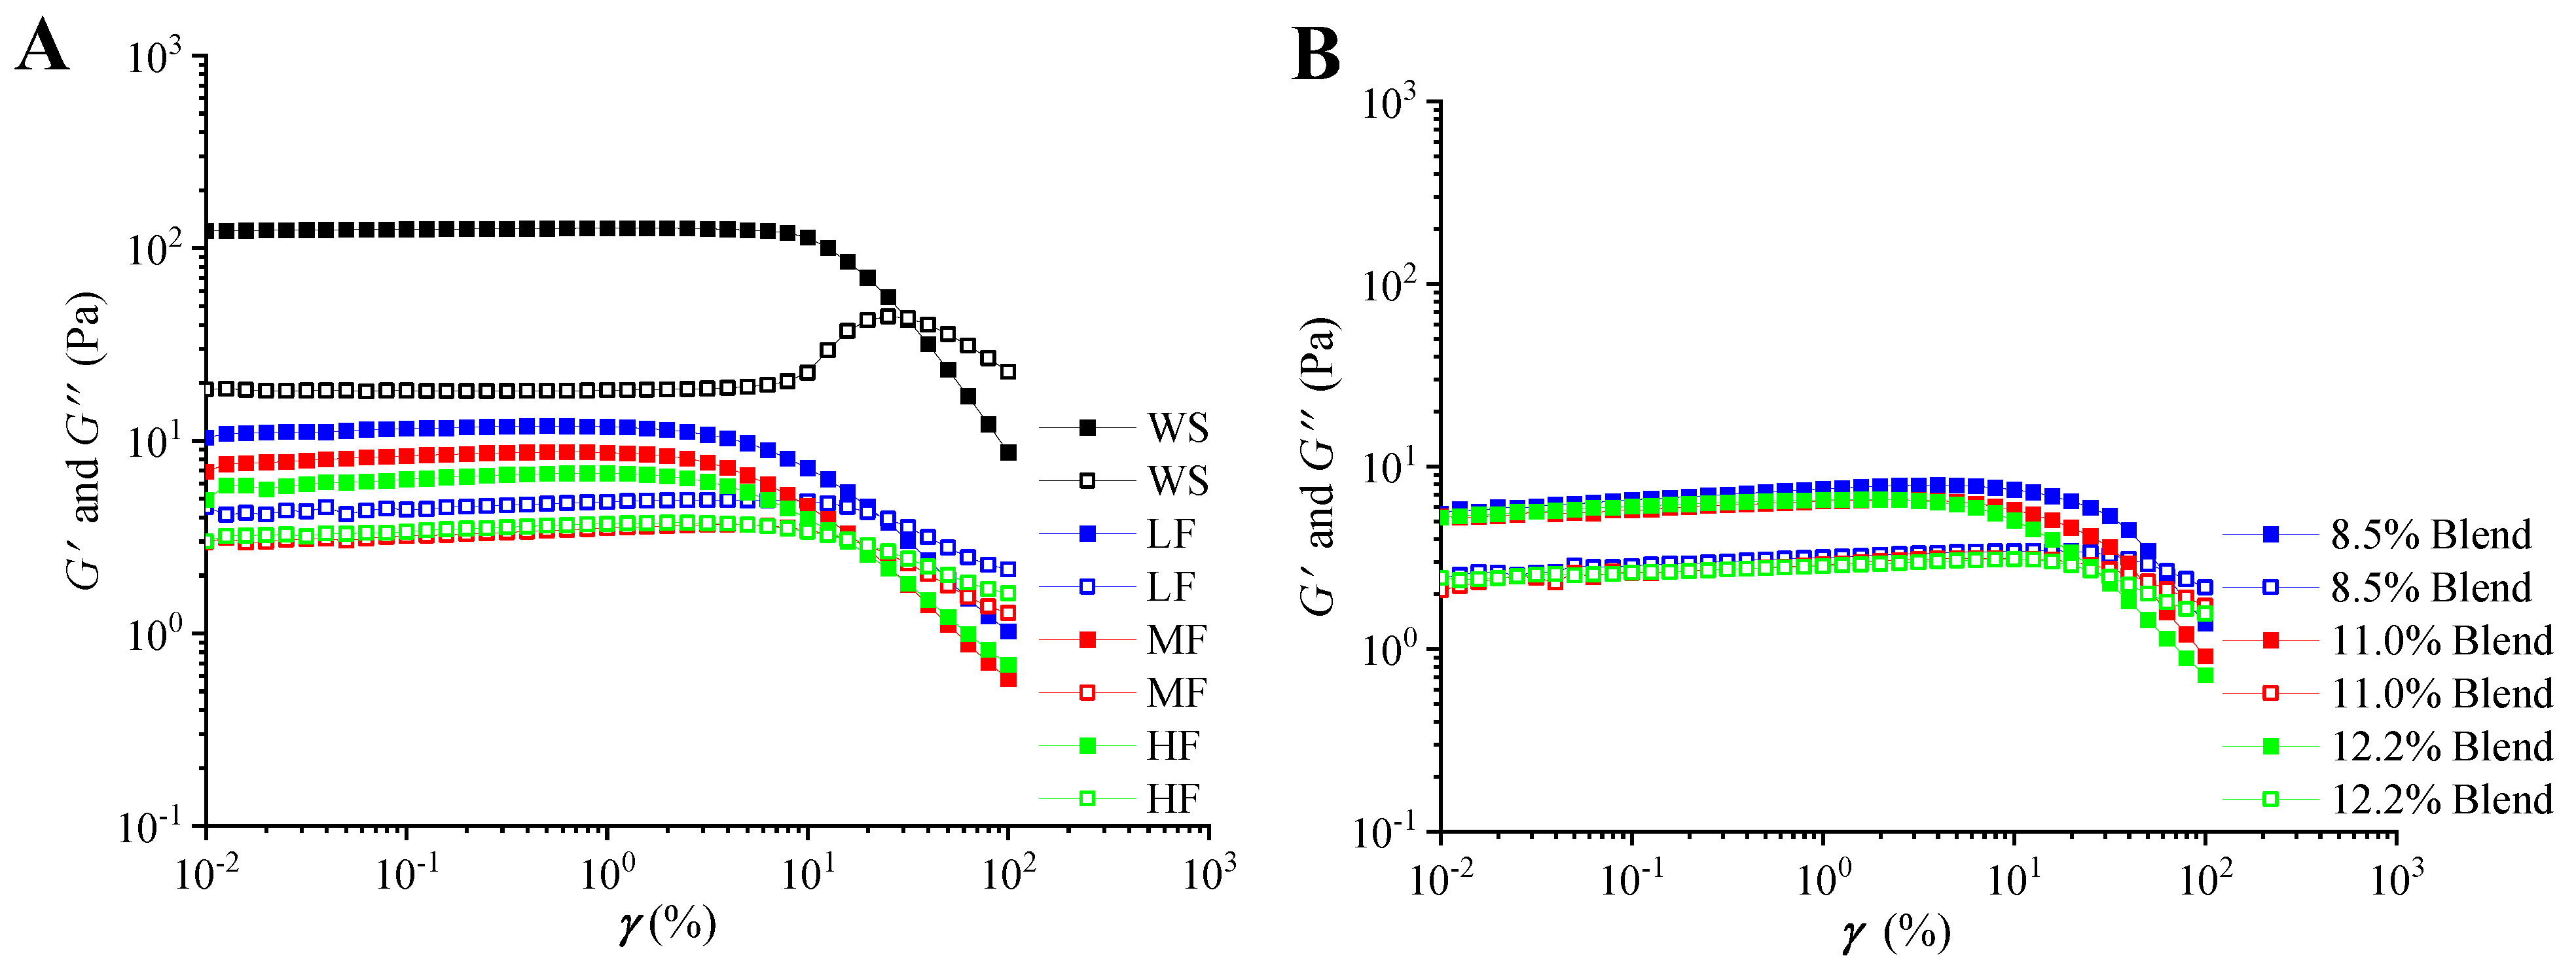
2.2.2. Linear Viscoelastic Regions
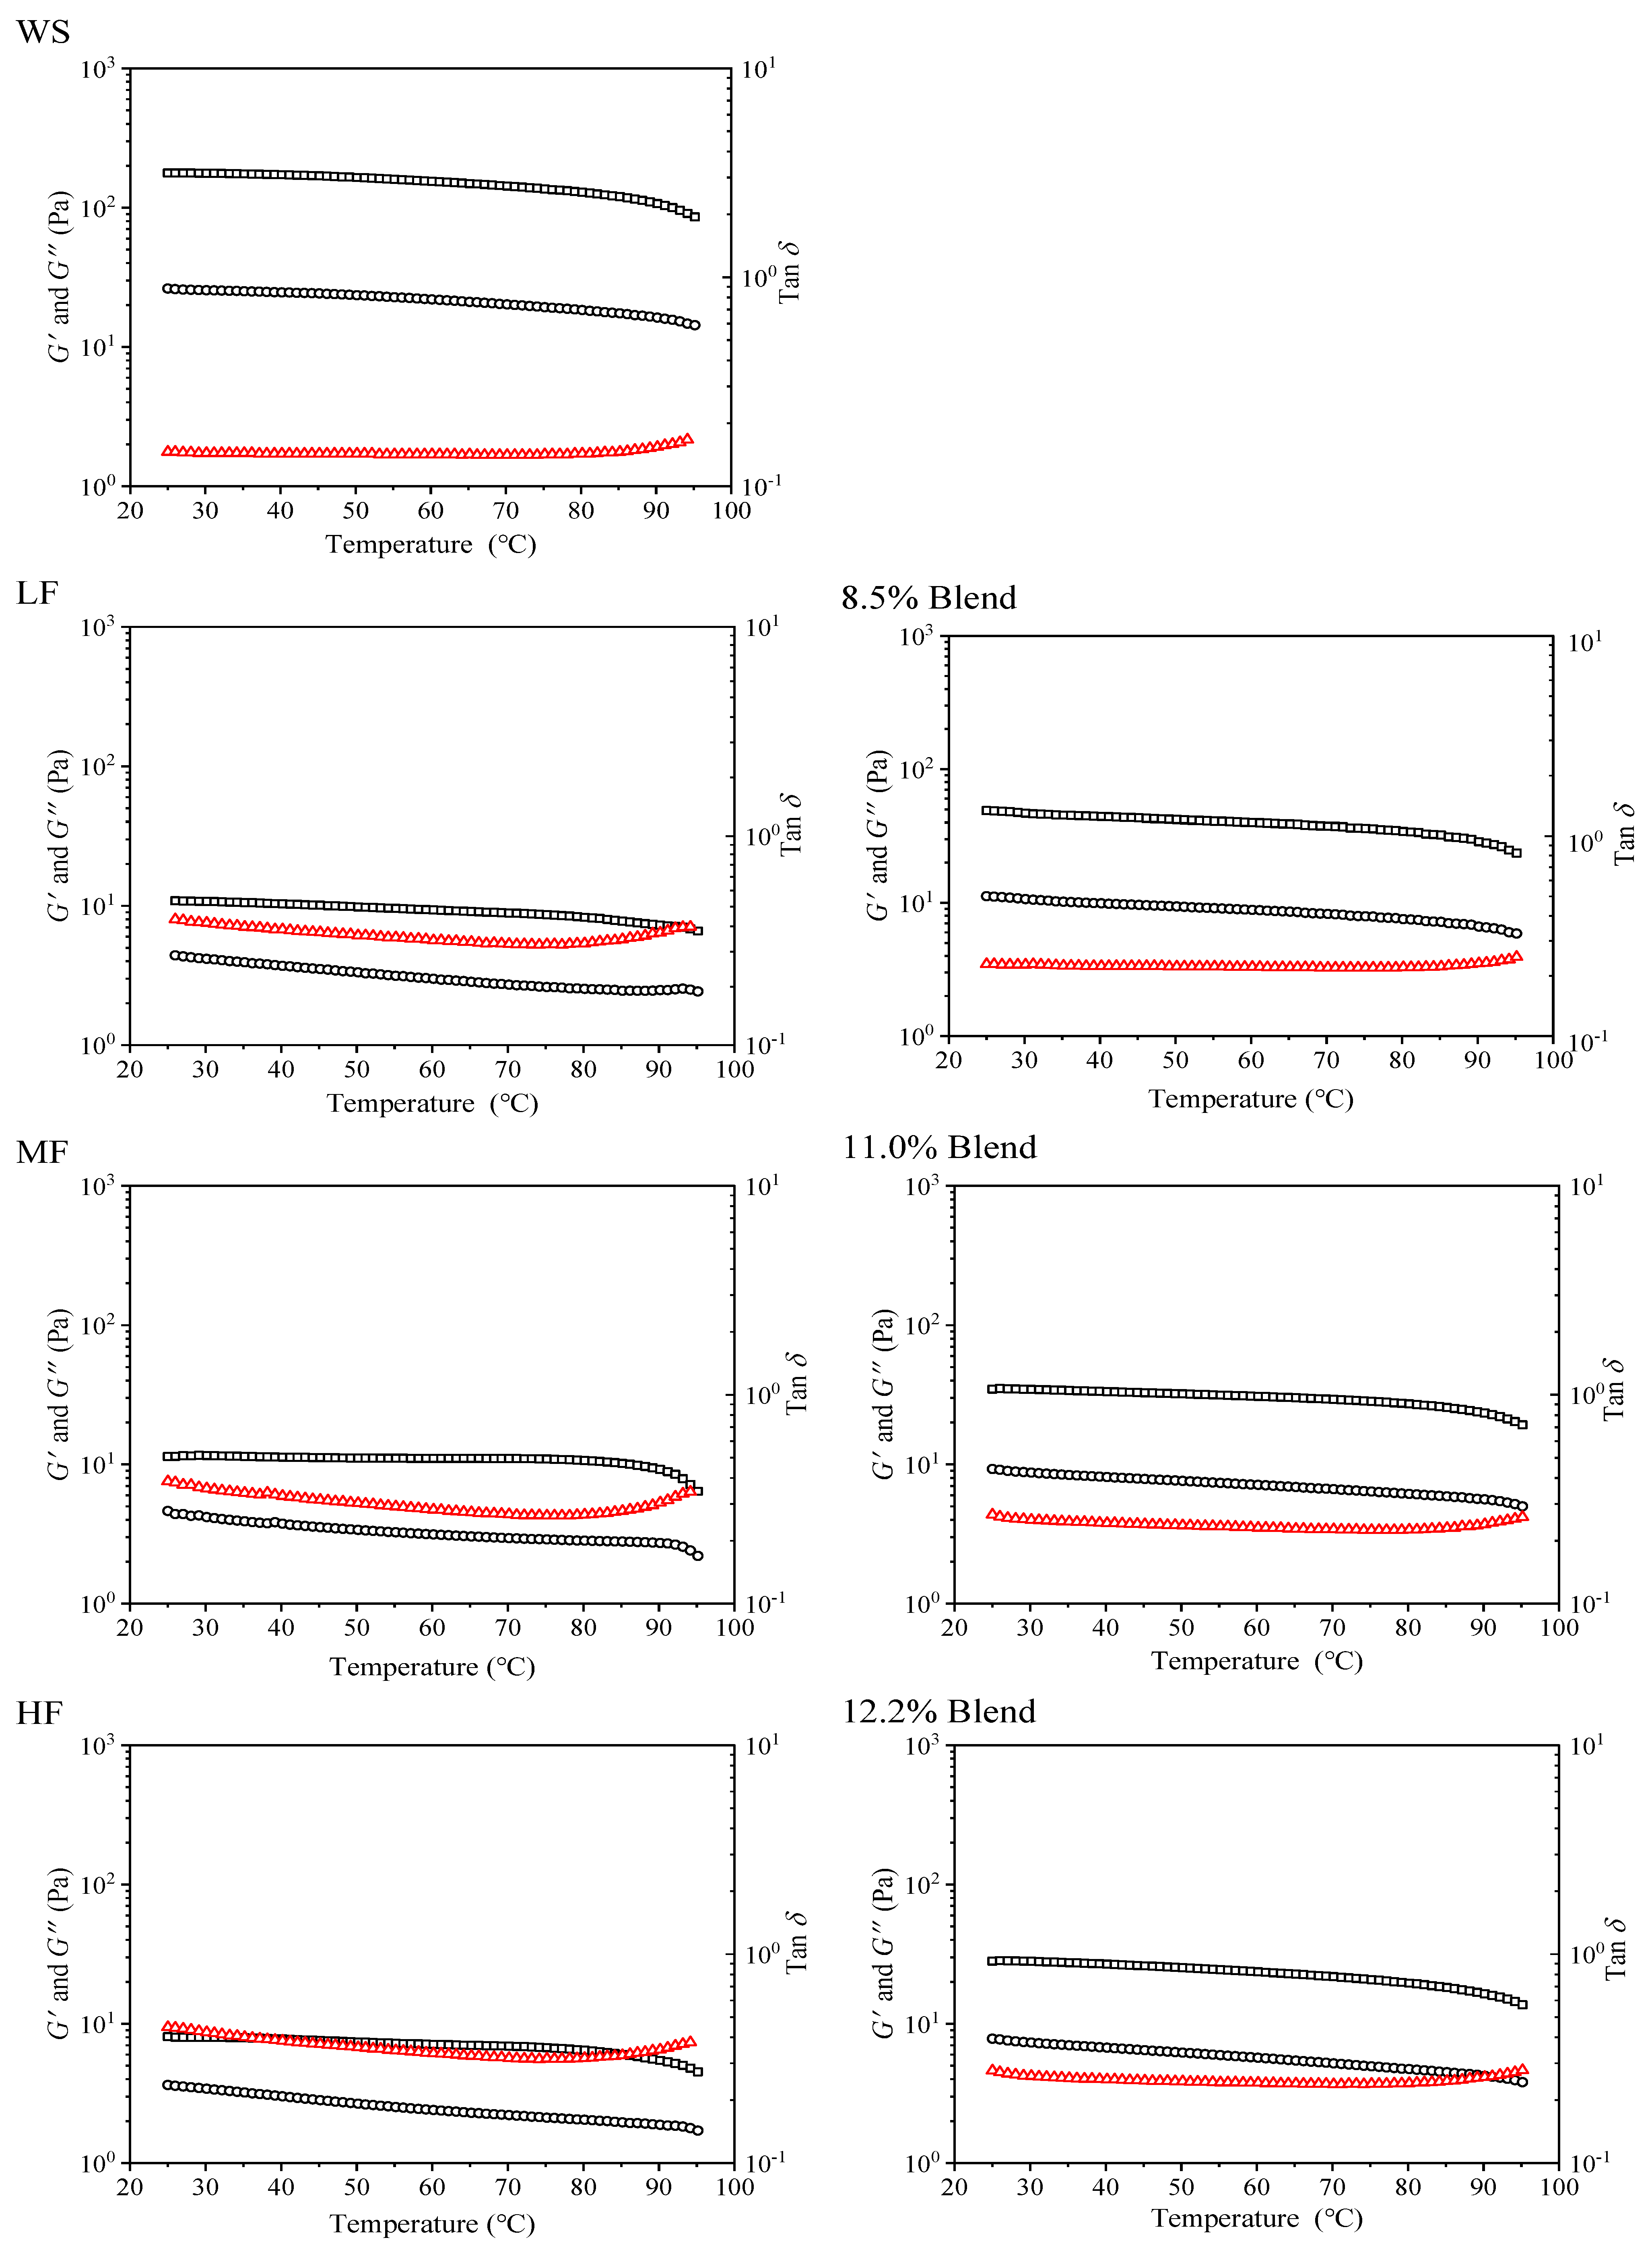
2.2.3. Viscoelastic Properties during Heating
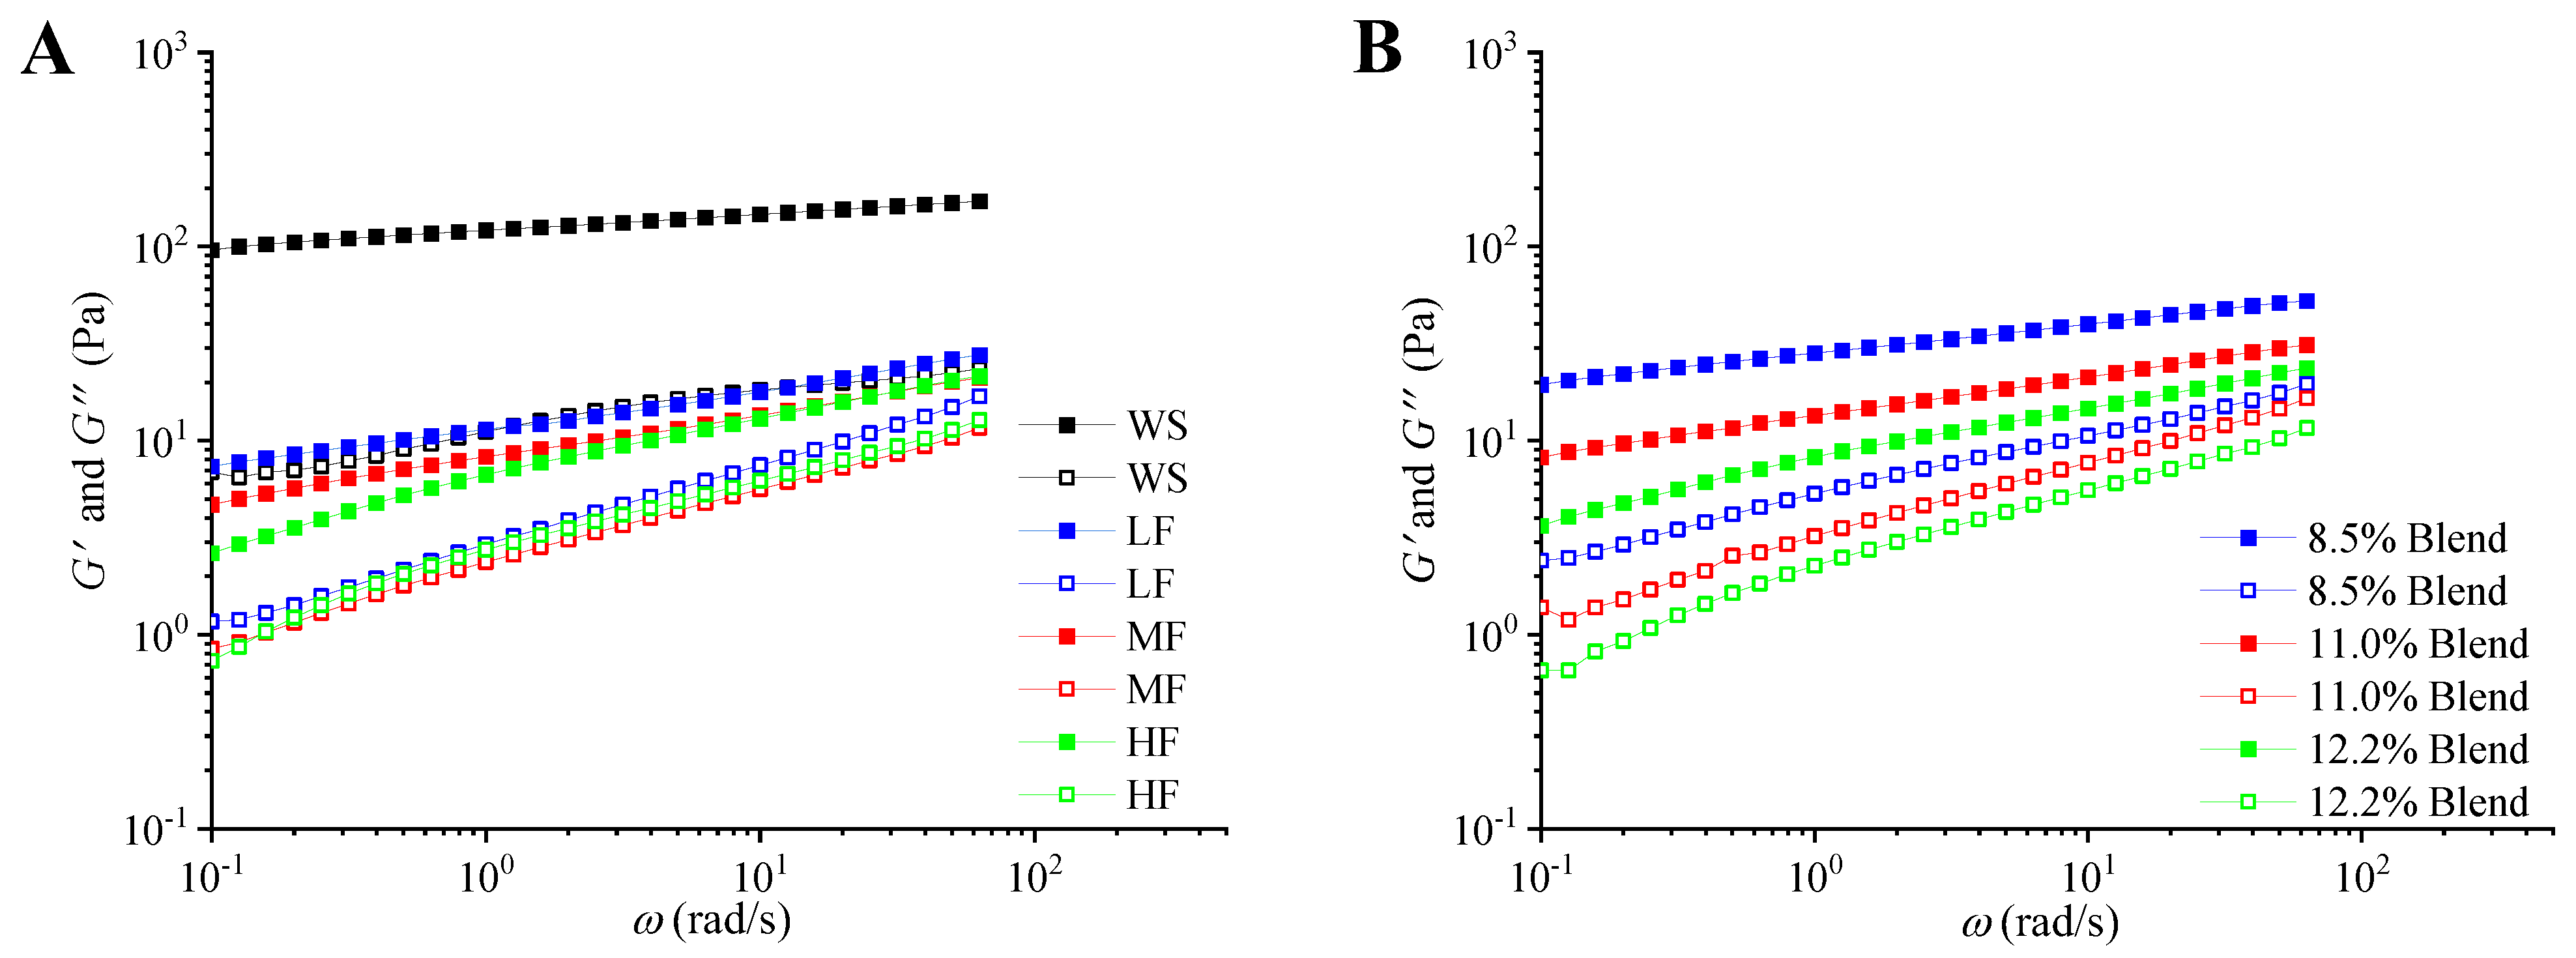
2.2.4. Dynamic Mechanical Properties
2.3. Characteristics of Films
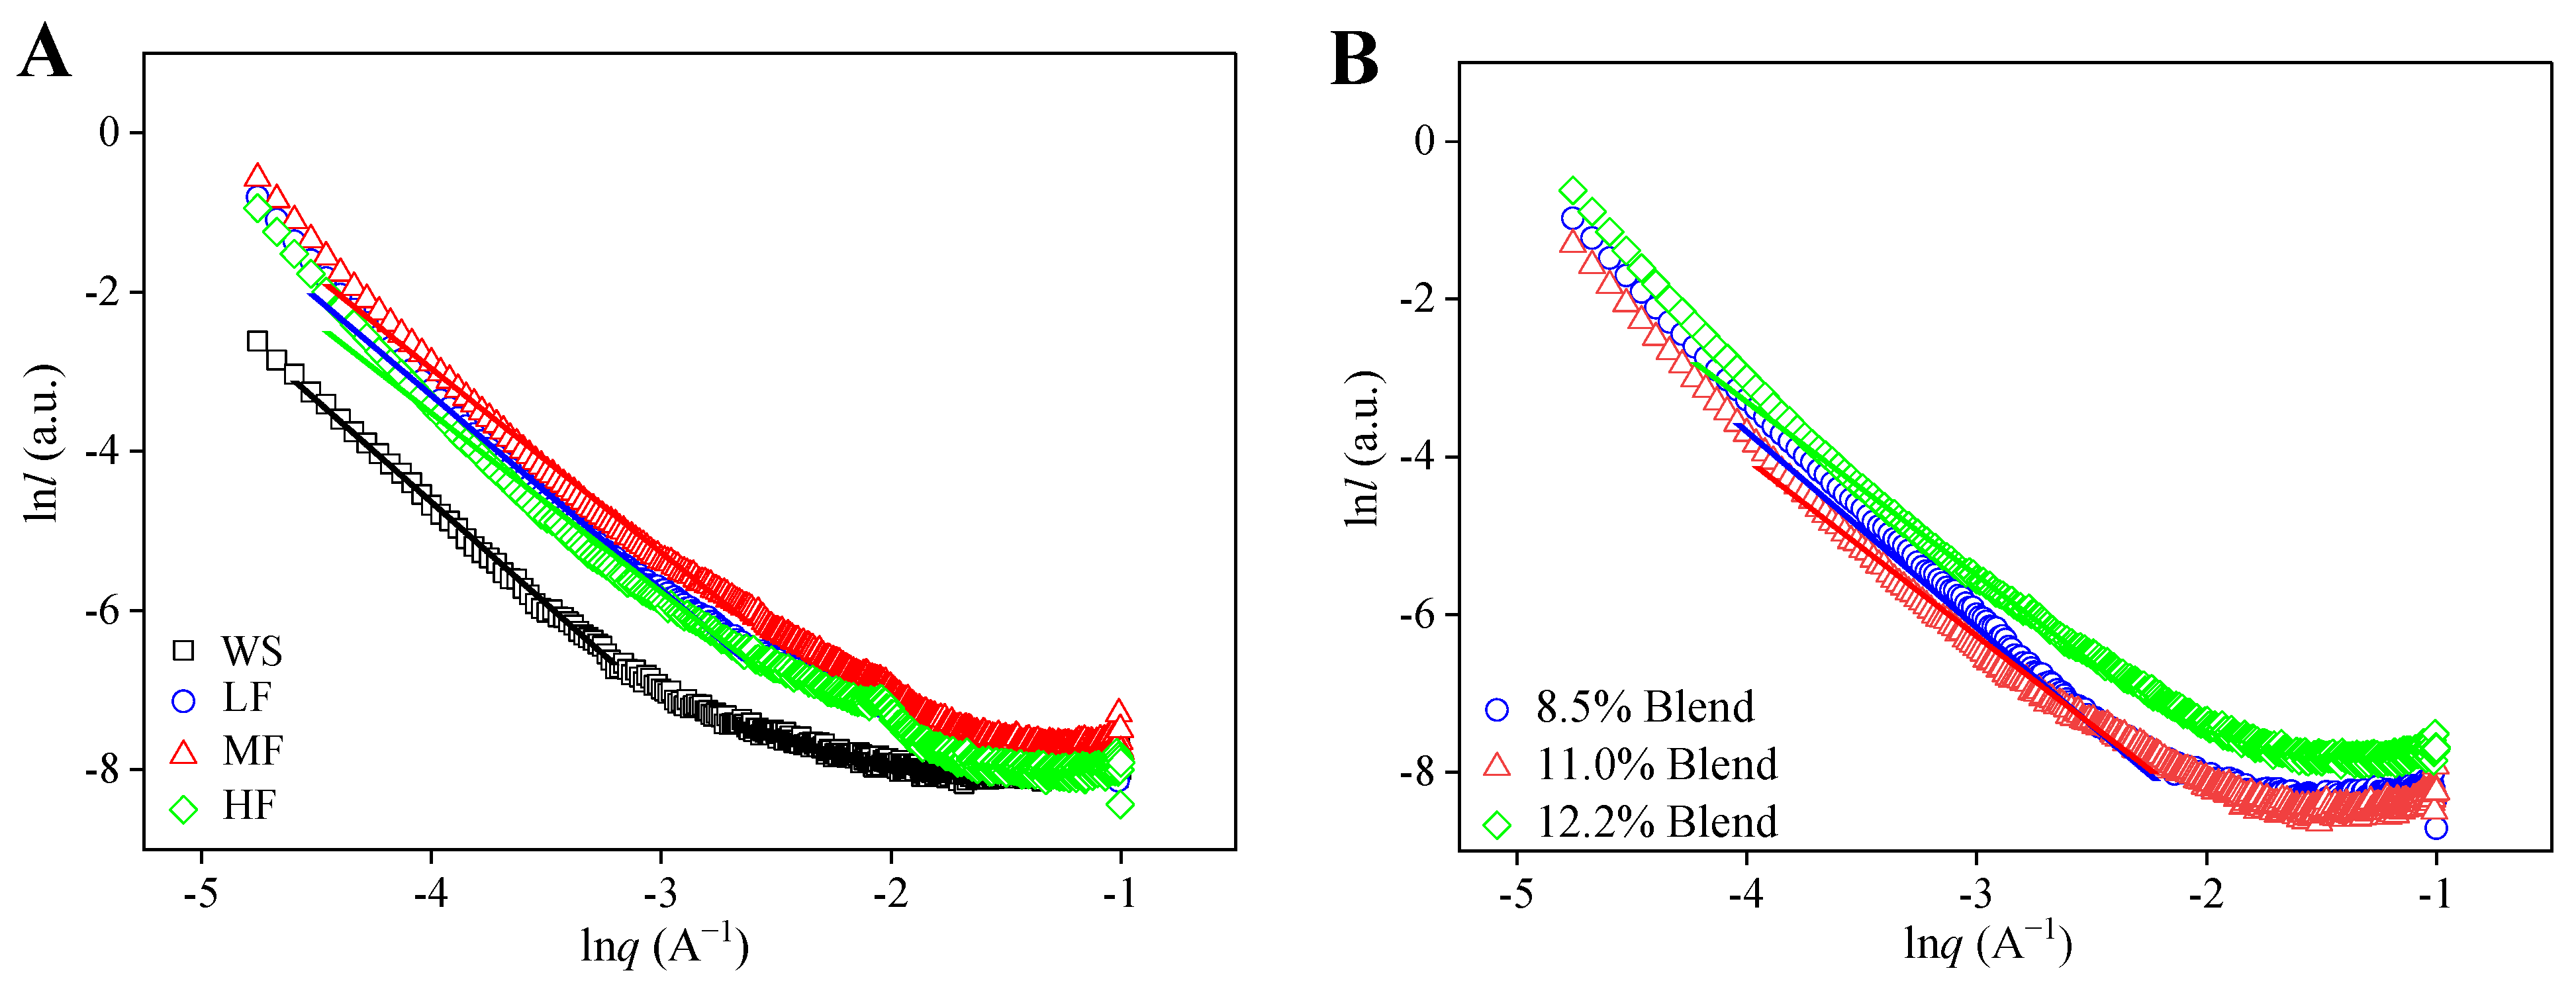
2.3.1. Fractal Structure
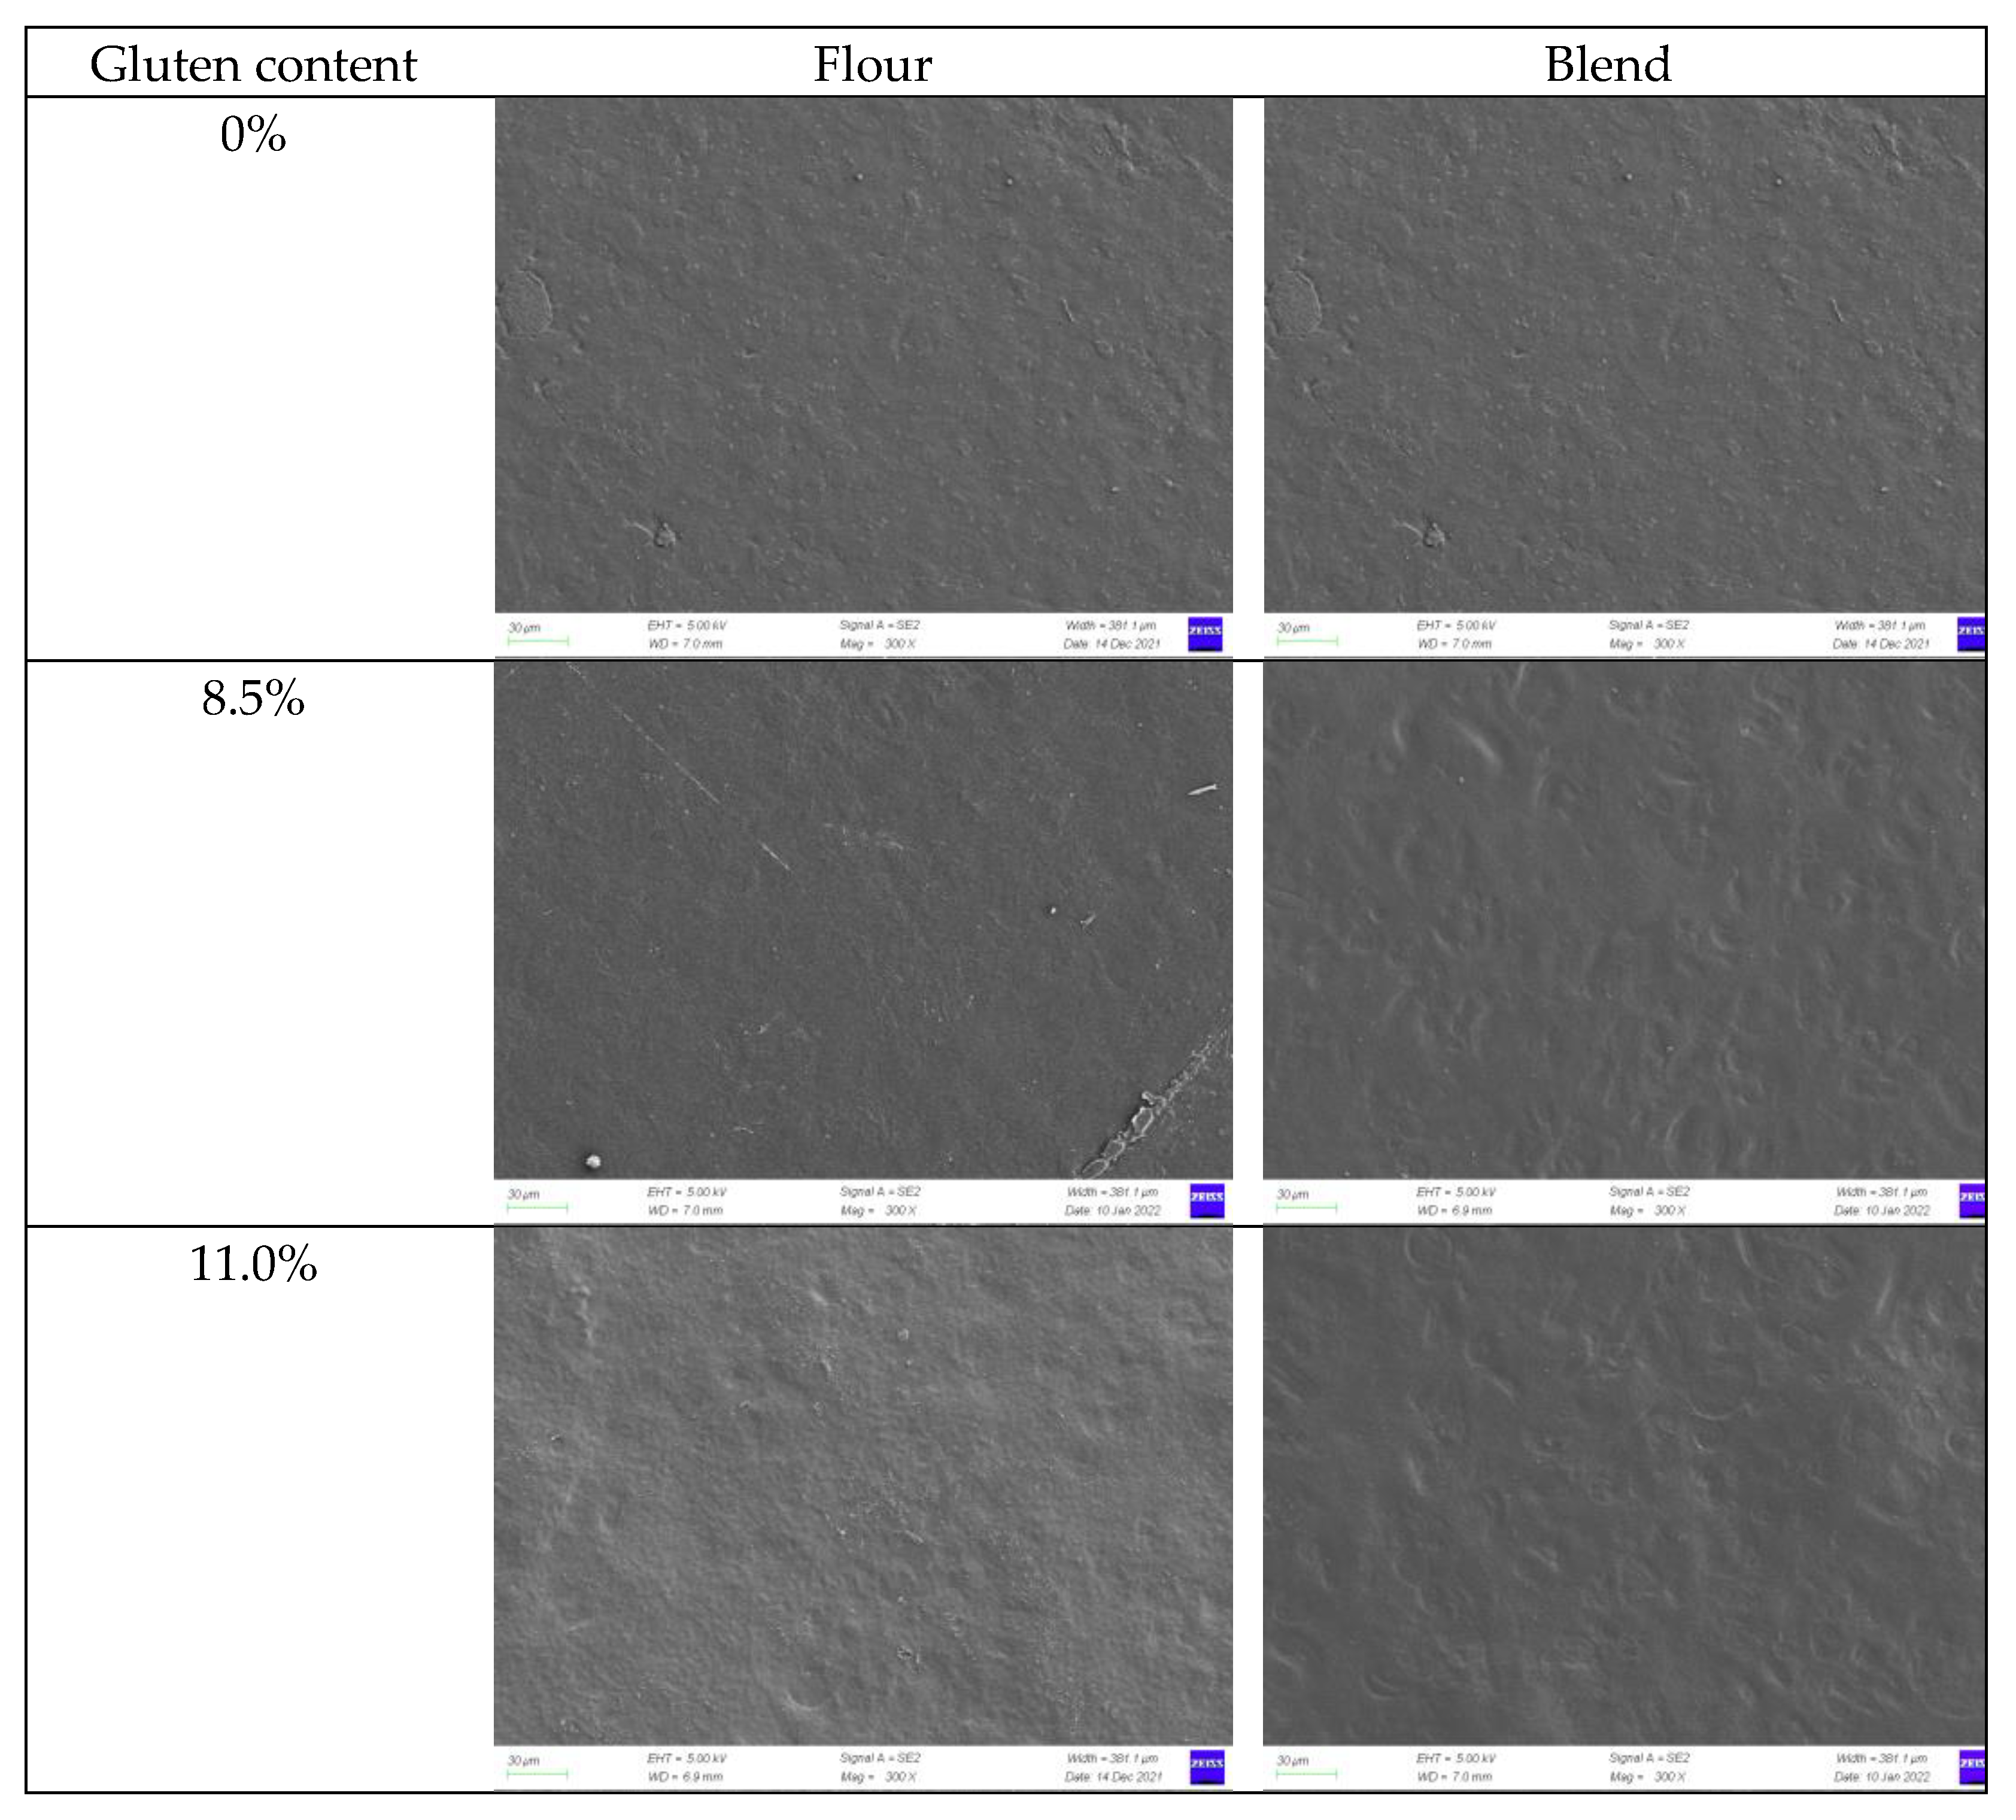
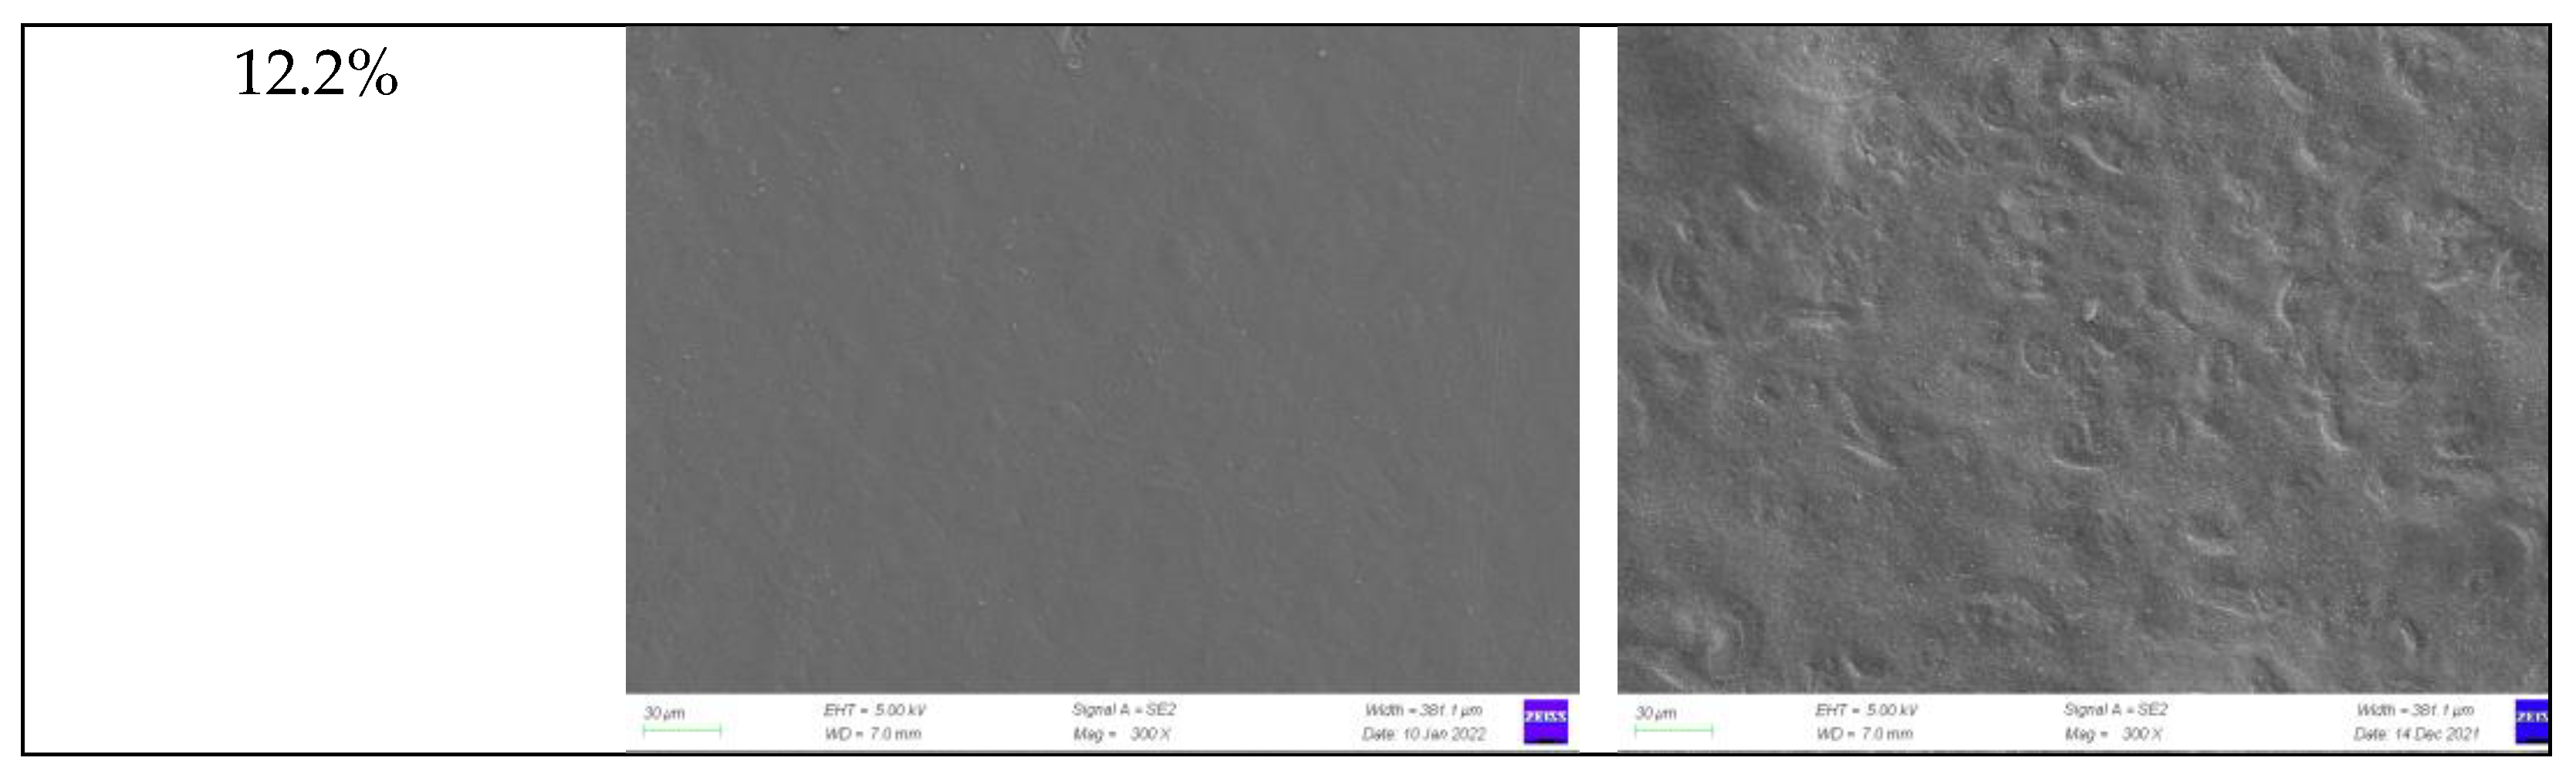
2.3.2. Microscopic Morphology of Film Surface
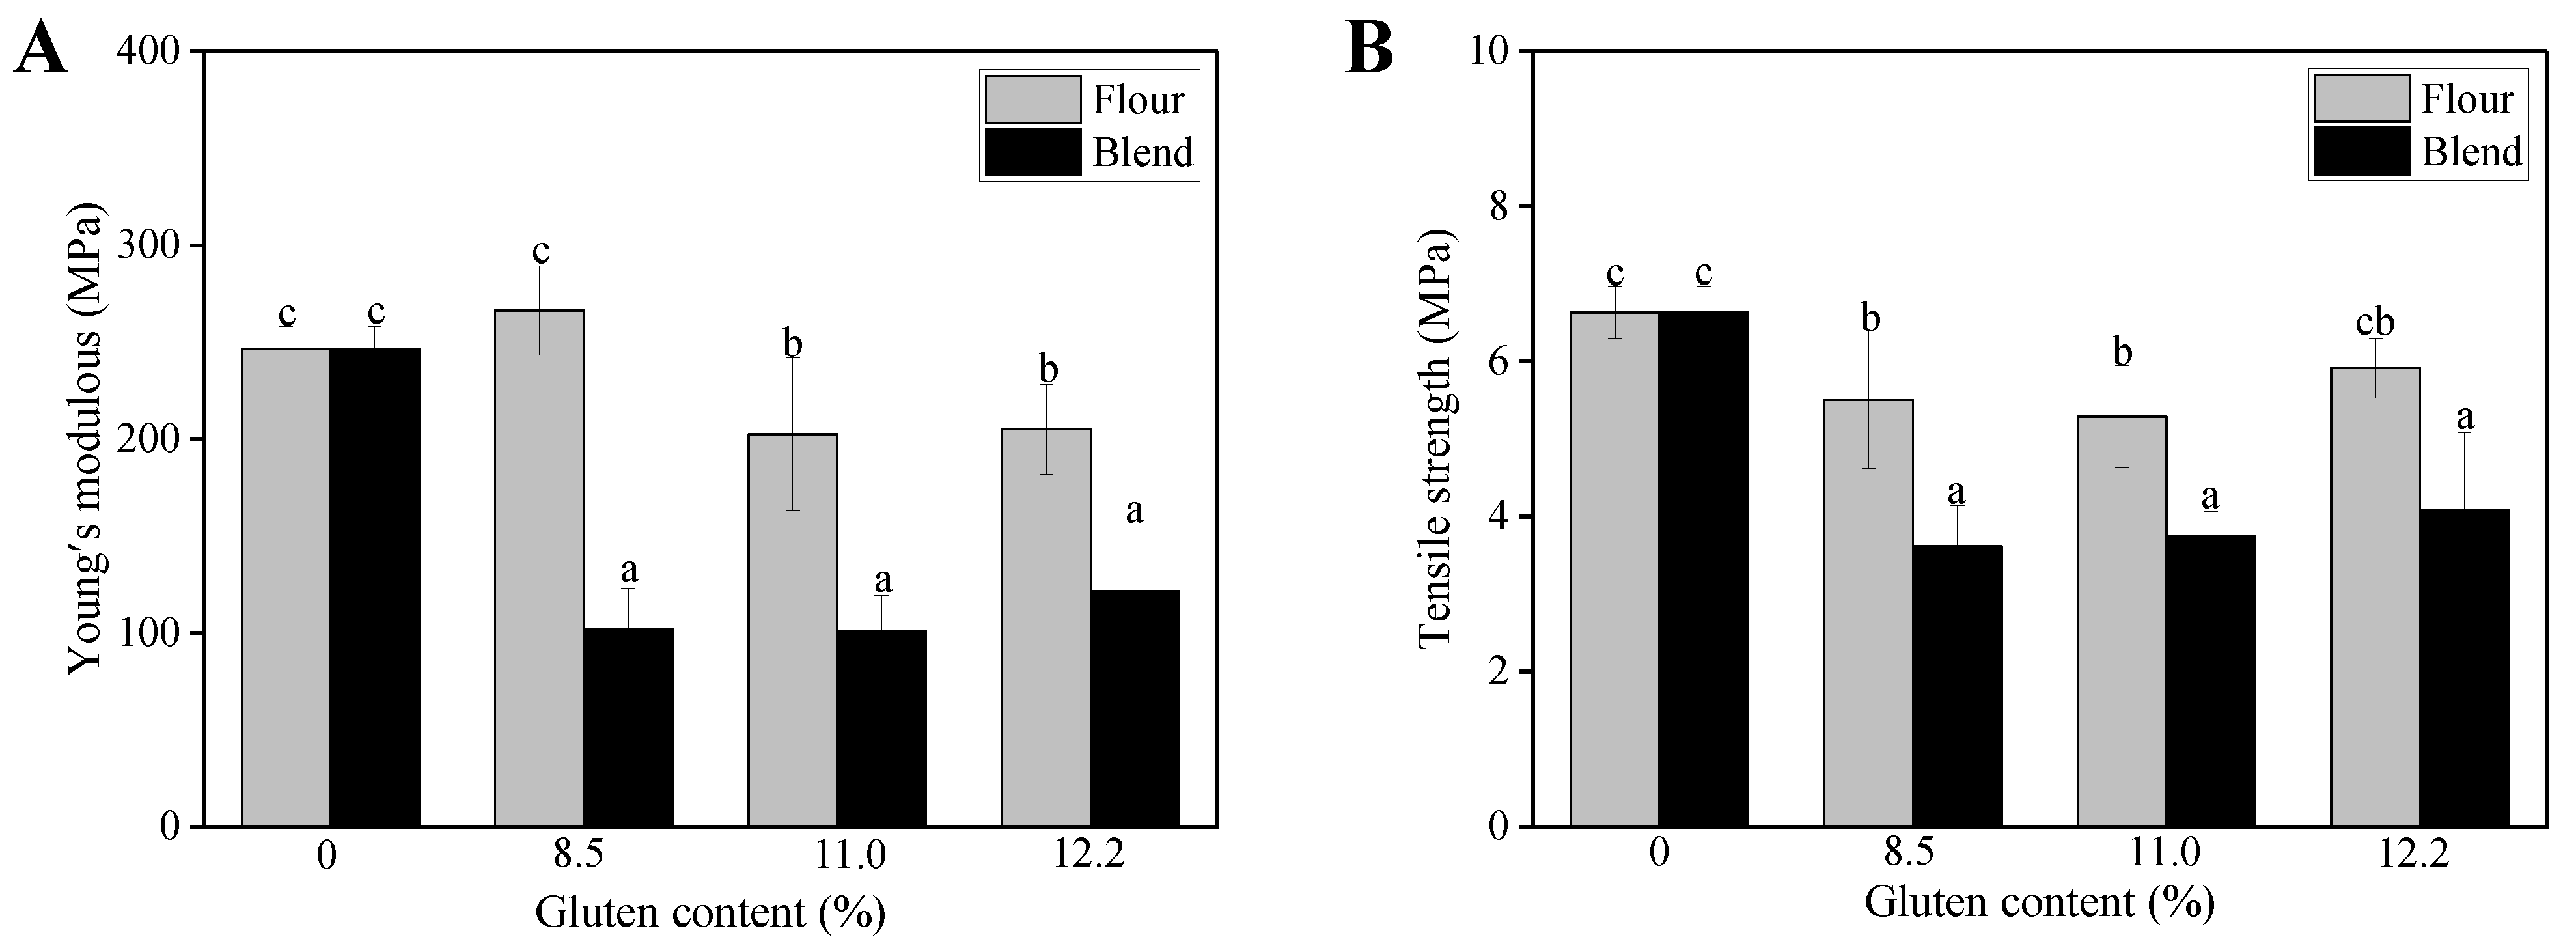
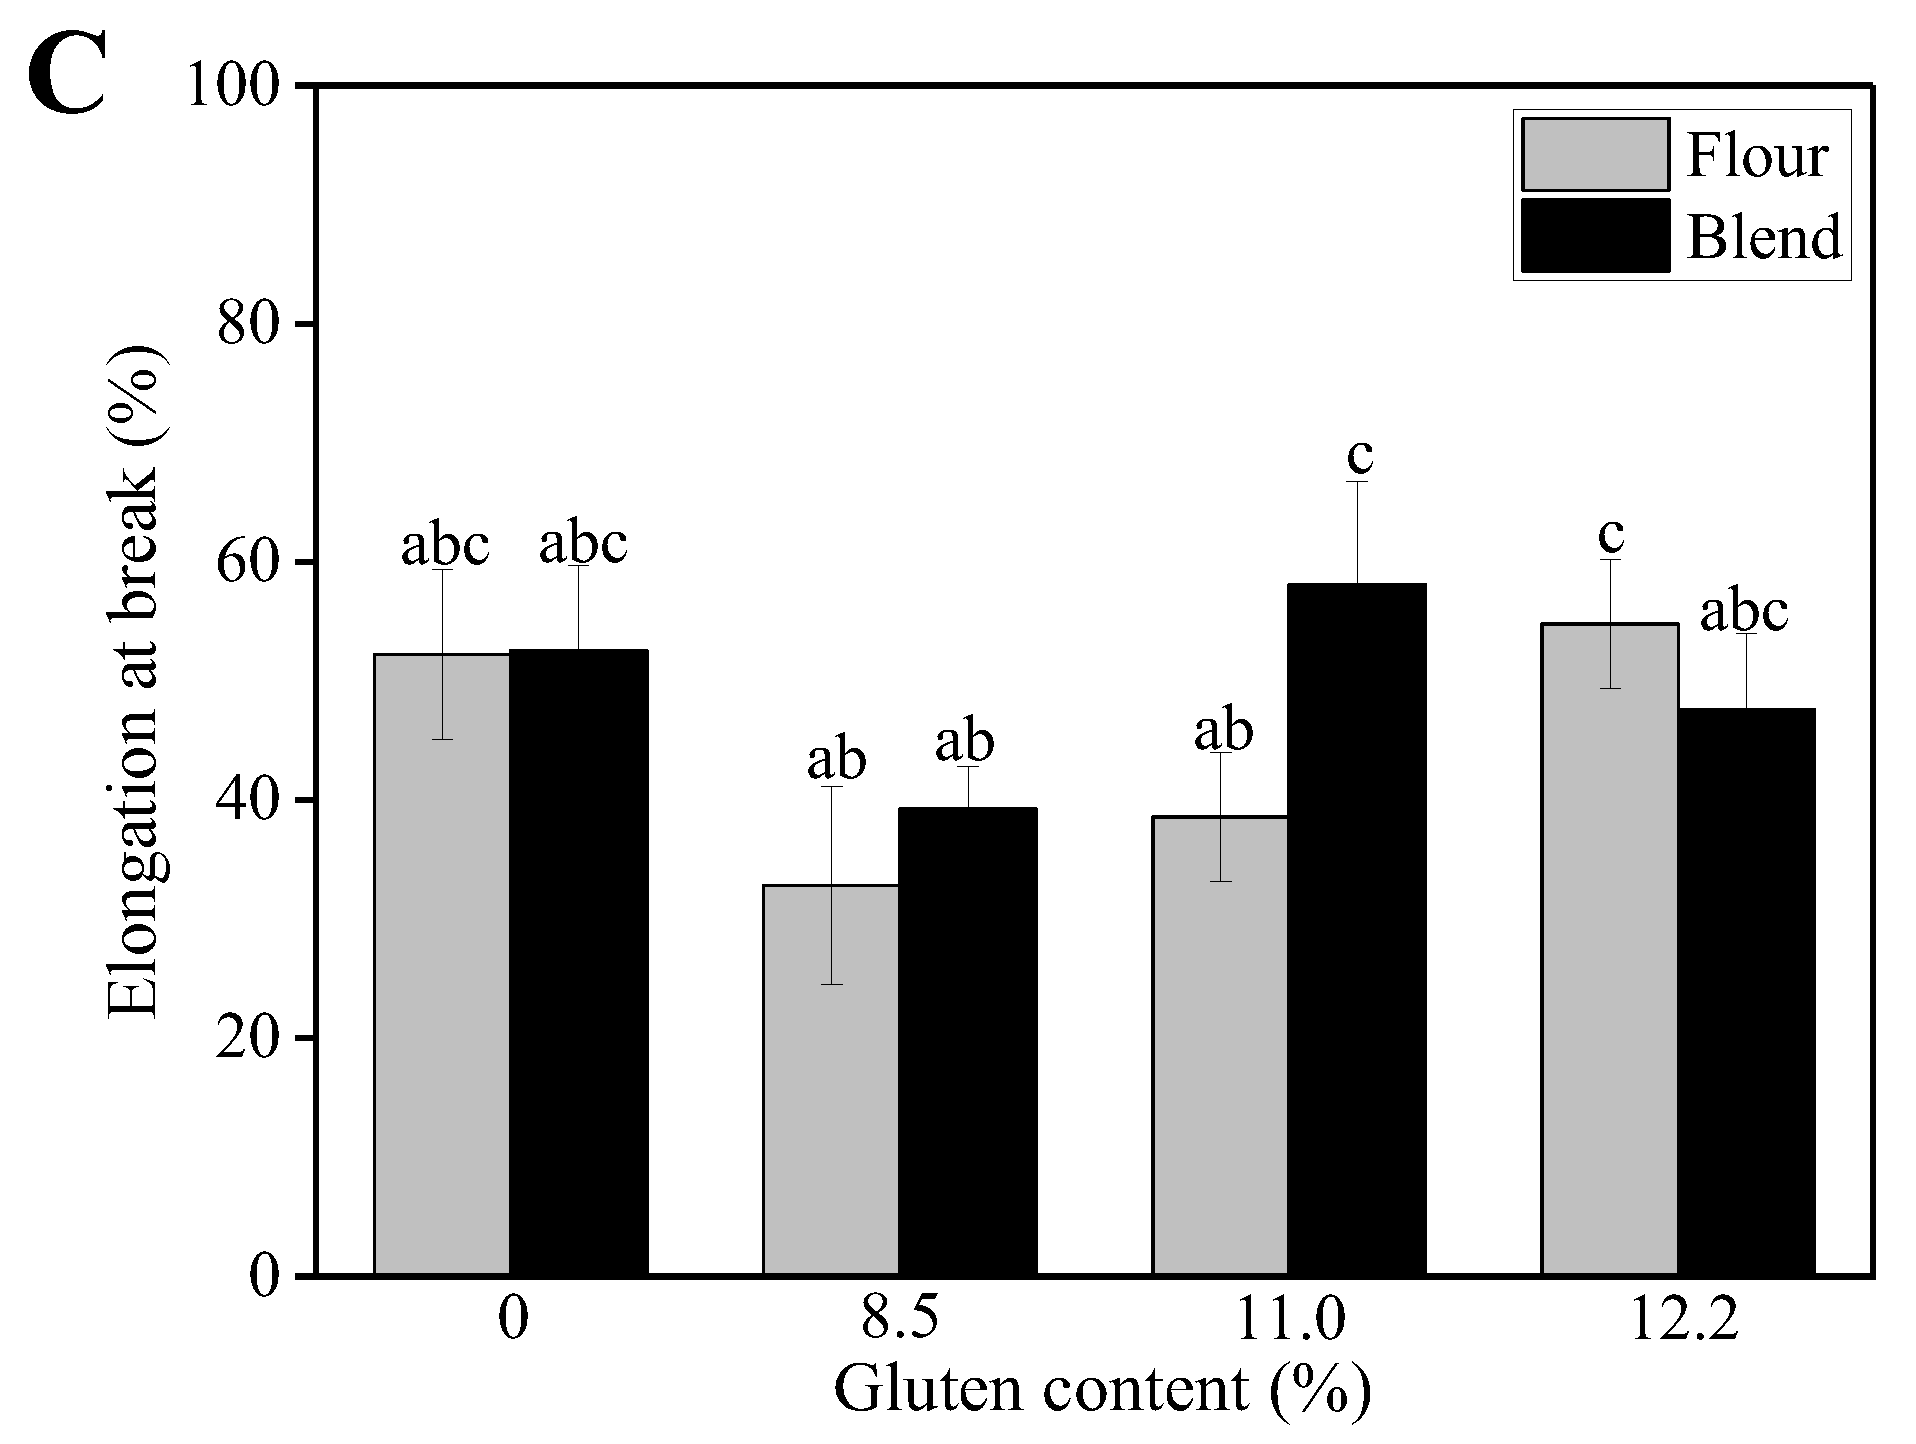
2.3.3. Tensile Properties
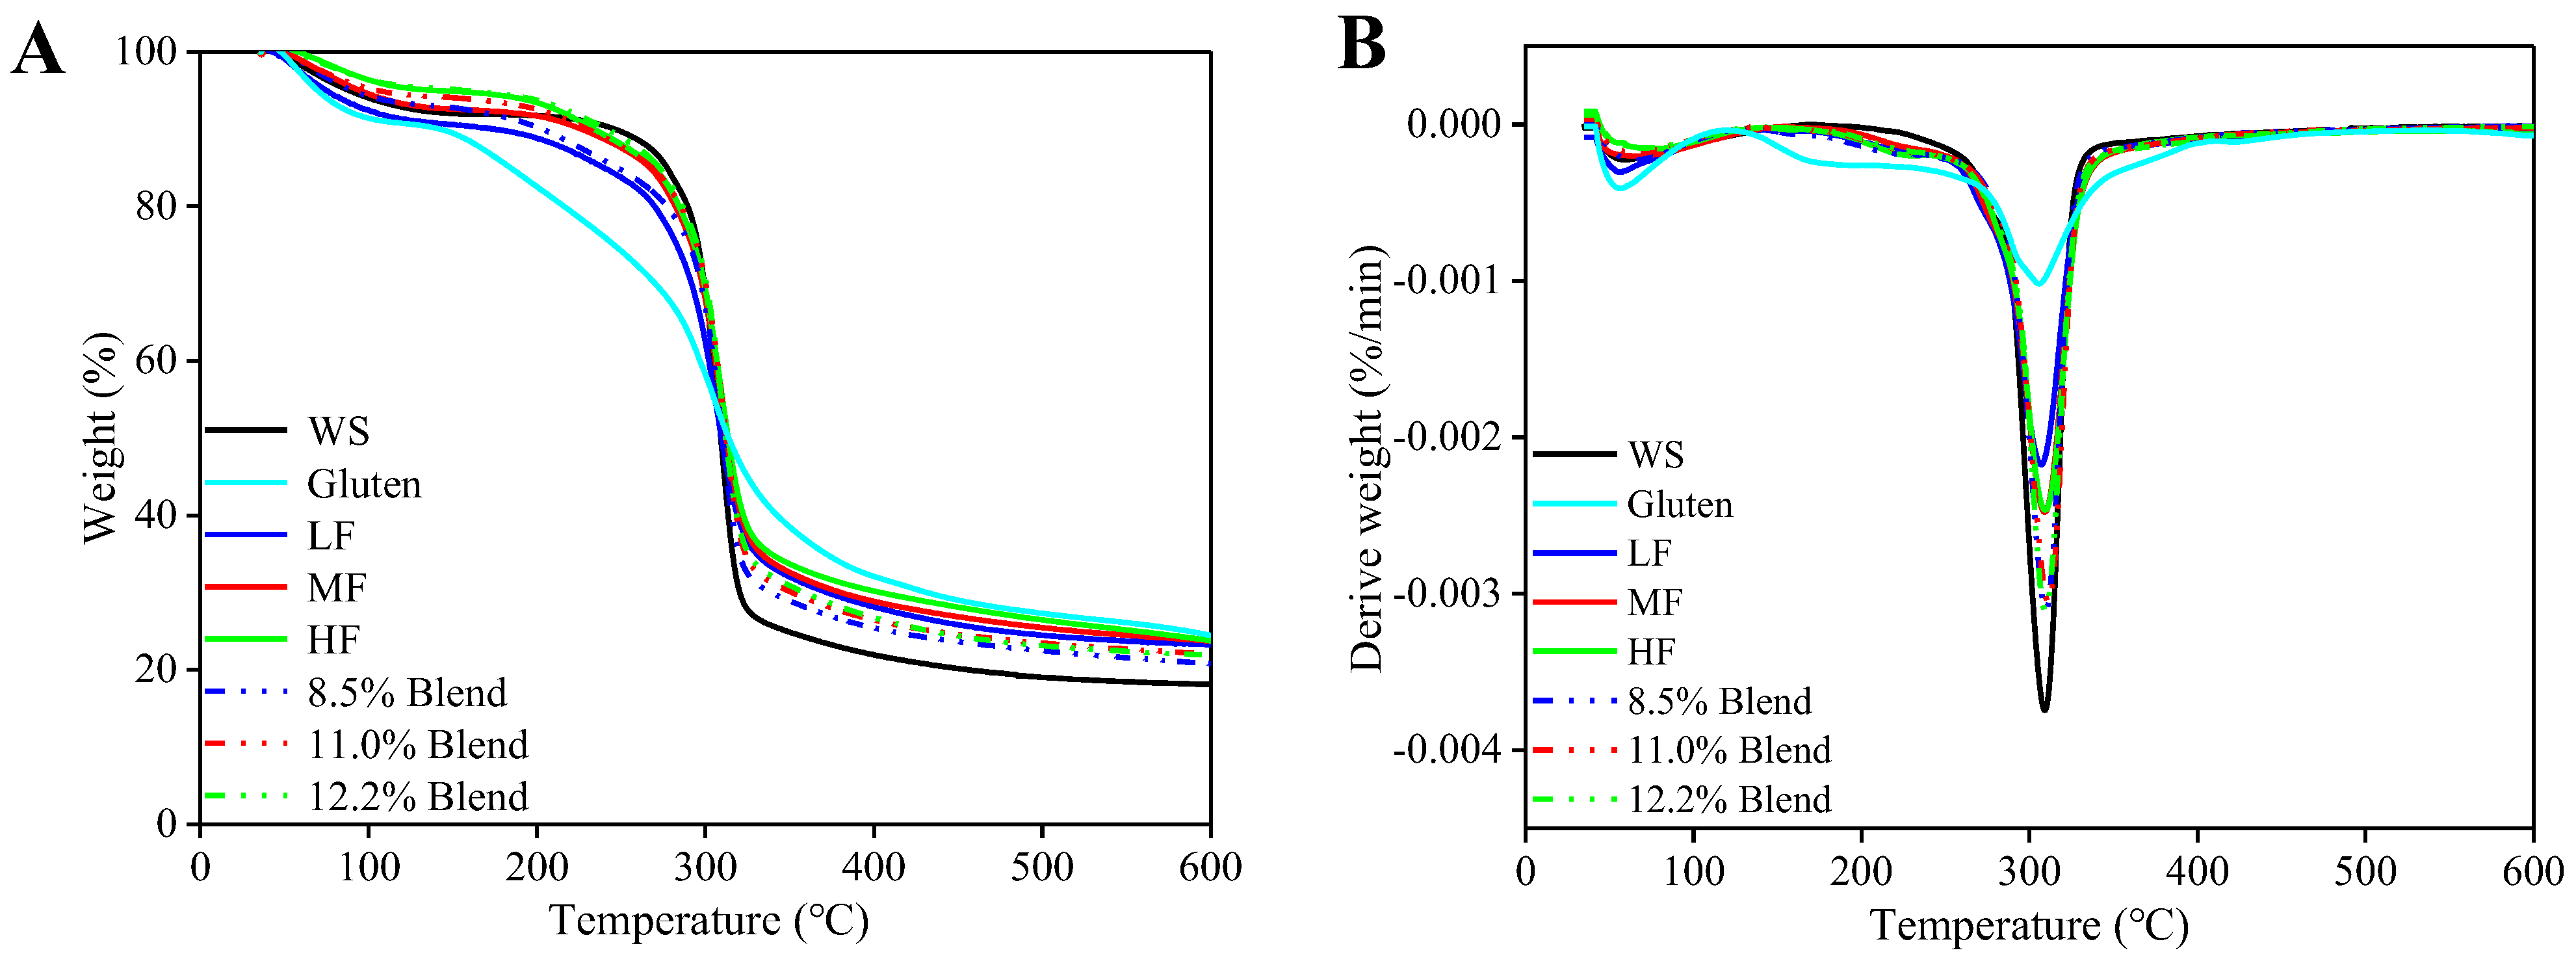
2.3.4. Thermal Stability
2.3.5. Water Vapor Permeability (WVP)
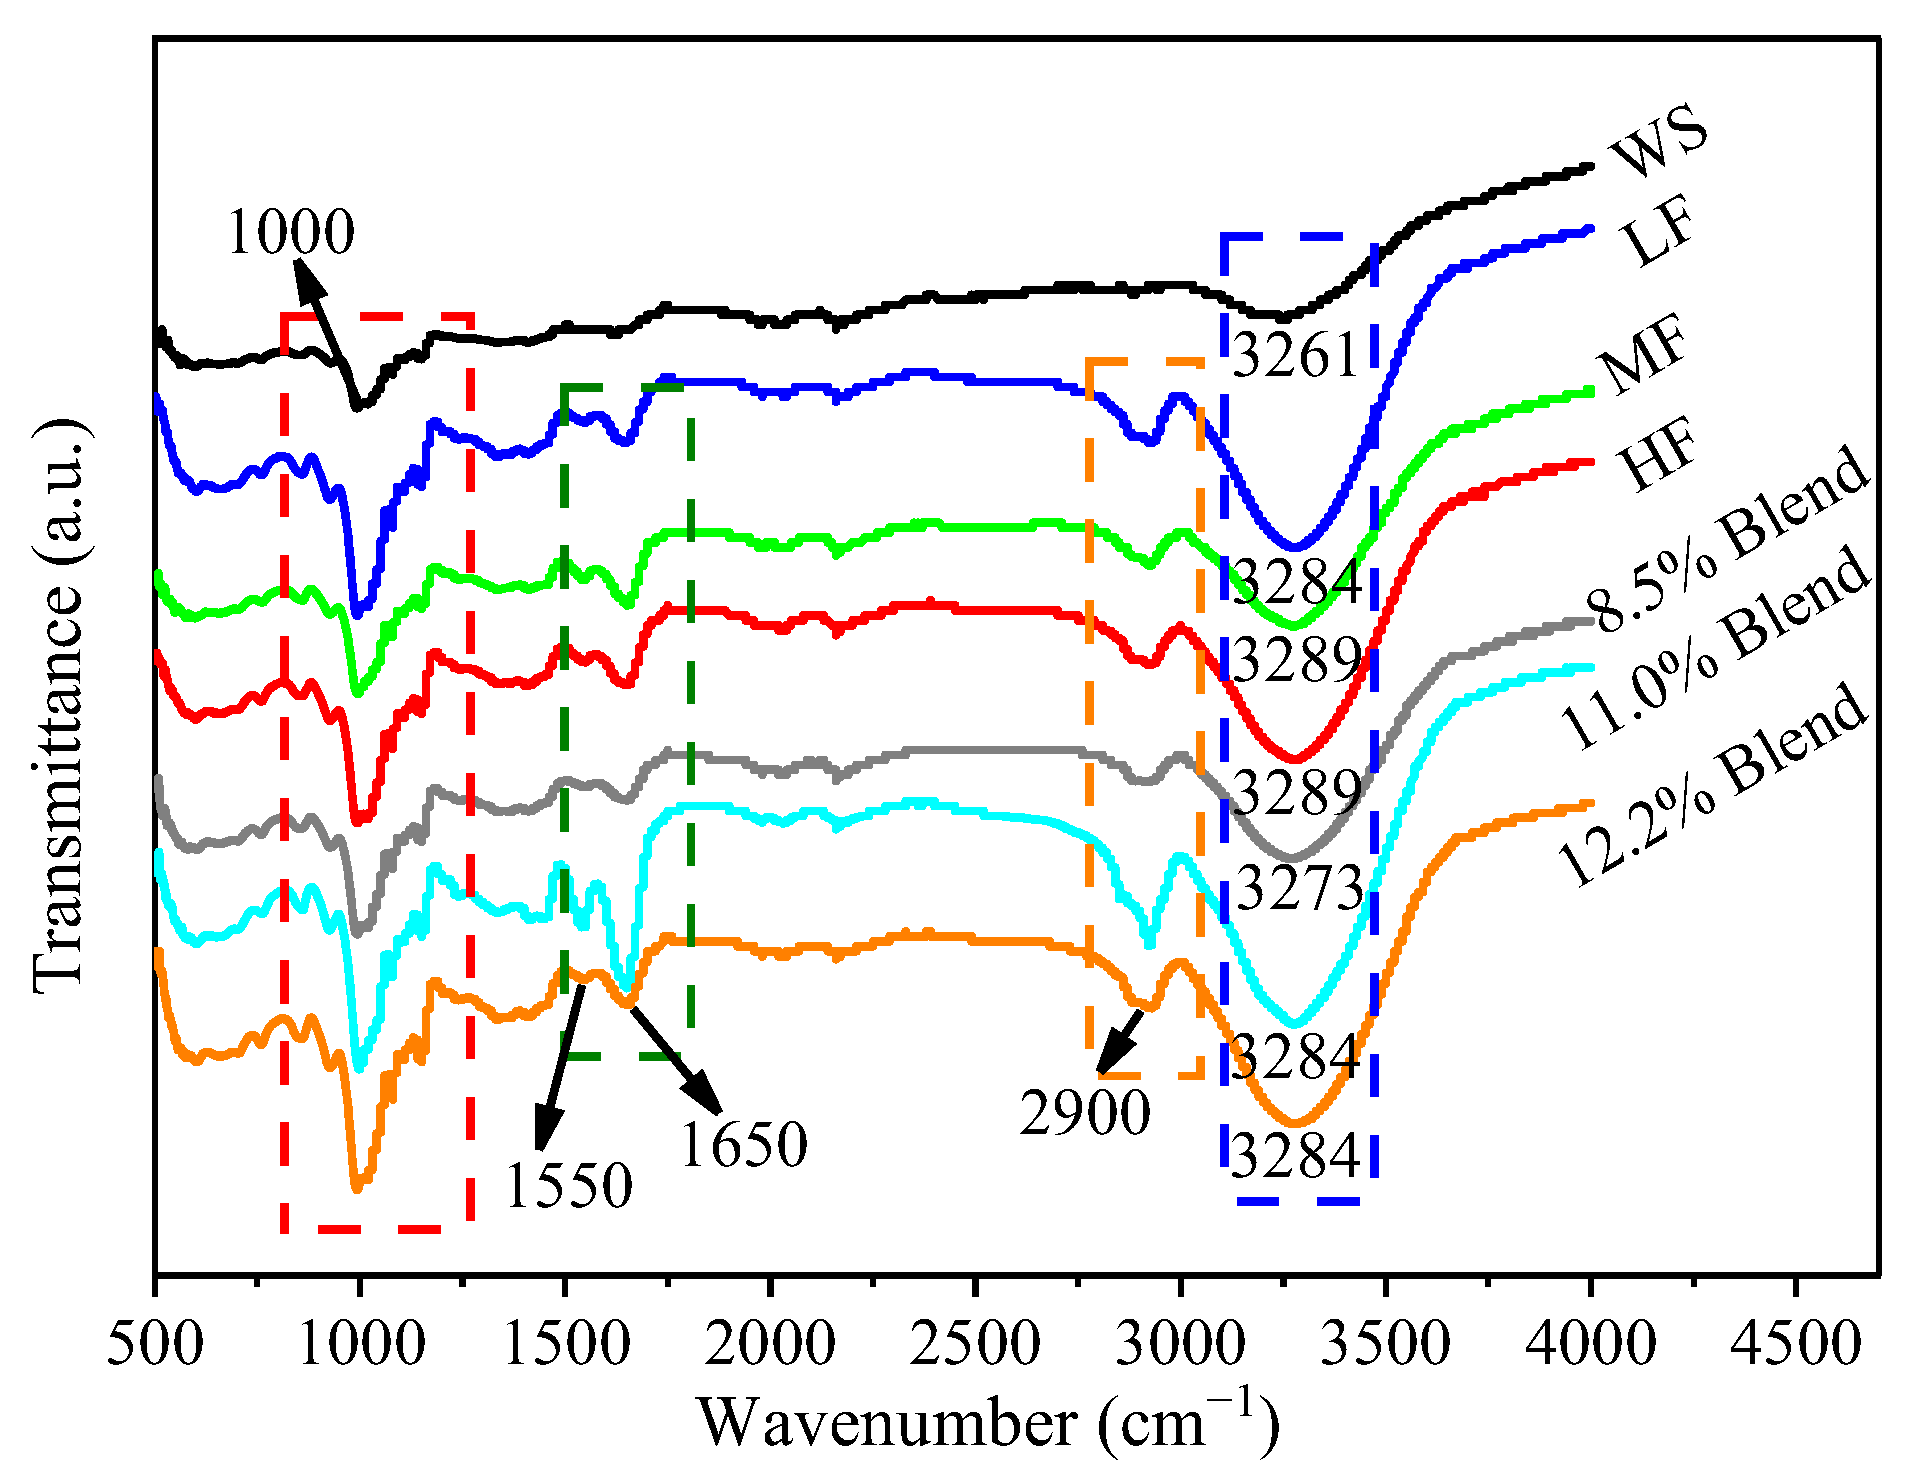
2.3.6. Fourier Transform Infrared Spectroscopy (FTIR)
3. Materials and Methods
3.1. Materials
3.2. Preparation of Film-Forming Matrix and Film Casting
3.3. Characterization of the Film-Forming Matrix and Films
3.3.1. Rheological Measurements
3.3.2. Microscopy Observation
3.3.3. Small-Angle X-ray Scattering (SAXS)
3.3.4. Scanning Electron Microscopy (SEM)
3.3.5. Mechanical Properties
3.3.6. Thermal Stability of Films
3.3.7. Water Vapor Permeability (WVP)
3.3.8. Fourier Transform Infrared Spectroscopy (FTIR)
4. Conclusions
Author Contributions
Funding
Institutional Review Board Statement
Informed Consent Statement
Data Availability Statement
Acknowledgments
Conflicts of Interest
References
- Thuppahige, V.T.W.; Karim, M.A. A comprehensive review on the properties and functionalities of biodegradable and semibiodegradable food packaging materials. Compr. Rev. Food Sci. Food Saf. 2022, 21, 689–718. [Google Scholar] [CrossRef] [PubMed]
- Sid, S.; Mor, R.S.; Kishore, A.; Sharanagat, V.S. Bio-sourced polymers as alternatives to conventional food packaging materials: A review. Trends Food Sci. Technol. 2021, 115, 87–104. [Google Scholar] [CrossRef]
- Walker, T.R.; Xanthos, D. A call for Canada to move toward zero plastic waste by reducing and recycling single-use plastics. Resour. Conserv. Recycl. 2018, 133, 99–100. [Google Scholar] [CrossRef]
- Babayemi, J.O.; Nnorom, I.C.; Osibanjo, O.; Weber, R. Ensuring sustainability in plastics use in Africa: Consumption, waste generation, and projections. Environ. Sci. Eur. 2019, 31, 60. [Google Scholar] [CrossRef]
- Xanthos, D.; Walker, T.R. International policies to reduce plastic marine pollution from single-use plastics (plastic bags and microbeads): A review. Mar. Pollut. Bull. 2017, 118, 17–26. [Google Scholar] [CrossRef]
- Li, N.; Wang, L.; Zhao, S.; Qiao, D.; Zhang, B. An insight into starch slowly digestible features enhanced by microwave treatment. Food Hydrocoll. 2020, 103, 105690. [Google Scholar] [CrossRef]
- Rangaraj, V.M.; Rambabu, K.; Banat, F.; Mittal, V. Natural antioxidants-based edible active food packaging: An overview of current advancements. Food Biosci. 2021, 43, 101251. [Google Scholar] [CrossRef]
- Tavares, L.; Souza, H.K.S.; Goncalves, M.P.; Rocha, C.M.R. Physicochemical and microstructural properties of composite edible film obtained by complex coacervation between chitosan and whey protein isolate. Food Hydrocoll. 2021, 113, 1064741. [Google Scholar] [CrossRef]
- Su, C.Y.; Li, D.; Wang, L.J.; Wang, Y. Biodegradation behavior and digestive properties of starch-based film for food packaging—A review. Crit. Rev. Food Sci. 2022, 1–23. [Google Scholar] [CrossRef] [PubMed]
- Sadeghizadeh-Yazdi, J.; Habibi, M.; Kamali, A.R.; Banaei, M. Application of Edible and Biodegradable Starch-Based Films in Food Packaging: A Systematic Review and Meta-Analysis. Curr. Res. Nutr. Food S. 2019, 7, 624–637. [Google Scholar] [CrossRef]
- da Silva, J.B.; Cook, M.T.; Bruschi, M.L. Thermoresponsive systems composed of poloxamer 407 and HPMC or NaCMC: Mechanical, rheological and sol-gel transition analysis. Carbohyd. Polym. 2020, 240, 116268. [Google Scholar] [CrossRef] [PubMed]
- Xu, Y.P.; Wang, T.; Shi, X. Enhanced dielectric and capacitive performance in polypropylene/poly (vinylidene fluoride) binary blends compatibilized with polydopamine. Mater. Design 2020, 195, 109004. [Google Scholar] [CrossRef]
- Liu, C.L.; Yu, B.; Tao, H.T.; Liu, P.F.; Zhao, H.B.; Tan, C.P.; Cui, B. Effects of soy protein isolate on mechanical and hydrophobic properties of oxidized corn starch film. LWT-Food Sci. Technol. 2021, 147, 111529. [Google Scholar] [CrossRef]
- Huntrakul, K.; Yoksan, R.; Sane, A.; Harnkarnsujarit, N. Effects of pea protein on properties of cassava starch edible films produced by blown-film extrusion for oil packaging. Food Packag. Shelf Life 2020, 24, 100480. [Google Scholar] [CrossRef]
- Luo, S.M.; Chen, J.D.; He, J.; Li, H.S.; Jia, Q.; Hossen, M.A.; Dai, J.W.; Qin, W.; Liu, Y.W. Preparation of corn starch/rock bean protein edible film loaded with D-limonene particles and their application in glutinous rice cake preservation. Int. J. Biol. Macromol. 2022, 206, 313–324. [Google Scholar] [CrossRef]
- Tanaka, Y.; Sako, T.; Hiraoka, T.; Yamaguchi, M.; Yamaguchi, M. Effect of morphology on shear viscosity for binary blends of polycarbonate and polystyrene. J. Appl. Polym. Sci. 2020, 137, 49516. [Google Scholar] [CrossRef]
- Ibrahim, B.A.; Karrer, M.K. Influence of Polymer Blending on Mechanical and Thermal Properties. Mod. Appl. Sci. 2010, 4, 157–161. [Google Scholar] [CrossRef]
- Gutierrez, T.J. In vitro and in vivo digestibility from bionanocomposite edible films based on native pumpkin flour/plum flour. Food Hydrocoll. 2021, 112, 106272. [Google Scholar] [CrossRef]
- Vargas, C.G.; Costa, T.M.H.; Rios, A.D.; Flores, S.H. Comparative study on the properties of films based on red rice (Oryza glaberrima) flour and starch. Food Hydrocoll. 2017, 65, 96–106. [Google Scholar] [CrossRef]
- Puglia, D.; Dominici, F.; Kenny, J.M.; Santulli, C.; Governatori, C.; Tosti, G.; Benincasa, P. Tensile Behavior of Thermoplastic Films from Wheat Flours as Function of Raw Material Baking Properties. J. Polym. Environ. 2016, 24, 37–47. [Google Scholar] [CrossRef]
- Yildiz, E.; Bayram, I.; Sumnu, G.; Sahin, S.; Ibis, O.I. Development of pea flour based active films produced through different homogenization methods and their effects on lipid oxidation. Food Hydrocoll. 2021, 111, 106238. [Google Scholar] [CrossRef]
- Benincasa, P.; Dominici, F.; Bocci, L.; Governatori, C.; Panfili, I.; Tosti, G.; Torre, L.; Puglia, D. Relationships between wheat flour baking properties and tensile characteristics of derived thermoplastic films. Ind. Crop. Prod. 2017, 100, 138–145. [Google Scholar] [CrossRef]
- Guo, S.X.; Fu, Z.Q.; Sun, Y.; Wang, X.Y.; Wu, M. Effect of Plasticizers on the Properties of Potato Flour Films. Starch-Starke 2022, 74, 2100179. [Google Scholar] [CrossRef]
- Gutierrez, T.J.; Alvarez, V.A. Films Made by Blending Poly(epsilon-Caprolactone) with Starch and Flour from Sagu Rhizome Grown at the Venezuelan Amazons. J. Polym. Environ. 2017, 25, 701–716. [Google Scholar] [CrossRef]
- Ma, M.; Sun, Q.J.; Li, M.; Zhu, K.X. Deterioration mechanisms of high-moisture wheat-based food—A review from physicochemical, structural, and molecular perspectives. Food Chem. 2020, 318, 126495. [Google Scholar] [CrossRef]
- Hong, J.; An, D.; Wang, M.S.; Liu, C.; Buckow, R.; Li, L.M.; Zheng, X.L.; Bian, K. Wheat noodles enriched with A-type and/or B-type wheat starch: Physical, thermal and textural properties of dough sheet and noodle samples from different noodle-making process. Int. J. Food Sci. Techol. 2021, 56, 3111–3122. [Google Scholar] [CrossRef]
- Guo, L.N.; Fang, F.; Zhang, Y.; Xu, D.; Xu, X.M.; Jin, Z.Y. Effect of glutathione on gelatinization and retrogradation of wheat flour and starch. J. Cereal Sci. 2020, 95, 103061. [Google Scholar] [CrossRef]
- Punia, S.; Sandhu, K.S.; Dhull, S.B.; Kaur, M. Dynamic, shear and pasting behaviour of native and octenyl succinic anhydride (OSA) modified wheat starch and their utilization in preparation of edible films. Int. J. Biol. Macromol. 2019, 133, 110–116. [Google Scholar] [CrossRef]
- Bonilla, J.; Atares, L.; Vargas, M.; Chiralt, A. Properties of wheat starch film-forming dispersions and films as affected by chitosan addition. J. Food Eng. 2013, 114, 303–312. [Google Scholar] [CrossRef]
- Tanade-Palmu, P.S.; Grosso, C.R.F. Development and characterization of edible films based on gluten from semi-hard and soft Brazilian wheat flours (development of films of based on gluten from wheat flours). Food Sci. Technol. 2003, 23, 264–269. [Google Scholar] [CrossRef]
- Pouplin, M.; Redl, A.; Gontard, N. Glass transition of wheat gluten plasticized with water, glycerol, or sorbitol. J. Agric. Food Chem. 1999, 47, 538–543. [Google Scholar] [CrossRef] [PubMed]
- Chen, Y.; Li, Y.H.; Qin, S.L.; Han, S.Y.; Qi, H.S. Antimicrobial, UV blocking, water-resistant and degradable coatings and packaging films based on wheat gluten and lignocellulose for food preservation. Compos. Part B Eng. 2022, 238, 109868. [Google Scholar] [CrossRef]
- Song, X.Y.; Zuo, G.J.; Chen, F.S. Effect of essential oil and surfactant on the physical and antimicrobial properties of corn and wheat starch films. Int. J. Biol. Macromol. 2018, 107, 1302–1309. [Google Scholar] [CrossRef] [PubMed]
- Dong, M.X.; Tian, L.J.; Li, J.Y.; Jia, J.; Dong, Y.F.; Tu, Y.G.; Liu, X.B.; Tan, C.; Duan, X. Improving physicochemical properties of edible wheat gluten protein films with proteins, polysaccharides and organic acid. LWT-Food Sci. Technol. 2022, 154, 112868. [Google Scholar] [CrossRef]
- Chen, J.S.; Deng, Z.Y.; Peng, W.U.; Tian, J.C.; Xie, Q.G. Effect of gluten on pasting properties of wheat starch. Agr. Sci. China 2010, 9, 1836–1844. [Google Scholar] [CrossRef]
- Xu, H.B.; Zhou, J.P.; Yu, J.L.; Wang, S.; Wang, S.J. Mechanisms underlying the effect of gluten and its hydrolysates on in vitro enzymatic digestibility of wheat starch. Food Hydrocoll. 2021, 113, 106507. [Google Scholar] [CrossRef]
- Angelidis, G.; Protonotariou, S.; Mandala, I.; Rosell, C.M. Jet milling effect on wheat flour characteristics and starch hydrolysis. J. Food Sci. Technol. 2016, 53, 784–791. [Google Scholar] [CrossRef]
- Wang, Y.F.; Yu, L.; Xie, F.W.; Li, S.; Sun, Q.J.; Liu, H.S.; Chen, L. On the investigation of thermal/cooling-gel biphasic systems based on hydroxypropyl methylcellulose and hydroxypropyl starch. Ind. Crop. Prod. 2018, 124, 418–428. [Google Scholar] [CrossRef]
- Heyman, B.; De Vos, W.H.; Depypere, F.; Van der Meeren, P.; Dewettinck, K. Guar and xanthan gum differentially affect shear induced breakdown of native waxy maize starch. Food Hydrocoll. 2014, 35, 546–556. [Google Scholar] [CrossRef]
- Juhani, O.; Rha, C. Gelatinisation of starch and wheat flour starch—A review. Food Chem. 1978, 3, 293–317. [Google Scholar]
- Ortega-Ojeda, F.E.; Larsson, H.; Eliasson, A.C. Gel formation in mixtures of amylose and high amylopectin potato starch. Carbohyd. Polym. 2004, 57, 55–66. [Google Scholar] [CrossRef]
- Wang, Y.F.; Wang, J.; Sun, Q.J.; Xu, X.F.; Li, M.; Xie, F.W. Hydroxypropyl methylcellulose hydrocolloid systems: Effect of hydroxypropy group content on the phase structure, rheological properties and film characteristics. Food Chem. 2022, 379, 132075. [Google Scholar] [CrossRef]
- Fabra, M.J.; Talens, P.; Chiralt, A. Microstructure and optical properties of sodium caseinate films containing oleic acid–beeswax mixtures. Food Hydrocoll. 2009, 23, 676–683. [Google Scholar] [CrossRef]
- Wang, Y.F.; Yu, L.; Xie, F.W.; Zhang, L.; Liao, L.; Liu, H.S.; Chen, L. Morphology and properties of thermal/cooling-gel bi-phasic systems based on hydroxypropyl methylcellulose and hydroxypropyl starch. Compos. Part B Eng. 2016, 101, 46–52. [Google Scholar] [CrossRef]
- Peron-Schlosser, B.; Carpine, D.; Jorge, R.M.M.; Spier, M.R. Optimization of wheat flour by product films: A technological and sustainable approach for bio-based packaging material. J. Food Sci. 2021, 86, 4522–4538. [Google Scholar] [CrossRef] [PubMed]
- Drakos, A.; Pelava, E.; Evageliou, V. Properties of flour films as affected by the flour’s source and particle size. Food Res. Int. 2018, 107, 551–558. [Google Scholar] [CrossRef]
- Chen, X.; Cui, F.H.; Zi, H.; Zhou, Y.C.; Liu, H.S.; Xiao, J. Development and characterization of a hydroxypropyl starch/zein bilayer edible film. Int. J. Biol. Macromol. 2019, 141, 1175–1182. [Google Scholar] [CrossRef] [PubMed]
- Basiak, E.; Galus, S.; Lenart, A. Characterisation of composite edible films based on wheat starch and whey-protein isolate. Int. J. Food Sci. Technol. 2015, 50, 372–380. [Google Scholar] [CrossRef]
- Xiao, Q.; Woo, M.W.; Hu, J.W.; Xiong, H.; Zhao, Q. The role of heating time on the characteristics, functional properties and antioxidant activity of enzyme-hydrolyzed rice proteins-glucose Maillard reaction products. Food Biosci. 2021, 43, 101225. [Google Scholar] [CrossRef]
- Tao, R.; Sedman, J.; Ismail, A. Characterization and in vitro antimicrobial study of soy protein isolate films incorporating carvacrol. Food Hydrocoll. 2022, 122, 107091. [Google Scholar] [CrossRef]
- Furer, V.L.; Vandyukov, A.E.; Zaripov, S.R.; Solovieva, S.E.; Antipin, I.S.; Kovalenko, V.I. FT-IR and FT-Raman study of hydrogen bonding in p-alkylcalix 8 arenes. Vib. Spectrosc. 2018, 95, 38–43. [Google Scholar] [CrossRef]


| Gluten Content (%) | Wheat Flours | WS–Gluten Blends | ||||
|---|---|---|---|---|---|---|
| n | K | R2 | n | K | R2 | |
| 0 | 0.155 ± 0.012 a | 4.159 ± 0.244 e | 0.895 | 0.155 ± 0.012 a | 4.159 ± 0.244 e | 0.895 |
| 8.5 | 0.349 ± 0.007 d | 1.598 ± 0.036 c | 0.999 | 0.250 ± 0.010 b | 1.825 ± 0.031 d | 0.988 |
| 11.0 | 0.352 ± 0.014 d | 1.203 ± 0.055 ab | 1.000 | 0.264 ± 0.007 bc | 1.364 ± 0.031 b | 0.988 |
| 12.2 | 0.380 ± 0.014 e | 1.120 ± 0.055 a | 0.998 | 0.276 ± 0.003 c | 1.349 ± 0.045 b | 0.991 |
| Sample | n′ | G0′ | R2 | n″ | G0″ | R2 |
|---|---|---|---|---|---|---|
| WS | 0.0837 ± 0.000 a | 117.695 ± 3.005 e | 0.9999 | 0.1760 ± 0.006 a | 12.948 ± 1.394 c | 0.9645 |
| LF | 0.2048 ± 0.011 c | 11.356 ± 0.094 bc | 0.9926 | 0.4223 ± 0.003 d | 2.895 ± 0.041 a | 0.9981 |
| MF | 0.2241 ± 0.002 d | 7.942 ± 0.312 ab | 0.9986 | 0.3772 ± 0.001 c | 2.312 ± 0.074 a | 0.9996 |
| HF | 0.2801 ± 0.006 f | 6.525 ± 0.175 a | 0.9987 | 0.3546 ± 0.004 b | 2.706 ± 0.021 a | 0.9992 |
| 8.5% Blend | 0.1496 ± 0.003 b | 25.951 ± 2.342 d | 0.9977 | 0.3412 ± 0.015 b | 4.677 ± 0.431 b | 0.9969 |
| 11.0% Blend | 0.2043 ± 0.002 c | 14.275 ± 0.643 c | 0.9972 | 0.3940 ± 0.008 c | 3.273 ± 0.121 a | 0.9964 |
| 12.2% Blend | 0.2535 ± 0.000 e | 8.370 ± 0.148 ab | 0.9945 | 0.3922 ± 0.005 c | 2.245 ± 0.025 a | 0.9989 |
| Gluten Content (%) | Fractal Dimension (D) | |
|---|---|---|
| Wheat Flours | WS–Gluten Blends | |
| 0 | 2.56 | 2.56 |
| 8.5 | 2.44 | 2.43 |
| 11.0 | 2.31 | 2.27 |
| 12.2 | 2.25 | 2.20 |
| Gluten Content (%) | WVP (g·cm/cm2·s·pa) | |
|---|---|---|
| Wheat Flours | WS–Gluten Blends | |
| 0 | 1.647 ± 0.043 a | 1.647 ± 0.043 a |
| 8.5 | 1.738 ± 0.013 b | 1.687 ± 0.045 ab |
| 11.0 | 1.984 ± 0.043 d | 1.718 ± 0.023 b |
| 12.2 | 2.003 ± 0.052 d | 1.89 ± 0.007 c |
| Sample | Starch Content (wt%) | Gluten Content (wt%) | Fat Content (wt%) |
|---|---|---|---|
| LF | 74.6 | 8.5 | 1.0 |
| MF | 73.5 | 11.0 | 1.6 |
| HF | 73.0 | 12.2 | 1.6 |
| Gluten | 12.5 | 80.6 | 0.8 |
| Gluten Content (%) | Thickness (mm) | |
|---|---|---|
| Wheat Flour | WS–Gluten Blend | |
| 0 | 0.074 ± 0.002 a | 0.074 ± 0.002 a |
| 8.5 | 0.083 ± 0.003 b | 0.096 ± 0.001 d |
| 11.0 | 0.091 ± 0.004 c | 0.102 ± 0.003 e |
| 12.2 | 0.102 ± 0.002 e | 0.109 ± 0.002 f |
Publisher’s Note: MDPI stays neutral with regard to jurisdictional claims in published maps and institutional affiliations. |
© 2022 by the authors. Licensee MDPI, Basel, Switzerland. This article is an open access article distributed under the terms and conditions of the Creative Commons Attribution (CC BY) license (https://creativecommons.org/licenses/by/4.0/).
Share and Cite
Wang, J.; Sun, X.; Xu, X.; Sun, Q.; Li, M.; Wang, Y.; Xie, F. Wheat Flour-Based Edible Films: Effect of Gluten on the Rheological Properties, Structure, and Film Characteristics. Int. J. Mol. Sci. 2022, 23, 11668. https://doi.org/10.3390/ijms231911668
Wang J, Sun X, Xu X, Sun Q, Li M, Wang Y, Xie F. Wheat Flour-Based Edible Films: Effect of Gluten on the Rheological Properties, Structure, and Film Characteristics. International Journal of Molecular Sciences. 2022; 23(19):11668. https://doi.org/10.3390/ijms231911668
Chicago/Turabian StyleWang, Jing, Xinyu Sun, Xingfeng Xu, Qingjie Sun, Man Li, Yanfei Wang, and Fengwei Xie. 2022. "Wheat Flour-Based Edible Films: Effect of Gluten on the Rheological Properties, Structure, and Film Characteristics" International Journal of Molecular Sciences 23, no. 19: 11668. https://doi.org/10.3390/ijms231911668
APA StyleWang, J., Sun, X., Xu, X., Sun, Q., Li, M., Wang, Y., & Xie, F. (2022). Wheat Flour-Based Edible Films: Effect of Gluten on the Rheological Properties, Structure, and Film Characteristics. International Journal of Molecular Sciences, 23(19), 11668. https://doi.org/10.3390/ijms231911668