
Glucogallin Attenuates the LPS-Induced Signaling in Macrophages and Protects Mice against Sepsis
 , ,
, ,  , , ,
, , ,
Abstract
:1. Introduction
2. Results
2.1. Cell Cytotoxicity Assay
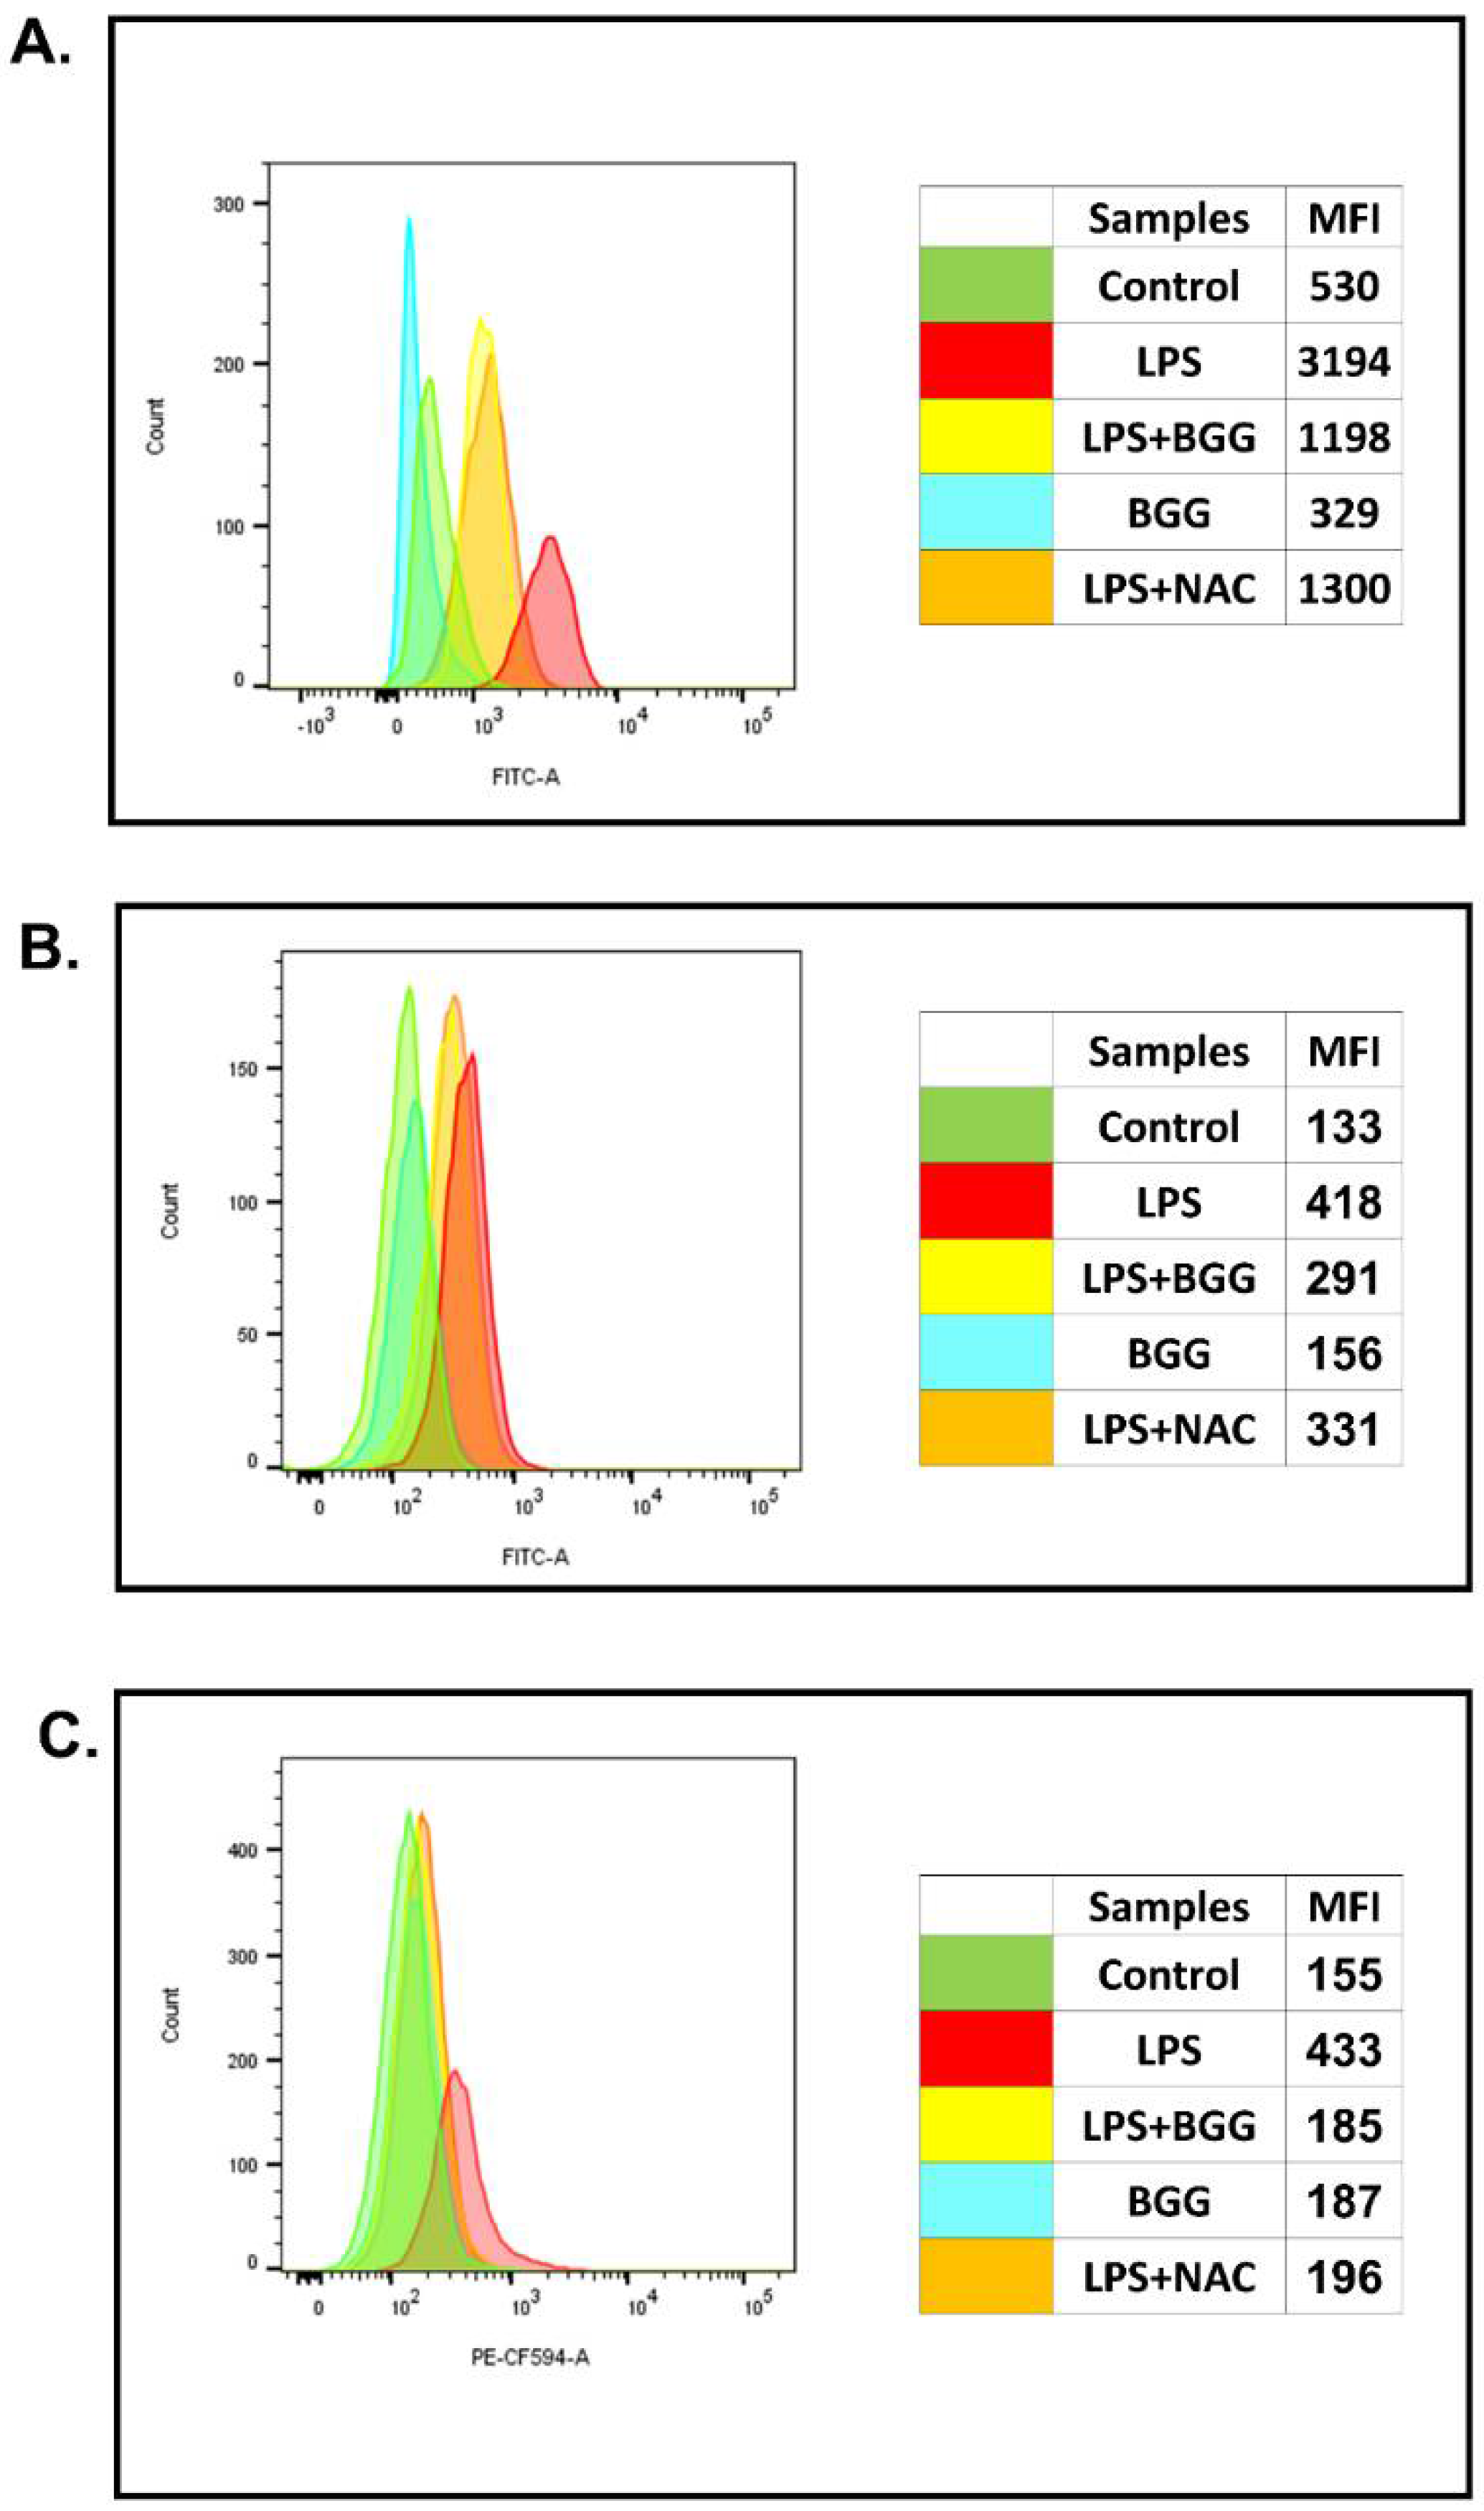
2.2. Effect of BGG on ROS Production in the Macrophage with and without LPS Induction
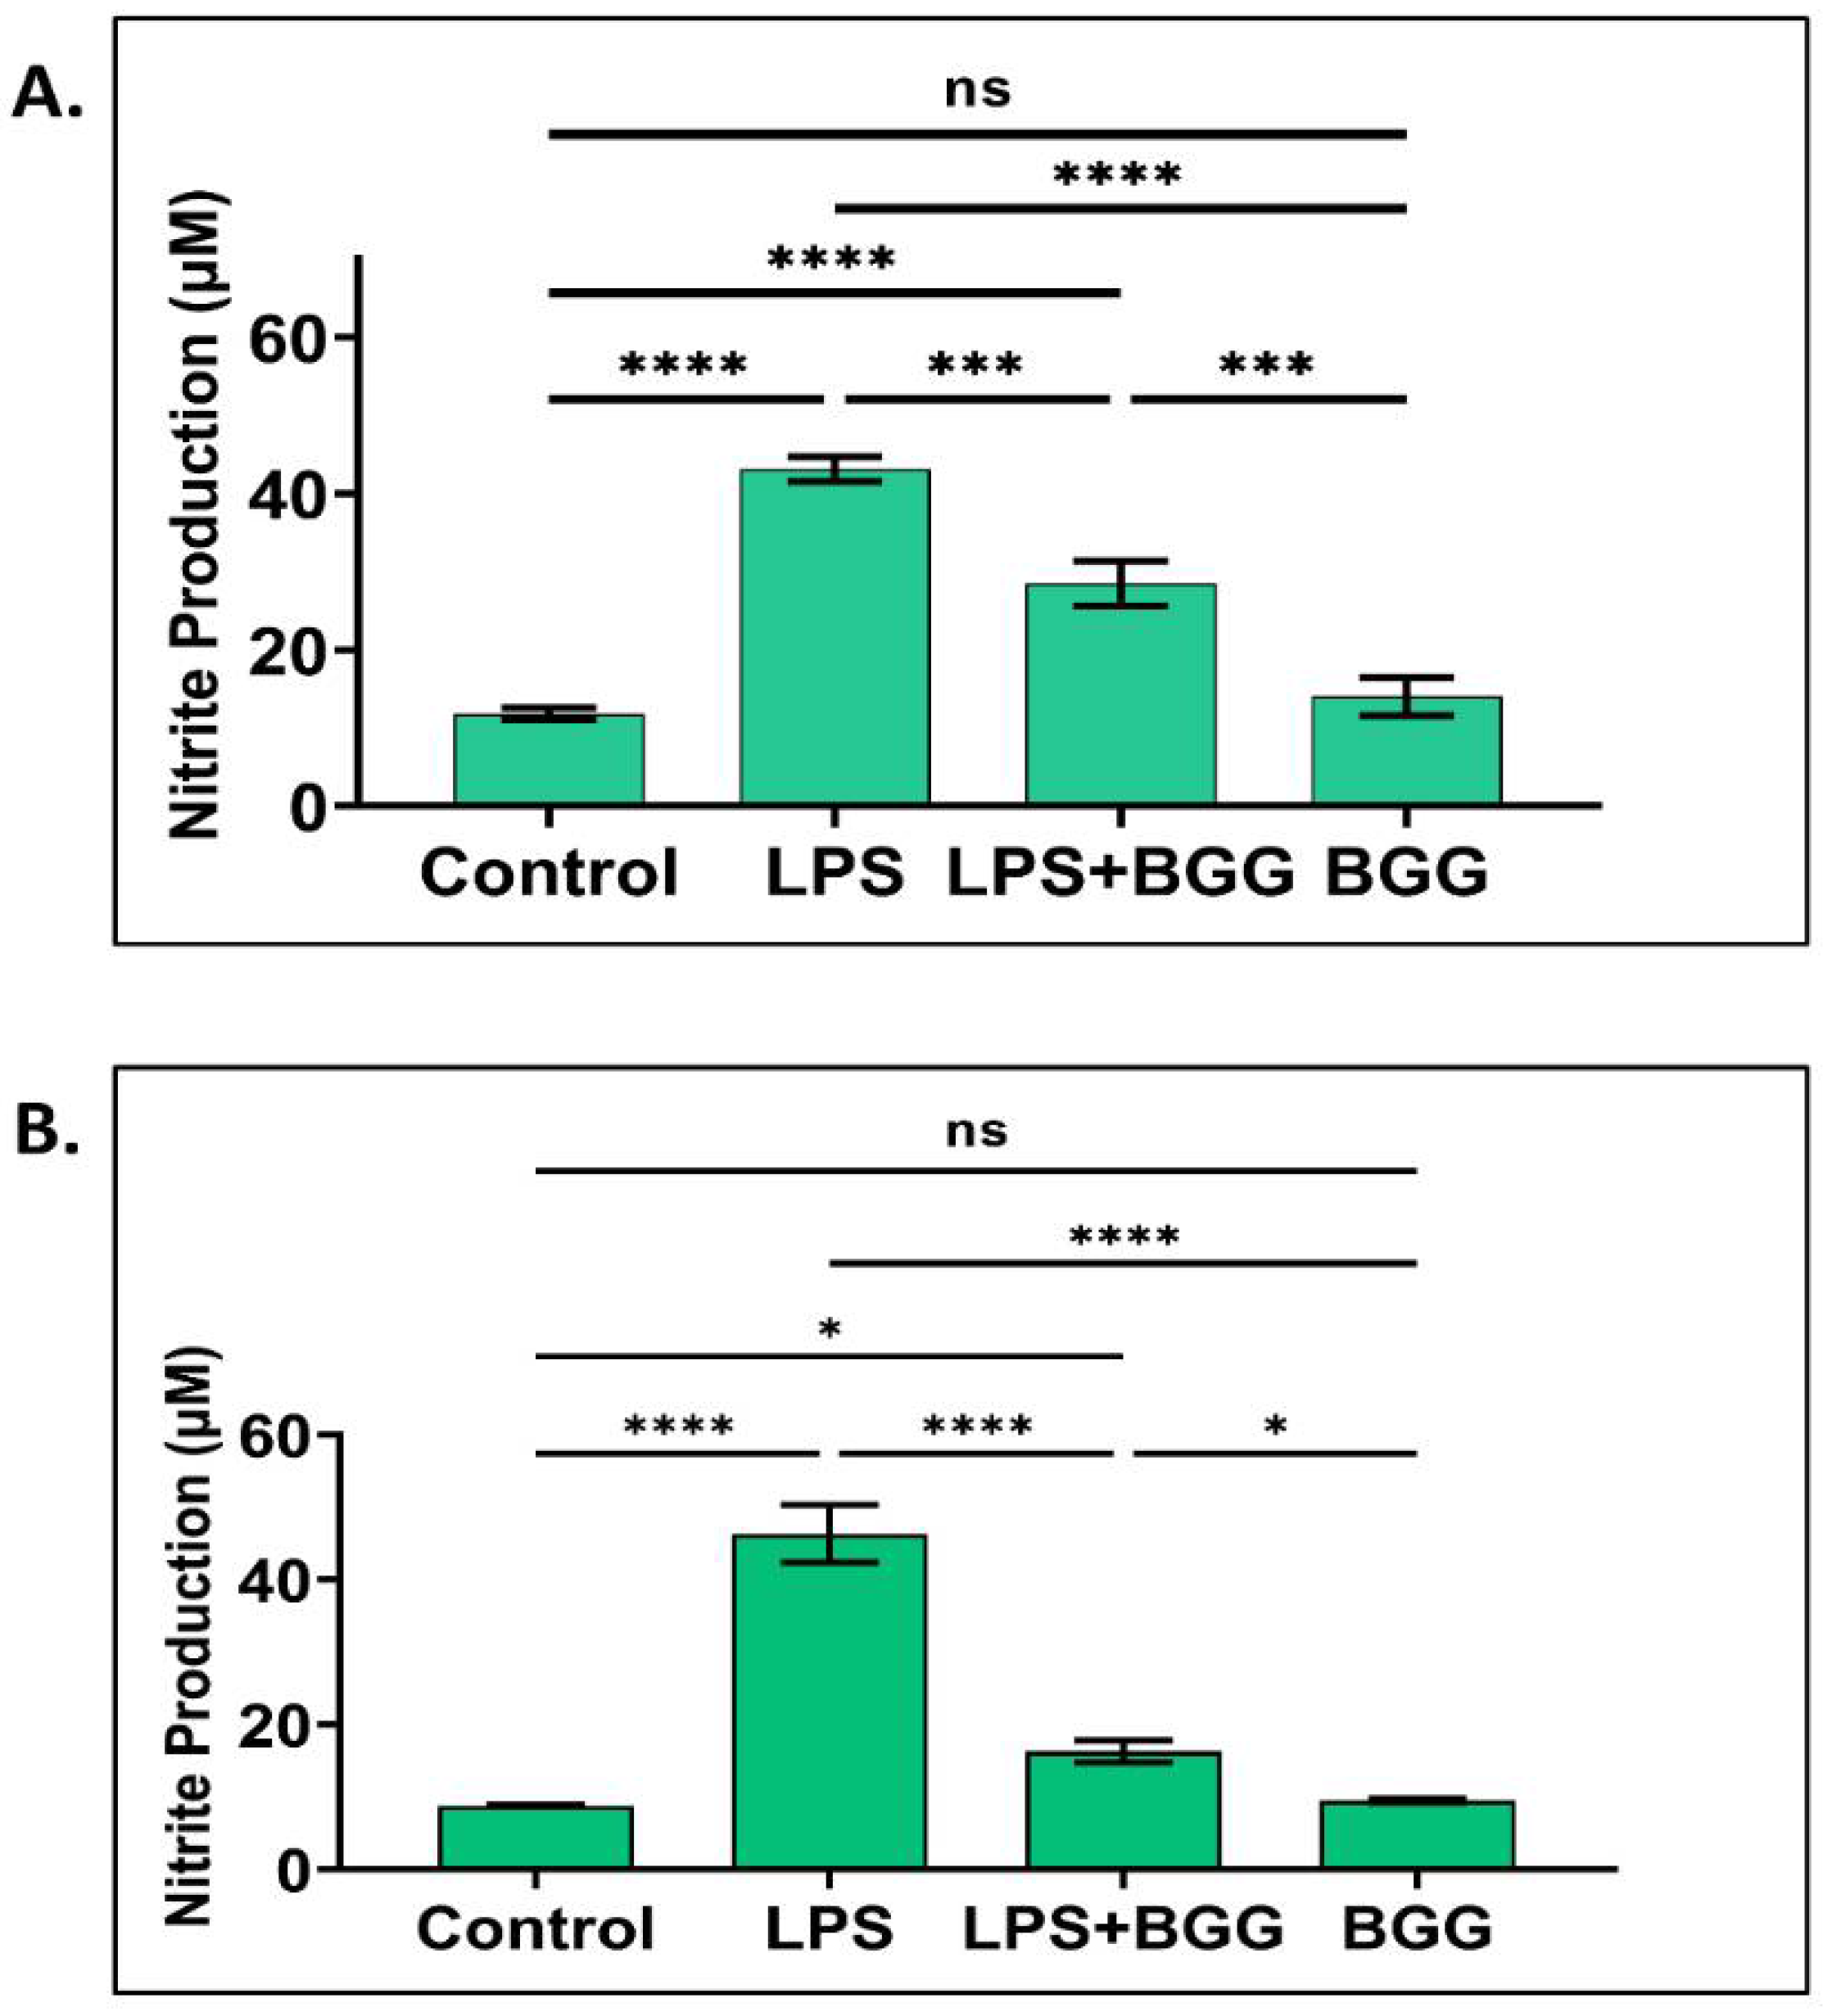
2.3. Attenuation of NO Production by BGG in the LPS-Induced Macrophages
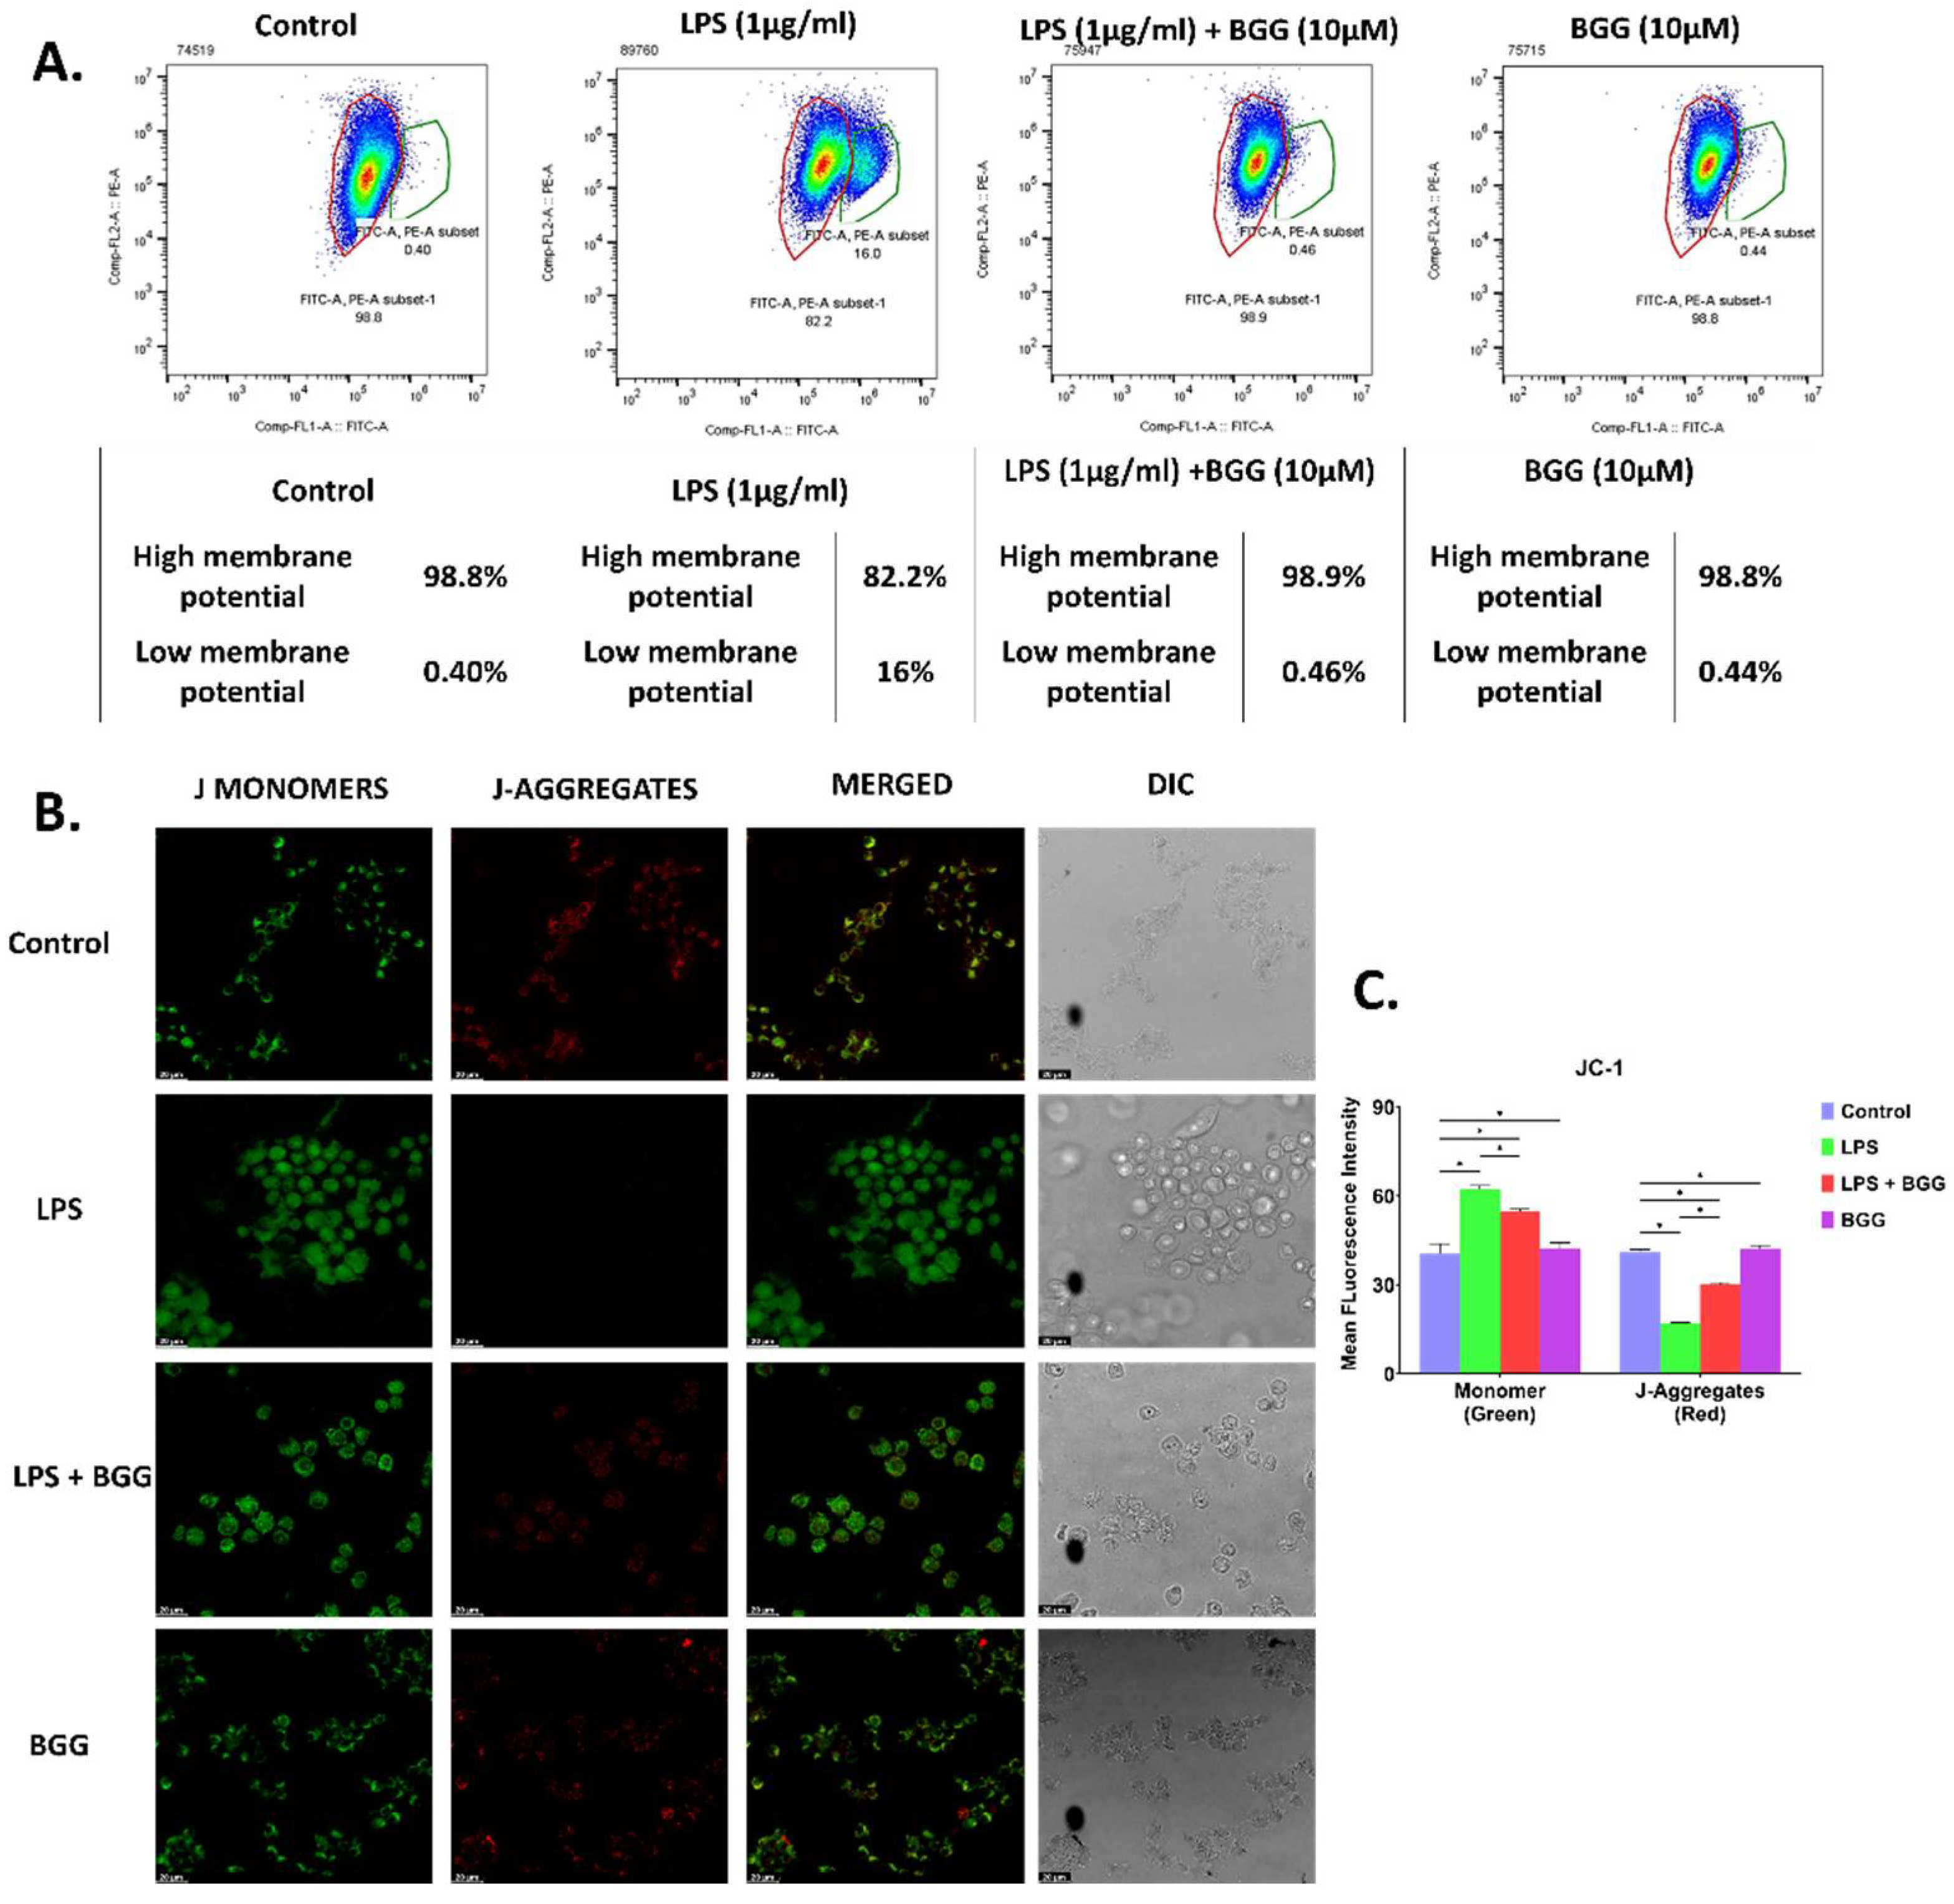
2.4. BGG Attenuates Mitochondrial Membrane Potential—Damaged by LPS
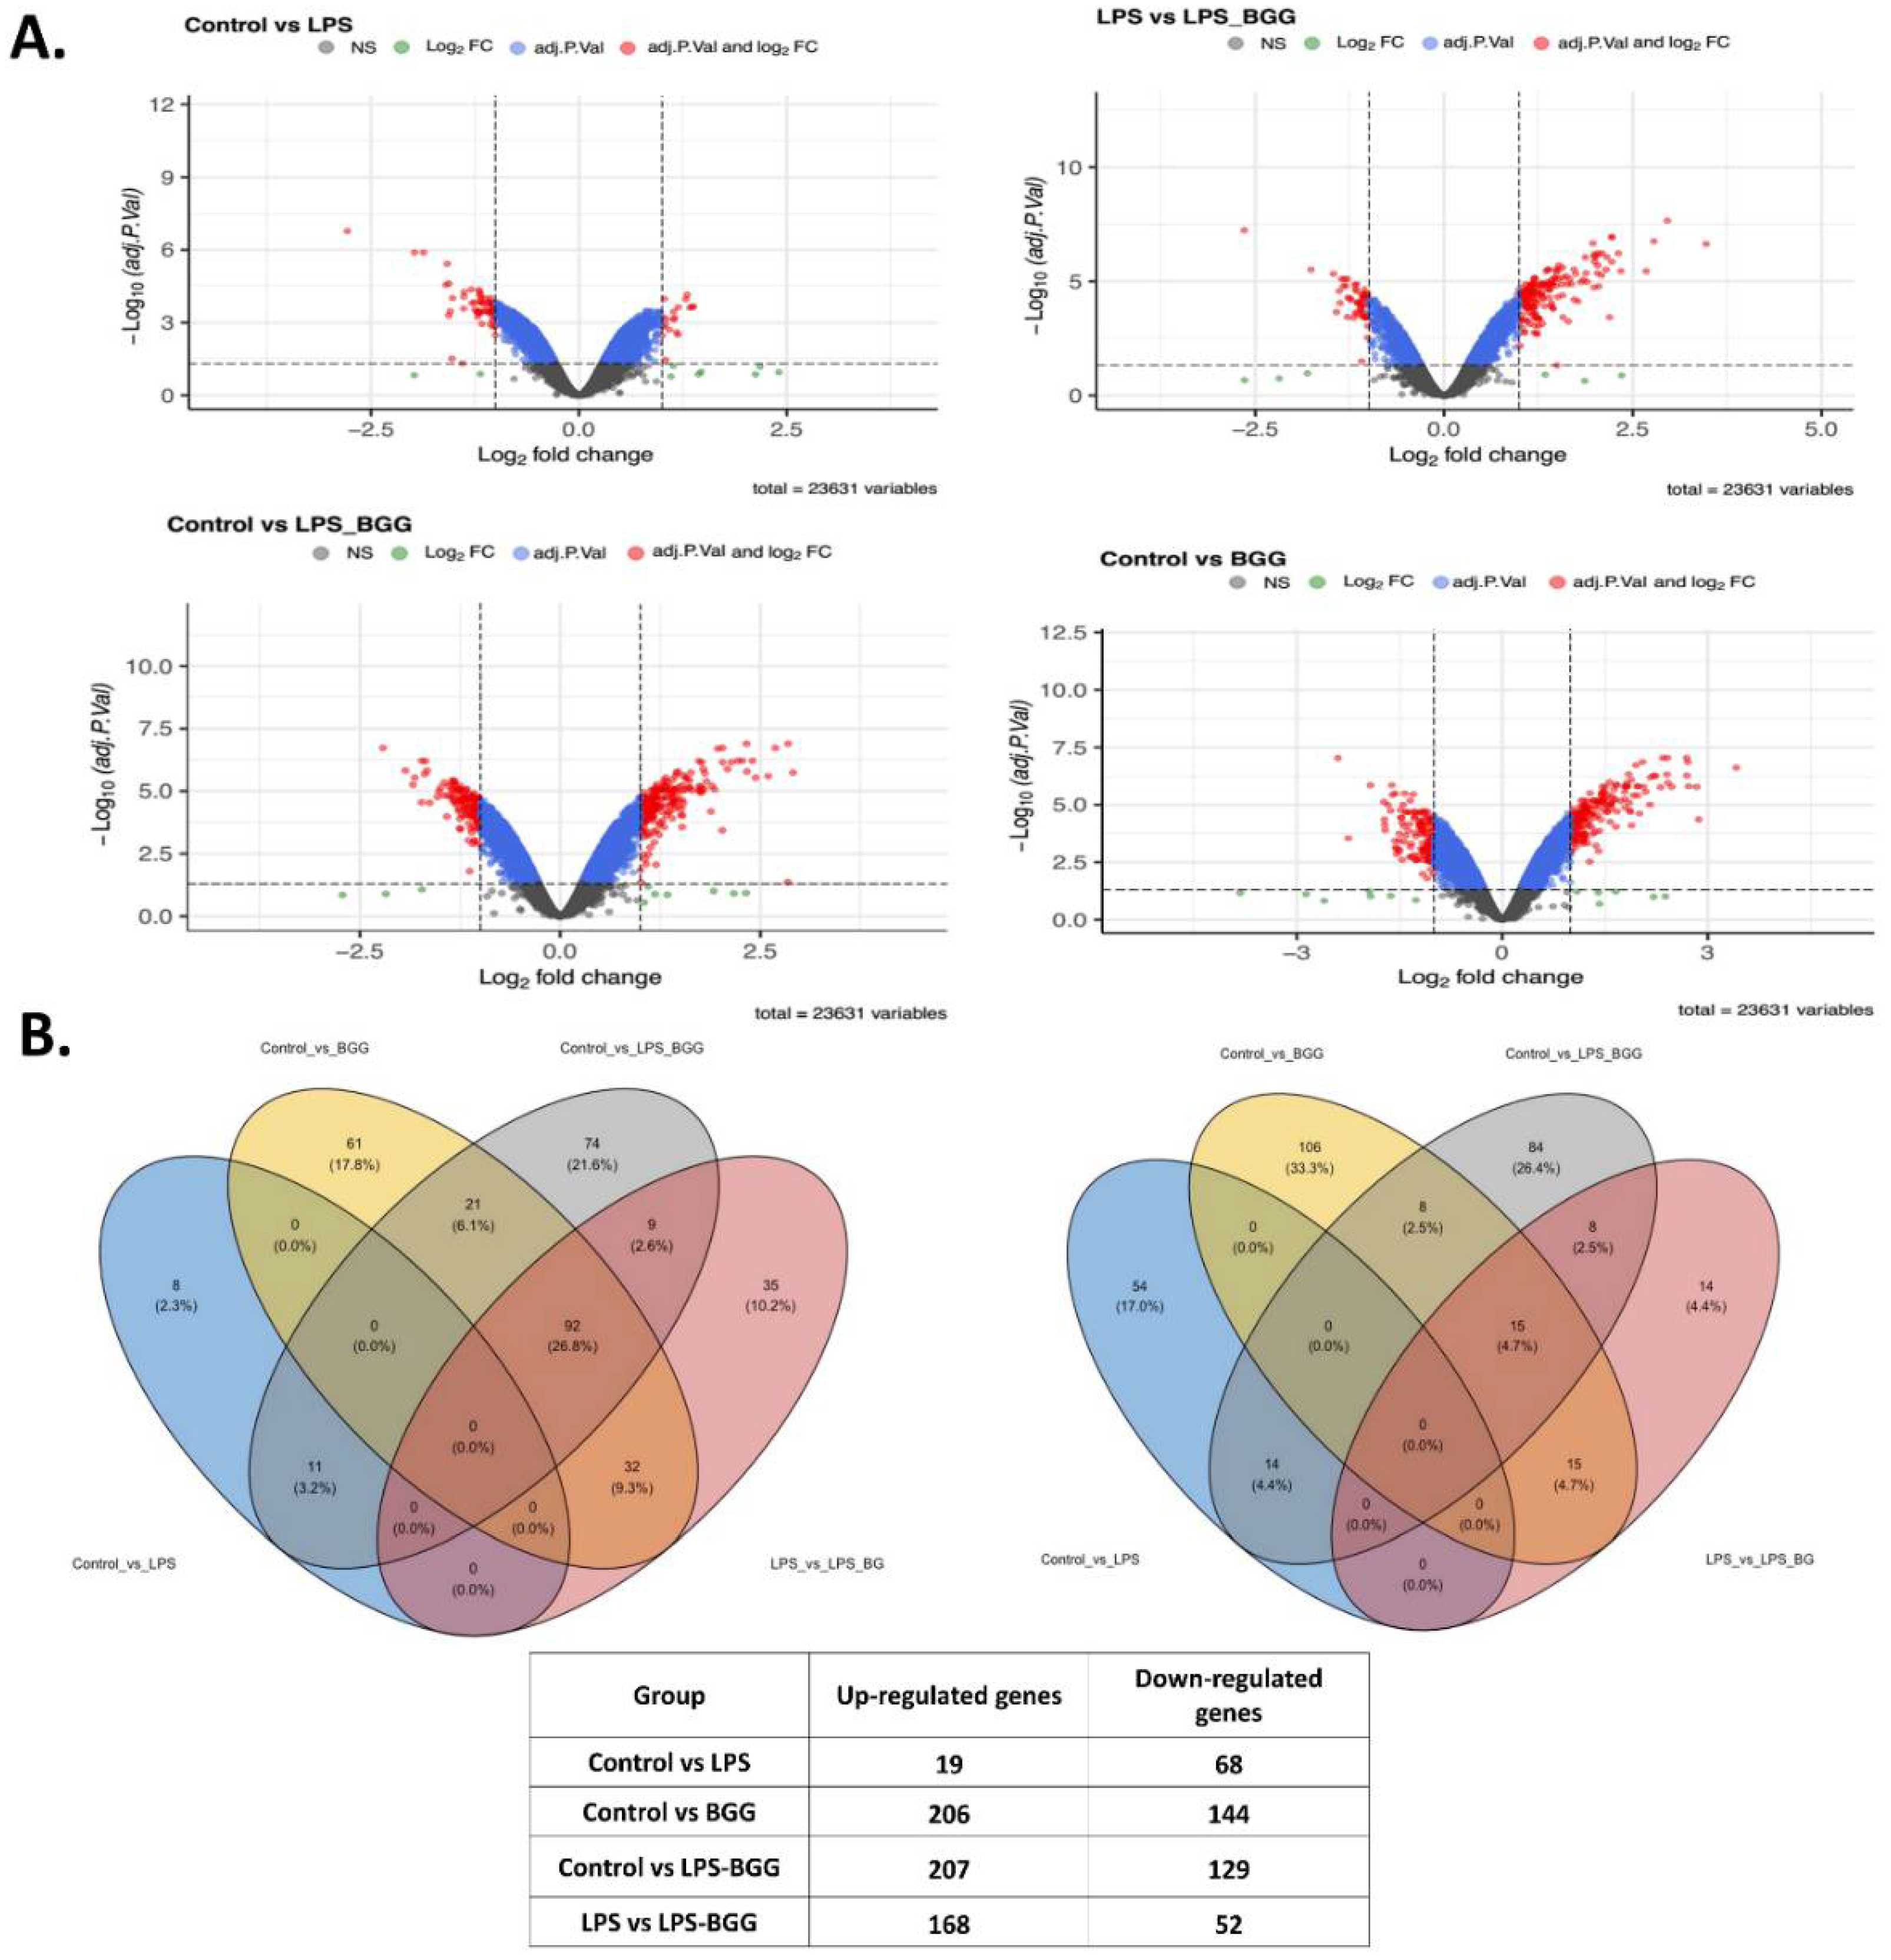
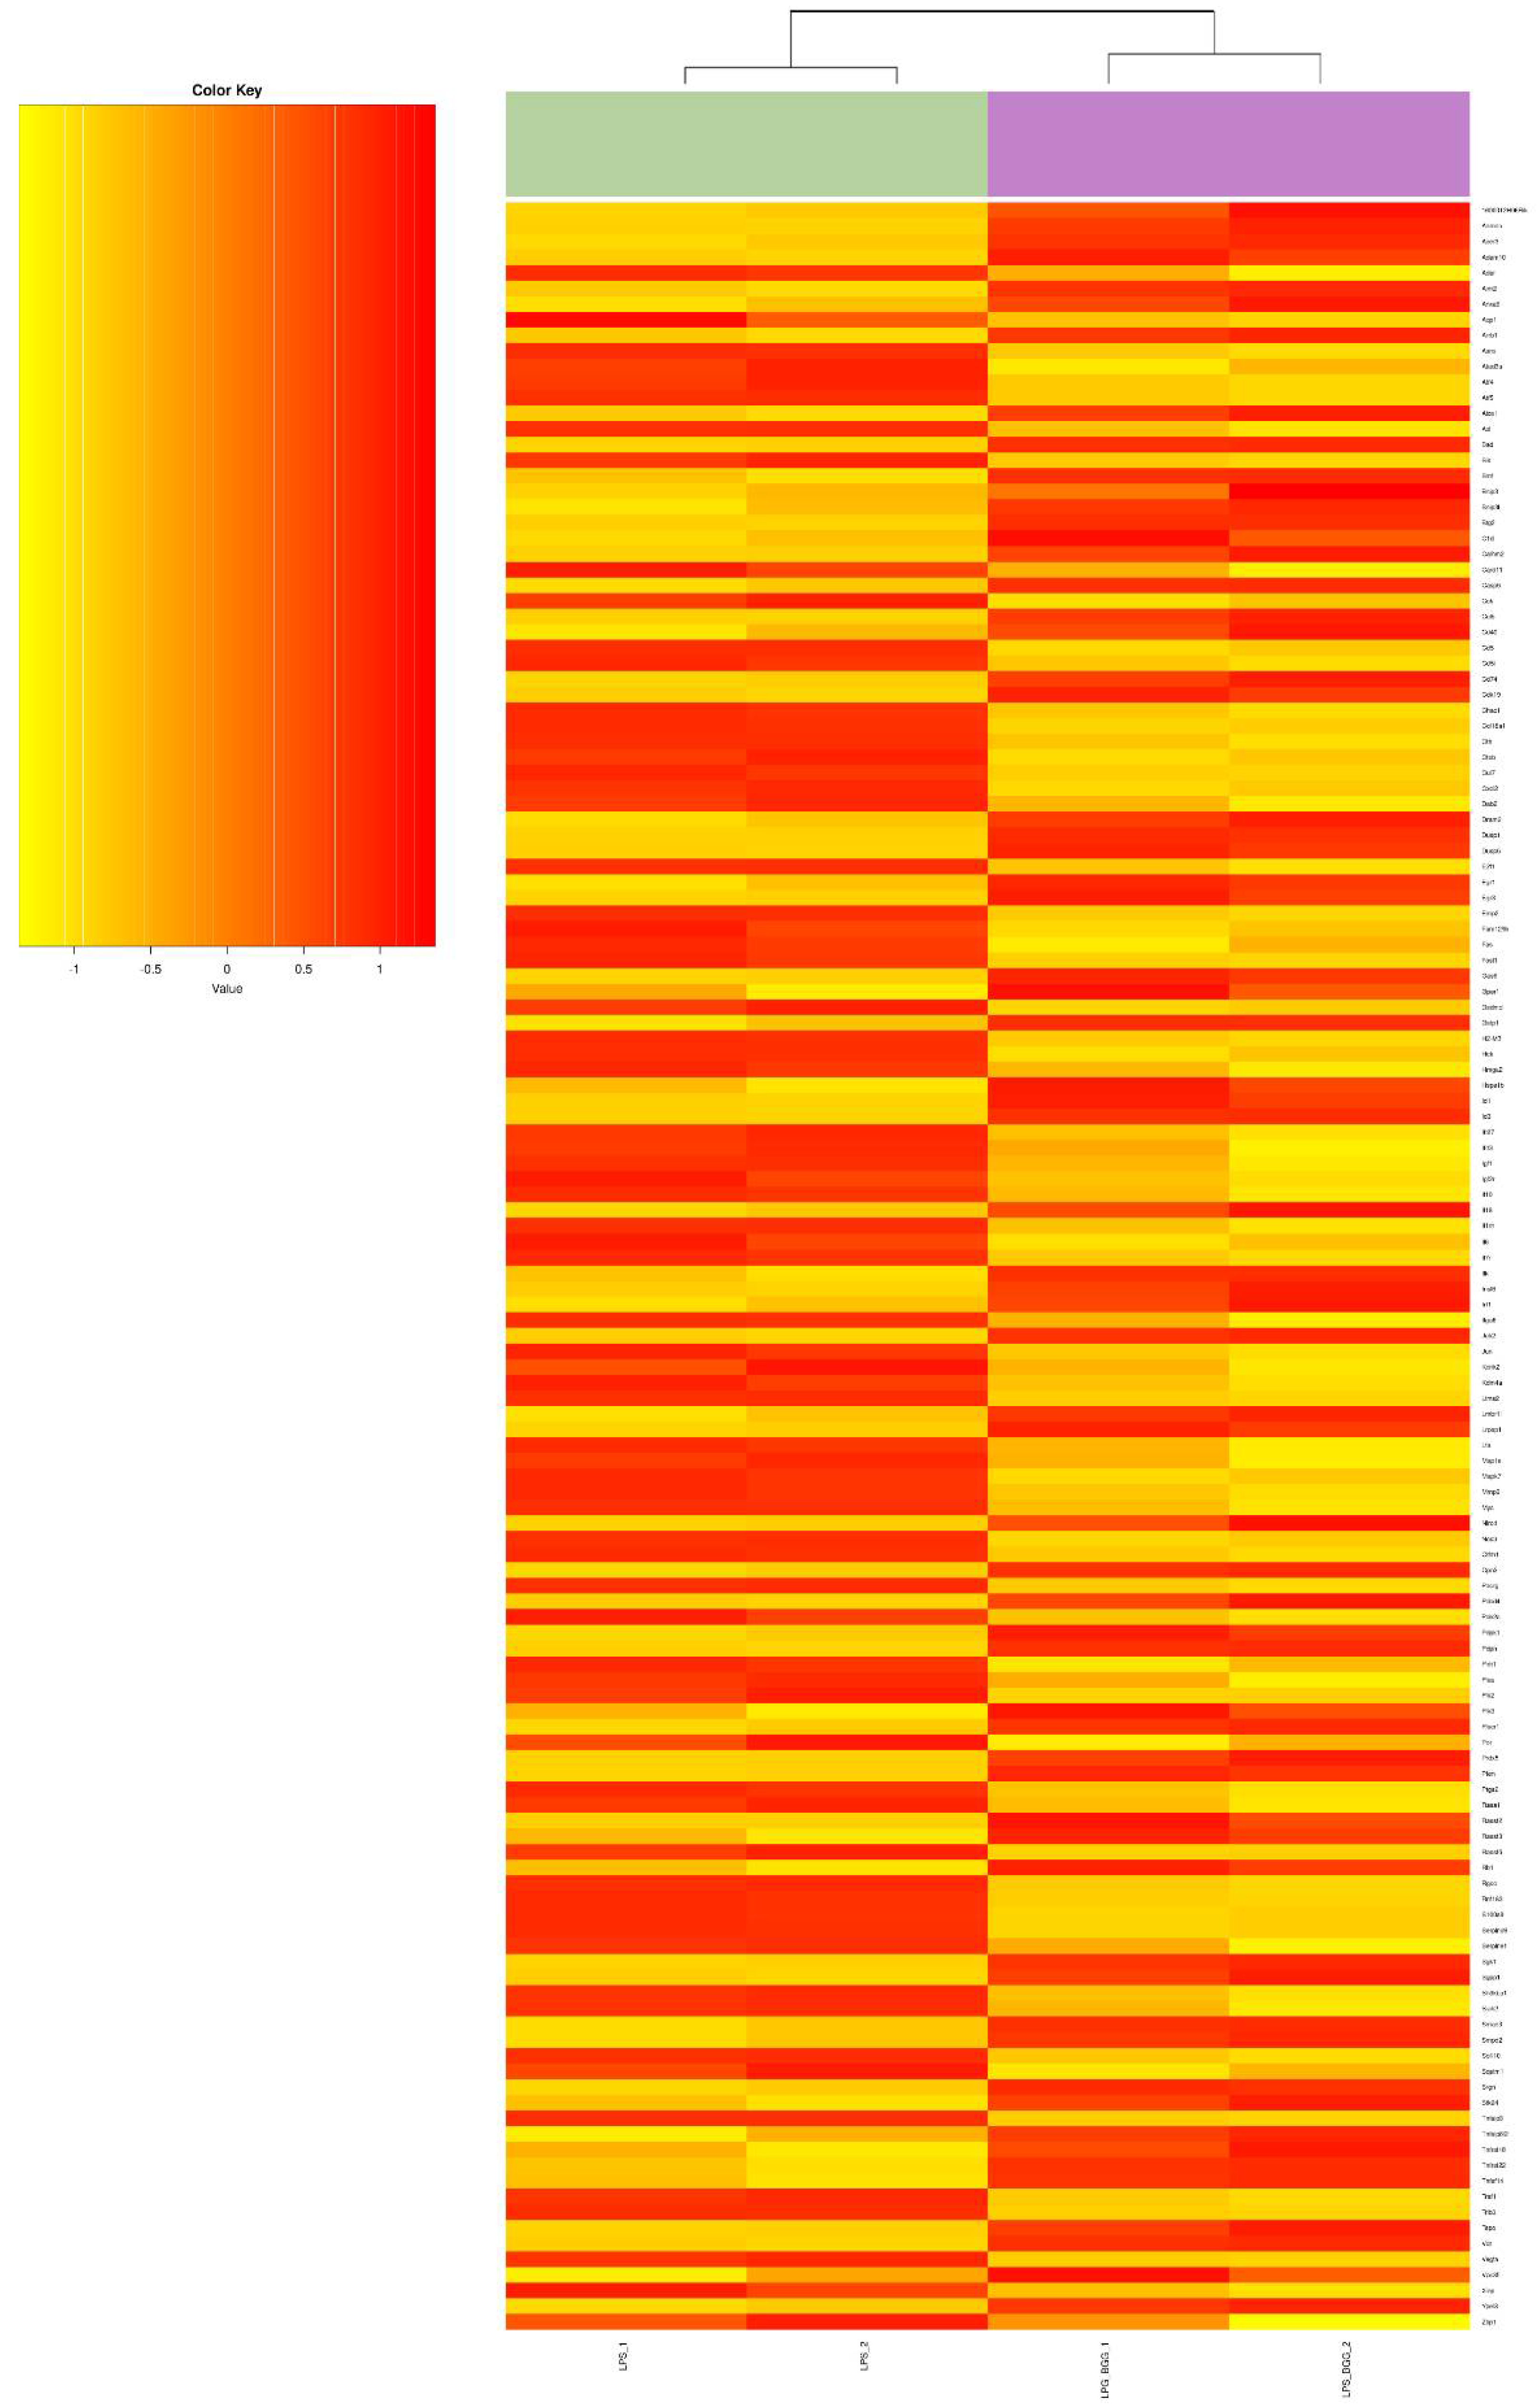
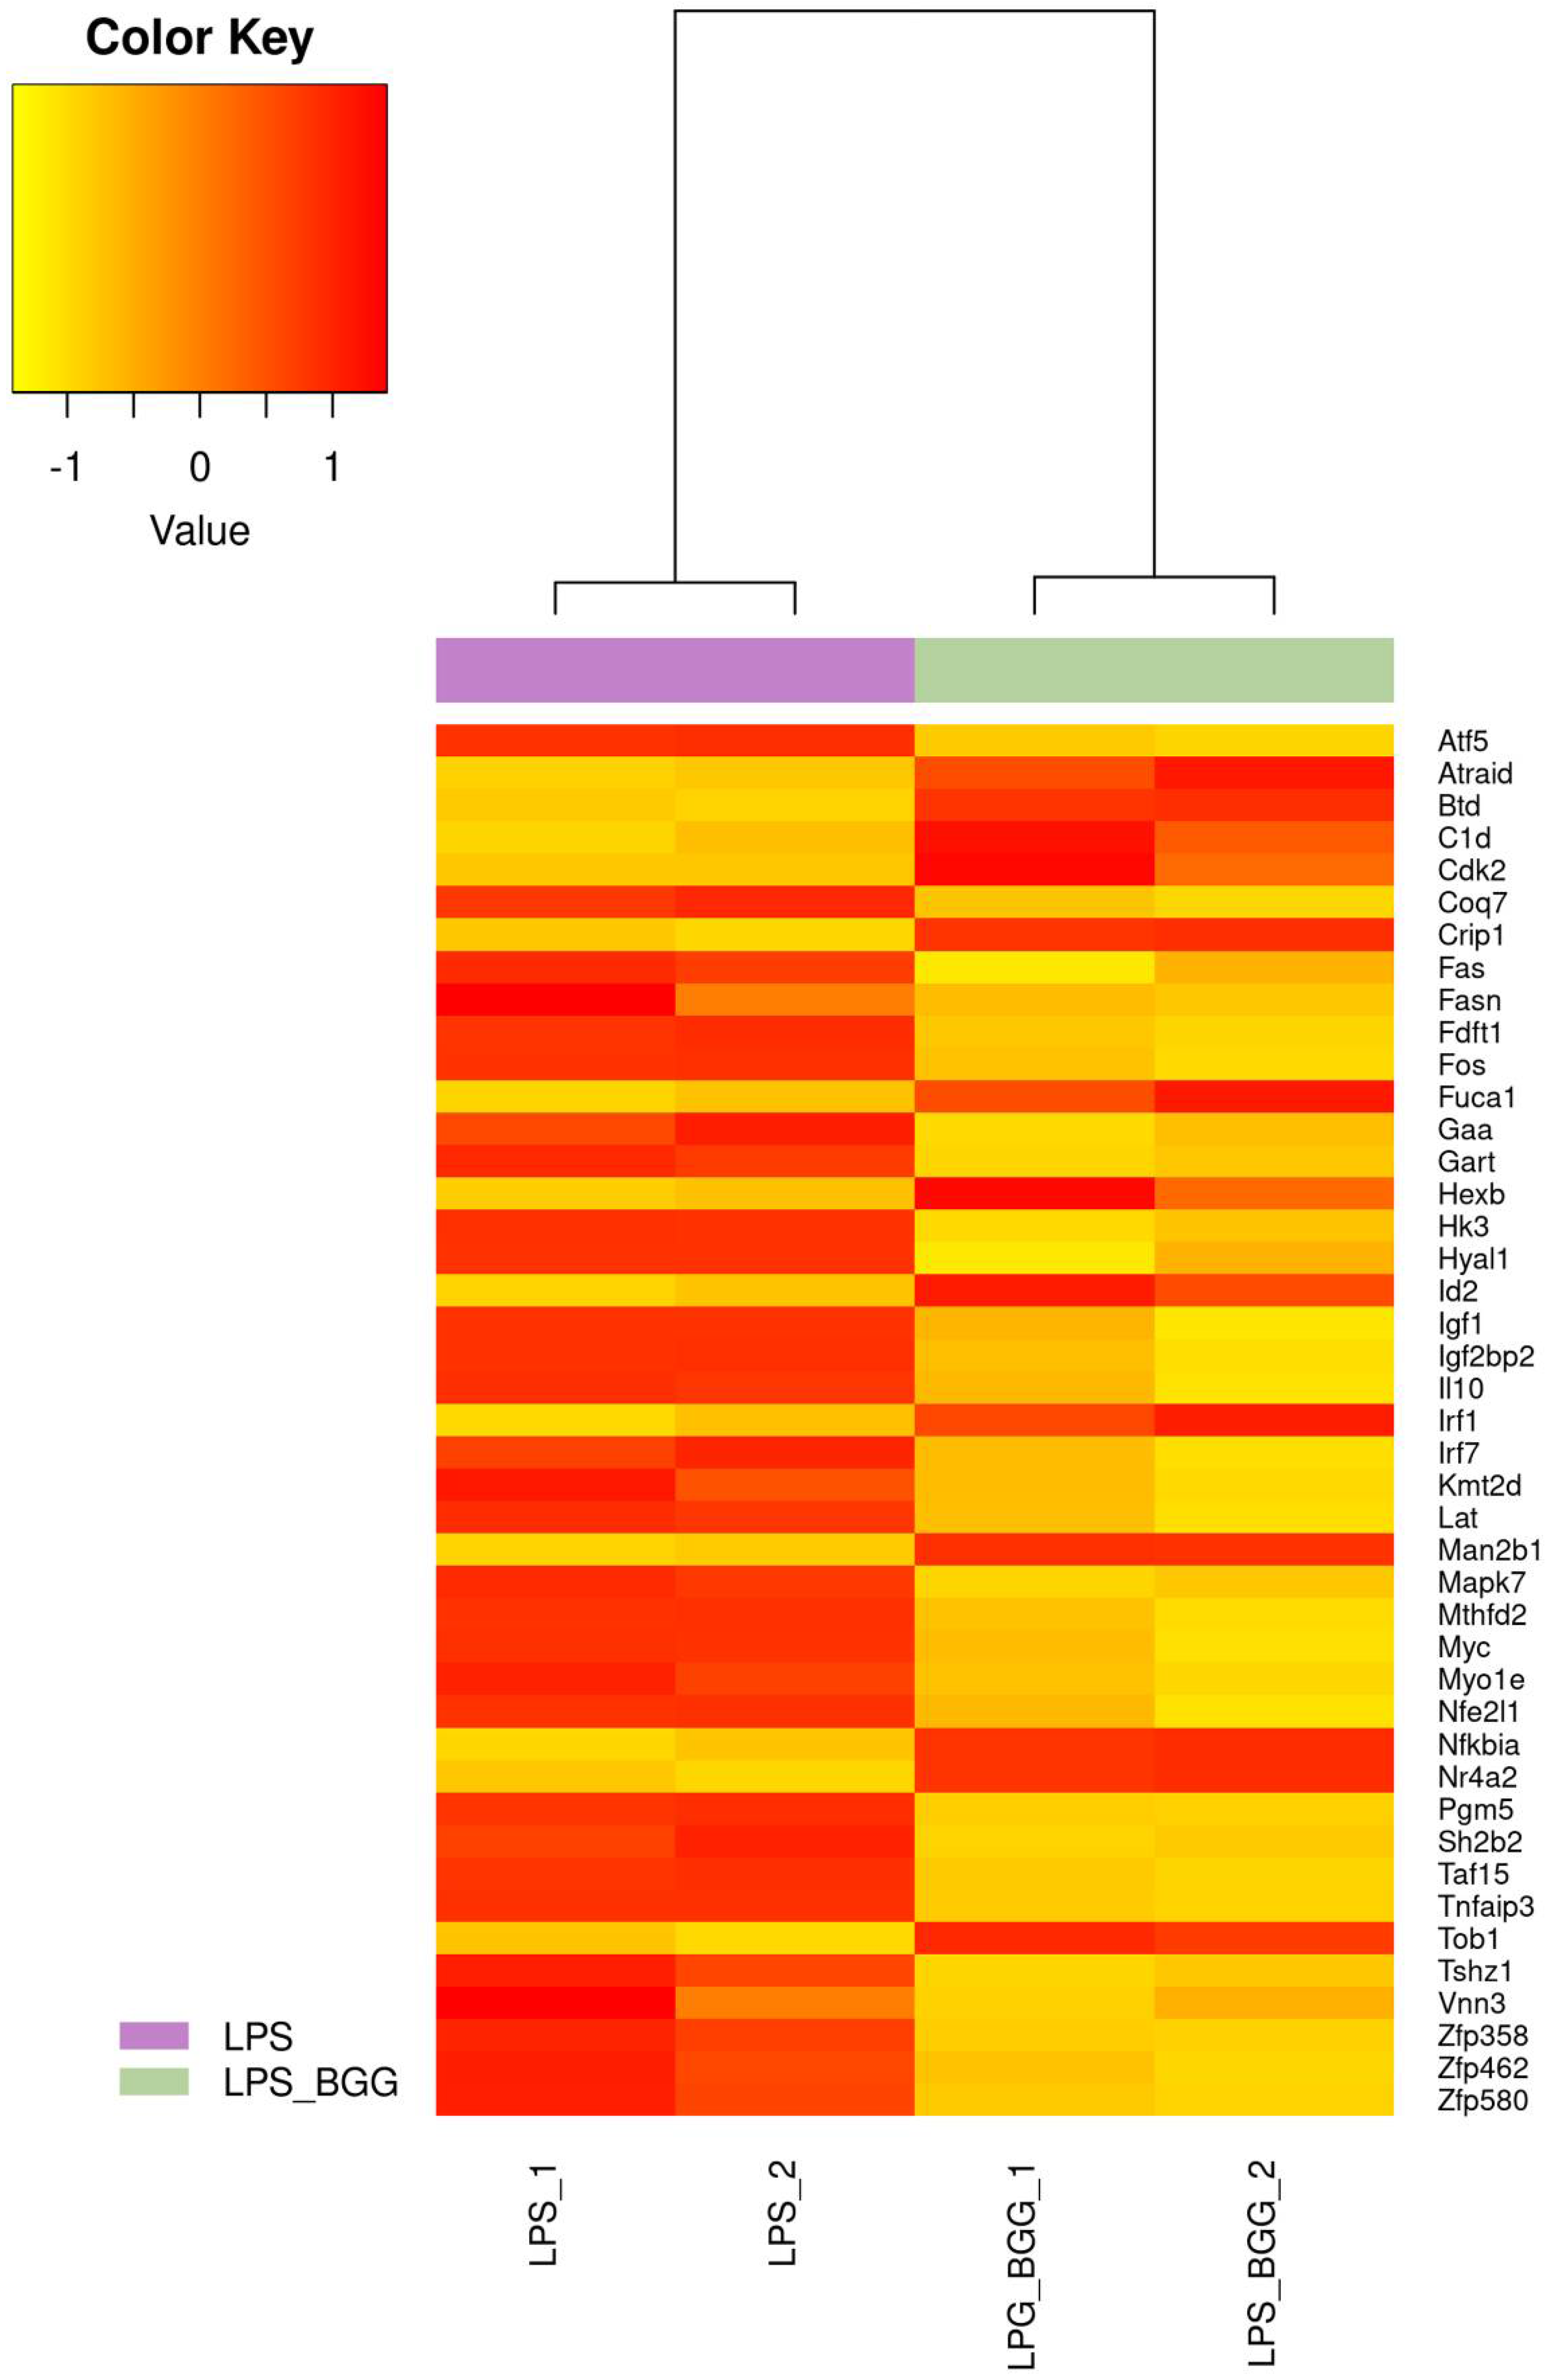
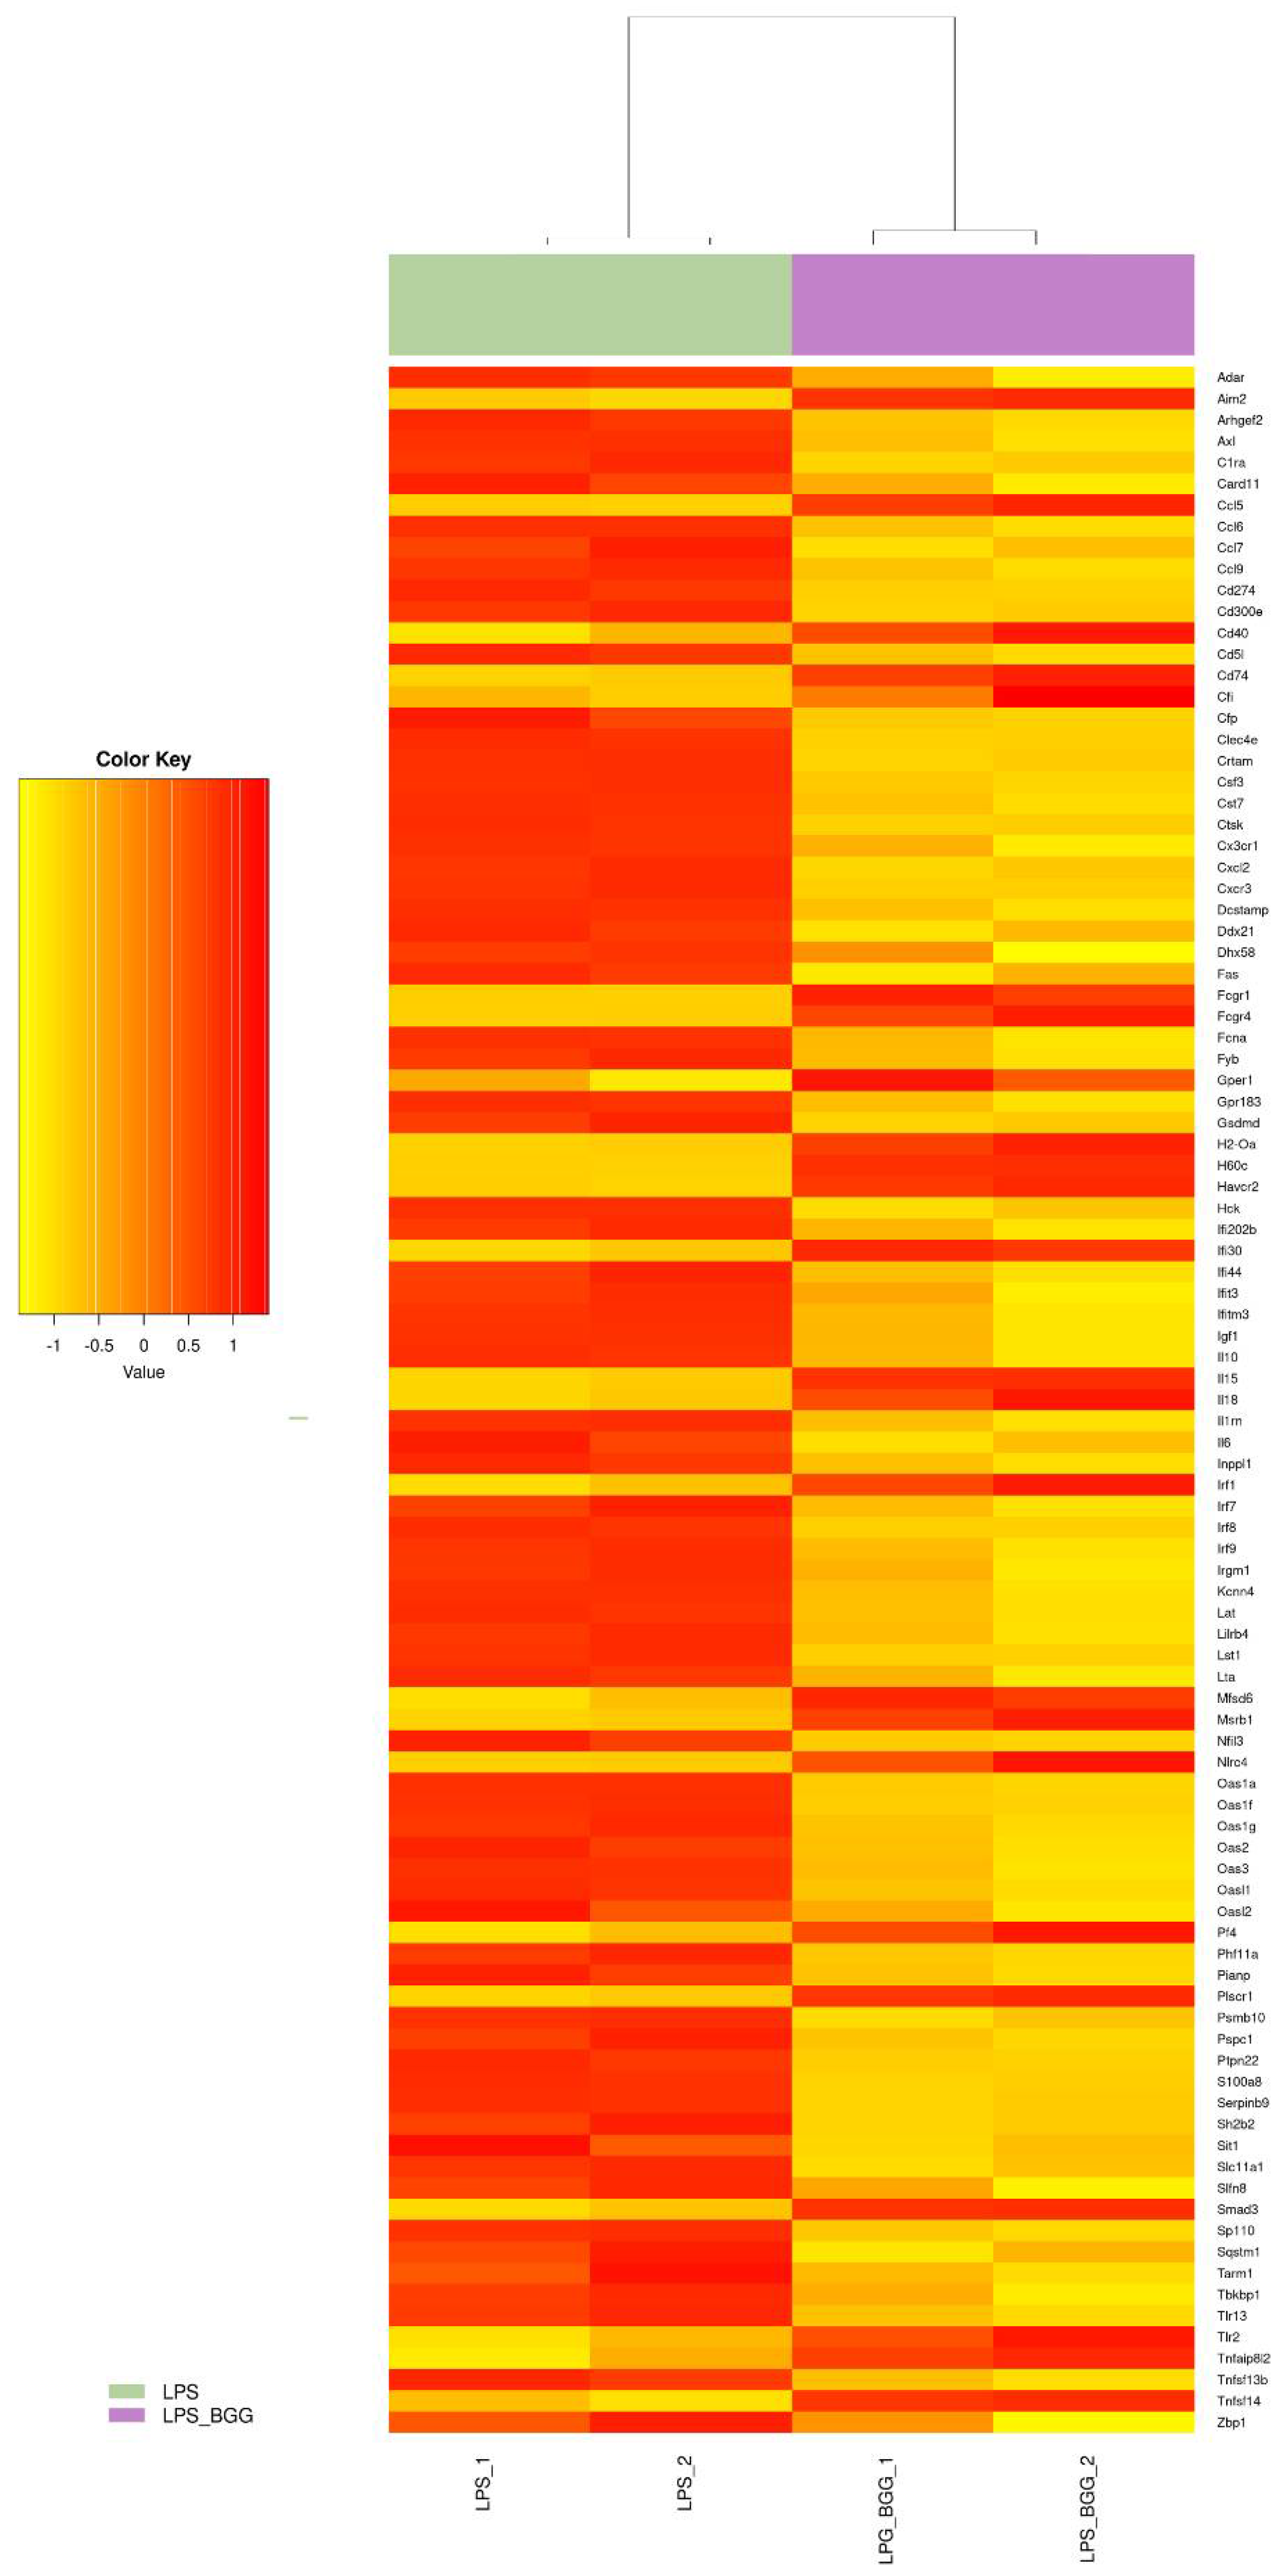
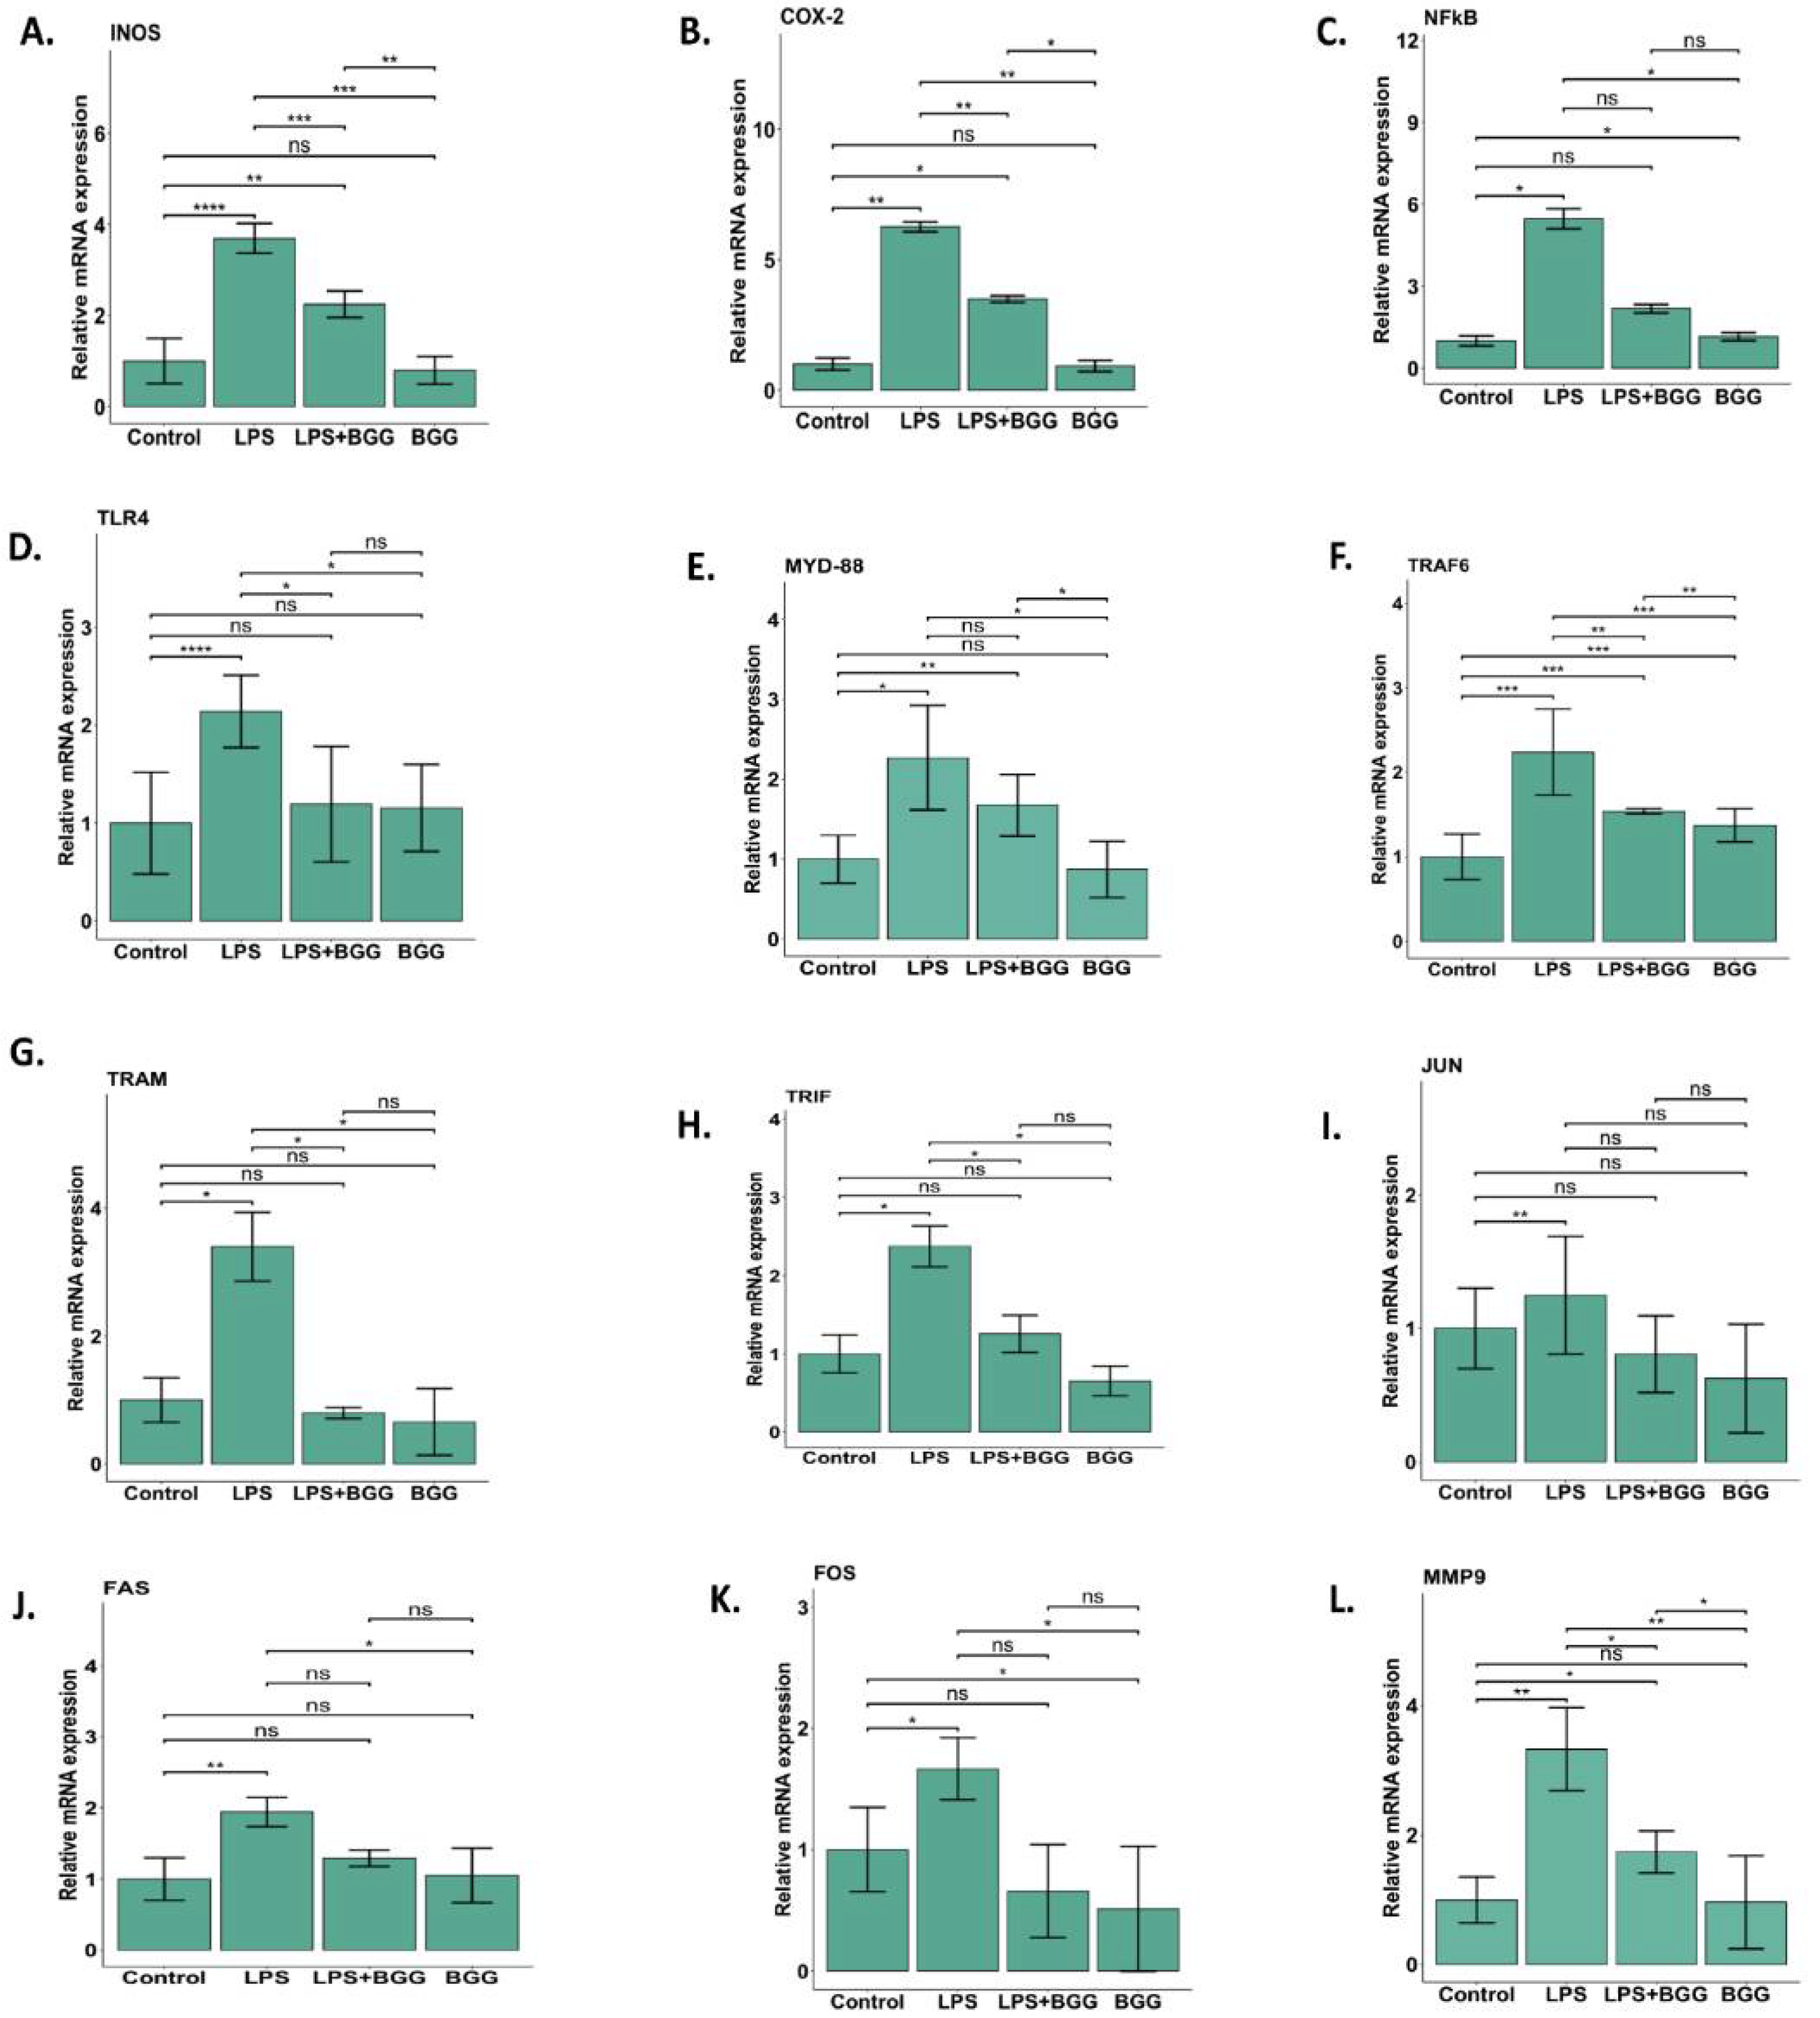
2.5. Effect of BGG on LPS-Stimulated Gene Expression in RAW 264.7 Macrophages Cells
2.6. Validation of Microarray Results by qPCR
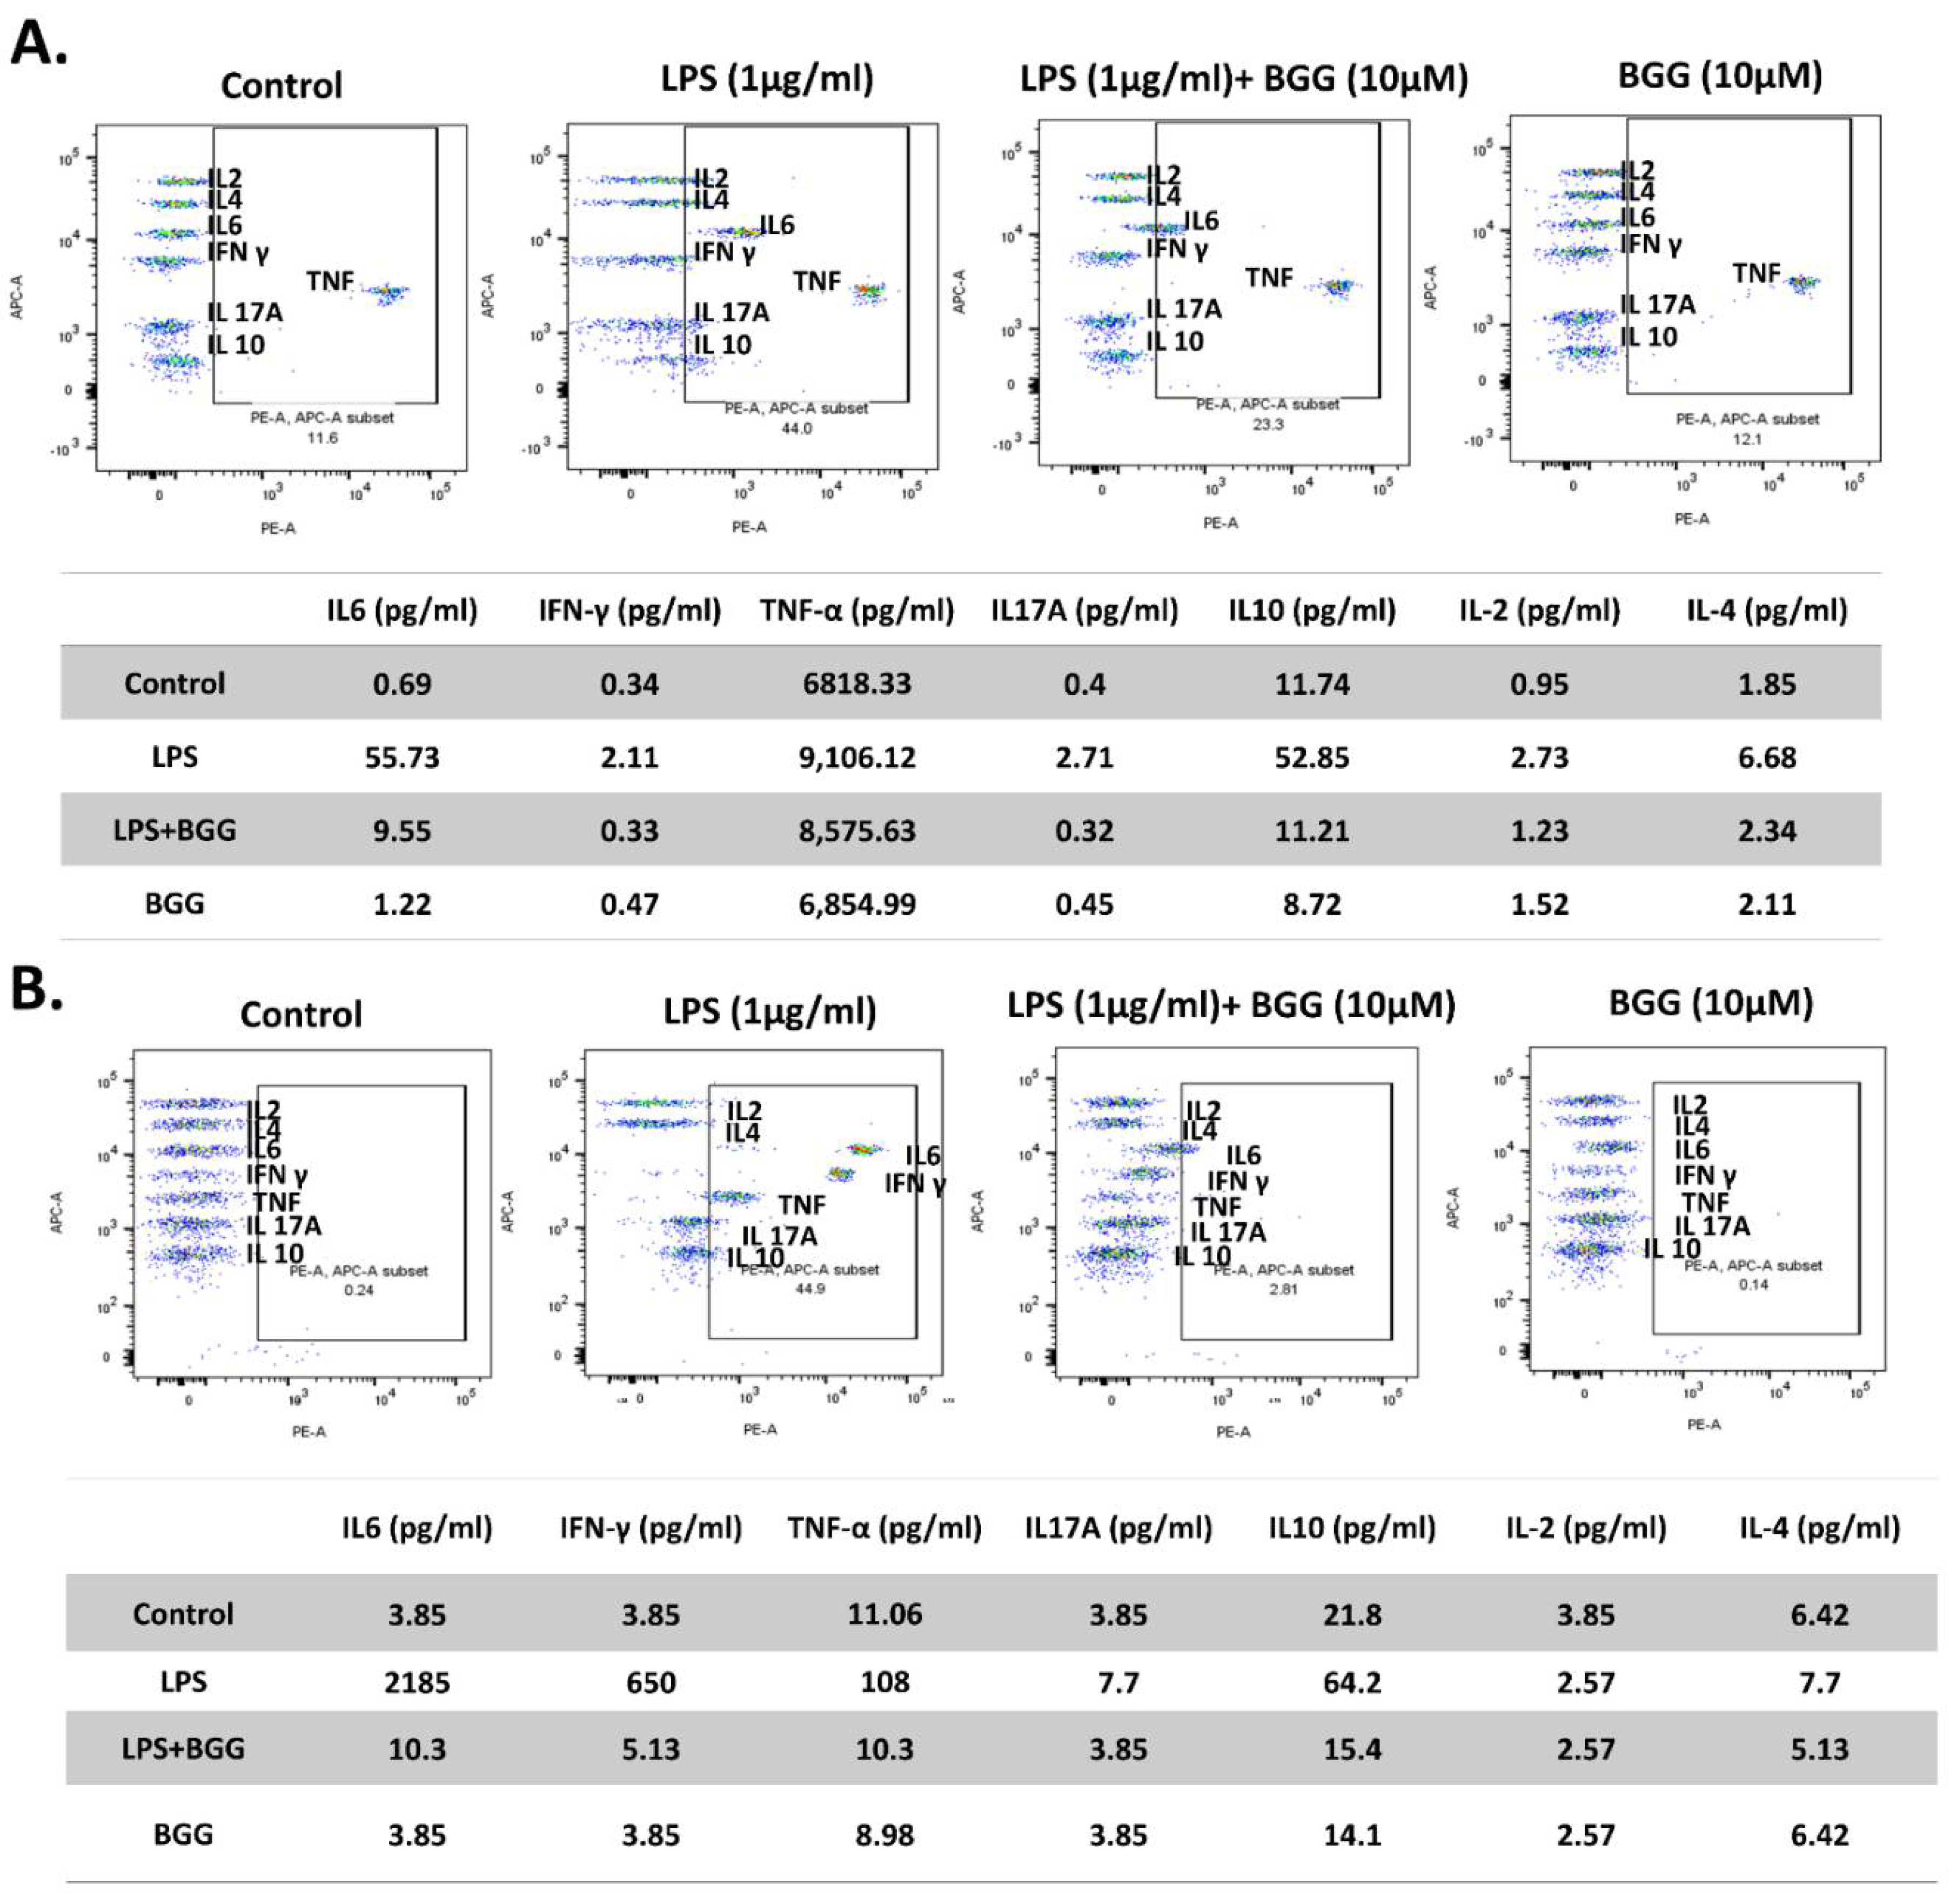
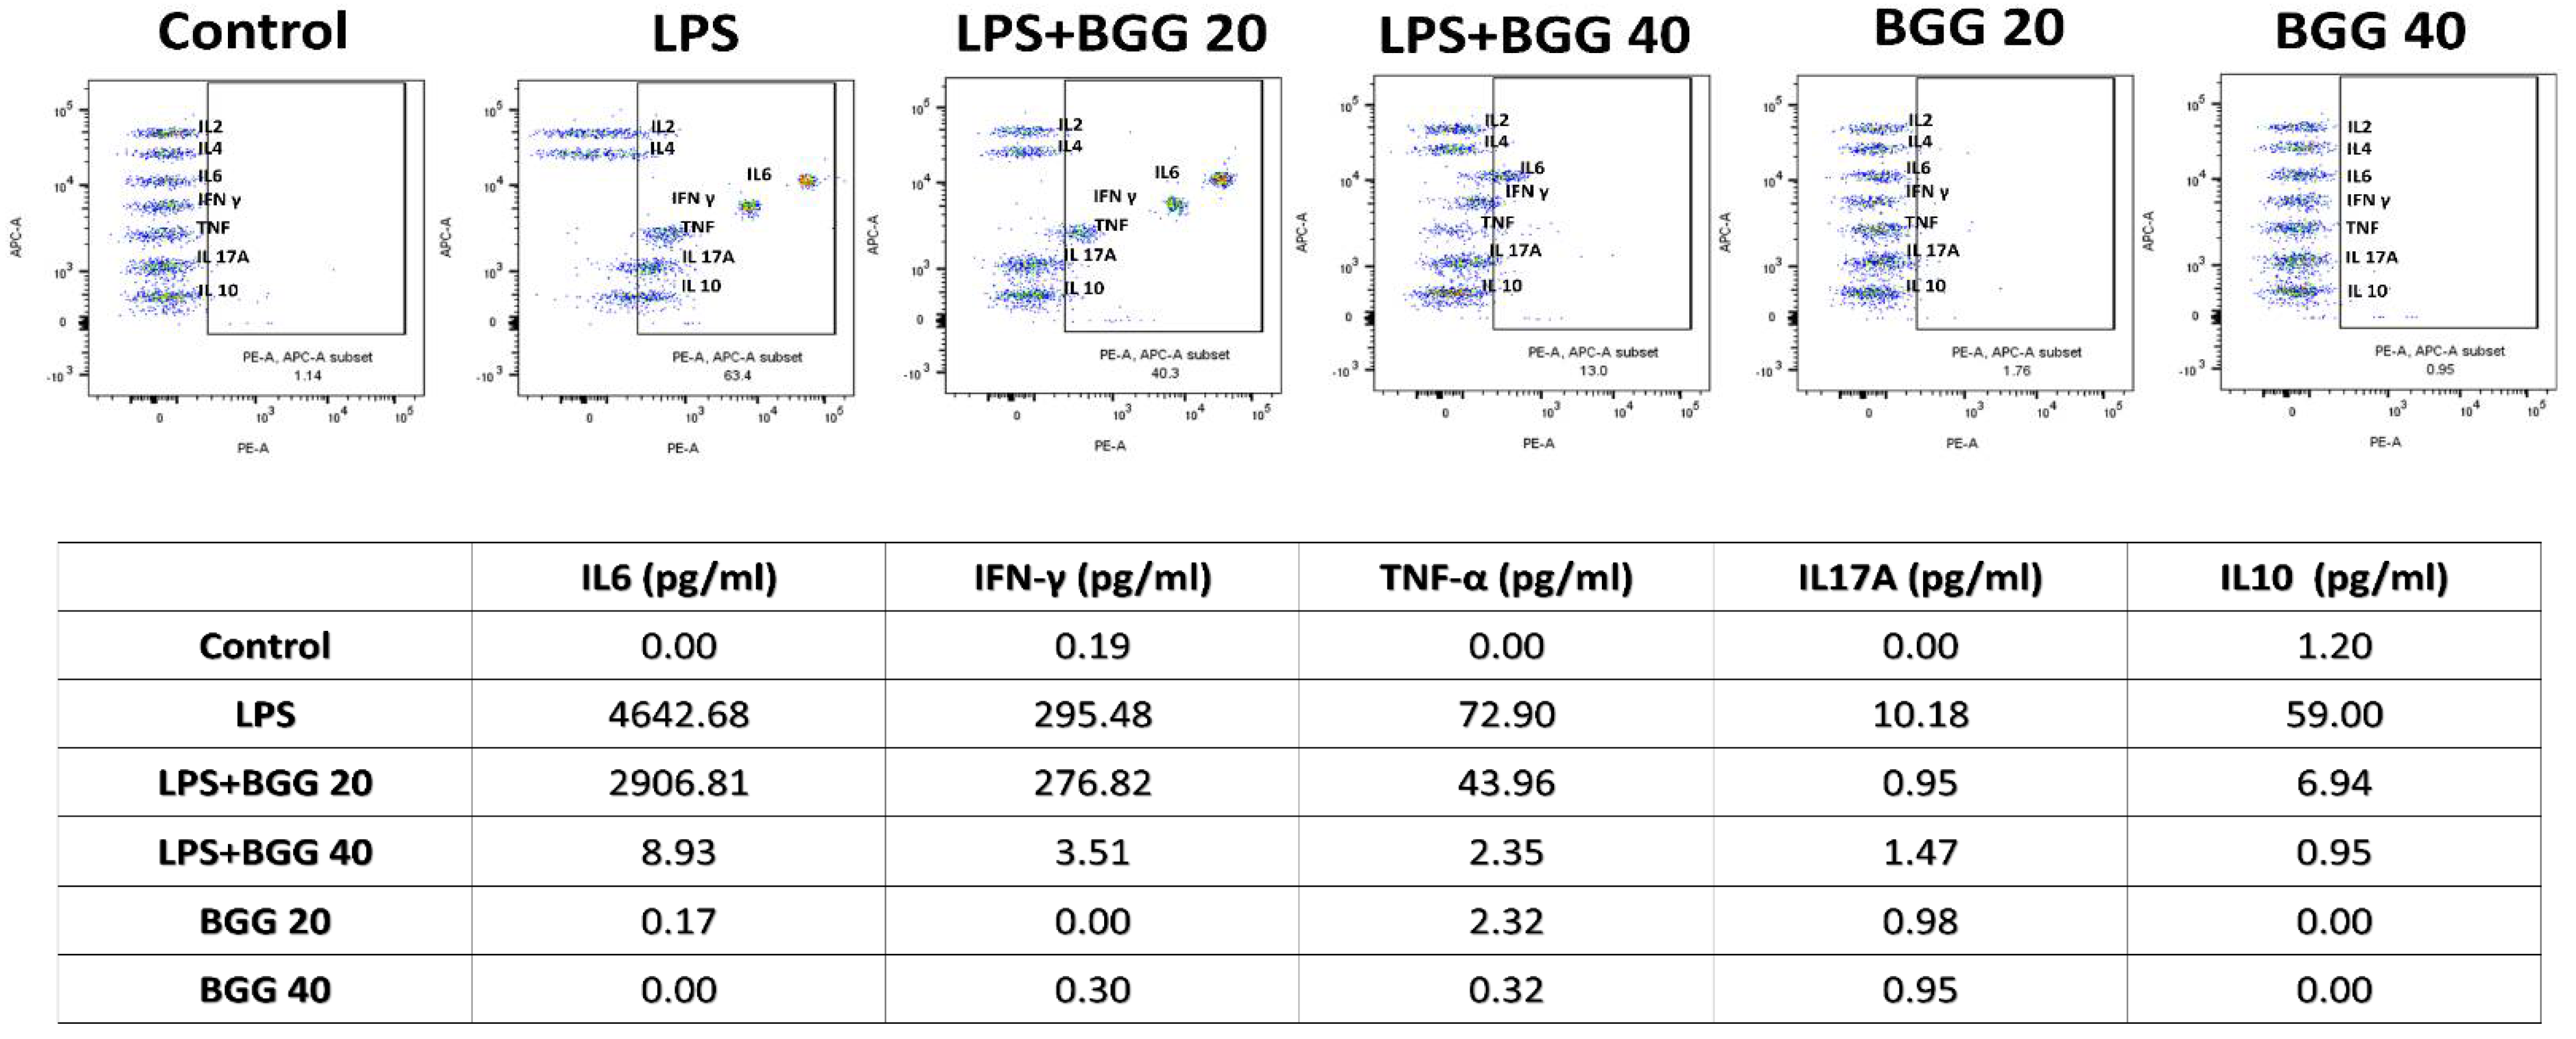
2.7. BGG Attenuates LPS-Induced Pro-Inflammatory Cytokines Productions and Inflammation in Macrophages Cells
2.7.1. Measurement of Extracellular Cytokines by Cytometric Bead Array (CBA)
2.7.2. Intracellular Staining of Interleukins
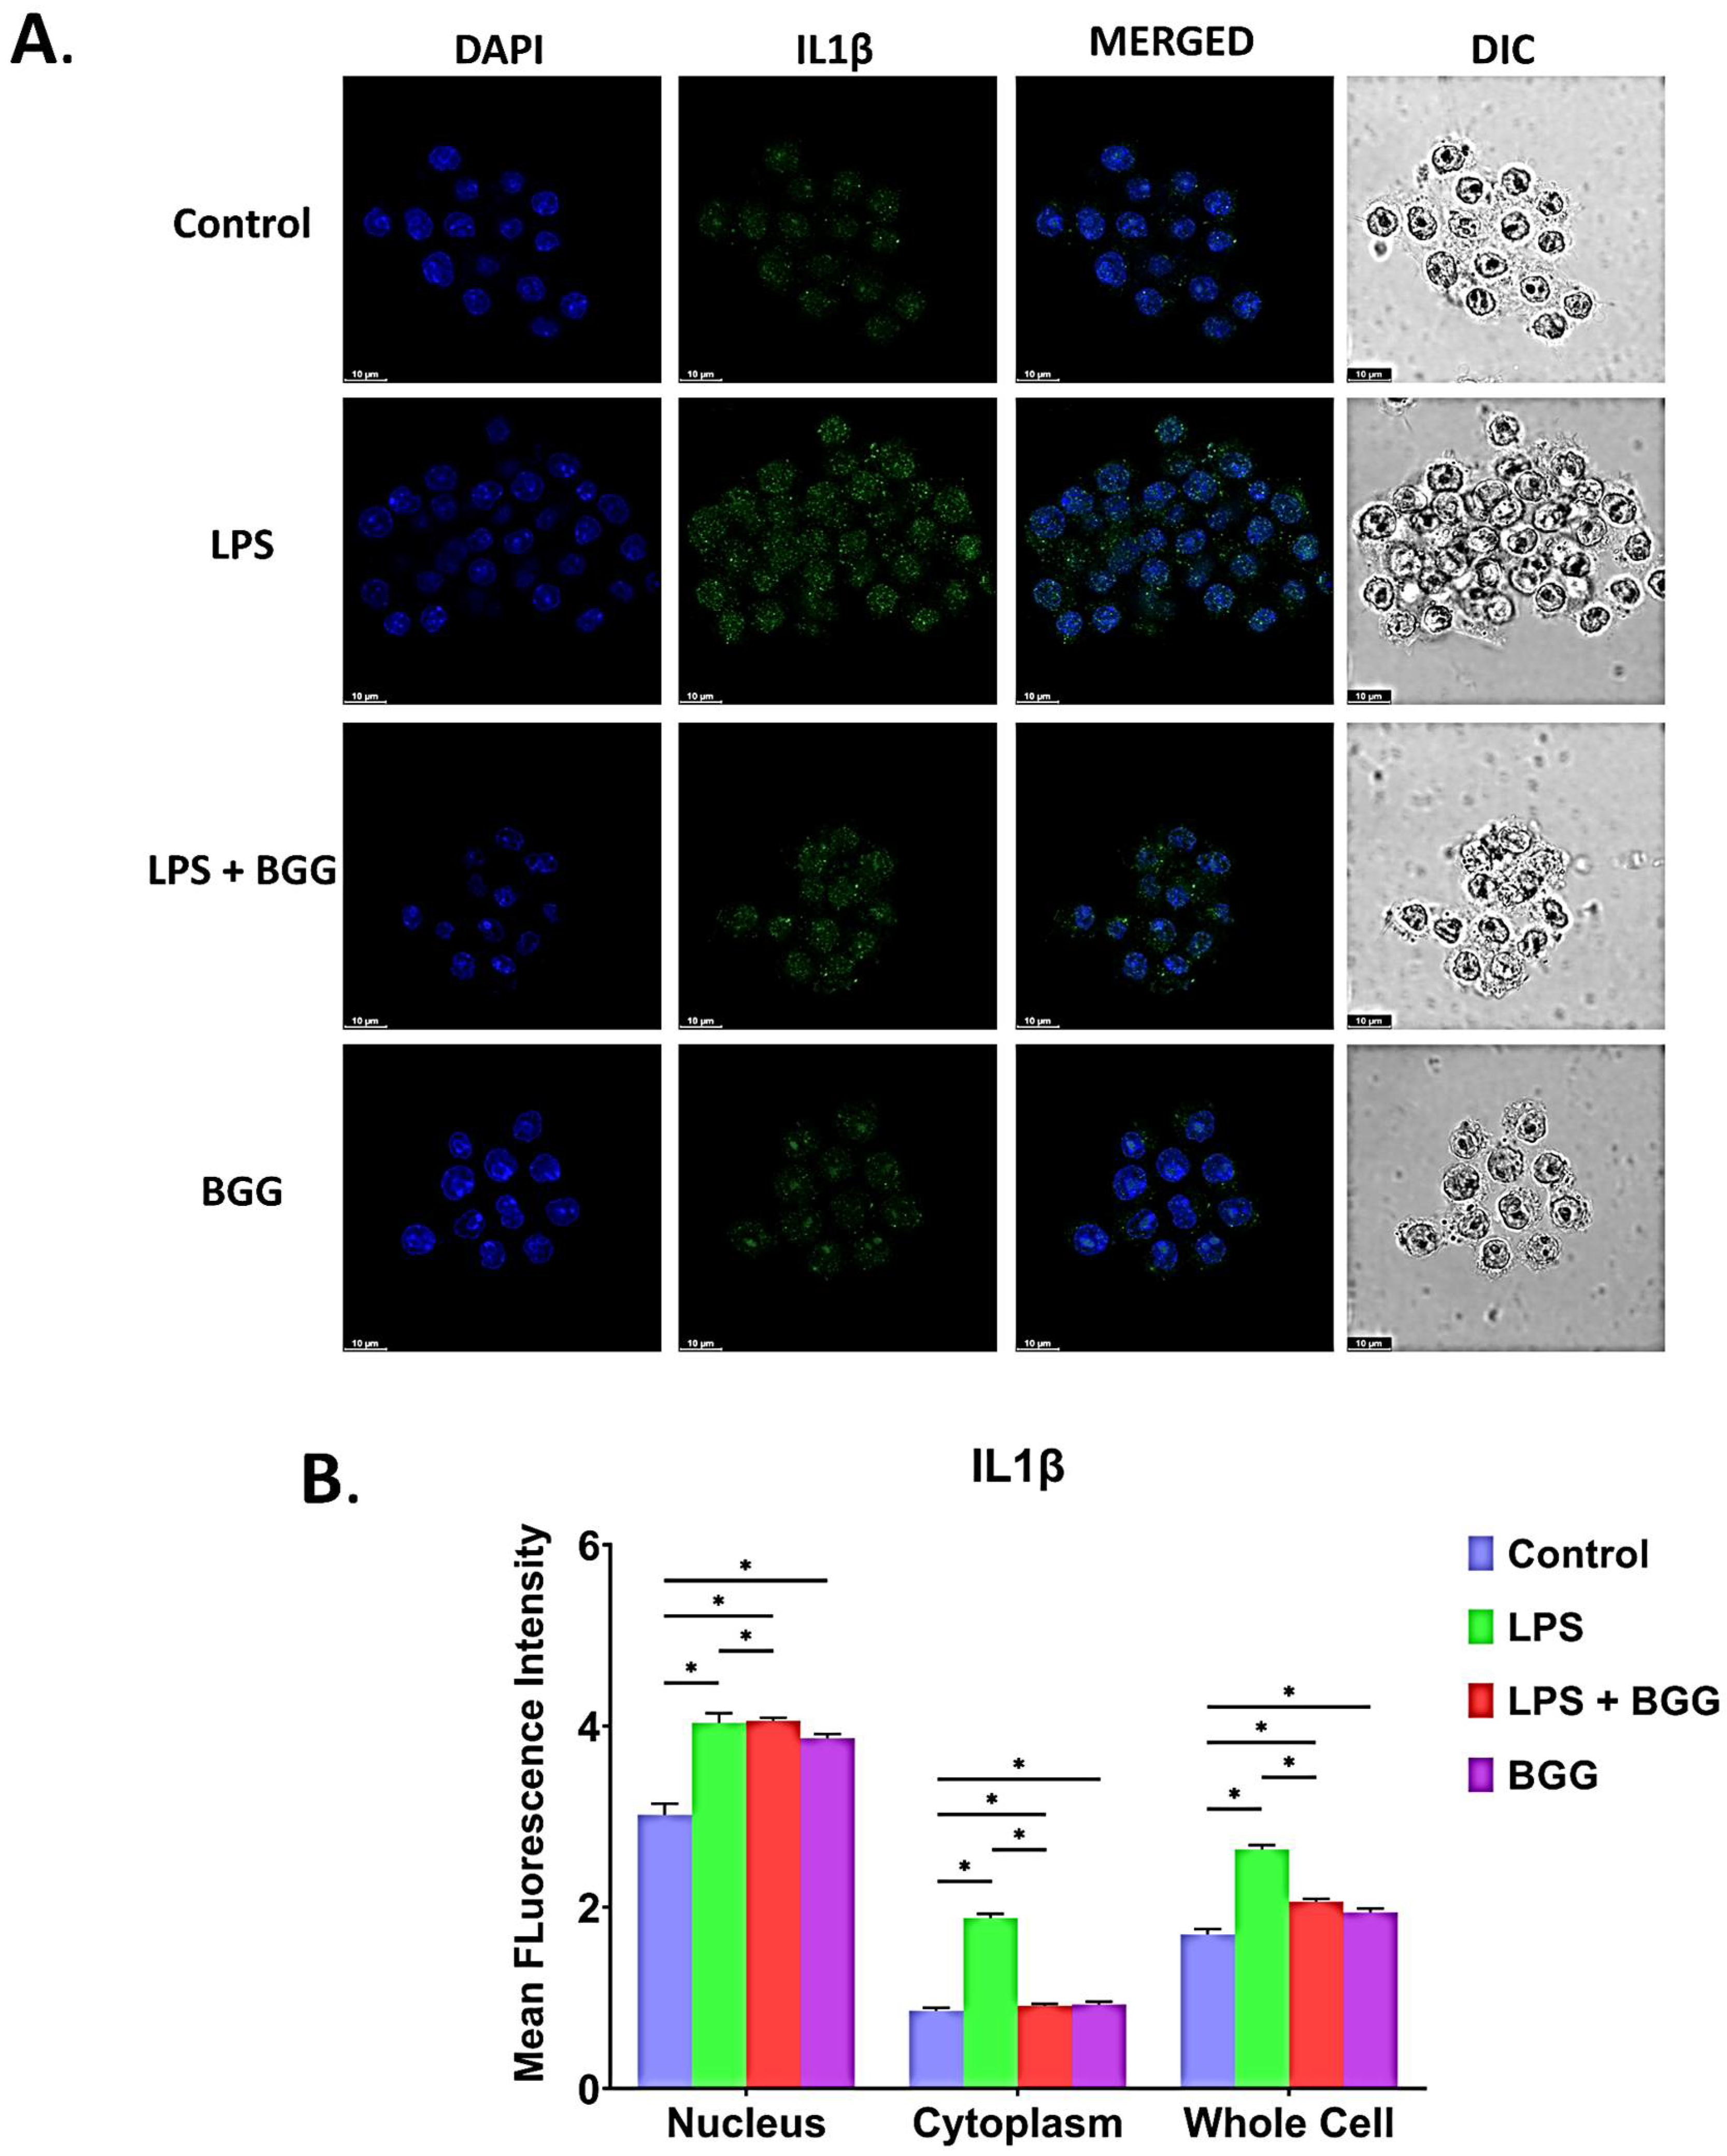
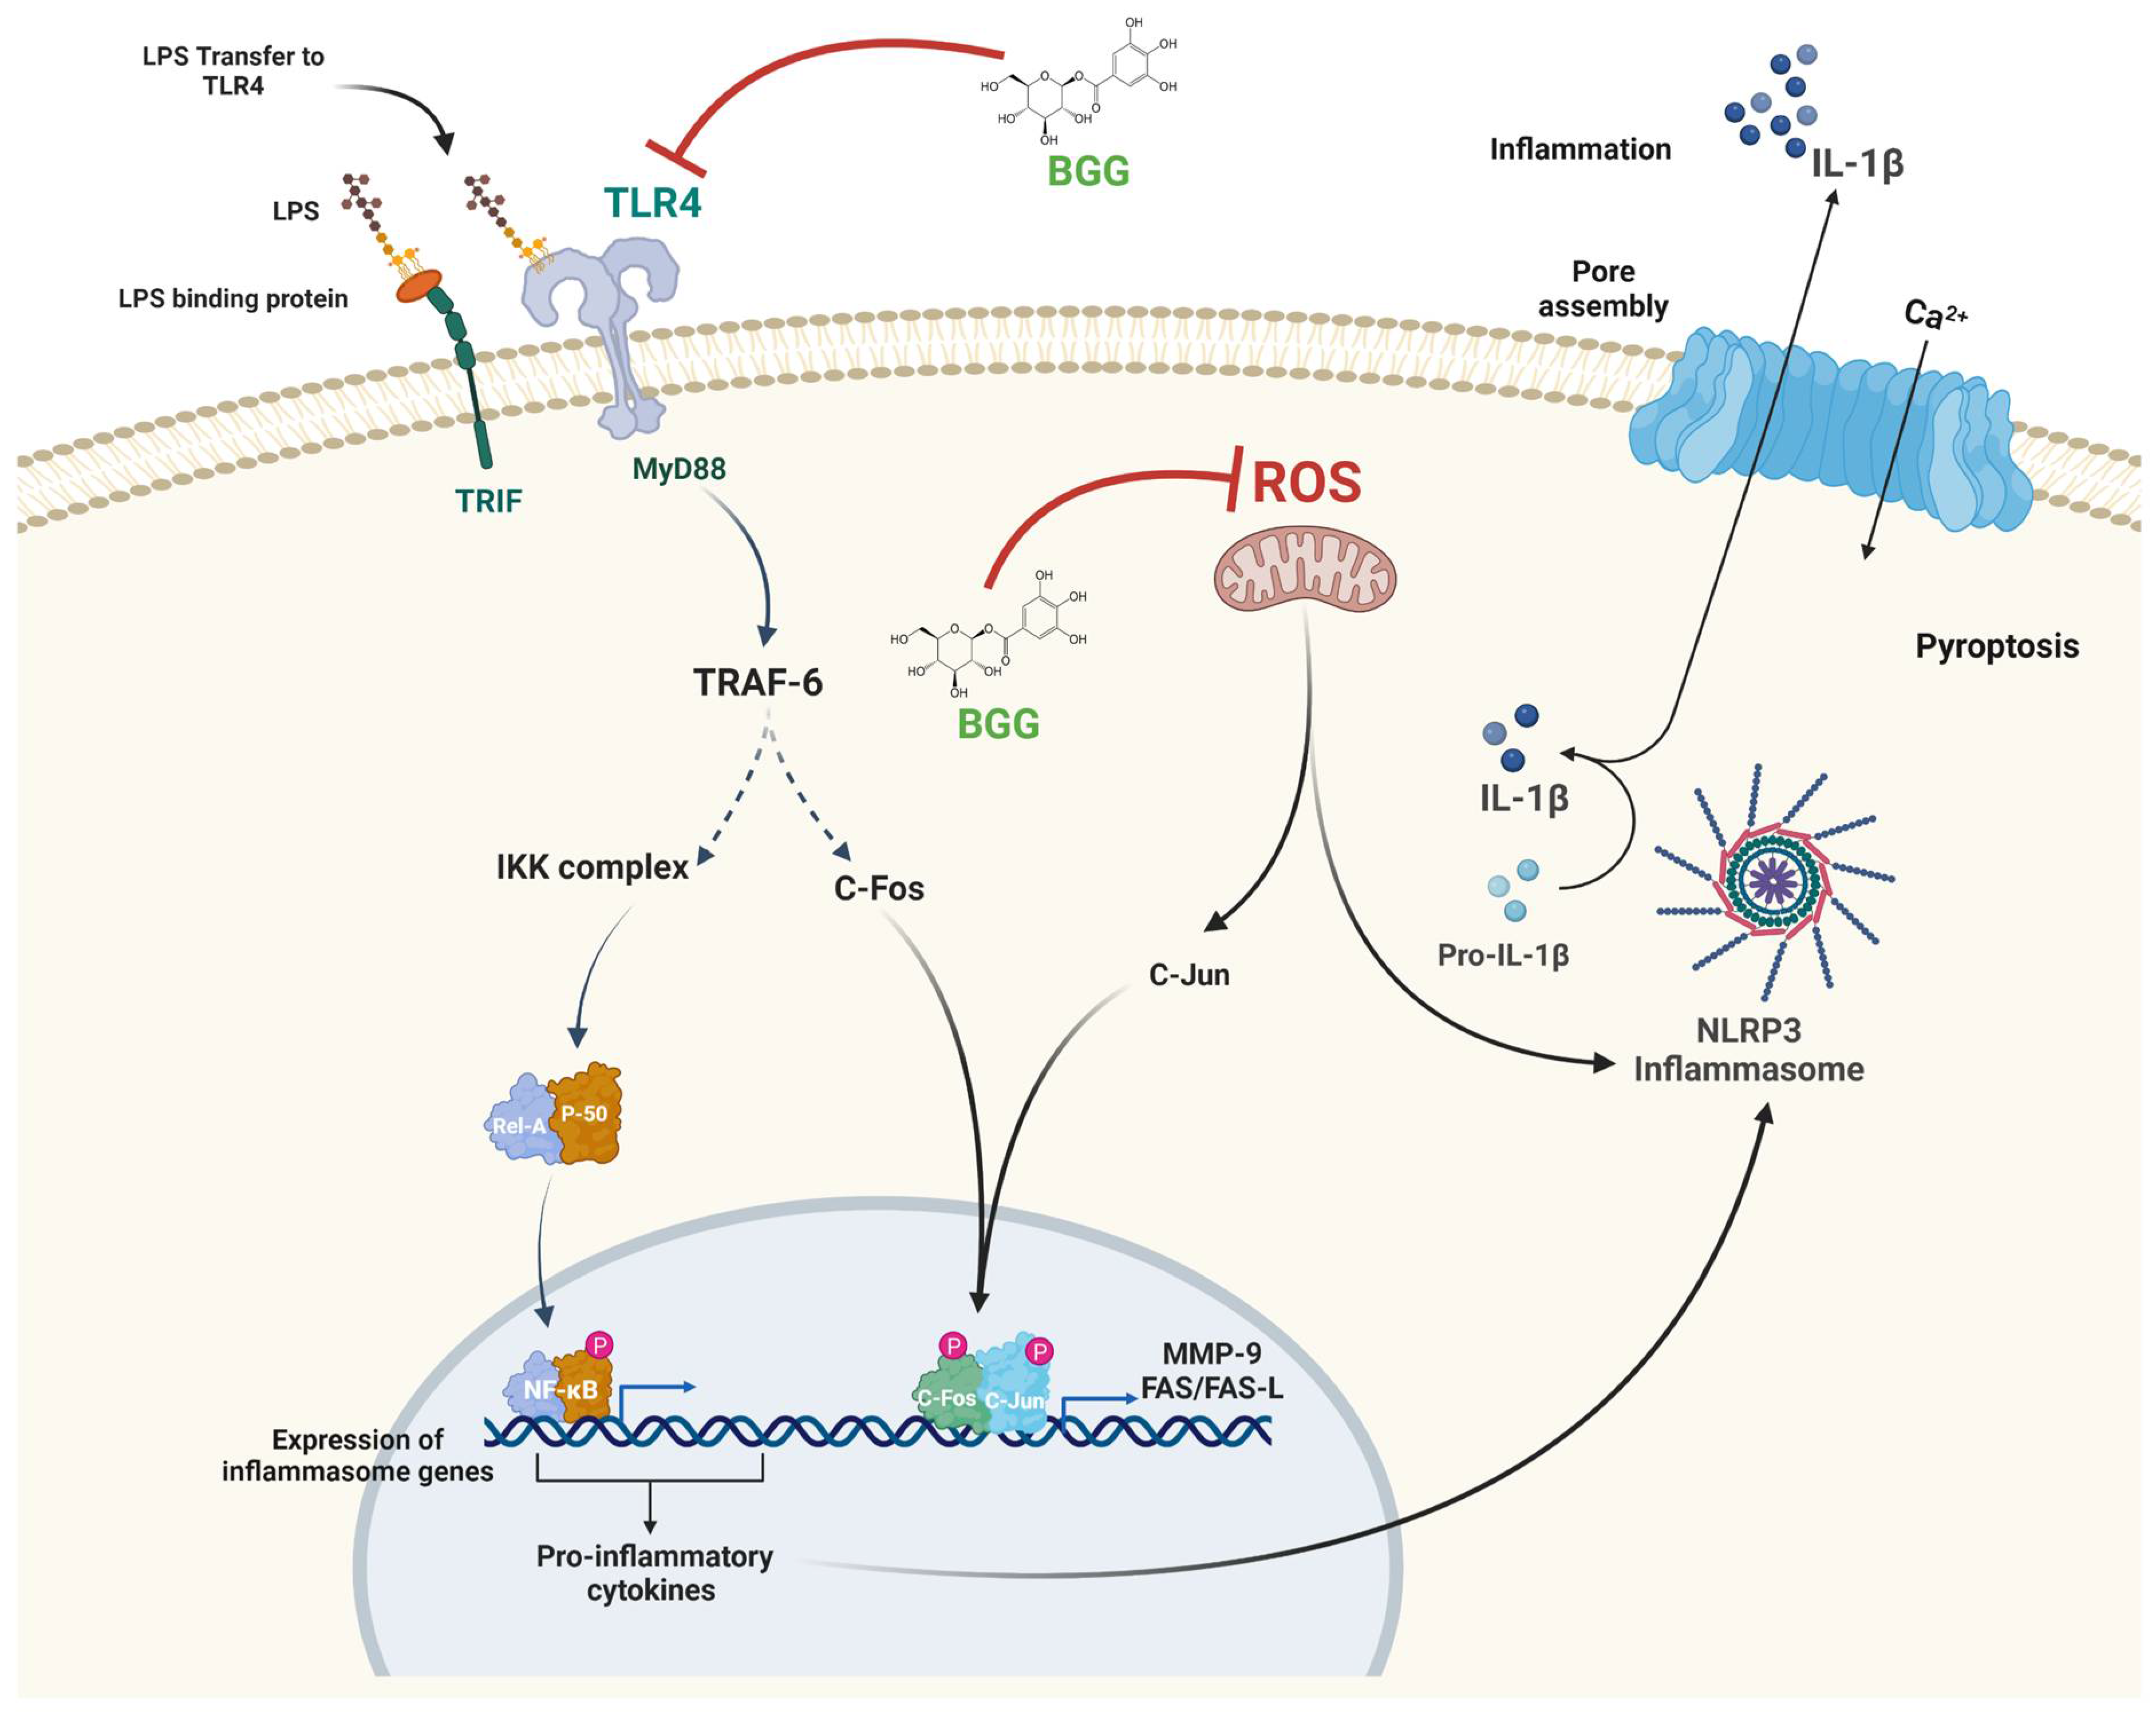
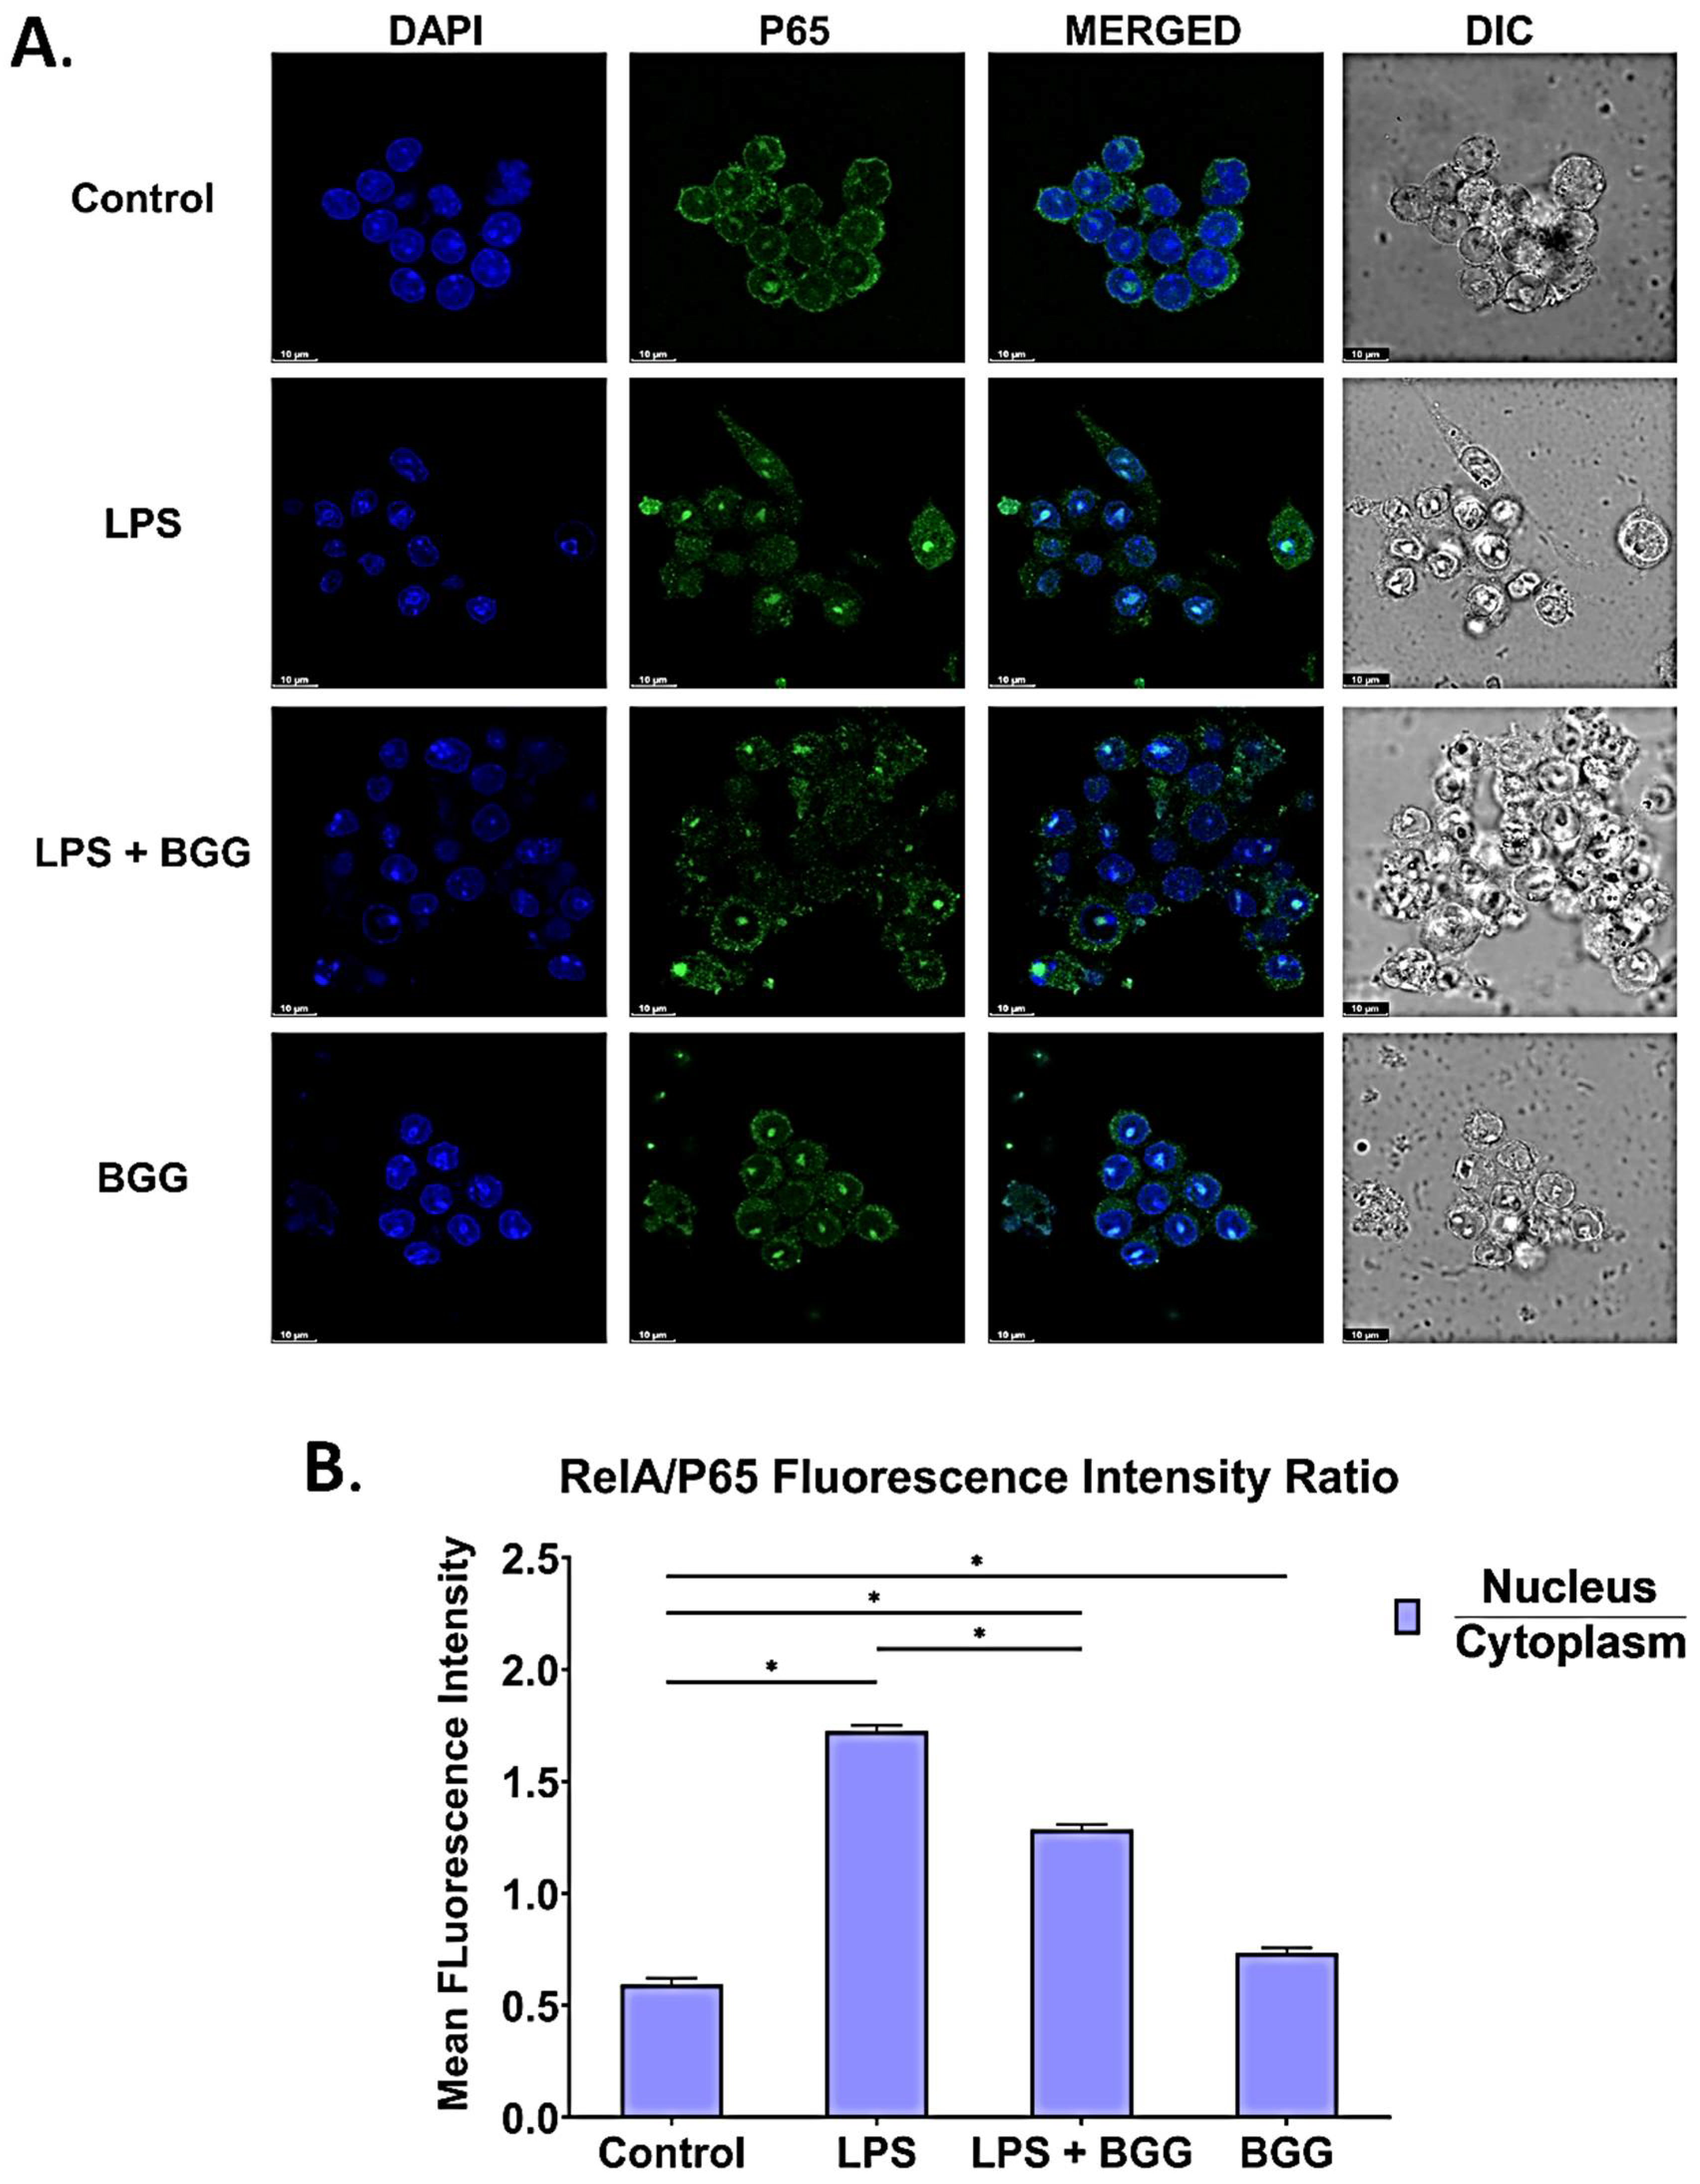
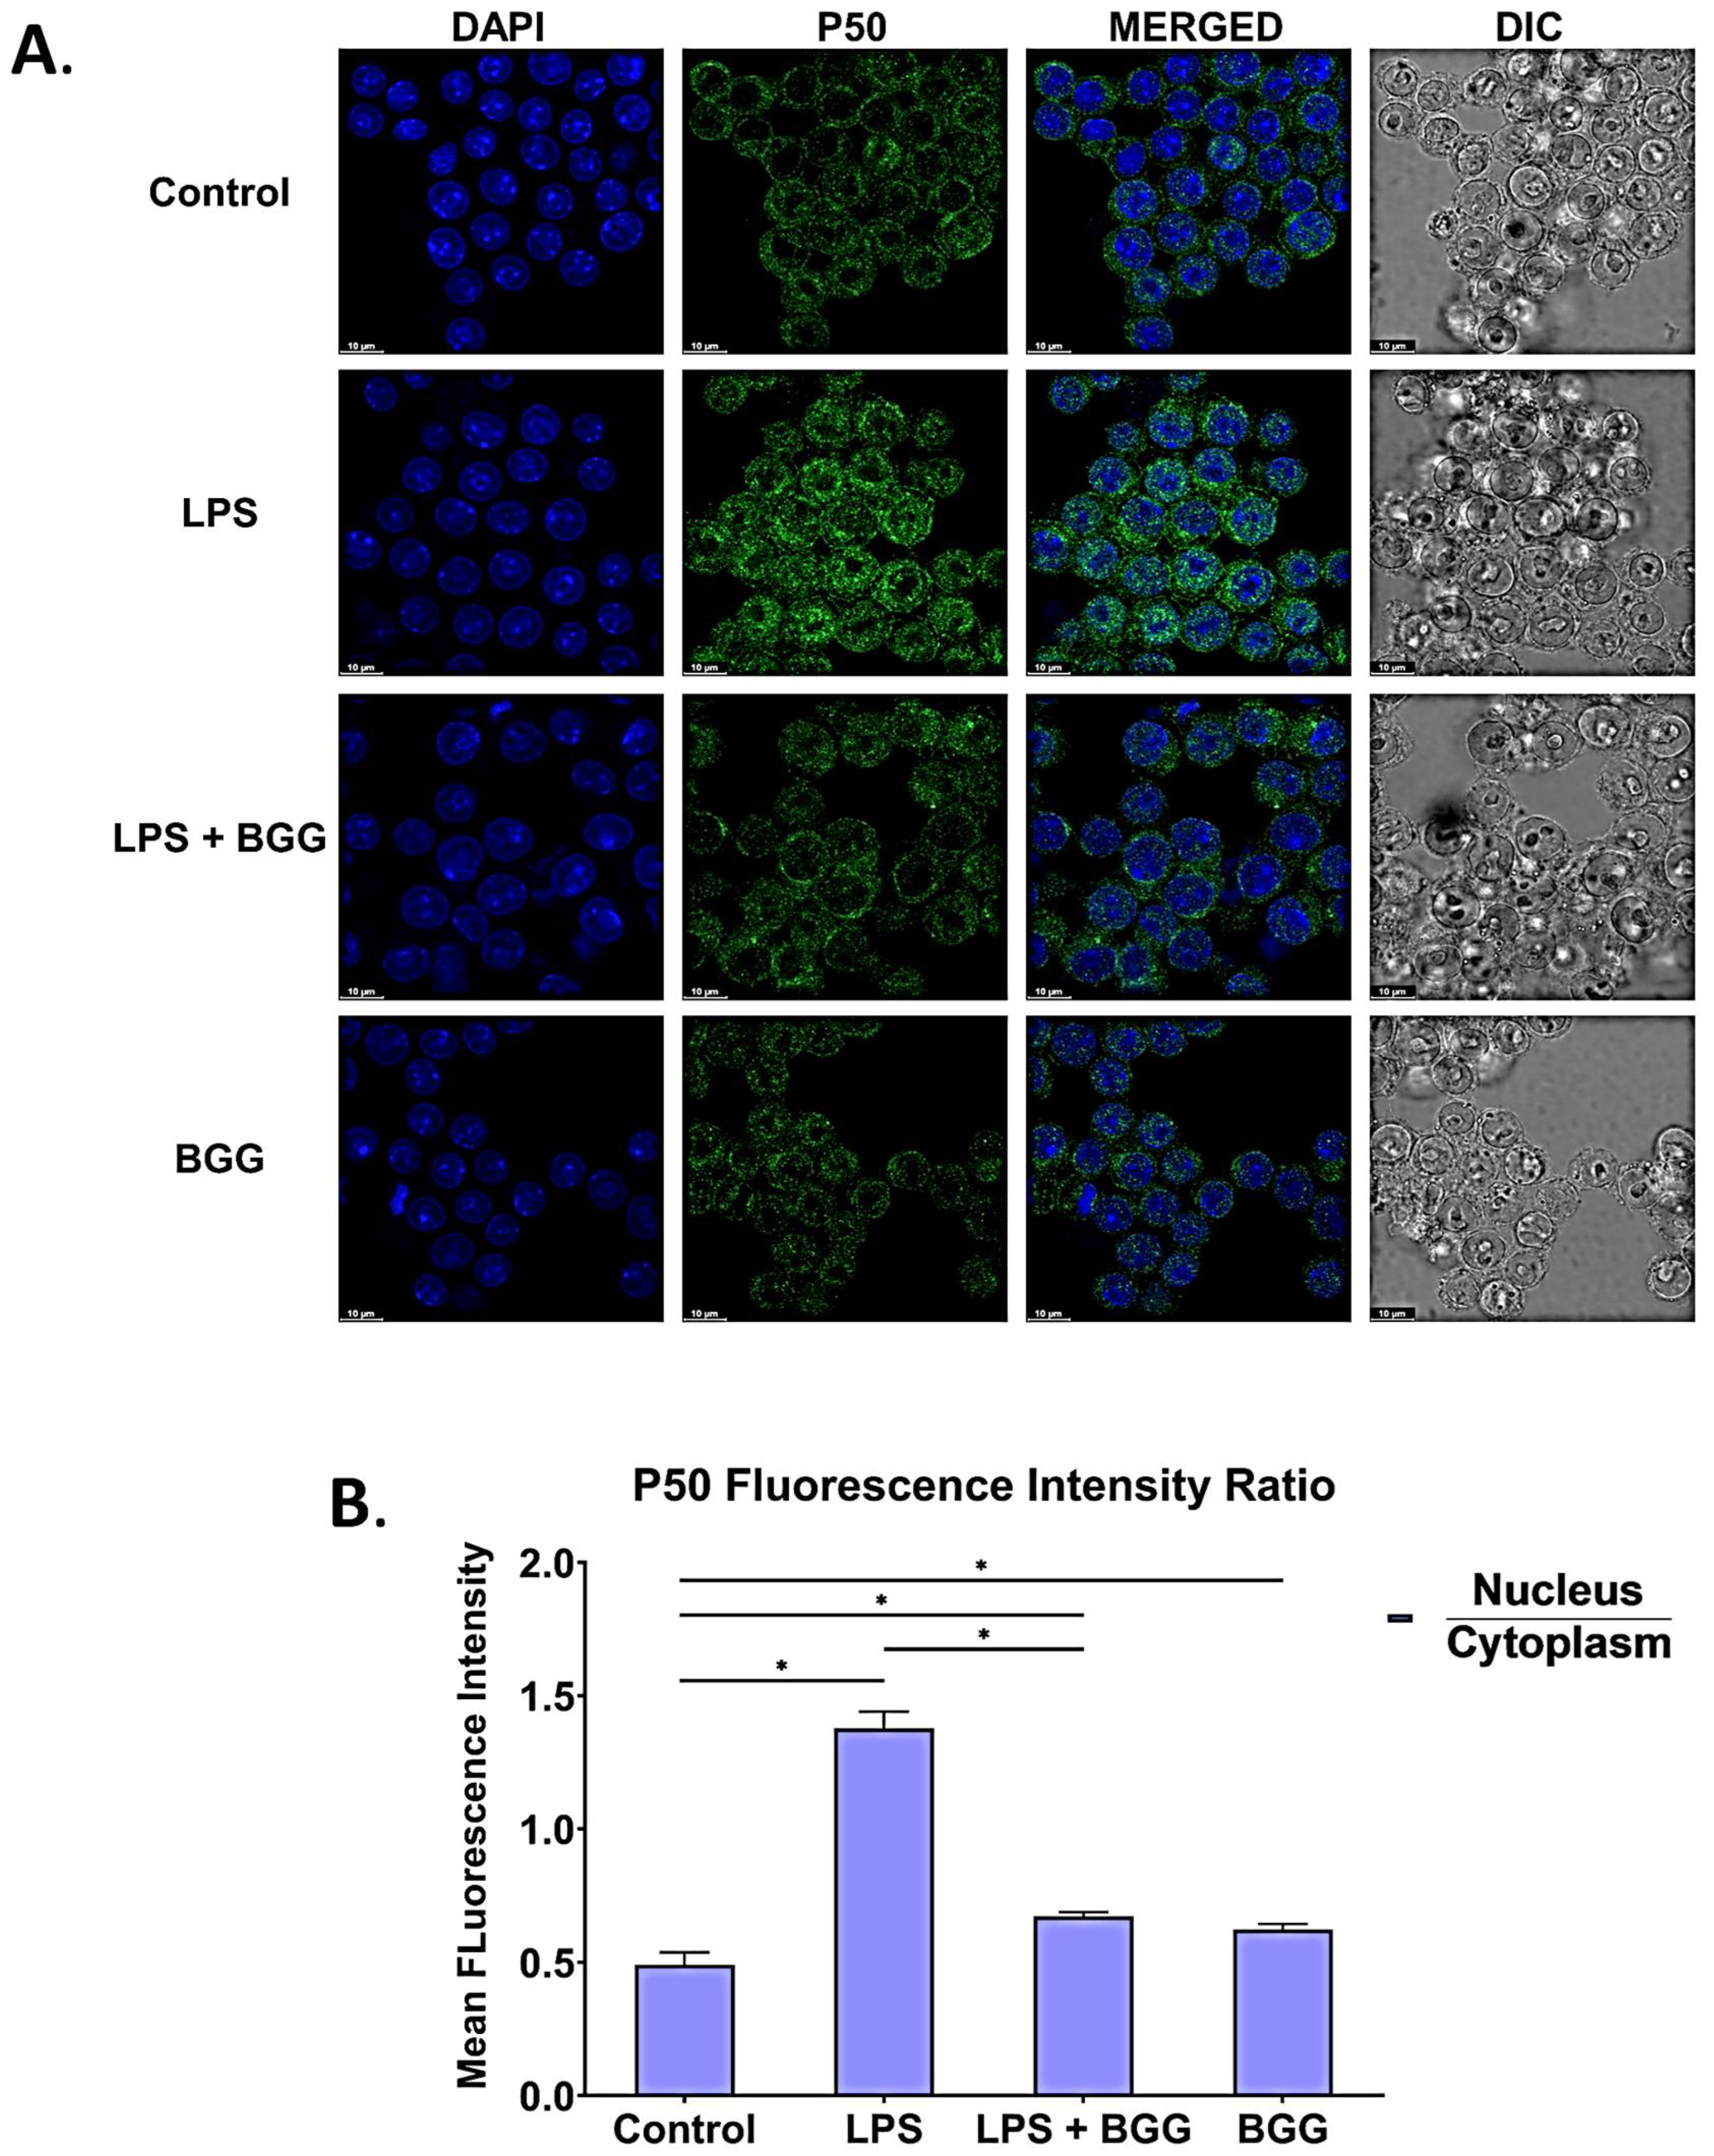
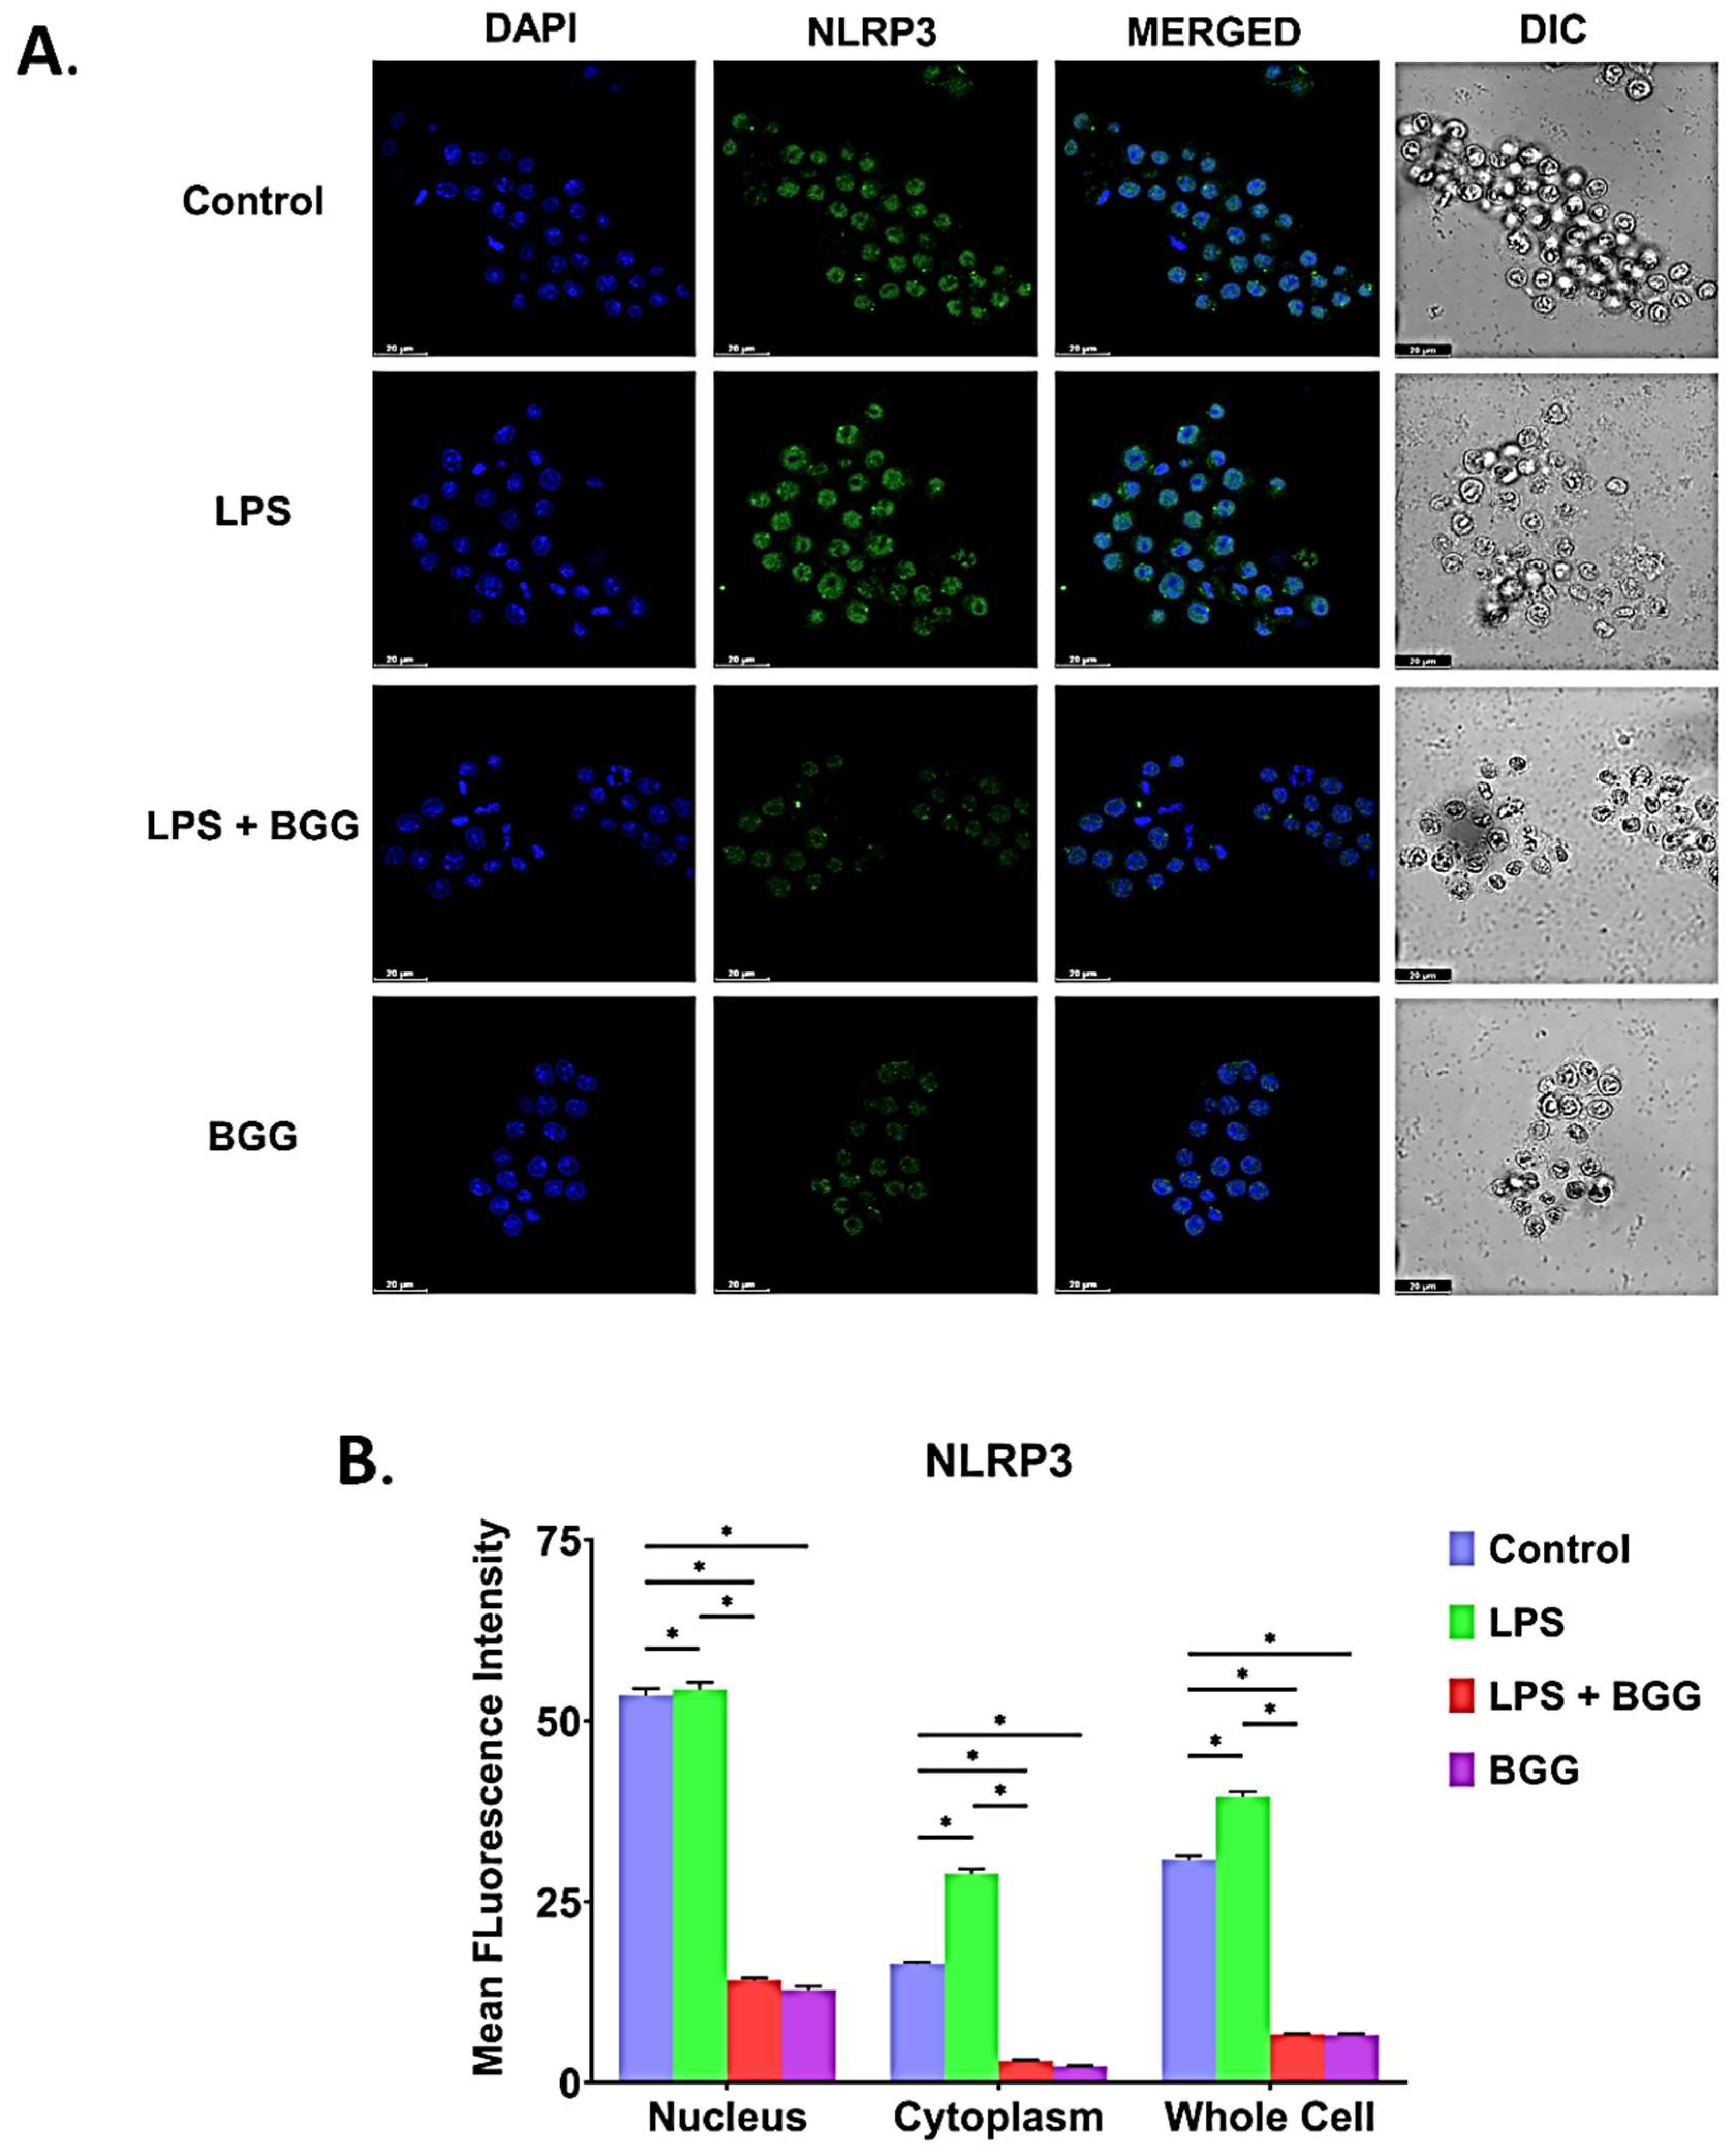
2.8. BGG Attenuates the LPS-Induced Inflammation and Pyroptosis in RAW 264.7 Macrophages via NF-κB/NLRP3 Pathway
2.9. Molecular Docking
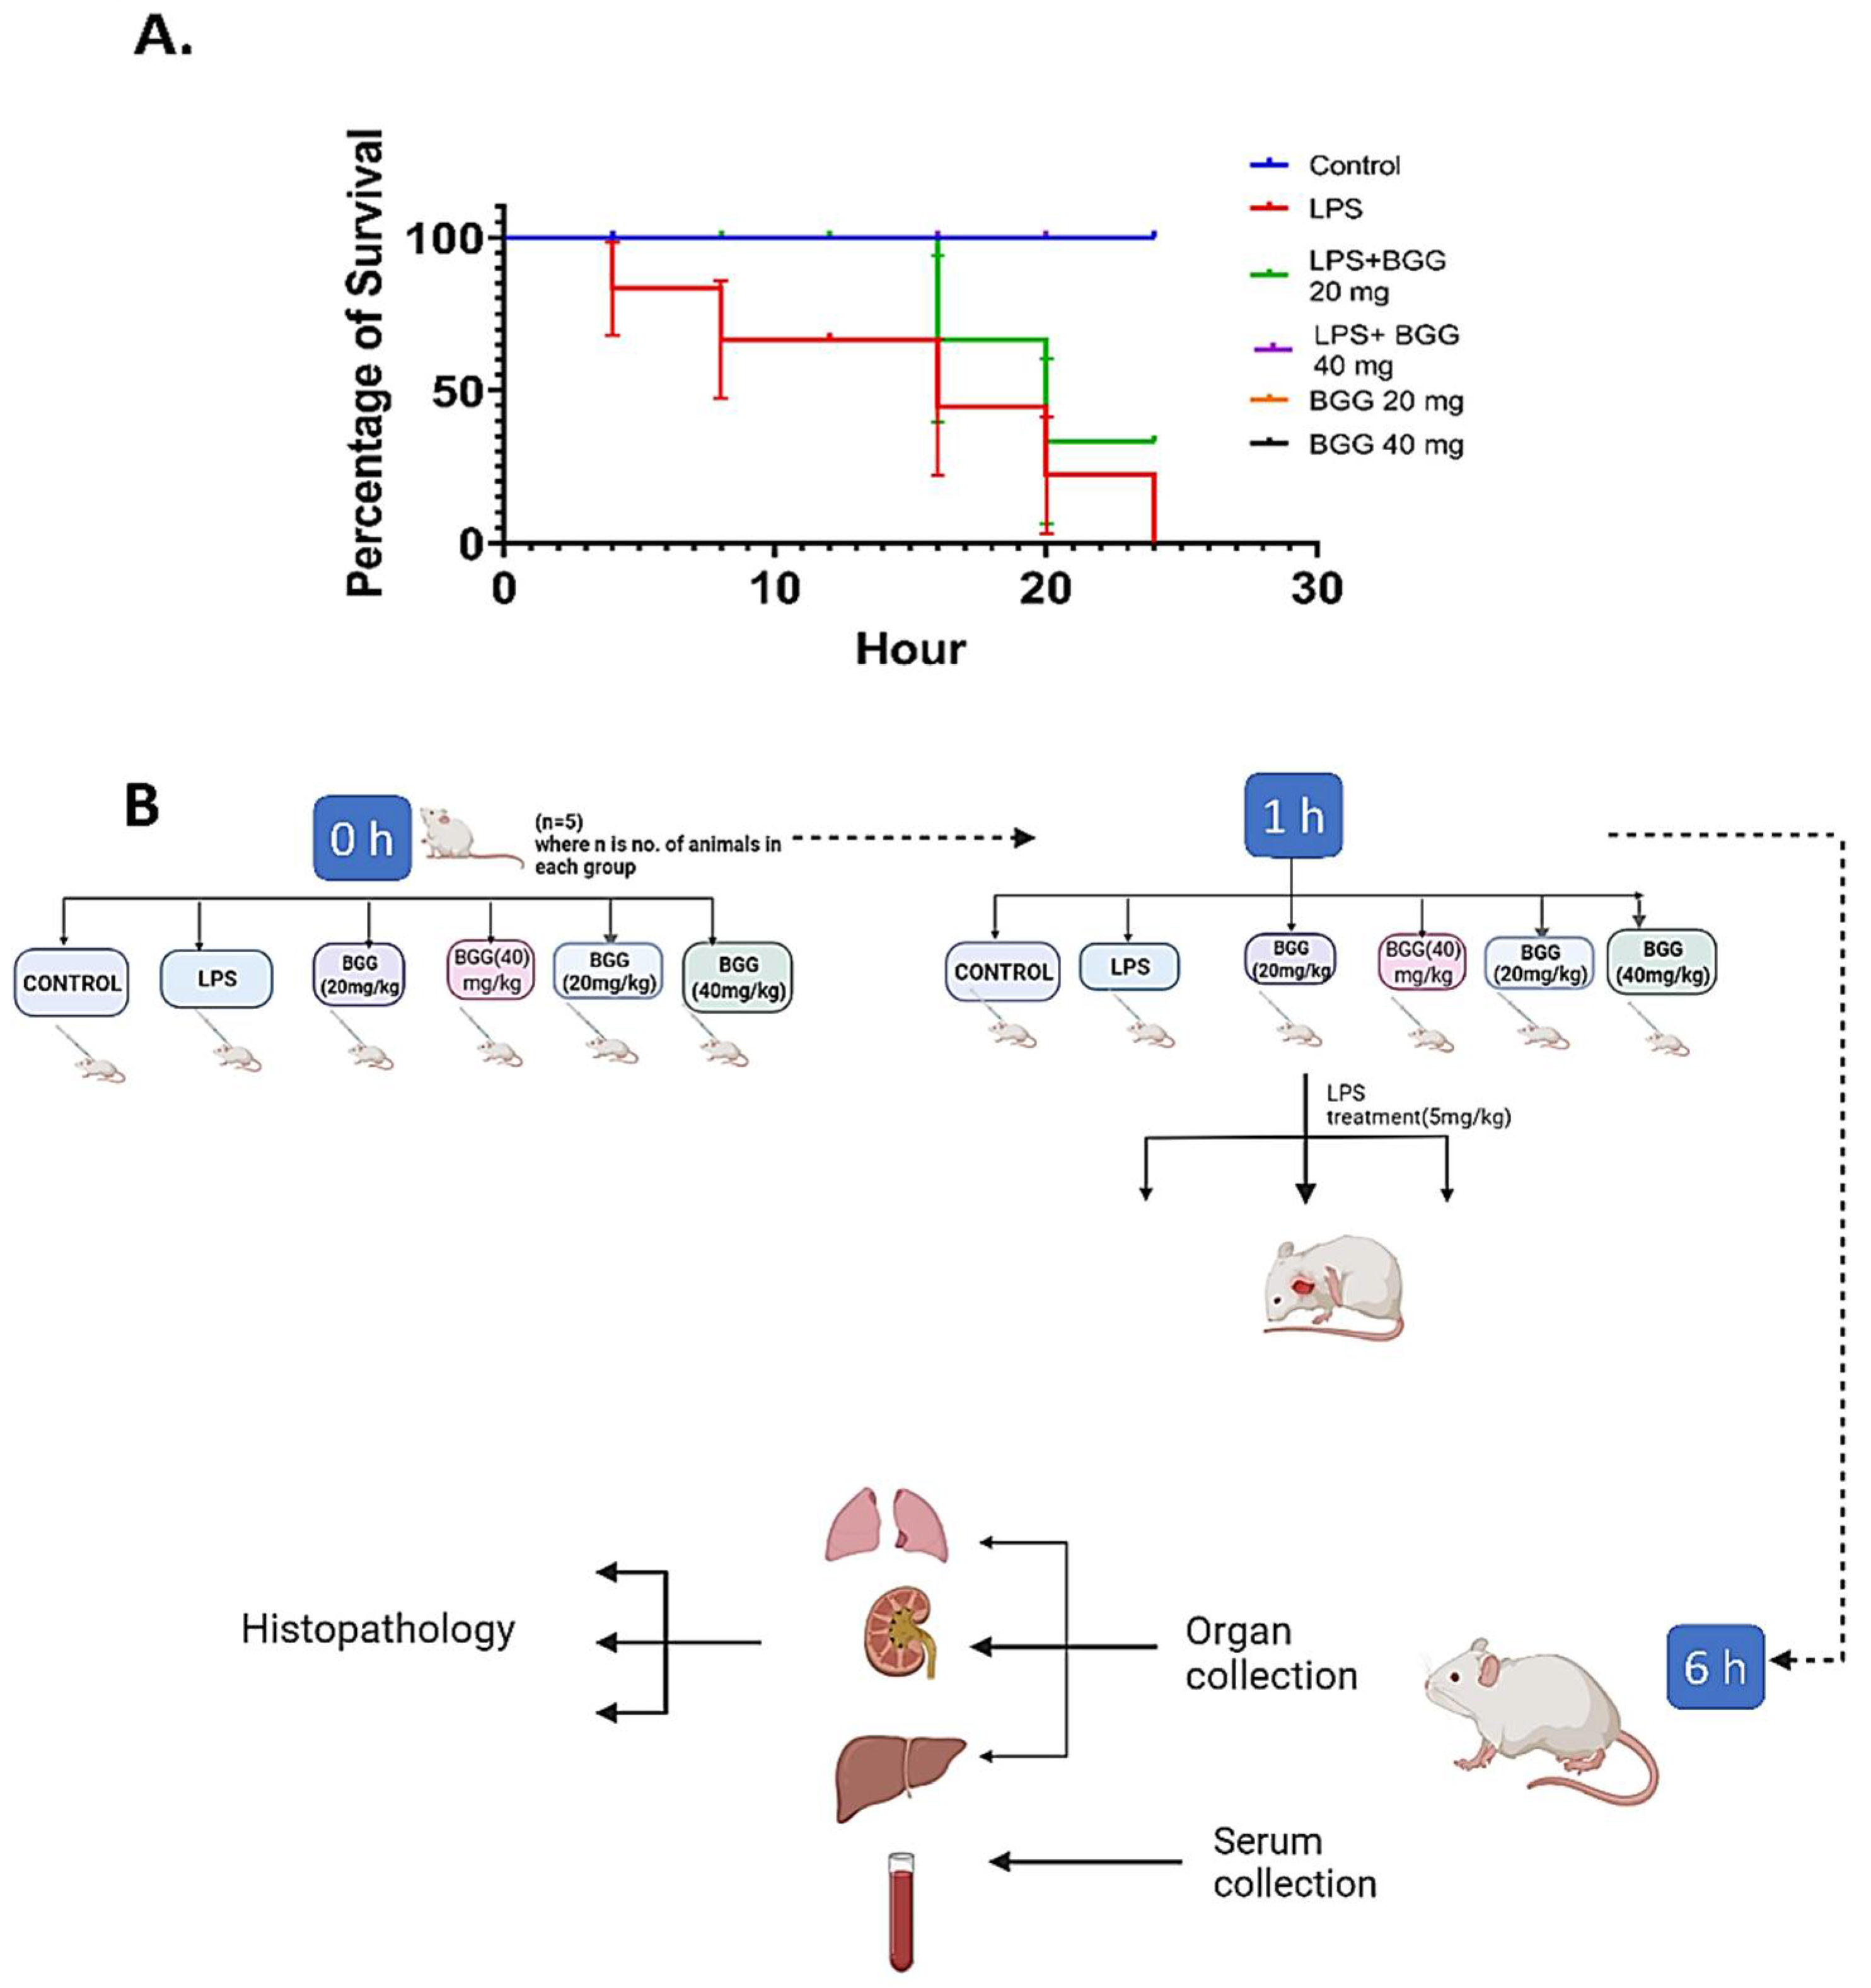
2.10. BGG Relieves LPS-Induced Inflammation and Toxicity In Vivo Sepsis Model
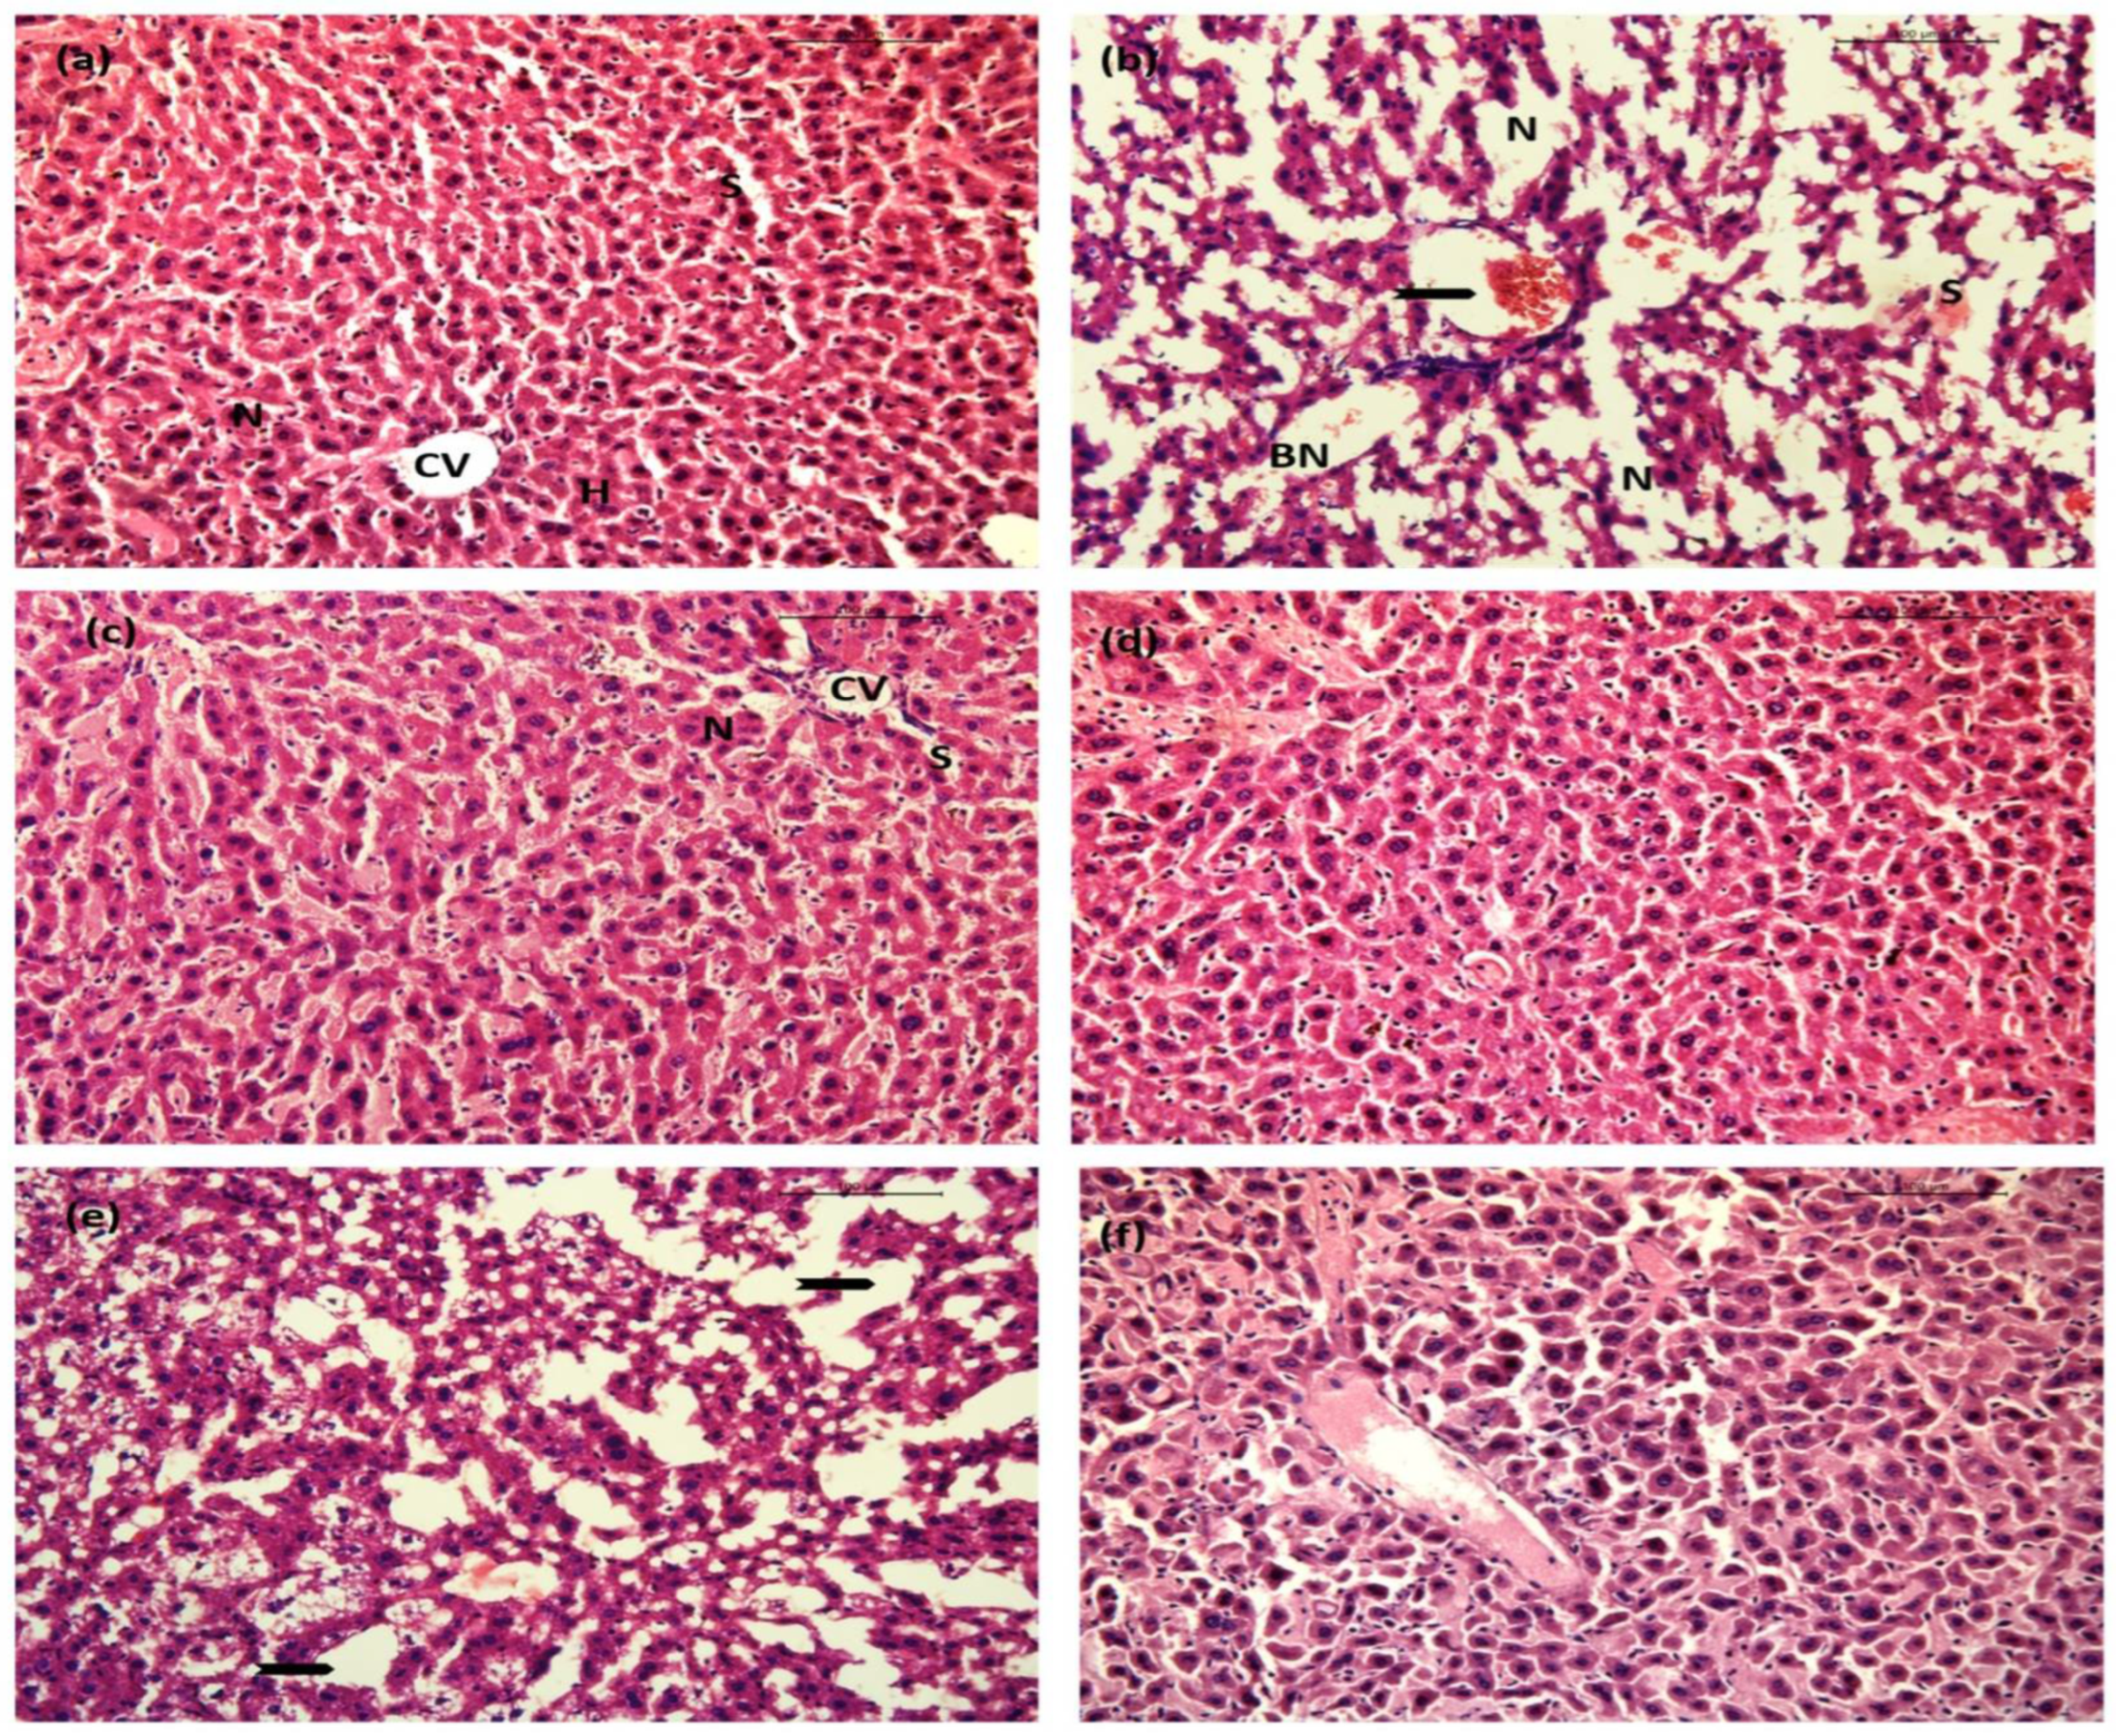
2.10.1. Liver
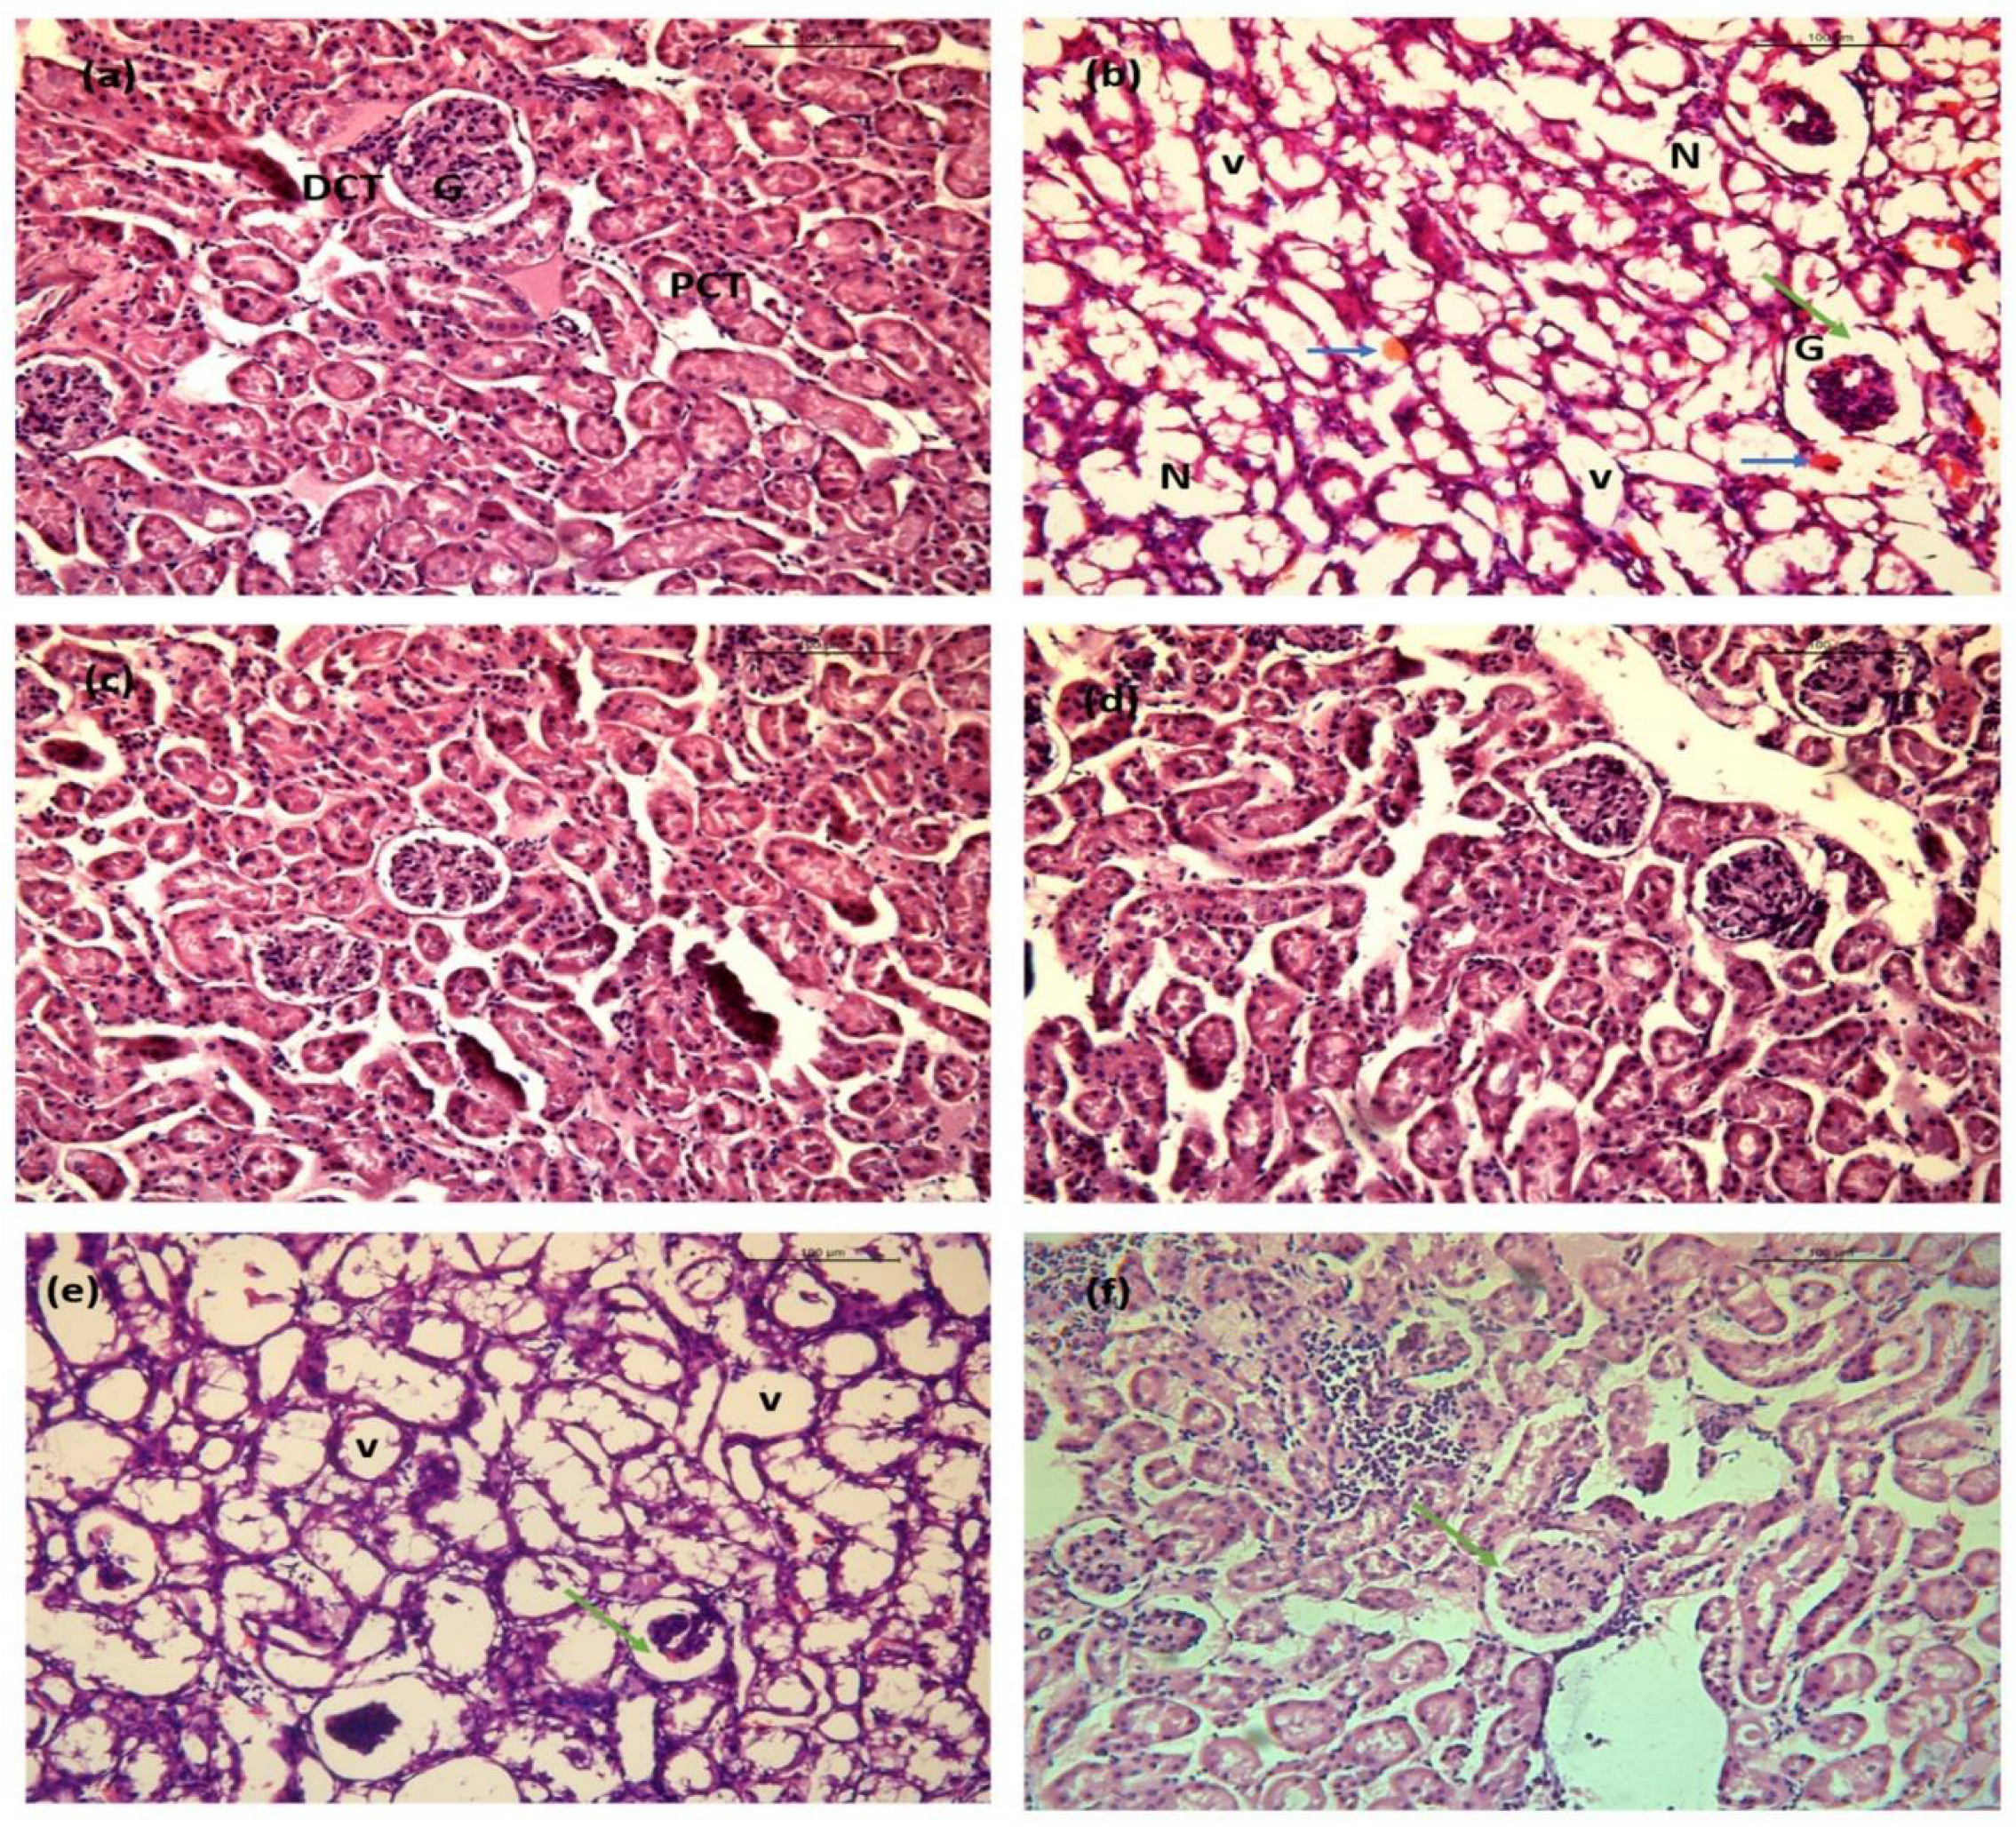
2.10.2. Kidney
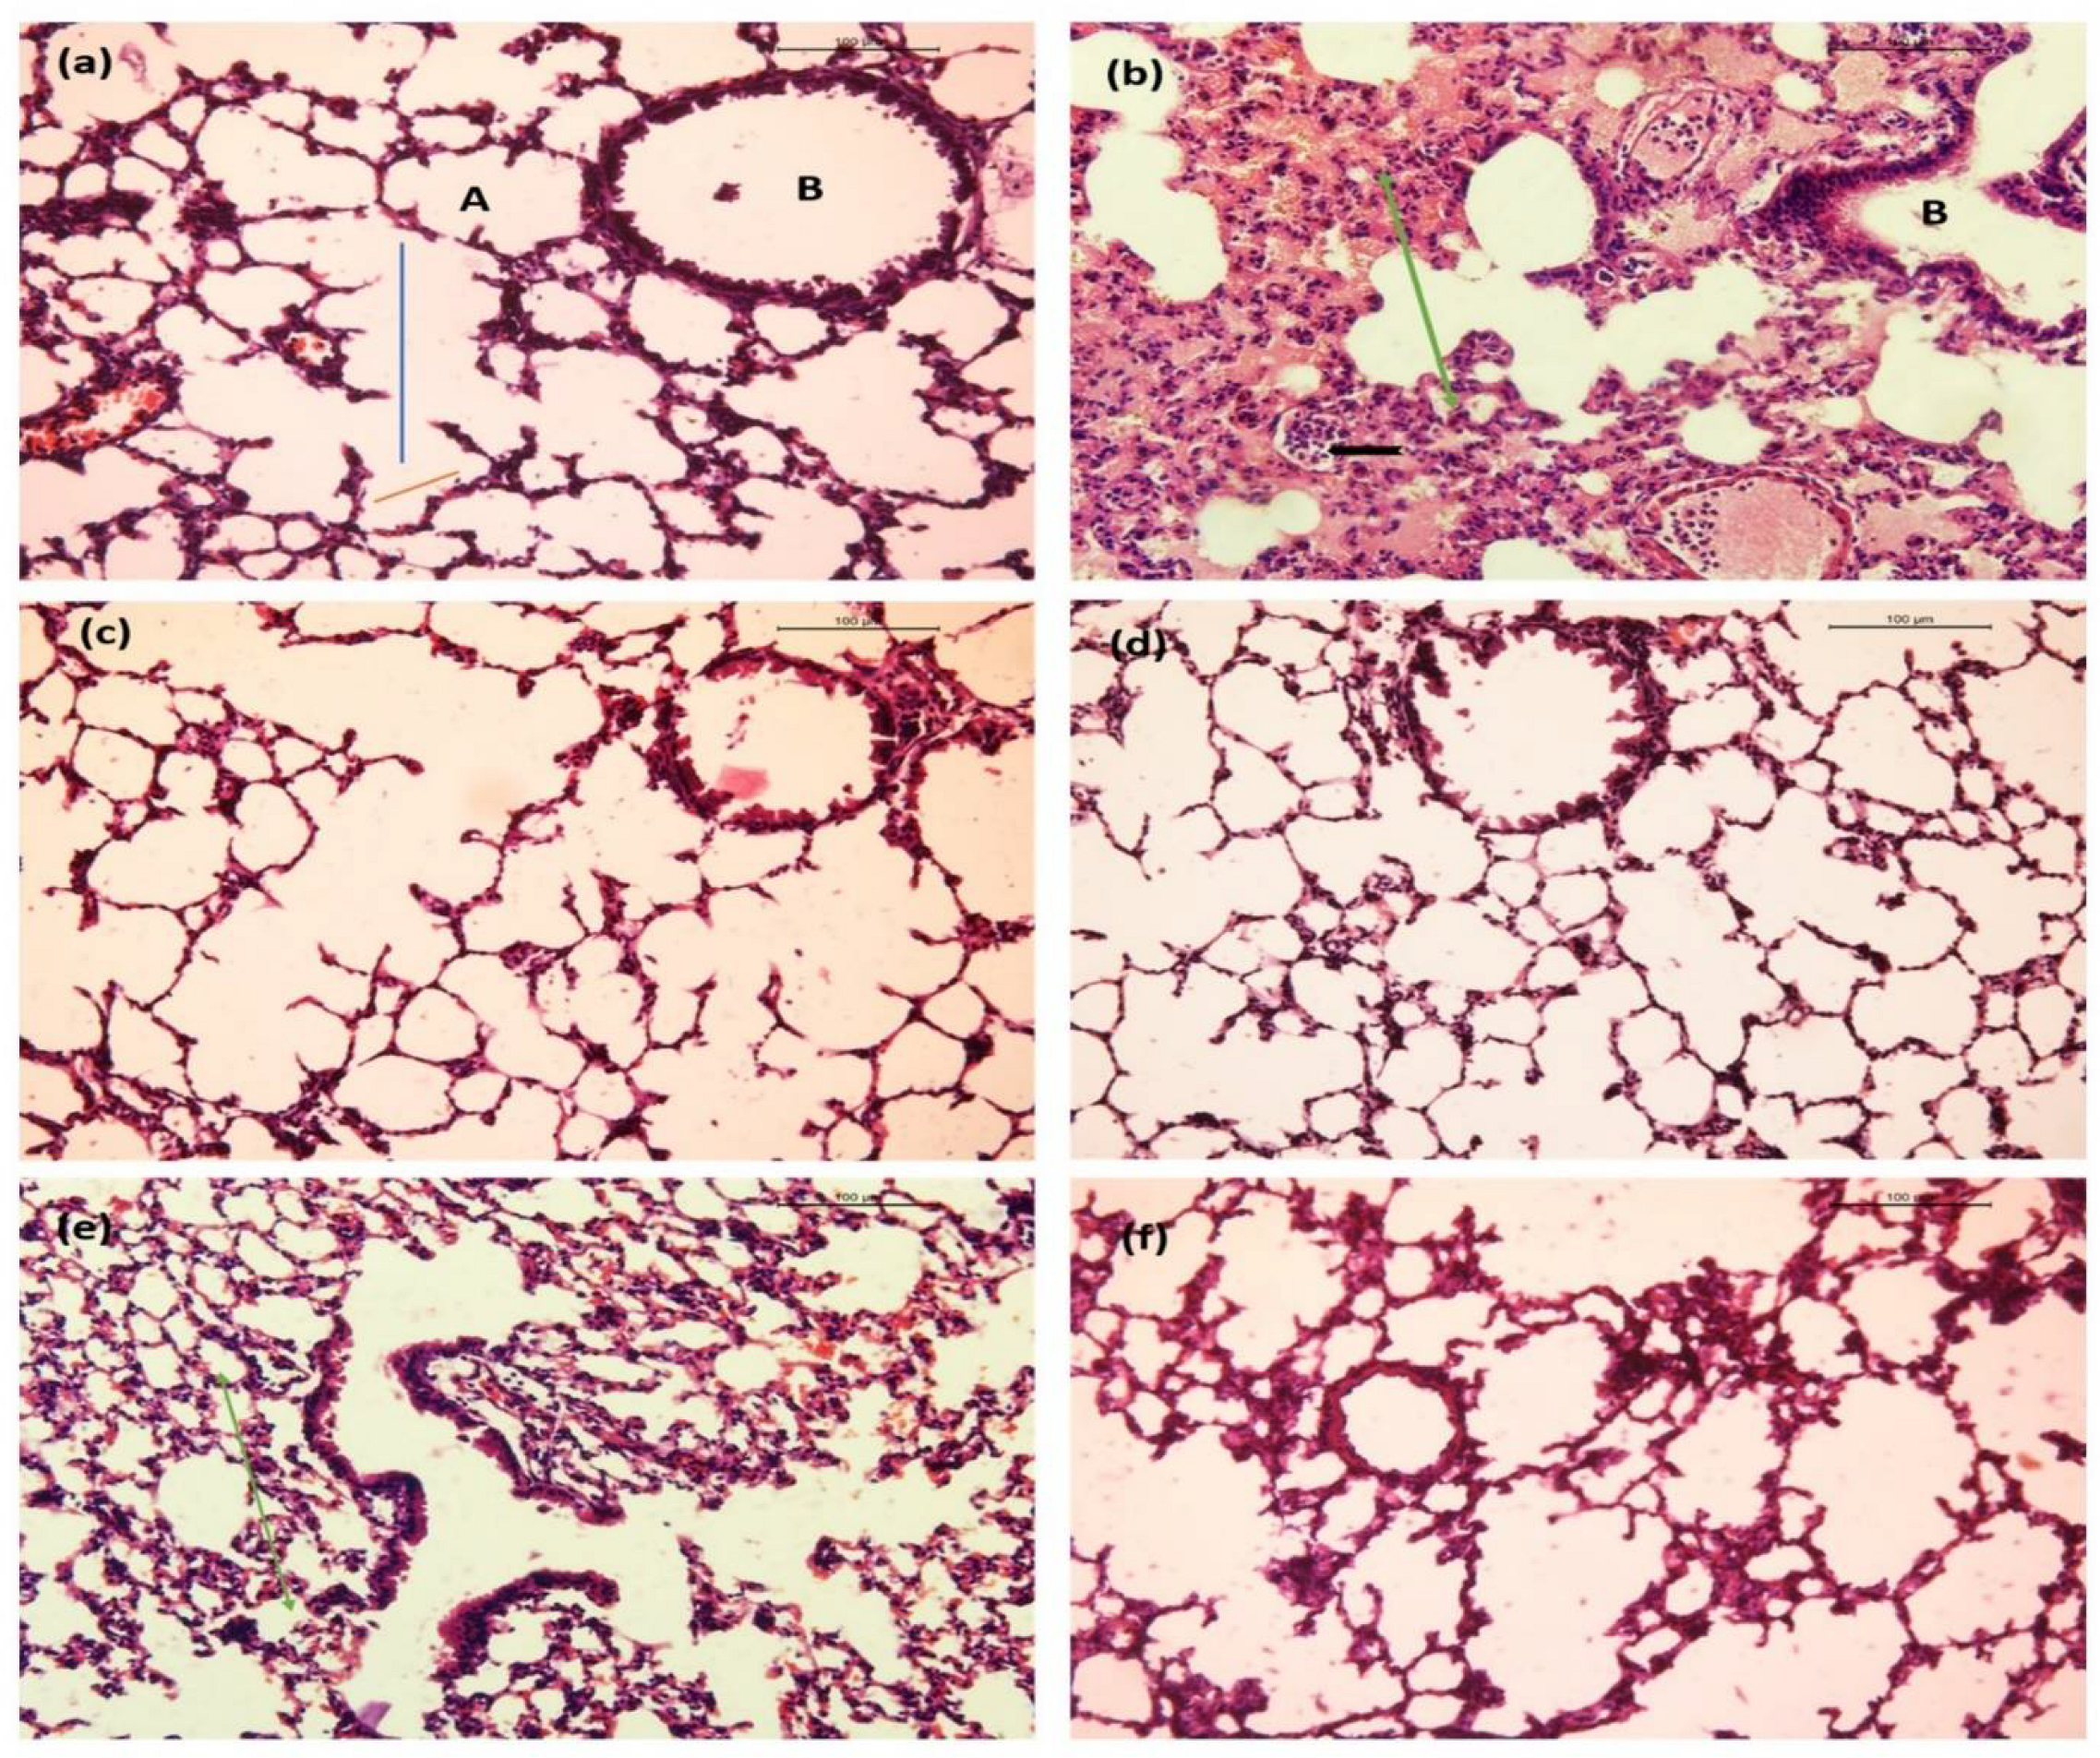
2.10.3. Lung
2.10.4. BGG Reduces the LPS-Induced Inflammatory Response in the Sepsis Model
2.11. GSH Assay
3. Discussion
4. Methods and Results
4.1. Chemicals and Reagents
4.2. Cell Culture and Cytotoxicity Determination
4.3. Determination of NO Production
4.4. Reactive Oxygen Species Detection
4.5. miRNA Microarray Analysis
4.6. Evaluation of Mitochondrial Membrane Potential (ΔΨ)
4.7. Evaluation of Mitochondria Produced Superoxide
4.8. Cytometric Bead Array (CBA) for Extracellular Cytokines
4.9. Intracellular IL6, IFN, and IL10 Production
4.10. Quantitative Real-Time PCR (qPCR) Analysis
4.11. Animals and Treatments
4.12. GSH Assay
4.13. Isolation of Peritoneal Macrophages
4.14. Molecular Docking of BGG against TLR4
4.15. Histological Analysis
4.16. Immunofluorescence Staining
4.17. Flow Cytometry
4.18. Ethics Statement
4.19. Statistical Analysis
Supplementary Materials
Author Contributions
Funding
Institutional Review Board Statement
Informed Consent Statement
Data Availability Statement
Acknowledgments
Conflicts of Interest
Abbreviations
| BGG | β-Glucogallin |
| COX 2 | Cyclooxygenase-2 |
| iNOS 2 | Inducible Nitric Oxide Synthase 2 |
| LPS | Lipopolysaccharide |
| MMP9 | Matrix metallopeptidase 9 |
| MYD88 | Myeloid differentiation primary response 88 |
| NF-KB | Nuclear factor kappa-light-chain-enhancer of activated B cells |
| TLR4 | Toll-Like Receptor 4 |
| TRAFs | Tumor necrosis factor receptor-associated factors |
| TRAM | Translocation associated Membrane Protein |
| TRIF | TIR-domain-containing adapter-inducing interferon-β |
References
- Das, L.; Bhaumik, E.; Raychaudhuri, U.; Chakraborty, R. Role of nutraceuticals in human health. J. Food Sci. Technol. 2012, 49, 173–183. [Google Scholar] [CrossRef] [PubMed]
- Zhang, J.; Li, L.; Kim, S.-H.; Hagerman, A.E.; Lü, J. Anti-cancer, anti-diabetic and other pharmacologic and biological activities of penta-galloyl-glucose. Pharm. Res. 2009, 26, 2066–2080. [Google Scholar] [CrossRef] [PubMed]
- Khan, A.N.; Singh, R.; Bhattacharya, A.; Chakravarti, R.; Roy, S.; Ravichandiran, V.; Ghosh, D. A Short Review on Glucogallin and its Pharmacological Activities. Mini-Rev. Med. Chem. 2022. [Google Scholar] [CrossRef]
- Basheer, C.; Balasubramanian, R.; Lee, H.K. Determination of organic micropollutants in rainwater using hollow fiber membrane/liquid-phase microextraction combined with gas chromatography–mass spectrometry. J. Chromatogr. A 2003, 1016, 11–20. [Google Scholar] [CrossRef]
- Cao, T.; Wang, J.; Wu, Y.; Wang, L.; Zhang, H. Antiglaucoma Potential of β-Glucogallin Is Mediated by Modulating Mitochondrial Responses in Experimentally Induced Glaucoma. Neuroimmunomodulation 2021, 27, 142–151. [Google Scholar] [CrossRef] [PubMed]
- Chang, K.-C.; Laffin, B.; Ponder, J.; Énzsöly, A.; Németh, J.; LaBarbera, D.V.; Petrash, J.M. Beta-glucogallin reduces the expression of lipopolysaccharide-induced inflammatory markers by inhibition of aldose reductase in murine macrophages and ocular tissues. Chem.-Biol. Interact. 2013, 202, 283–287. [Google Scholar] [CrossRef]
- Chang, K.C.; Laffin, B.; Ponder, J.; Enzsoly, A.; Nemeth, J.; LaBarbera, D.; Petrash, J. Beta-glucogallin Suppresses Lipopolysaccharide-induced Inflammatory Markers by Aldose Reductase Inhibition in Murine Macrophages and Ocular Tissues. Investig. Ophthalmol. Vis. Sci. 2013, 54, 2928. [Google Scholar]
- Puppala, M.; Ponder, J.; Suryanarayana, P.; Reddy, G.B.; Petrash, J.M.; LaBarbera, D.V. The isolation and characterization of β-glucogallin as a novel aldose reductase inhibitor from Emblica officinalis. PLoS ONE 2012, 7, e31399. [Google Scholar] [CrossRef]
- Medzhitov, R.; Horng, T. Transcriptional control of the inflammatory response. Nat. Rev. Immunol. 2009, 9, 692–703. [Google Scholar] [CrossRef]
- Aksentijevich, M.; Lateef, S.S.; Anzenberg, P.; Dey, A.K.; Mehta, N.N. Chronic inflammation, cardiometabolic diseases and effects of treatment: Psoriasis as a human model. Trends Cardiovasc. Med. 2020, 30, 472–478. [Google Scholar] [CrossRef]
- Park, C.; Cha, H.J.; Lee, H.; Kim, G.Y.; Choi, Y.H. The regulation of the TLR4/NF-κB and Nrf2/HO-1 signaling pathways is involved in the inhibition of lipopolysaccharide-induced inflammation and oxidative reactions by morroniside in RAW 264.7 macrophages. Arch. Biochem. Biophys. 2021, 706, 108926. [Google Scholar] [CrossRef]
- Kany, S.; Vollrath, J.T.; Relja, B. Cytokines in inflammatory disease. Int. J. Mol. Sci. 2019, 20, 6008. [Google Scholar] [CrossRef] [PubMed]
- Lu, X.; Min, L.; Wei, J.; Gou, H.; Bao, Z.; Wang, J.; Wang, Z.; Huang, Y.; An, B. Heliangin inhibited lipopolysaccharide-induced inflammation through signaling NF-κB pathway on LPS-induced RAW 264.7 cells. Biomed. Pharmacother. 2017, 88, 102–108. [Google Scholar] [CrossRef]
- Fang, Y.; Yang, L.; He, J. Plantanone C attenuates LPS-stimulated inflammation by inhibiting NF-κB/iNOS/COX-2/MAPKs/Akt pathways in RAW 264.7 macrophages. Biomed. Pharmacother. 2021, 143, 112104. [Google Scholar] [CrossRef] [PubMed]
- Liao, W.; He, X.; Yi, Z.; Xiang, W.; Ding, Y. Chelidonine suppresses LPS-Induced production of inflammatory mediators through the inhibitory of the TLR4/NF-κB signaling pathway in RAW264. 7 macrophages. Biomed. Pharmacother. 2018, 107, 1151–1159. [Google Scholar] [CrossRef] [PubMed]
- Bhatt, D.; Ghosh, S. Regulation of the NF-κB-mediated transcription of inflammatory genes. Front. Immunol. 2014, 5, 71. [Google Scholar] [CrossRef]
- Oeckinghaus, A.; Ghosh, S. The NF-κB family of transcription factors and its regulation. Cold Spring Harb. Perspect. Biol. 2009, 1, a000034. [Google Scholar] [CrossRef] [PubMed]
- Zhang, W.b.; Yang, F.; Wang, Y.; Jiao, F.z.; Zhang, H.y.; Wang, L.w.; Gong, Z.j. Inhibition of HDAC6 attenuates LPS-induced inflammation in macrophages by regulating oxidative stress and suppressing the TLR4-MAPK/NF-κB pathways. Biomed. Pharmacother. 2019, 117, 109166. [Google Scholar] [CrossRef] [PubMed]
- Park, B.S.; Song, D.H.; Kim, H.M.; Choi, B.S.; Lee, H.; Lee, J.O. The structural basis of lipopolysaccharide recognition by the TLR4–MD-2 complex. Nature 2009, 458, 1191–1195. [Google Scholar] [CrossRef]
- Furman, D.; Campisi, J.; Verdin, E.; Carrera-Bastos, P.; Targ, S.; Franceschi, C.; Ferrucci, L.; Gilroy, D.W.; Fasano, A.; Miller, G.W.; et al. Chronic inflammation in the etiology of disease across the life span. Nat. Med. 2019, 25, 1822–1832. [Google Scholar] [CrossRef]
- Xaus, J.; Comalada, M.; Valledor, A.F.; Lloberas, J.; López-Soriano, F.; Argilés, J.M.; Bogdan, C.; Celada, A. LPS induces apoptosis in macrophages mostly through the autocrine production of TNF-α. Blood. J. Am. Soc. Hematol. 2000, 95, 3823–3831. [Google Scholar]
- Decker, K.; Keppler, D. Galactosamine hepatitis: Key role of the nucleotide deficiency period in the pathogenesis of cell injury and cell death. Rev. Physiol. Biochem. Pharmacol. 1974, 71, 77–106. [Google Scholar]
- Khan, A.N. Glucogallin Attenuates RAW 264.7 Cells from Arsenic Trioxide Induced Toxicity via the NF-κB/NLRP3 Pathway. Molecules 2022, 27, 5263. [Google Scholar] [CrossRef]
- Hotchkiss, R.S.; Moldawer, L.L.; Opal, S.M.; Reinhart, K.; Turnbull, I.R.; Vincent, J.L. Sepsis and septic shock. Nat. Rev. Dis. Primers 2016, 2, 1–21. [Google Scholar] [CrossRef] [PubMed]
- Tang, H.; Roy, P.; Di, Q.; Ma, X.; Xiao, Y.; Wu, Z.; Quan, J.; Zhao, J.; Xiao, W.; Chen, W. Synthesis compound XCR-7a ameliorates LPS-induced inflammatory response by inhibiting the phosphorylation of c-Fos. Biomed. Pharmacother. 2022, 145, 112468. [Google Scholar] [CrossRef] [PubMed]
- Kim, H.-G.; Kim, K.S.; Kim, M.; Shin, S.-H.; Lee, Y.-G.; Bang, M.-H.; Lee, D.-G.; Baek, N.-I. β-Glucogallin isolated from Fusidium coccineum and its enhancement of skin barrier effects. Appl. Biol. Chem. 2020, 63, 77. [Google Scholar] [CrossRef]
- Hirayama, D.; Iida, T.; Nakase, H. The phagocytic function of macrophage-enforcing innate immunity and tissue homeostasis. Int. J. Mol. Sci. 2017, 19, 92. [Google Scholar] [CrossRef] [PubMed]
- Hanna, P.C.; Kruskal, B.A.; Ezekowitz, R.A.B.; Bloom, B.R.; Collier, R.J. Role of macrophage oxidative burst in the action of anthrax lethal toxin. Mol. Med. 1994, 1, 7–18. [Google Scholar] [CrossRef]
- Snezhkina, A.V.; Kudryavtseva, A.V.; Kardymon, O.L.; Savvateeva, M.V.; Melnikova, N.V.; Krasnov, G.S.; Dmitriev, A.A. ROS generation and antioxidant defense systems in normal and malignant cells. Oxidative Med. Cell. Longev. 2019, 2019, 6175804. [Google Scholar] [CrossRef]
- Canton, M.; Sánchez-Rodríguez, R.; Spera, I.; Venegas, F.C.; Favia, M.; Viola, A.; Castegna, A. Reactive Oxygen Species in Macrophages: Sources and Targets. Front. Immunol. 2021, 12, 734229. [Google Scholar] [CrossRef]
- Turrens, J.F. Mitochondrial formation of reactive oxygen species. J. Physiol. 2003, 552, 335–344. [Google Scholar] [CrossRef]
- Aldini, G.; Altomare, A.; Baron, G.; Vistoli, G.; Carini, M.; Borsani, L.; Sergio, F. N-Acetylcysteine as an antioxidant and disulphide breaking agent: The reasons why. Free Radic. Res. 2018, 52, 751–762. [Google Scholar] [CrossRef] [PubMed]
- Soufli, I.; Toumi, R.; Rafa, H.; Touil-Boukoffa, C. Overview of cytokines and nitric oxide involvement in immuno-pathogenesis of inflammatory bowel diseases. World J. Gastrointest. Pharmacol. Ther. 2016, 7, 353–360. [Google Scholar] [CrossRef] [PubMed]
- Kolios, G.; Valatas, V.; Ward, S.G. Nitric oxide in inflammatory bowel disease: A universal messenger in an unsolved puzzle. Immunology 2004, 113, 427–437. [Google Scholar] [CrossRef] [PubMed]
- Shen, Y.-C.; Shiao, Y.-J.; Sung, Y.-J.; Wang, C.-N. Pathogenesis of neurodegenerative diseases and the effect of natural products on nitric oxide production implicating in these diseases. J. Chin. Med. 2005, 16, 63–87. [Google Scholar]
- Ricciotti, E.; FitzGerald, G.A. Prostaglandins and inflammation. Arterioscler. Thromb. Vasc. Biol. 2011, 31, 986–1000. [Google Scholar] [CrossRef]
- Lu, Y.-C.; Yeh, W.-C.; Ohashi, P.S. LPS/TLR4 signal transduction pathway. Cytokine 2008, 42, 145–151. [Google Scholar] [CrossRef]
- Haque, A.; Koide, N.; Iftakhar-E-Khuda, I.; Noman, A.S.M.; Odkhuu, E.; Badamtseren, B.; Naiki, Y.; Komatsu, T.; Yoshida, T.; Yokochi, T. Flavopiridol inhibits lipopolysaccharide-induced TNF-α production through inactivation of nuclear factor-κB and mitogen-activated protein kinases in the MyD88-dependent pathway. Microbiol. Immunol. 2011, 55, 160–167. [Google Scholar] [CrossRef]
- Jana, K.; Jana, N.; De, D.K.; Guha, S.K. Ethanol induces mouse spermatogenic cell apoptosis in vivo through over-expression of Fas/Fas-L, p53, and caspase-3 along with cytochrome c translocation and glutathione depletion. Mol. Reprod. Dev. 2010, 77, 820–833. [Google Scholar] [CrossRef]
- Chen, Z.J. Ubiquitin signalling in the NF-κB pathway. Nat. Cell Biol. 2005, 7, 758–765. [Google Scholar] [CrossRef]
- Pacher, P.; Beckman, J.S.; Liaudet, L. Nitric Oxide and Peroxynitrite in Health and Disease. Physiol. Rev. 2007, 87, 315–424. [Google Scholar] [CrossRef]
- Liu, T.; Zhang, L.; Joo, D.; Sun, S.C. NF-κB signaling in inflammation. Signal Transduct. Target. Ther. 2017, 2, 17023. [Google Scholar] [CrossRef] [PubMed]
- Chaplin, D.D. Overview of the immune response. J. Allergy Clin. Immunol. 2010, 125, S3–S23. [Google Scholar] [CrossRef] [PubMed]
- Leyva-López, N.; Gutierrez-Grijalva, E.P.; Ambriz-Perez, D.L.; Heredia, J.B. Flavonoids as cytokine modulators: A possible therapy for inflammation-related diseases. Int. J. Mol. Sci. 2016, 17, 921. [Google Scholar] [CrossRef] [PubMed]
- Kesavardhana, S.; Kanneganti, T.-D. Mechanisms governing inflammasome activation, assembly and pyroptosis induction. Int. Immunol. 2017, 29, 201–210. [Google Scholar] [CrossRef]
- Strowig, T.; Henao-Mejia, J.; Elinav, E.; Flavell, R. Inflammasomes in health and disease. Nature 2012, 481, 278–286. [Google Scholar] [CrossRef]
- McCubrey, J.A.; Lertpiriyapong, K.; Steelman, L.S.; Abrams, S.L.; Yang, L.V.; Murata, R.M.; Rosalen, P.L.; Scalisi, A.; Neri, L.M.; Cocco, L.; et al. Effects of resveratrol, curcumin, berberine and other nutraceuticals on aging, cancer development, cancer stem cells and microRNAs. Aging 2017, 9, 1477–1536. [Google Scholar] [CrossRef] [PubMed]
- Menon, V.P.; Sudheer, A.R. Antioxidant and anti-inflammatory properties of curcumin. In The Molecular Targets and Therapeutic Uses of Curcumin in Health and Disease; Springer Science & Business Media: Berlin/Heidelberg, Germany, 2007; pp. 105–125. [Google Scholar]
- Ghosh, D.; Maiti, T.K. Immunomodulatory and anti-tumor activities of native and heat denatured Abrus agglutinin. Immunobiology 2007, 212, 589–599. [Google Scholar] [CrossRef]
- Chandel, S.; Singh, R.; Gautam, A.; Ravichandiran, V. Screening of Azadirachta indica phytoconstituents as GSK-3β inhibitor and its implication in neuroblastoma: Molecular docking, molecular dynamics, MM-PBSA binding energy, and in-vitro study. J. Biomol. Struct. Dyn. 2021, 27, 1–14. [Google Scholar] [CrossRef]
- Singh, R.; Gautam, A.; Chandel, S.; Ghosh, A.; Dey, D.; Roy, S.; Ravichandiran, V.; Ghosh, D. Protease inhibitory effect of natural polyphenolic compounds on SARS-CoV-2: An in silico study. Molecules 2020, 25, 4604. [Google Scholar] [CrossRef]
- Dallakyan, S.; Olson, A.J. Small-molecule library screening by docking with PyRx. In Chemical Biology; Springer: Berlin/Heidelberg, Germany, 2015; pp. 243–250. [Google Scholar]
- Gurcan, M.N.; Boucheron, L.E.; Can, A.; Madabhushi, A.; Rajpoot, N.M.; Yener, B. Histopathological image analysis: A review. IEEE Rev. Biomed. Eng. 2009, 2, 147–171. [Google Scholar] [CrossRef]
- Donaldson, J.G. Immunofluorescence staining. Curr. Protoc. Cell Biol. 2015, 69, 4.3.1–4.3.7. [Google Scholar] [CrossRef] [PubMed]


| Primers | Sequence (5′ to 3′) |
|---|---|
| β-actin F | AGCTTACTGCTCTGGCTCCTAGC |
| β-actin R | ACTCATCGTACTCCTGCTTGCT |
| COX-2 F | TGGTGCCTGGTCTGATGATG |
| COX-2 R | GTGGTAACCGCTCAGGTGTTG |
| iNOS2 F | CCCTCCTGATCTTGTGTTGGA |
| iNOS2 R | TCAACCCGAGCTCCTGGAA |
| MyD88 F | GTTGTGTGTGTCCGACCGT |
| MyD88 R | GTCAGAAACAACCACCACCATGC |
| TRAF 6 F | CATCTTCAGTTACCGACAGCTCAG |
| TRAF 6 R | TGGTCGAGAATTGTAAGGCGTAT |
| TRAM F | GGCCTGGACCATCTTGTTAC |
| TRAM R | CATGGGTATGACGGAGTTGT |
| NF-κB F | CCAAAGAAGGACACGACAGAATC |
| NF-κB R | GGCAGGCTATTGCTCATCACA |
| c-JUN F | GGCAGGCTATTGCTCATCACA |
| c-JUN R | GAAGTTGCTGAGGTTGGCCTA |
| FAS F | CGCTGTTTTCCCTTGCTG |
| FAS R | CCTTGAGTATGAACTCTTAACTGTGAG |
| c-FOS F | AGAGCGGGAATGGTGAAGA |
| c-FOS R | TCTTCCTCTTCAGGAGATAGCTG |
| TLR4 F | CTGGGTGAGAAAGCTGGTAA |
| TLR4 R | AGCCTTCCTGGATGATGTTGG |
| TRIF F | TGGCAAACACCTTCAAGACA |
| TRIF R | GCGCTTTCTTCCAGCGTA |
Publisher’s Note: MDPI stays neutral with regard to jurisdictional claims in published maps and institutional affiliations. |
© 2022 by the authors. Licensee MDPI, Basel, Switzerland. This article is an open access article distributed under the terms and conditions of the Creative Commons Attribution (CC BY) license (https://creativecommons.org/licenses/by/4.0/).
Share and Cite
Singh, R.; Chandel, S.; Ghosh, A.; Matta, T.; Gautam, A.; Bhattacharya, A.; Babu, S.S.; Sukla, S.; Nag, D.; Ravichandiran, V.; et al. Glucogallin Attenuates the LPS-Induced Signaling in Macrophages and Protects Mice against Sepsis. Int. J. Mol. Sci. 2022, 23, 11254. https://doi.org/10.3390/ijms231911254
Singh R, Chandel S, Ghosh A, Matta T, Gautam A, Bhattacharya A, Babu SS, Sukla S, Nag D, Ravichandiran V, et al. Glucogallin Attenuates the LPS-Induced Signaling in Macrophages and Protects Mice against Sepsis. International Journal of Molecular Sciences. 2022; 23(19):11254. https://doi.org/10.3390/ijms231911254
Chicago/Turabian StyleSingh, Rajveer, Shivani Chandel, Arijit Ghosh, Tushar Matta, Anupam Gautam, Arka Bhattacharya, Srivalliputturu Sarath Babu, Soumi Sukla, Debasish Nag, Velayutham Ravichandiran, and et al. 2022. "Glucogallin Attenuates the LPS-Induced Signaling in Macrophages and Protects Mice against Sepsis" International Journal of Molecular Sciences 23, no. 19: 11254. https://doi.org/10.3390/ijms231911254
APA StyleSingh, R., Chandel, S., Ghosh, A., Matta, T., Gautam, A., Bhattacharya, A., Babu, S. S., Sukla, S., Nag, D., Ravichandiran, V., Roy, S., & Ghosh, D. (2022). Glucogallin Attenuates the LPS-Induced Signaling in Macrophages and Protects Mice against Sepsis. International Journal of Molecular Sciences, 23(19), 11254. https://doi.org/10.3390/ijms231911254