Article

Baicalin Alleviates Short-Term Lincomycin-Induced Intestinal and Liver Injury and Inflammation in Infant Mice

State Key Laboratory of Animal Nutrition, Institute of Animal Science, Chinese Academy of Agricultural Sciences, Beijing 100193, China
*
Authors to whom correspondence should be addressed.
These authors contributed equally to this work.
Int. J. Mol. Sci. 2022, 23(11), 6072; https://doi.org/10.3390/ijms23116072
Submission received: 25 April 2022 / Revised: 22 May 2022 / Accepted: 26 May 2022 / Published: 28 May 2022
(This article belongs to the Special Issue Natural Compounds for Inflammation and Anti-inflammatory Mechanism)

Abstract

:
The adverse effects of short-term megadose of antibiotics exposure on the gastrointestinal and liver tissue reactions in young children have been reported. Antibiotic-induced intestinal and liver reactions are usually unpredictable and present a poorly understood pathogenesis. It is, therefore, necessary to develop strategies for reducing the adverse effects of antibiotics. Studies on the harm and rescue measures of antibiotics from the perspective of the gut–liver system are lacking. Here, we demonstrate that lincomycin exposure reduced body weight, disrupted the composition of gut microbiota and intestinal morphology, triggered immune-mediated injury and inflammation, caused liver dysfunction, and affected lipid metabolism. However, baicalin administration attenuated the lincomycin-induced changes. Transcriptome analysis showed that baicalin improved immunity in mice, as evidenced by the decreased levels of intestinal inflammatory cytokines and expression of genes that regulate Th1, Th2, and Th17 cell differentiation, and inhibited mucin type O-glycan biosynthesis pathways. In addition, baicalin improved liver function by upregulating the expression of genes involved in bile acid secretion and lipid degradation, and downregulating genes involved in lipid synthesis in lincomycin-treated mice. Bile acids can regulate intestinal immunity and strengthen hepatoenteric circulation. In addition, baicalin also improved anti-inflammatory bacteria abundance (Blautia and Coprobacillus) and reduced pathogenic bacteria abundance (Proteobacteria, Klebsiella, and Citrobacter) in lincomycin-treated mice. Thus, baicalin can ameliorate antibiotic-induced injury and its associated complications such as liver disease.

Graphical Abstract

1. Introduction

Developed countries have reduced the use of antibiotics in pediatric clinical medicine [1]. However, to achieve ideal treatment effects, megadose antibiotics use during infections remains important. Therefore, there is a need to elucidate on the effects of short-term megadose antibiotic exposure on children. Lincomycin and related antibiotics, such as clindamycin, are widely used as prophylactic measure in gastrointestinal operations, including in colorectal cancer resection [2]. Long-term lincomycin applications are associated with various side effects, including diarrhea, inflammatory bowel diseases, pseudomembranous colitis, and liver dysfunctions [3]. Often, these effects are difficult to be detected and controlled, and persist as “secondary damage” to the patient, sometimes leading to severe sepsis [4]. Short-term (one week) lincomycin exposure leads to intestinal microbial disturbance and inflammation [5]. Antibiotics are also the most common drug class causing liver injury [6]. Antibiotic-induced hepatotoxic reactions are usually idiosyncratic, unpredictable, and present a poorly understood pathogenesis [7]. Antibiotic-induced liver injury is a more challenge in the pediatric setting, even for short periods of exposure because of the age-dependent maturation of the cytochrome P450 enzymes involved in the antibiotic metabolism [8]. Therefore, minimizing antibiotics-associated adverse effects is particularly important.
It has been verified that antibiotic exposures can also damage the liver by disrupting the intestinal barrier, which allows live commensal gut microbiota to translocate to the liver and leads to impaired T-cell functions in the liver [9]. Moreover, communication of inflammatory mediators between the gut and the liver means that gut homeostasis dysregulation affects liver health [10]. However, studies on the harm and rescue measures of antibiotics from the perspective of the gut–liver system are lacking.
Baicalin, a kind of flavonoid extracted from the root of Scutellaria, has received much more attention due to its extensive pharmacological activities, including anti-inflammation, anti-oxidation, anti-apoptosis, and the protective effects on intestinal and liver disease [11]. Baicalin regulates intestinal immunity and protects against intestinal damage due to ulcerative colitis and sepsis [12,13]. Baicalin protects against several types of liver diseases including viral hepatitis, fatty liver disease, xenobiotic-induced liver injury, cholestatic liver injury, and hepatocellular carcinoma, with a variety of pharmacological mechanisms [14]. It reverses the epithelial–mesenchymal transition through the inhibition of the TGF-β1/Smad3 pathway in vitro to prevent the development of liver fibrosis [15]. However, the significance of baicalin in the repair of antibiotic-induced gut and liver injury has not been systematically reported.
In this study, through RNA-seq and 16s microbiome, we aimed at elucidating on the relevant signaling pathways and potential molecular mechanisms through which baicalin ameliorates short-term lincomycin-induced intestinal and liver injury in infant mice models. Our findings expand our knowledge on antibiotic-induced injury and provide new avenues for identifying potential therapeutic targets for treatment of antibiotic-induced injury and its complications.

2. Results

2.1. Growth Performance and Intestinal and Liver Morphologies

Body weight gain for the LM group was less than CON and LM + BL in the second week (p < 0.05, Figure 1A). Lincomycin exposure reduced the liver weight/BW, but baicalin restored the liver weight/BW to CON levels (Figure 1D, p < 0.05). Baicalin reduced water intake/feed intake in the second week (Figure S1A, p < 0.05, see Supplementary Materials). There was significant increase in serum IL-1β and TNF-α levels in the LM group compared to the CON group (p < 0.05); however, serum IL-1β, IL-6, and TNF-α levels in the LM + BL group were markedly decreased compared to the LM group (Figure 1B, p < 0.05).
Pathologic examination confirmed the therapeutic potency of baicalin in ameliorating the phenotypes of lincomycin-treated mice, namely, hepatocyte injury and ballooning (Figure 1C). In addition, glutathione peroxidase (GSH-PX) levels in serum were reduced by lincomycin but restored to control levels by baicalin (Figure 1E, p < 0.05). Baicalin increased total bile acid (TBA) levels in the livers of lincomycin-treated mice compared to CON (Figure 1F, p < 0.05).
Jejunum histology was disrupted in LM group, with irregular epithelial cells, short and exfoliated villi, and shallow crypts (Figure 1D). However, these damages were improved by baicalin, as shown by regular cell arrangement in thicker and longer villi and deeper crypts. Lincomycin exposure significantly reduced jejunum villi height and crypt depth (p < 0.05), but baicalin restored jejunum villi height to the control level (Figure 2B, p < 0.05). Lincomycin exposure decreased colon crypt depth and muscular layer width (Figure 2C, p < 0.05). Lincomycin exposure also induced inflammatory cell infiltration (Figure 2A). Interestingly, baicalin improved colon muscular layer thickness (Figure 2C, p < 0.05). Baicalin also tended to increase zonula occludens 1 (ZO-1) expressions in lincomycin-treated mice (Figure S1B, p = 0.0893), while baicalin decreased Mucin2 expressions in lincomycin-treated mice (Figure S1B, p < 0.05).

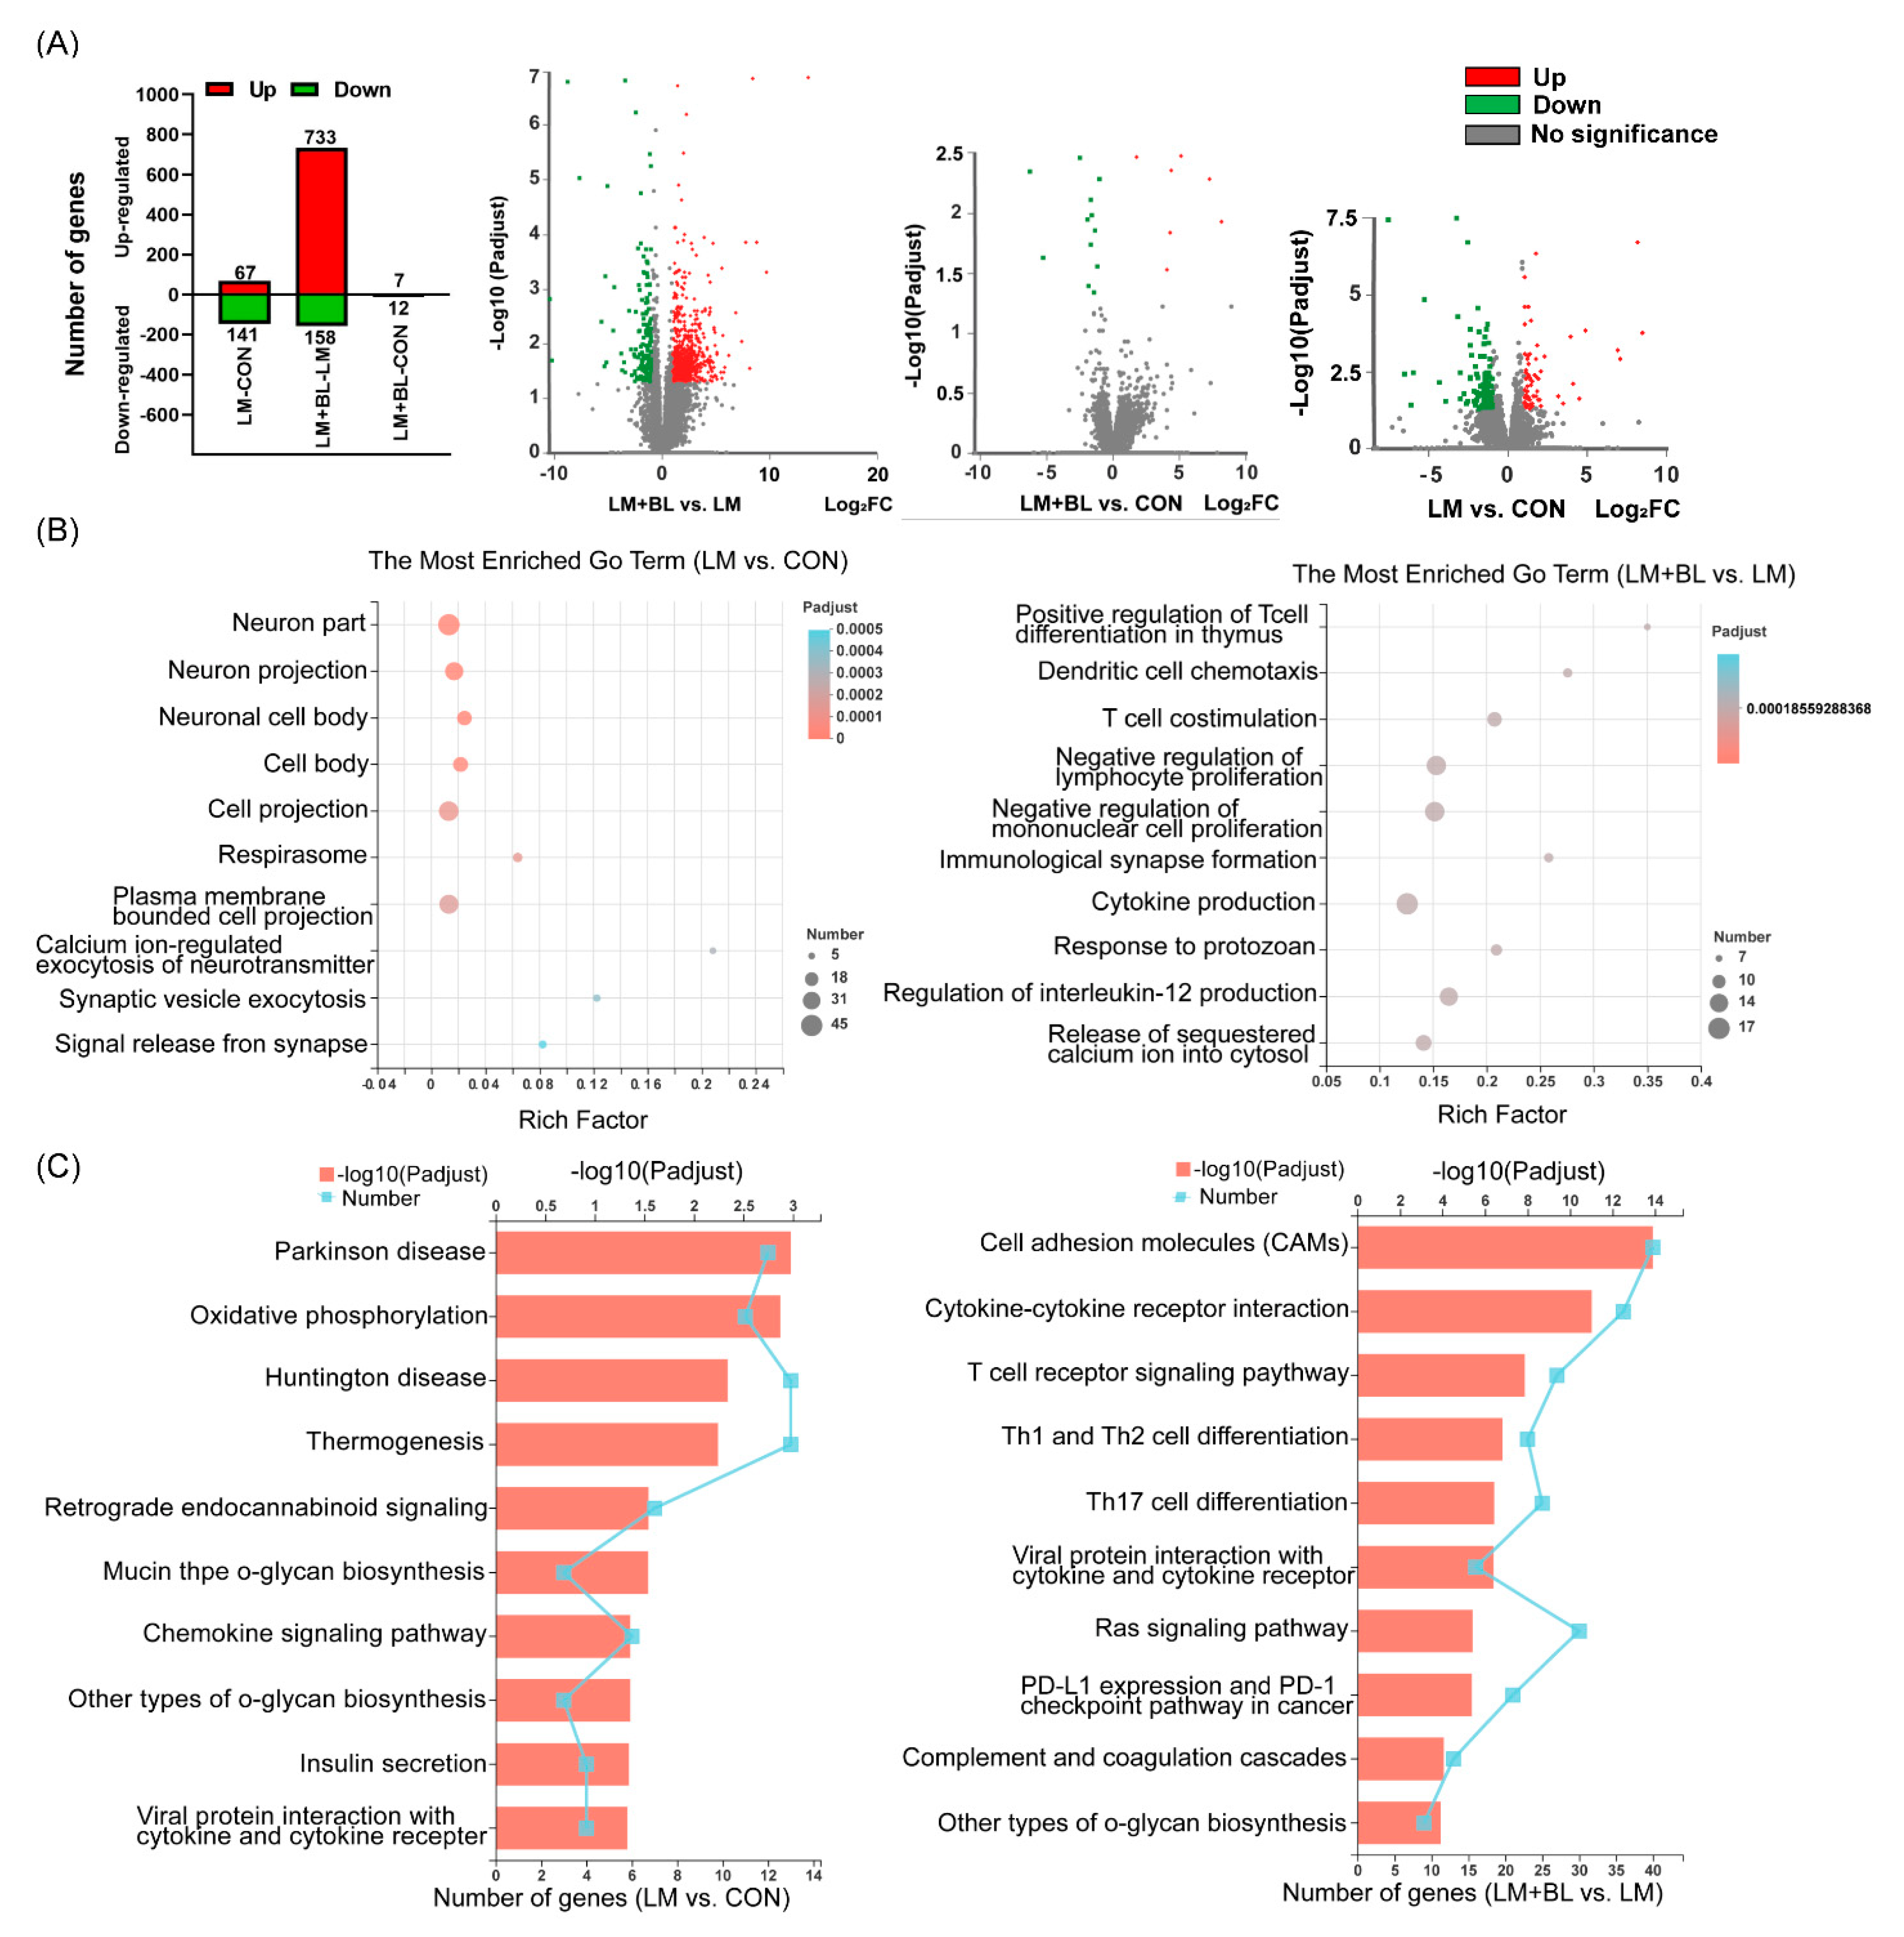
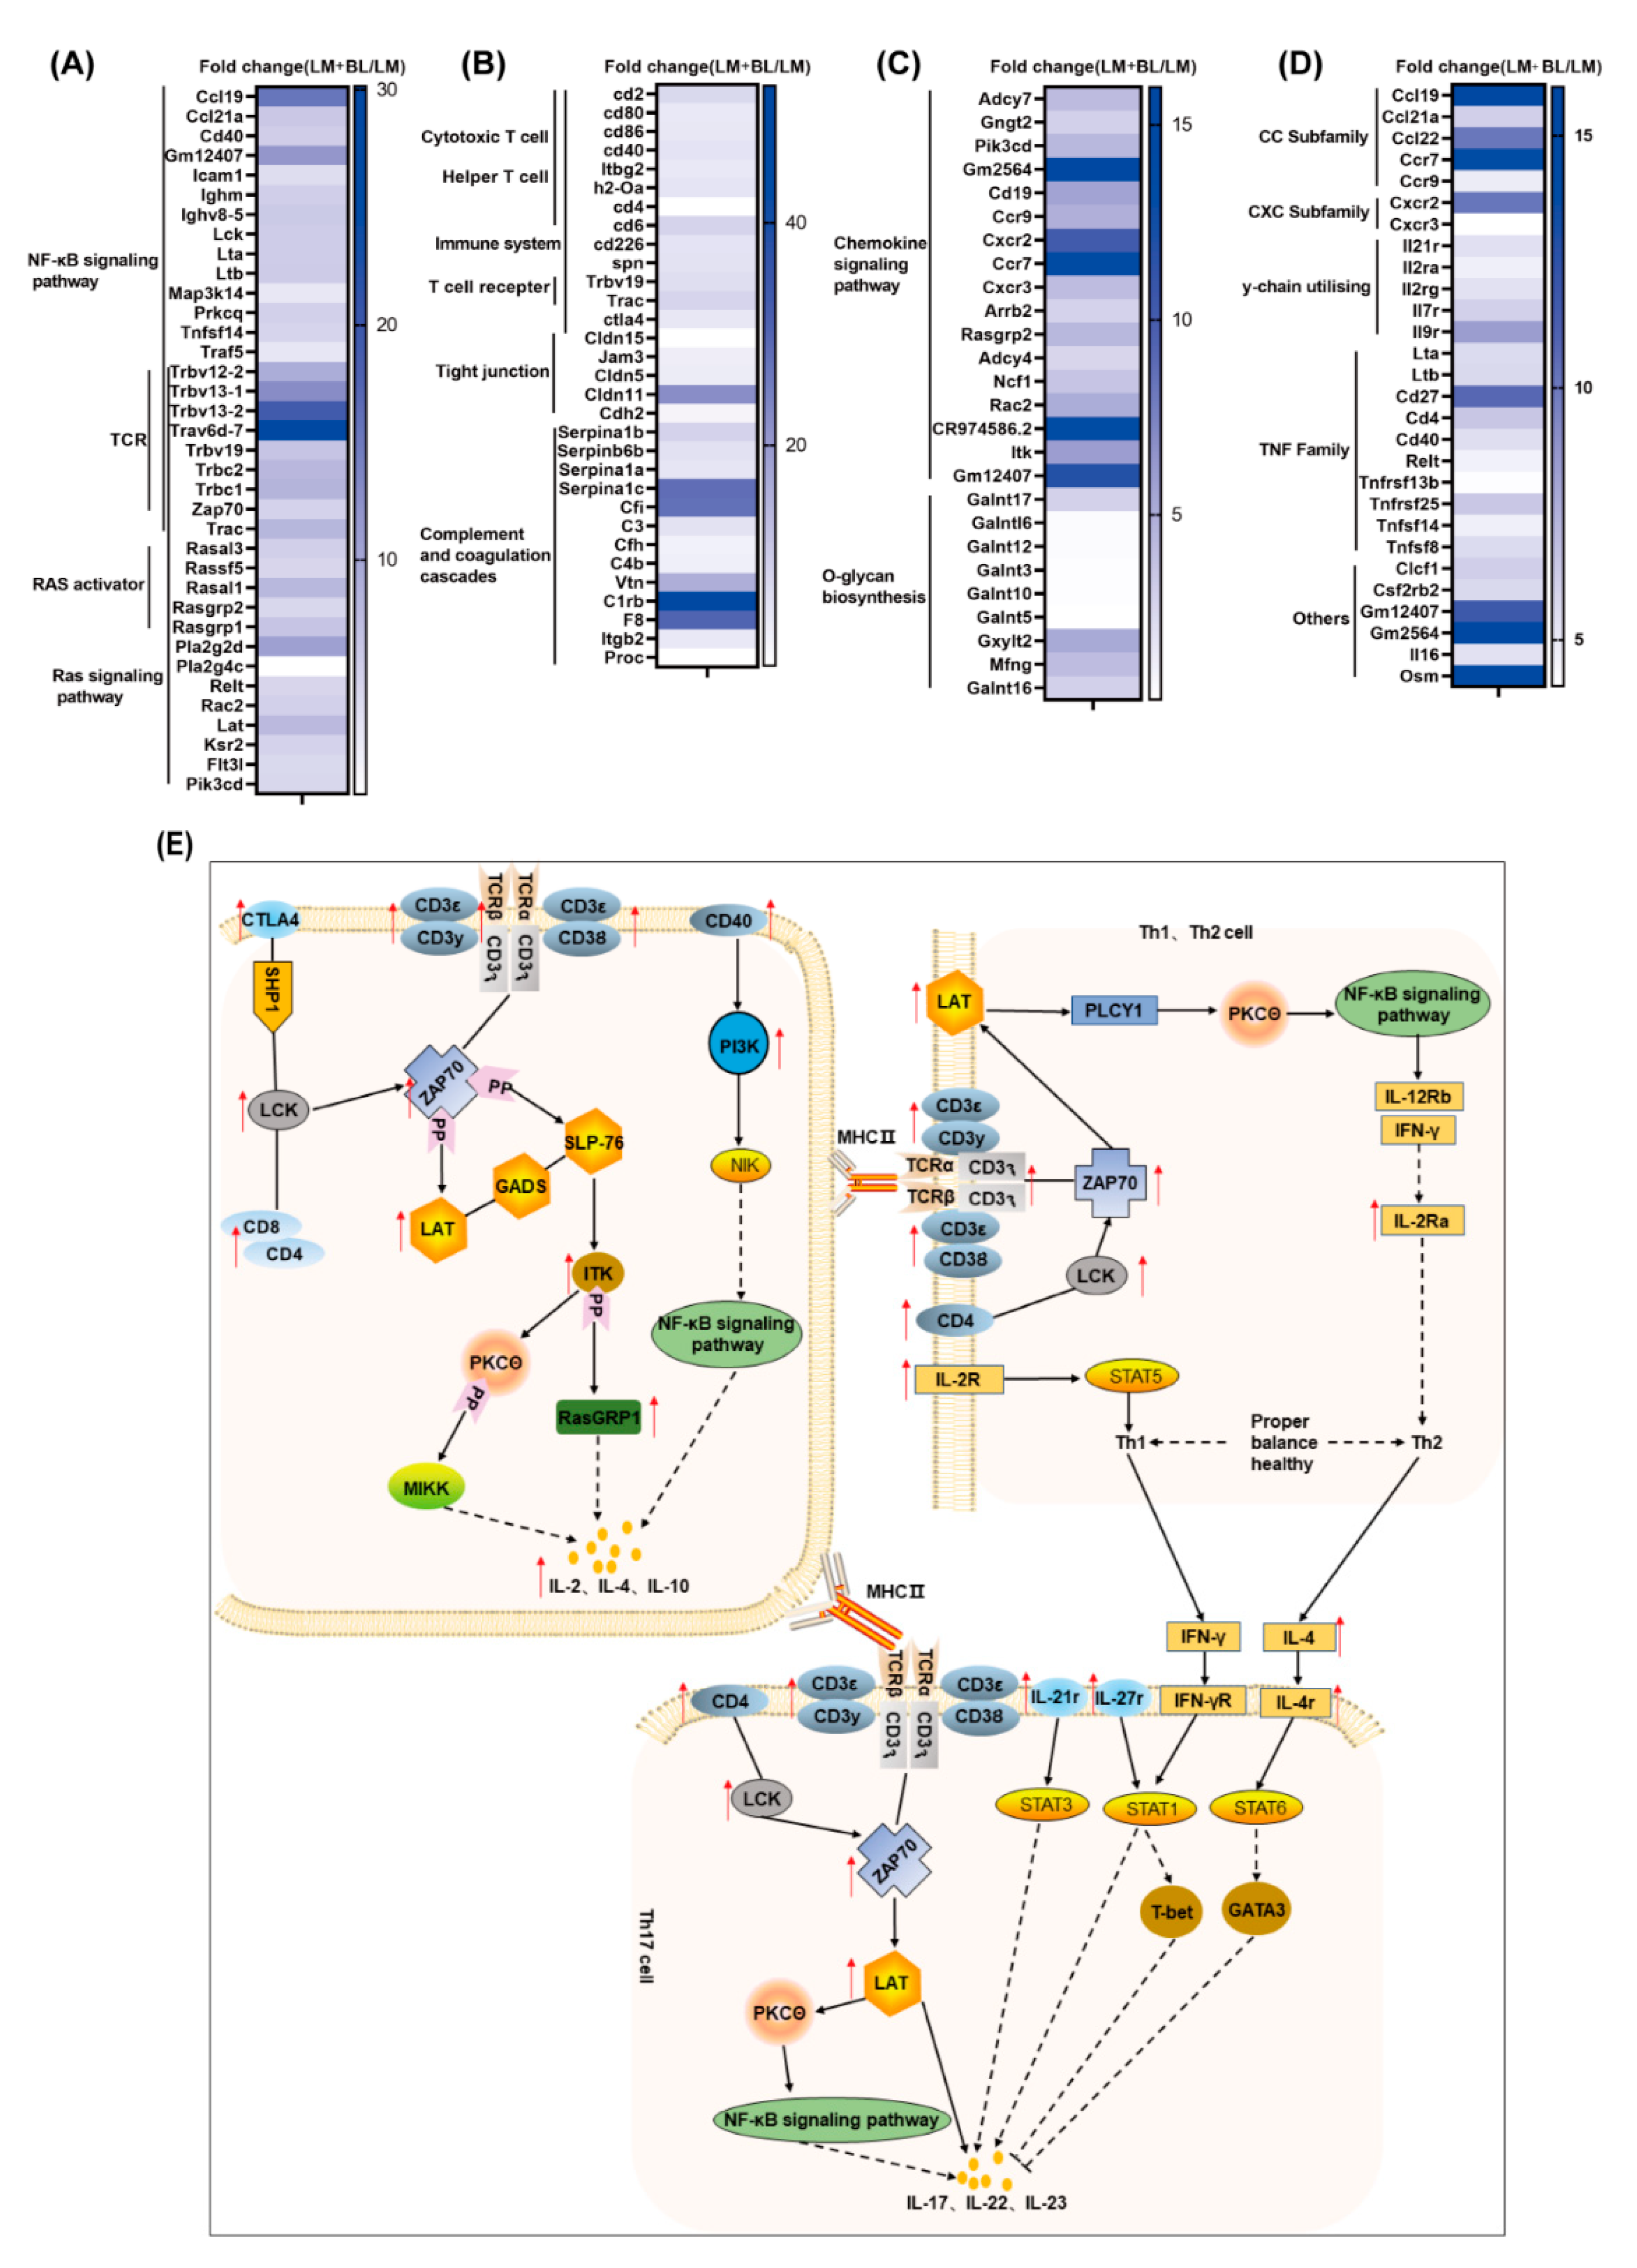
2.2. Colon Transcriptome

There were 67 upregulated and 141 downregulated DEGs (p-adjust < 0.05 and absolute fold change ≥ 2) in LM vs. CON, 733 upregulated and 158 downregulated DEGs (p-adjust < 0.05 and absolute fold change ≥ 2) in LM + BL vs. LM, and only 7 upregulated and 12 downregulated DEGs (p-adjust < 0.05 and absolute fold change ≥ 2) in LM + BL vs. CON (Figure 2A). The DEGs in LM + BL vs. CON were enriched in the functions of neurons (neuron part, neuron projection, neuronal cell body), cells (cell body, cell projection, respirasome, plasma-membrane-bounded cell projection), and synapses (calcium-ion-regulated exocytosis of neurotransmitters, synaptic vesicle exocytosis, signal release), and were mainly involved in pathways of some disease (Parkinson’s disease, oxidative phosphorylation, Huntington’s disease, thermogenesis, retrograde endocannabinoid signaling), mucin and other types of O-glycan biosynthesis, and insulin secretion (Figure 3B,C). The DEGs in LM + BL vs. LM were enriched in immune functions, such as the regulation of immune cells (T cells, dendritic cells, lymphocytes, and monocytes), cytokine production, and responses to protozoans. KEGG pathway analysis showed that these DEGs were highly enriched in pathways of T-cell receptor signaling; Th1, Th2, and Th17 cell differentiation; cytokine with cytokine receptor; and viral protein interactions (Figure 3B,C). Then, the expression patterns of DEGs that both selected in LM + BL vs. LM and LM vs. CON (p-adjust < 0.05 and absolute fold change ≥ 2) were similar in LM + BL and CON groups, but contrary to the LM group (Figure S2A,B). These DEGs were enriched in mucin type and other types O-glycan biosynthesis pathways (Figure S2C).

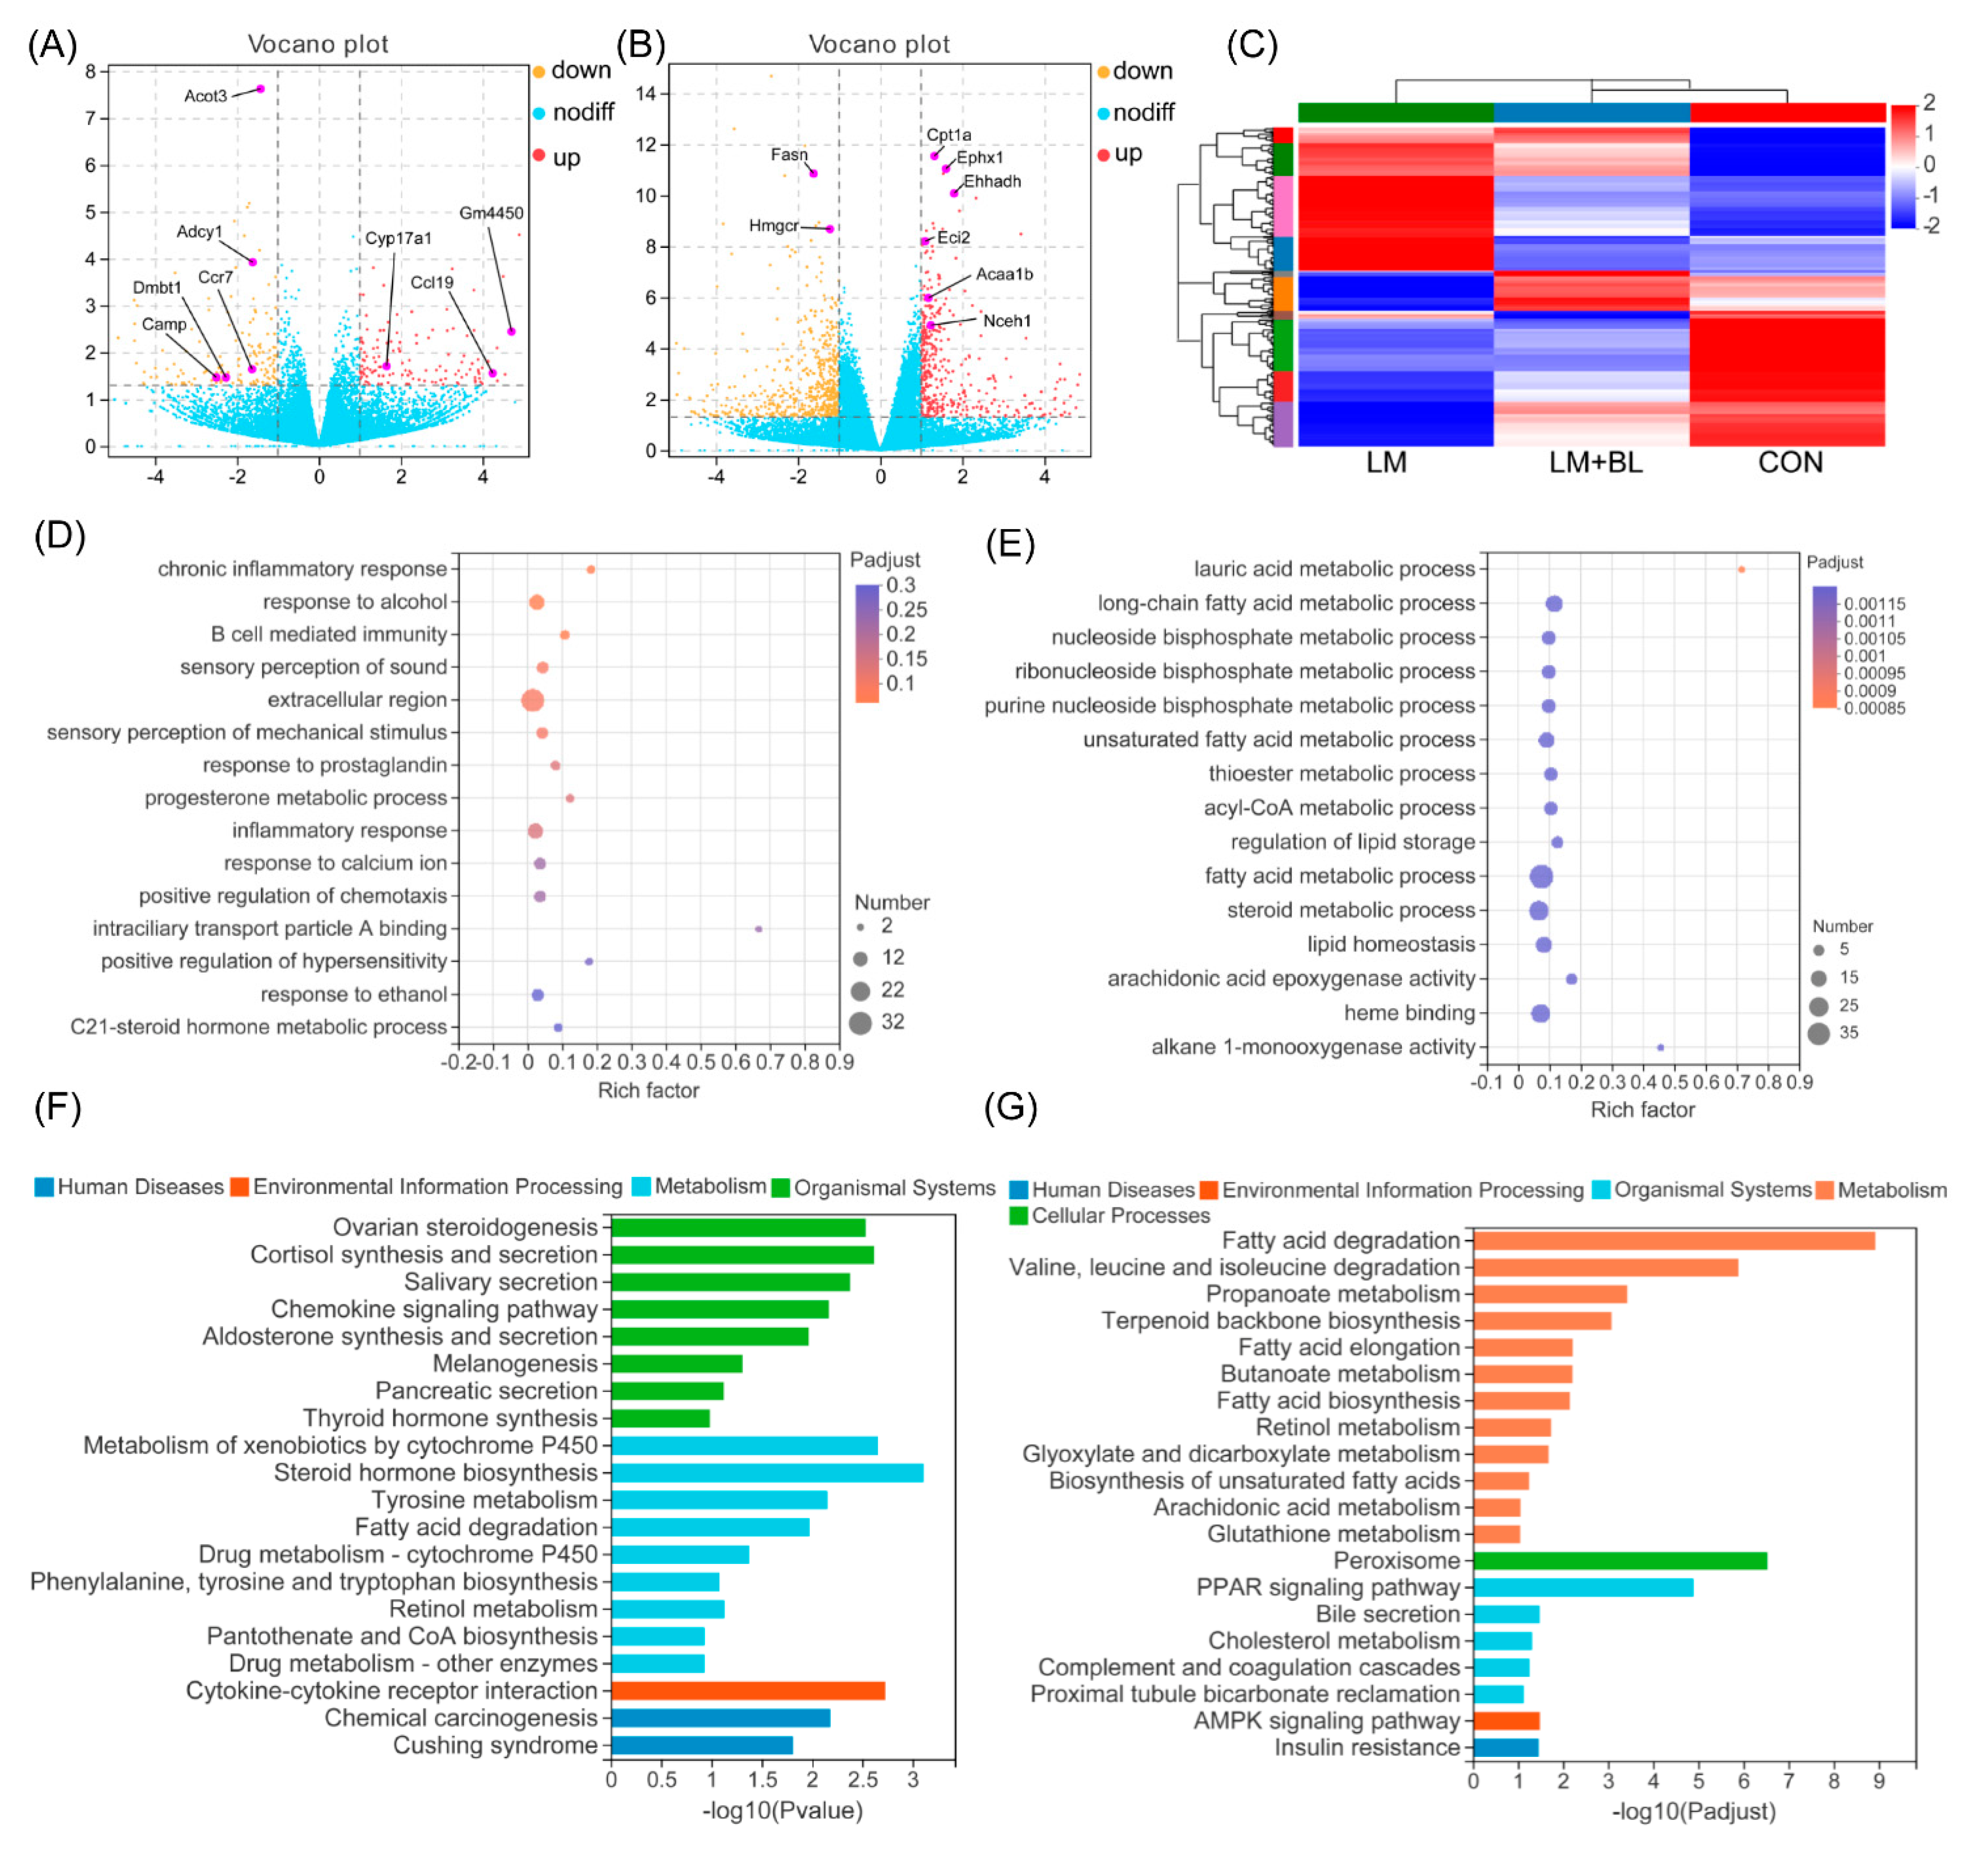
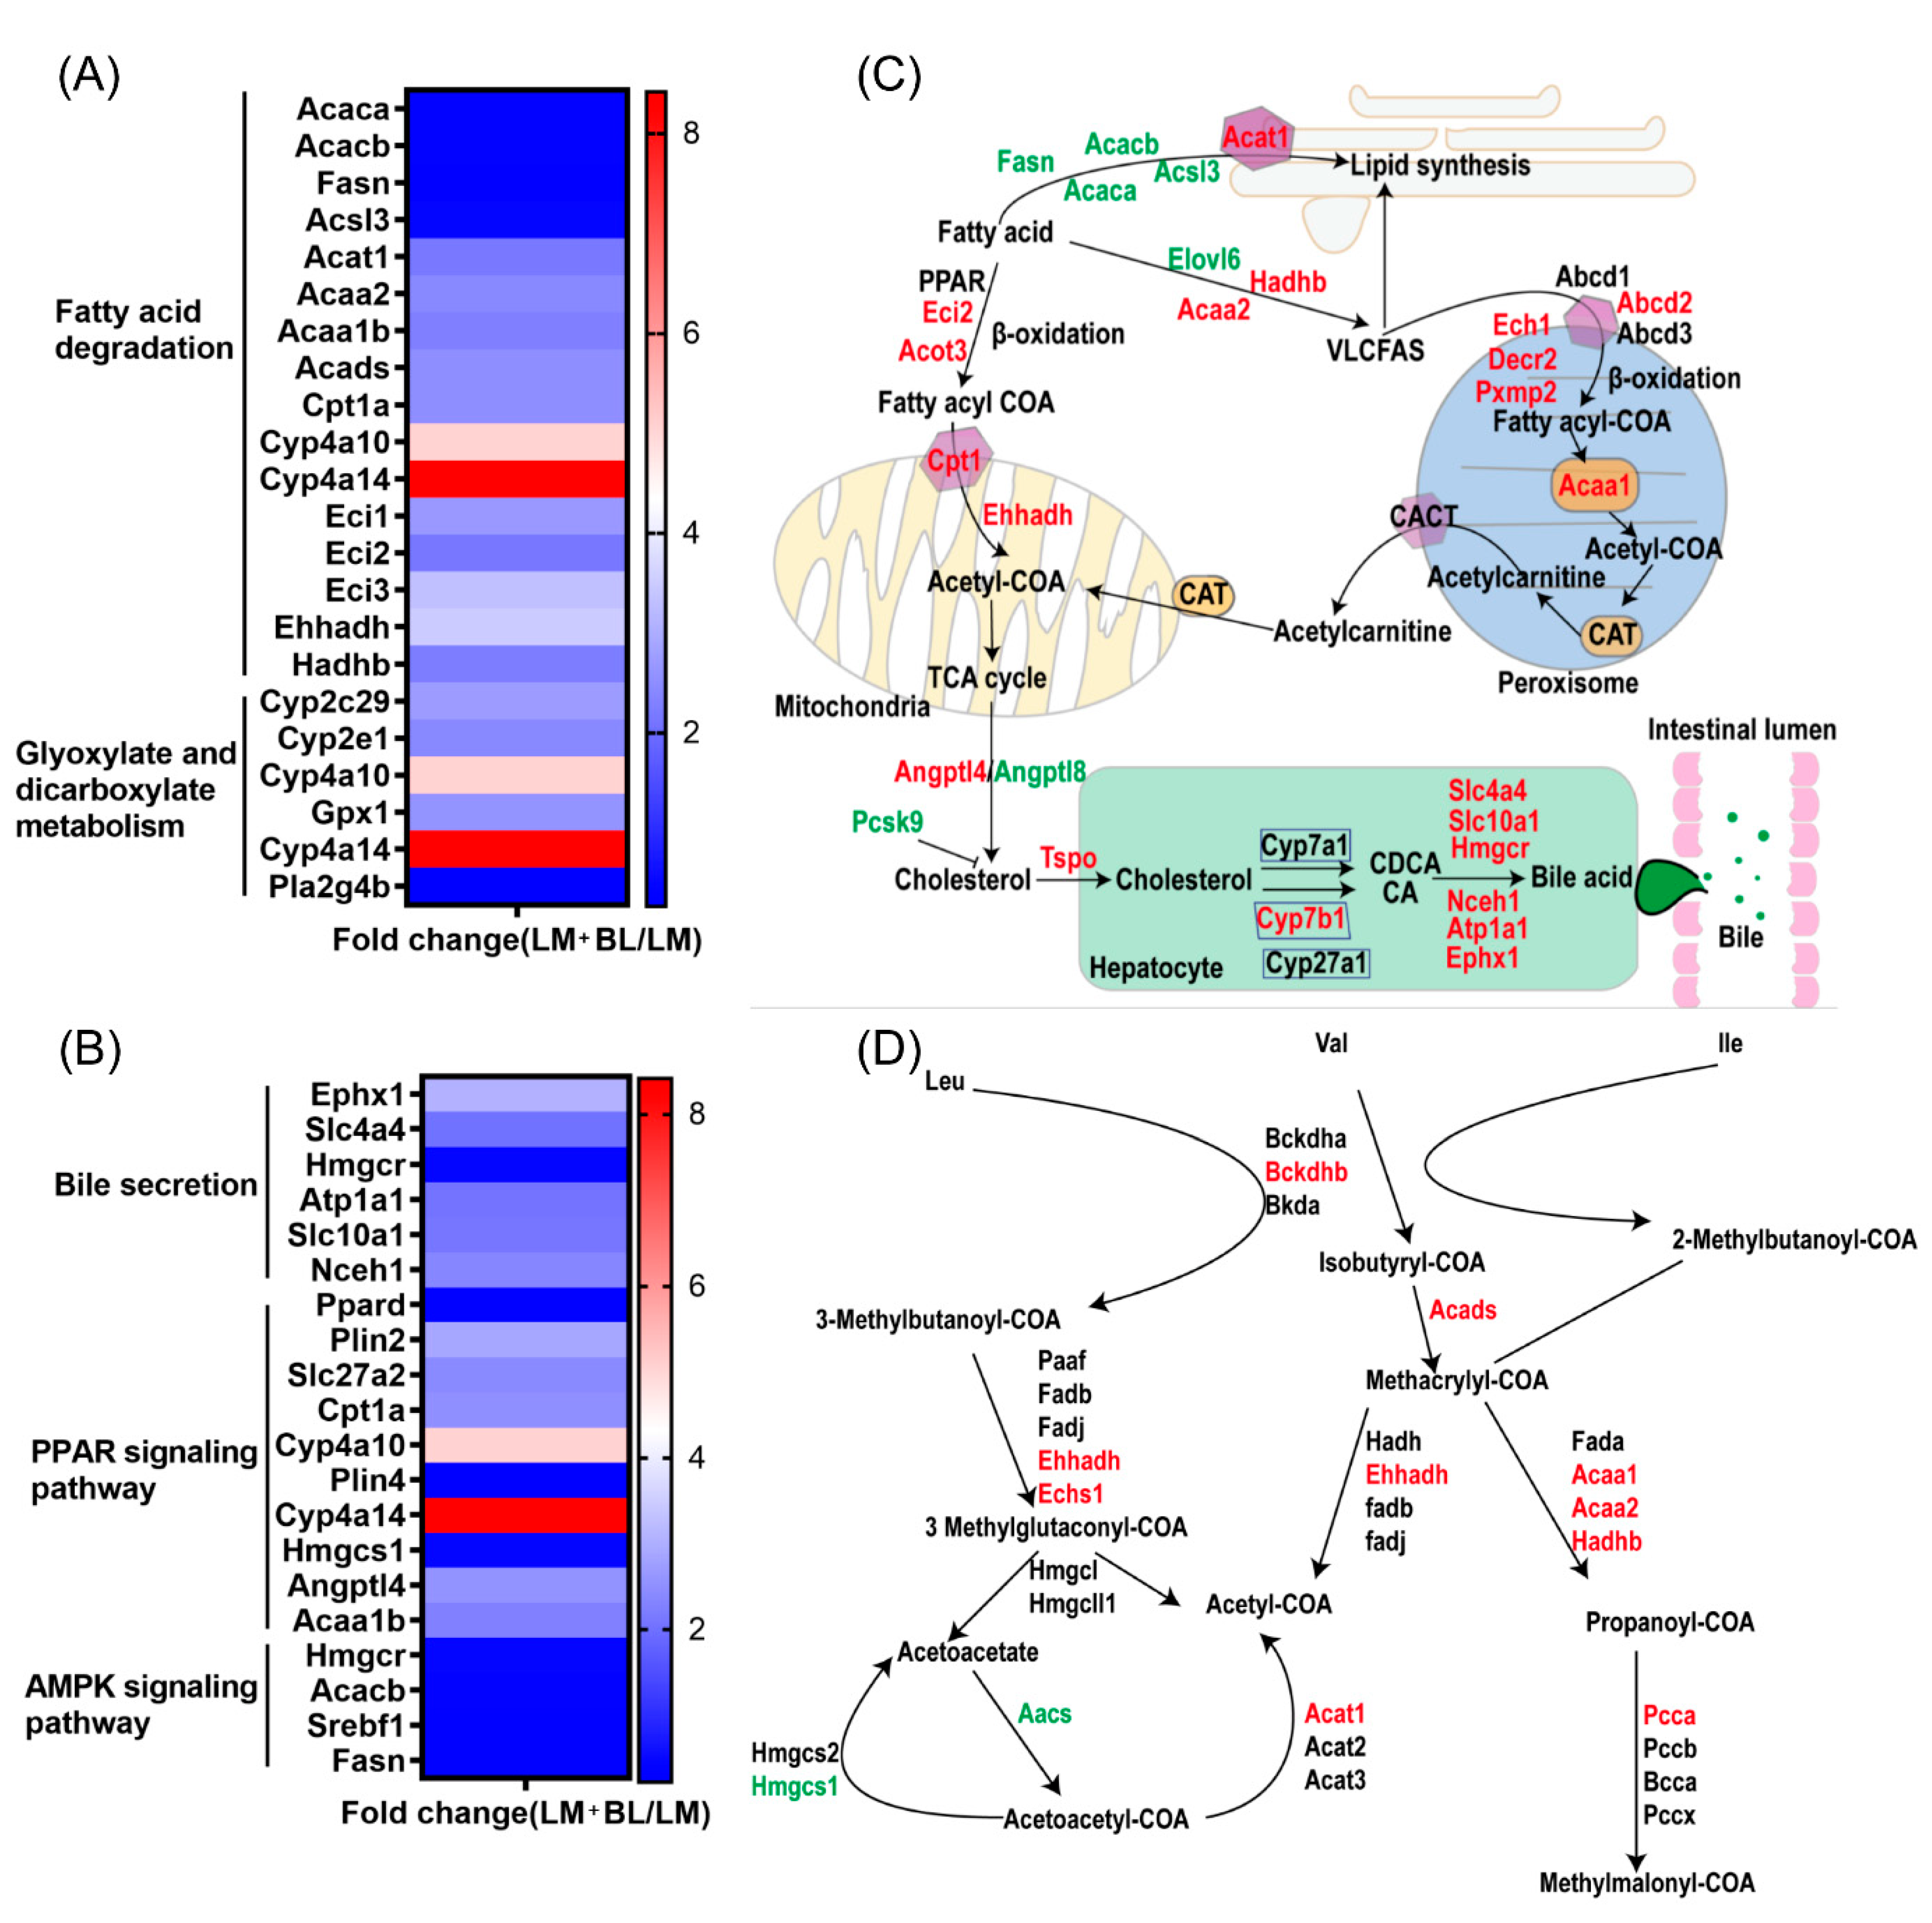
2.3. Liver Transcriptome

After quality control and mapping of sequences from RNA-Seq, DEGs were filtered using the DESeq2 method. A total of 285 DEGs (131 upregulated and 154 downregulated; p-value < 0.05, fold-change ≥ 2) were filtered in the liver of lincomycin-treated mice (LM vs. CON) (Figure 4A). Expression patterns of the DEGs in LM + BL and CON were comparable, but contrary to LM (Figure 4C). A total of 933 DEGs were observed in LM + BL vs. CON (384 upregulated genes and 549 downregulated; p-value < 0.05, fold-change ≥ 2) (Figure 4B).
GO enrichment analysis for DEGs in LM vs. CON revealed that they were enriched in pathways related to B-cell-mediated immunity, inflammatory responses, and responses to alcohol (p < 0.05, Figure 4D). KEGG pathway analysis (Figure 4F) revealed that these DEGs were markedly enriched in pathways related to lipid synthesis (ovarian steroidogenesis; cortisol synthesis and secretion; aldosterone synthesis and secretion; fatty acid degradation; phenylalanine, tyrosine, and tryptophan biosynthesis; pantothenate and COA biosynthesis), hormone biosynthesis (thyroid hormone synthesis, steroid hormone biosynthesis, salivary secretion, and pancreatic secretion), and chemotaxis (chemokine signaling pathway, cytokine-cytokine receptor interaction). GO enrichment analysis for DEGs in LM + BL vs. LM (Figure 4E) revealed that they were markedly enriched in lipid metabolism processes (lauric acid, long-chain fatty acid, nucleoside bisphosphate, ribonucleoside bisphosphate, purine nucleoside bisphosphate, unsaturated fatty acid, thioester, acyl-CoA, and fatty acid, as well as steroid metabolic process) and lipid homeostasis (regulation of lipid storage, lipid homeostasis, arachidonic acid epoxygenase activity, heme binding, alkane 1-monooxygenase activity). KEGG pathway analysis revealed that these DEGs (Figure 4G) were enriched in pathways related to lipid degradation (fatty acid degradation; valine, leucine, and isoleucine degradation; propanoate metabolism; cholesterol metabolism), fatty acid metabolism (terpenoid backbone biosynthesis, fatty acid elongation, butanoate metabolism, retinol metabolism, peroxisome), bile secretion, and signaling pathways (PPAR and AMPK signaling pathways).

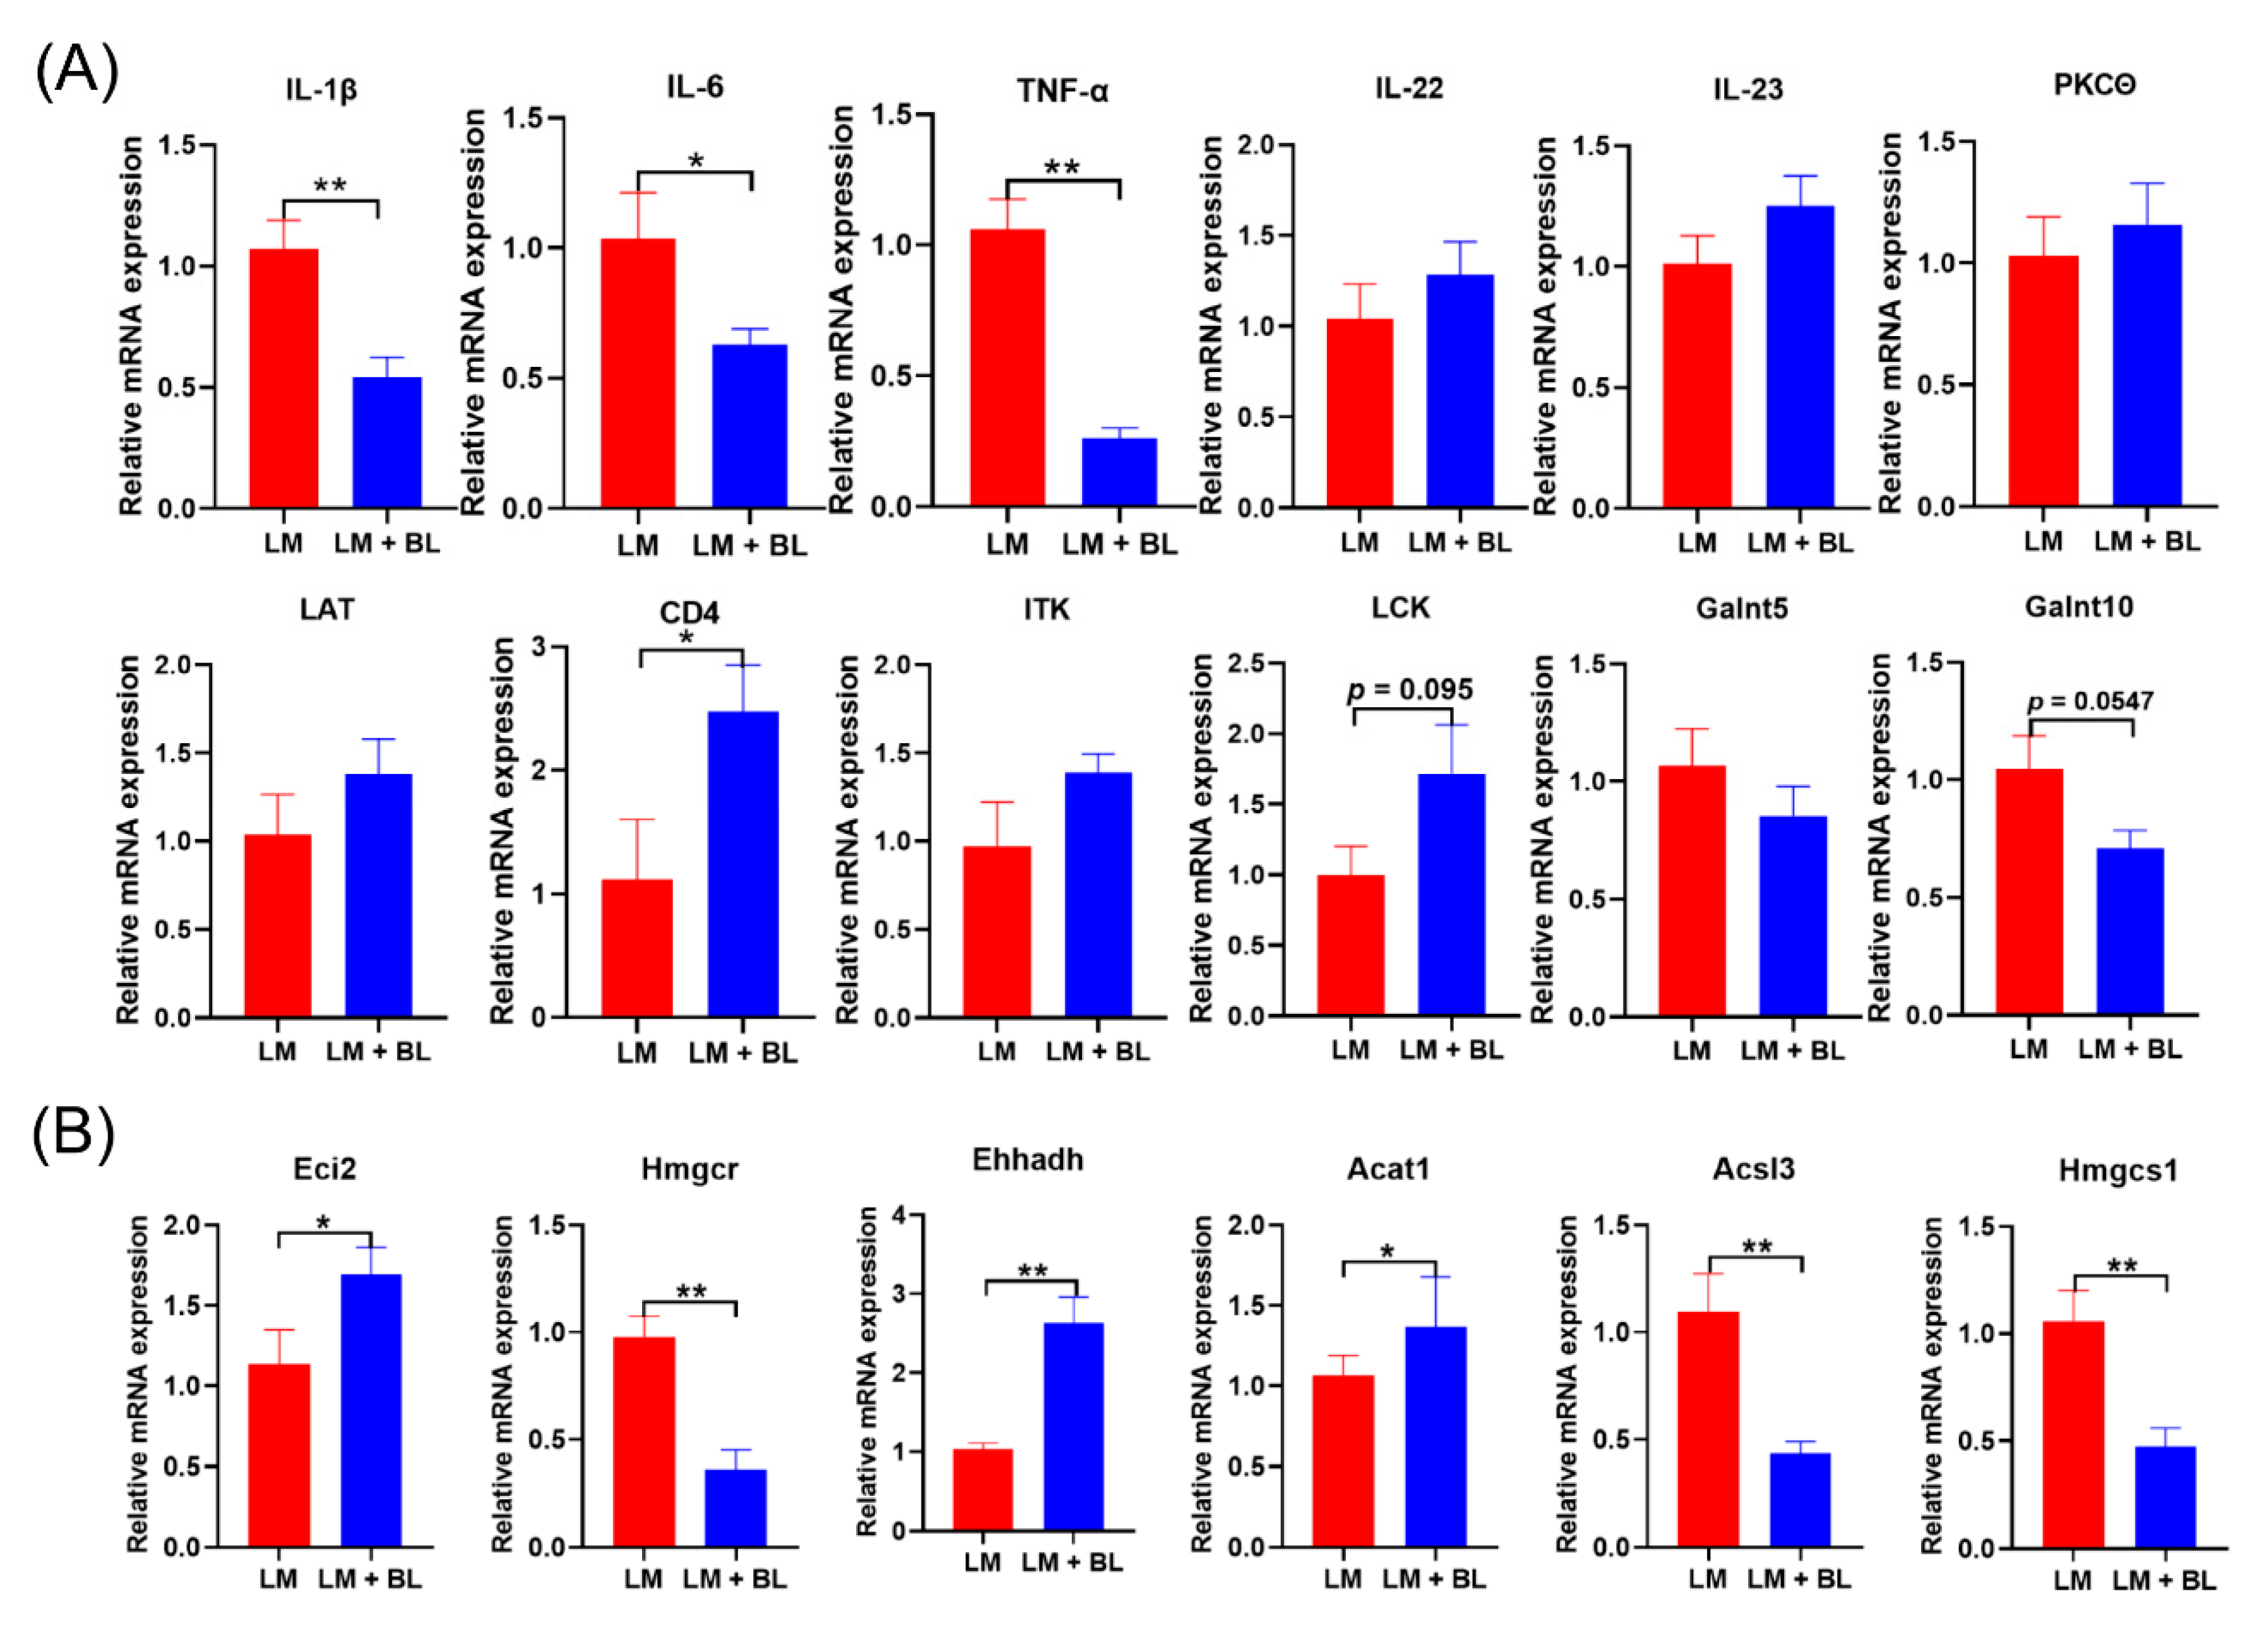
2.4. Validation of the RNA-Seq Results by qPCR

To validate the RNA-seq results, qRT-PCR analysis was conducted for key DEGs and related cytokines in the colon and liver. The mRNA expressions of CD4 in colons of LM + BL were significantly greater than those of LM (Figure 5A, p < 0.05), mRNA expressions of LCK in LM + BL were increased, compared to LM (p = 0.095), and Galnt10 levels in the colon were decreased (p = 0.0547). Expressions of IL-22, IL-23, PKCθ, LAT, ITK, and Galnt5 in the colon exhibited similar patterns with RNA-Seq (Figure 5A). In addition, relative mRNA expressions of TNF-α, IL-1β, and IL-6 in the colons from the LM + BL group were significantly decreased, compared to LM (Figure 5A, p < 0.05). The mRNA expressions of Eci2, Ehhadh, and Acat1 in livers were significantly increased, while Hmgcr, Acsl3, and Hmgcs1 levels in livers of the LM + BL group were decreased, compared to LM (Figure 5B), consistent with findings from RNA-seq.

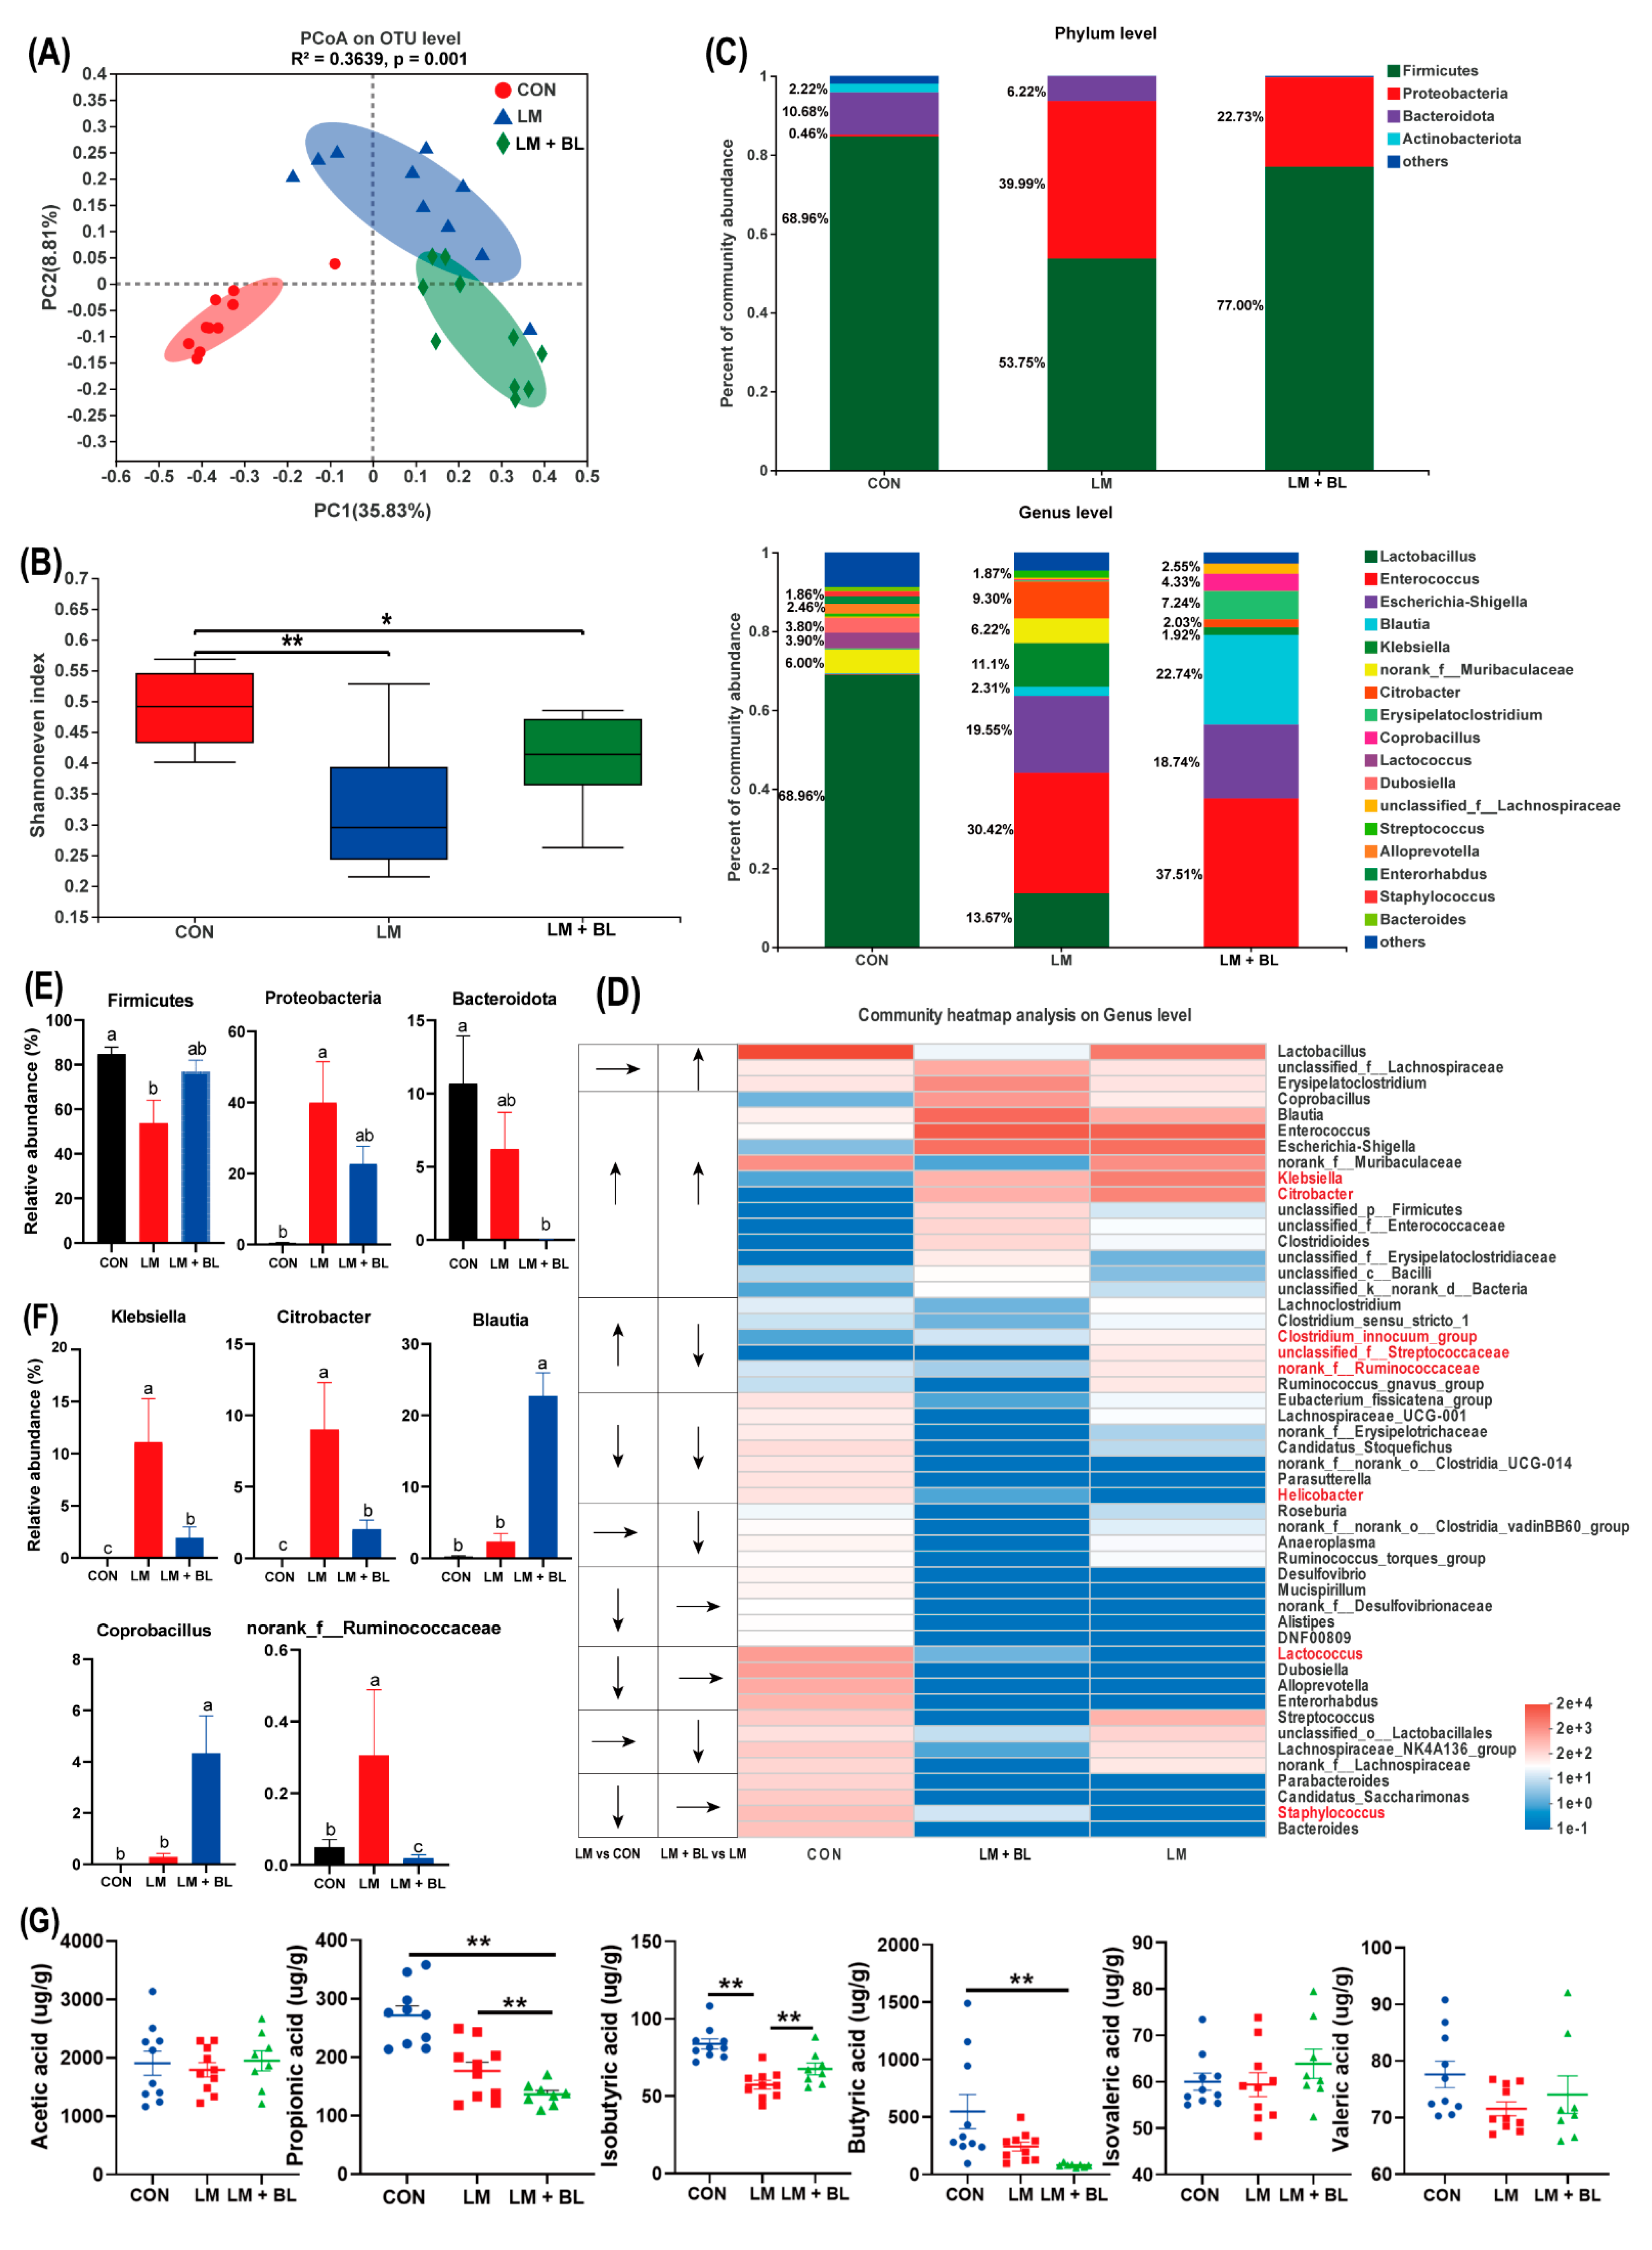
2.5. Colon Microbiome

Principal coordinate analysis based on unweighted unifrac distance metric is shown in Figure 6A. Differential clustering of gut microbiota structures among CON, LM, and LM + BL groups revealed different microbial communities. Alpha diversity (Chao, Shannon, and Shannoneven indices) revealed that gut microbiota diversity in LM and LM + BL groups was significantly lower compared to CON (Figure 6B and Figure S1C, p < 0.01).
Microbial community compositions of the three groups are shown in Figure 6C. At the phylum level, most abundant phyla in CON were Firmicutes (68.96%), Bacteroidota (10.68%), Actinobacteria (2.22%), and Proteobacteria (0.46%). In LM, relative abundance of Firmicutes (53.75%) and Actinobacteria (6.22%) were decreased, whereas relative abundance of Proteobacteria (39.99%) was increased (p < 0.05, Figure 6E). However, relative abundance of Firmicutes (77.00%) in LM + BL was greater than that of LM, but the relative abundance of Bacteroidota and Proteobacteria (22.73%) was less than that of LM. At the genus level, gut microbiota composition in CON included Lactobacillus (68.96%), norank_f__Muribaculaceae (6.00%), Lactococcus (3.90%), Dubosiella (3.80%), Alloprevotella (2.46%), and other genera (Figure 6C). Relative abundances of Enterococcus (30.42%), Escherichia-Shigella (19.55%), and Klebsiella (11.1%) were increased in LM, while relative abundances of Lactobacillus (13.67%) were reduced. The top five genera in LM + BL were Enterococcus (37.51%), Blautia (22.74%), Escherichia-Shigella (18.74%), Eryslpelatoclostridlum (7.24%), and Coprobacillus (4.33%). Alterations of the top 50 genera in relative abundance attracted more attention. Relative abundance for most genera (e.g., Bacteroides, Staphylococcus, Candidatus_Saccharimonas, Parabacteroides, Lactococcus, Dubosiella) were diminished due to lincomycin exposure (Figure 6D). For some of the genera, their relative abundances increased due to lincomycin exposure (e.g., Clostridium_sensu_stricto_1, Clostridium_innocuum_group, UNCLASSIFIED_F__STREPTOCOCCACEAE, norank_f__Ruminococcaceae, Klebsiella, Citrobacter; Figure 6D). Baicalin treatment restored normal mass for some of the genera (e.g., Klebsiella, Citrobacter, Clostridium_innocuum_group, unclassified_f__Streptococcaceae, norank_f__Ruminococcaceae, Helicobacter, Lactococcus, Staphylococcus; Figure 6D). The abundance of Klebsiella, Citrobacter, and norank_f_Ruminococcaceae were significantly increased in LM compared to CON, but significantly decreased after baicalin treatment compared to LM (p < 0.05, Figure 6F). Abundances of Blautia and Coprobacillus were significantly increased in the LM + BL group compared to LM (p < 0.05, Figure 6F). The expressions of DEGs that were common in LM vs. CON and LM + BL vs. LM were correlated with abundances of Bacteroidota and Firmicutes (positively) and Lachnoclostridium, Streptococcus, Lactobacillus, and Lactococcus (negatively; Figure S3).
On the basis of gut microbiota changes, quantification of SCFAs in colon chyme were performed (Figure 6G). Relative concentrations of isobutyric acid were significantly suppressed by lincomycin exposure but restored to control levels by baicalin treatment (p < 0.05). However, relative propionate and butyrate acid levels in LM + BL were less when compared to CON (p < 0.05).

3. Discussion

In this study, lincomycin exposure decreased bodyweight gain of mice, in tandem with a previous study [16]. This could have been due to lincomycin-induced reduction in jejunum villus height, crypt depth, and colon muscular layer width, which might have caused a reduction in contact area between nutrients and intestines as well as affected intestinal peristalsis to reduce nutrient absorption. Disruption of the intestinal barrier also led to leakage, causing liver damage and inflammation. This was confirmed by morphological changes and functional impairments of the liver after lincomycin exposure. These results may be attributed to the anti-inflammatory, antibacterial, and intestinal protection activities of baicalin [17]. However, the mechanisms through which baicalin aids in intestinal and liver injury recovery should be evaluated further.
Efficient tissue repair after injury is indispensable for all organisms. Tissue repair processes, including inflammation, cell proliferation, differentiation, and migration, as well as cell junction, are involved in the formation of a complete mucosal barrier [18]. Inflammation, the physiological response during tissue injury, transports effector cells to damaged locations and provides a barrier to prevent infections from spreading. We found upregulated expressions of inflammatory cytokines and their receptors (IL-16, IL-21r, IL-2ra, IL-2rg, IL-7r, IL-9r, LTA, LTB, Tnfrsf13b, Tnfrsf25, Tnfsf14, and Tnfsf8; Figure 7D) in LM + BL vs. LM, suggesting that baicalin may regulate the inflammatory processes to promote intestinal repair. IL-21/IL-21r regulates intestinal inflammation by deviating from Th1/Th2 to Th2 equilibrium [19]. IL-2 and IL-7r stimulate T-cell proliferation and differentiation and have positive effects on proliferations and differentiations of other cells [20,21]. The tumor necrosis factor (TNF) family, including Tnfrsf13b, Tnfsf14, Tnfsf25, and Tnfsf8, play an important role in regulation of inflammatory response and tissue homeostasis. Moreover, the TNF family is involved in cell growth, differentiation, and death [22,23,24,25]. During inflammatory processes, leukocytes ooze to inflammation areas by adhering and traversing the vascular endothelial cells [26]. Cell adhesion molecules, such as Cd2, Cd80, Cd86, Cd40, Itbg2, Ctla4, Cd4, Cd6, Cd226, Spn, H2-Oa, Trbv19, Trac, Jam3, Cldn5, Cldn11, and Cdh2, play important roles in this process, and all of them were upregulated in this study (Figure 7A). Ras, which is located in the inner side of the cell membrane, is responsible for transmitting signals from the extracellular matrix and is also involved in intercellular adhesion. After activation by cytokines, the activated ras pathway regulates cell proliferation, differentiation, apoptosis, and metabolism [27]. In this study, the genes associated with this pathway were upregulated in the LM + BL group (Figure 7A). Cd80 and Cd86, which belong to the immunoglobulin superfamily, combine with the Cd28 ligand to promote T-cell proliferation and activation [28]. Cd40/Cd40L induce endothelial cells to express intercellular adhesion molecule-1, which acts as a ligand for lymphocytes and Itbg2, and forms adhesion between immune cells and vascular endothelial cells [29]. The Jam3, Cldn5, Cldn11, and Cdh2 are involved in tight junction formation. Cdh2 increases the number of tight junction structural pores and enhances the transport of paracellular substances [30]. Cdh5 reinforces connections between cells and reduces the permeability of tight junction [31]. Chemokines are beneficial in intestinal repair by taking part in immune cell migration and aggregation, especially phagocytes and lymphocytes [32]. For instance, Cxcr2, the Cxcl1-8 receptor, attracts neutrophils to leave the bloodstream and migrate to surrounding tissues [33]. Chemokines, including Ccl19, Ccl21a, Ccl22, Ccr7, Ccr9, Cd27, Clcf1, Csf2rb2, Cxcr2, and Cxcr3, were upregulated in LM + BL vs. LM (Figure 7C).
Immune cells identify pathogen-associated molecular patterns released by injured cells and initiate tissue repair after intestinal tissue injury. During this process, lymphocytes rely on cell surface receptors to receive signals from damaged tissues. The T-cell receptor complex is composed of the TCR dimer, CD3δ/ε dimer, CD3 γ/ε dimer, and CD3ζ/ζ dimer, which efficiently transmit the received signal into the cell [34]. In this study, KEGG pathway analysis of DEGs revealed that they were enriched in the T-cell receptor signaling pathway (TCR, CD3δ/ε, CD3 γ/ε, CD3ζ/ζ, Ctla4, CD40, PI3K, Rasgrp1, ITK, LAT, CD8, CD4, LCK, ZAP70; Figure 7E). Lck activates TCR by phosphorylating ITAMs, the immune receptor of the TCR/CD3 complex, and then activates PTK by phosphorylation of LCK, FYN, ZAP70, and ITK among others [35]. T-cell receptors recognized specific antigens and activated T cells to produce cytokines to perform immunomodulatory functions [36], such as the differentiation of Th1, Th2, and Th17 cells. The Th1/Th2 ratio maintains the balance between cellular and humoral immune responses. Imbalances in this ratio induce inflammation and diseases [37]. Th1 and Th2 cell differentiations are regulated by cytokines, antigens, and antigen-presenting cells. IFN-γ, IL-2r, and IL-12 are the main cytokines promoting Th1 cell differentiation [38]. IL-12 also promotes IFN-γ production [39]. Th2 differentiates and secretes IL-4 under the actions of the TCR pathway [40], which promotes Th2 cell differentiation and inhibits Th1 cell differentiation. The DEGs involved in the above processes including CD4, LCK, ZAP70, LAT, and IL-2ra were upregulated in the LM + BL vs. LM groups (Figure 7B). Th17-cell-mediated immunity is important for removal of extracellular bacteria by inducing epithelial cells to release antimicrobial peptides to maintain intestinal health. Upon receiving signals presented by MHCII, the TCR complex binds to ZAP70 to activate LAT, thereby promoting Th17-cell differentiation through the NF-κB pathway and producing cytokines such as IL-17, IL-22, and IL-23. CD4 binds LCK to activate ZAP70 and promote Th17-cell differentiation. IL-21r and IL-27r promote Th17 differentiation to produce IL-22 through STAT3 and STAT1, respectively. However, IL-4 and IFN-γ, secreted by Th1 and Th2 cells, respectively, inhibit Th17 cell differentiation [41]. In this study, Th17-cell-differentiation-related genes, including the TCR complex, LCK, CD4, ZAP70, LAT, IL-4r, IL-21r, and IL-27r were upregulated after baicalin treatment in lincomycin exposure mice, indicating that baicalin promotes the production of IL-17, IL-22, and IL-23. Elevated IL-22 and IL-23 mRNA expressions in LM + BL compared to LM supports this conclusion. Baicalin has been reported to regulate the balance of mouse antibody levels and expressions of Th17/Treg-associated cytokines [42]. IL-23 is essential for maintaining Th17 cell proliferations, phenotypes, and functions [43]. IL-17a and IL-17f repair HIV-1GP40-induced intestinal epithelial dysfunction by regulating the expression of tight junction genes, and the NF-κB pathway is involved in this process [44]. In the intestine, IL-22 levels were increased in chemically induced tissue injury and have an anti-apoptotic effect that promotes wound healing [45]. The addition of exogenous IL-22 increased gene transcription levels of survival proteins (bcl-2, bcl-xL, mcl-1), anti-apoptotic molecules (c-myc, cyclind1, rb2, cdk4), and mucosal barrier protective molecules (mucin1, mucin2, mucin10), while the deletion of IL-22 significantly impaired tissue repair in DSS-induced colitis mice models, and no repair occurred after acute injury [46,47]. IL-22 inhibits Clostridium difficile-induced intestinal damage by activating the complement system [48]. In this study, complement activation was also observed (Serpina1b, Serpinb6b, Serpina1a, Serpina1c, Cfi, C3, Vtn, C1rb, F8, Itgb2, Proc, Cfh, C4b). These results suggest that baicalin enhances intestinal repair after injury by promoting Th17 cell differentiation and IL-22 production, consistent with findings from a previous study that baicalin regulates Th1, Th17, and Treg responses to ameliorate sepsis-associated pancreatic injury through the ras homolog family member A -Rho kinase pathway [13].
Intestinal mucosal damage breaks the barrier between intestines and blood, thereby increasing permeability. This allows entry of bacteria and their metabolites into the blood circulatory system, which increases the risk of inflammation and liver damage. Liver injury is a common extra intestinal manifestation of IBD [49]. The liver is the major organ for lipid metabolism, and disturbances in lipid metabolism is one of the causes of liver injury [50]. The downregulated DEGs in the liver of the LM group were involved in lipid metabolism pathways, including “fatty acid degradation” and “pantothenate and CoA biosynthesis” The DEGs in the liver LM group were enriched in immune- and inflammatory-response-related pathways suggested reduced ability of the liver to utilize lipids and inflammation, which may lead to lipid accumulation. The upregulated DEGs in the liver of the LM + BL group were involved in lipid metabolism pathways including “fatty acid degradation”; “valine, leucine, and isoleucine degradation”; “arachidonic acid metabolism”; “peroxisome”; “PPAR signaling pathway”; and “AMPK signaling pathway”. The downregulated DEGs in the liver of the LM + BL group were involved in “fatty acid elongation”, “fatty acid biosynthesis”, and “biosynthesis of unsaturated fatty acids” (Figure 8A,B). The aforementioned changes in these pathways suggested increased ability of the liver to utilize lipids that will decrease lipid synthesis and lipid accumulation. PPAR is an important signal pathway that regulates the oxidative decomposition of fatty acids [51]. As an energy sensor, AMPK maintains the balance between fat content and lipid metabolism, and its activation increased energy decomposition [52]. Fasn, Acacb, and Acaca are involved in fat synthesis, and Acsl3 promotes the formation of intracellular lipid droplets, hence influencing fat deposition [53,54]. The downregulated expression of these genes in the LM + BL group suggested that baicalin ameliorated antibiotic-induced fat deposition. Acot3, Eci2, Ehhadh, Acaa2, Hadhb, and Cpt1 are genes involved in fatty acid oxidation. Upregulation of these genes in the LM + BL group indicated that baicalin treatment promoted fatty acid decomposition (Figure 8C). In addition, genes involved in oxidation of very long chain fatty acids (VLCFAs) in peroxisomes such as Abcd2, Ech1, Decr2, Pxmp2, and Acaa1 were upregulated, which further demonstrated that baicalin promoted lipolysis. Consistent with these results, a previous study showed that baicalin activated hepatic Cpt1 to ameliorate diet-induced obesity and hepatic steatosis [55]. Genes involved in leucine, valine, and isoleucine metabolism such as Bckdhb, Ehhadh, Echs1, Acads, Acaa1, and pcca were upregulated in that LM + BL group, which enhanced acetyl-COA and methylmalonyl-COA production (Figure 8D). In liver cells, cholesterol generated from the oxidation of fatty acids is converted to bile acids through the classical and alternative pathways and secreted into the intestine to regulate intestinal peristalsis, mucus secretion, and immunity (Figure 8C). This process relies on liver-induced cytochrome P450, Cyp7b1, Cyp7a1, and Cyp27a1 to produce CA and CDCA. The expression of Cyp7b1 determines the ratio of CA to CDCA by promoting CA biosynthesis. In this study, the expression of Cyp7b1 and related DEGs involved in this process such as Slc4a4, Slc10a1, Hmgcr, Nceh1, Atp1a1, Ephx1, and Tspo was higher in the LM + BL group than the LM group, indicating increased bile acid synthesis in the LM + BL group. Bile acids are important molecules that modulate immune responses. Bile acid metabolites have been reported to act on dendritic cells to reduce their immune stimulating-effects, thereby increasing Foxp3 expression and inducing Treg cell production, which maintains intestinal mucosal immune response [56]. By screening bile acid metabolites, Jun et al. [57] found that bile acid metabolites directly regulate the balance between Th17 and Treg cells, and hence the host immunity. Impaired bile acid metabolism may induce liver inflammation and liver fibrosis. These results suggest that baicalin regulates intestinal immunity by promoting bile acid synthesis and secretion in liver.
Intestinal microbes may be intermediate regulators of liver-intestinal communication. Bile acids synthesized by liver alters the structure of bacterial communities and can inhibit the growth of specific bacteria, which affects the metabolism and immunity of the host [58]. Atarashi et al. [59] found that Blautia accelerated the recovery of intestinal inflammation in mice by increasing infiltration of the large intestine with regulatory T cells, which improve outcomes of colorectal cancer and liver cirrhosis. In this study, the Blautia abundance was increased in the LM + BL group. Gut microbiota metabolize bile acids, leading to the production of secondary bile acids [60]. For example, the gut dysbiosis seen in IBD patients decreases microbial bile acid biotransformation, which increases the levels of conjugated primary bile acids and decreases the production of secondary bile acids [61]. Bacteroides, Clostridium, Lactobacillus, Bifidobacterium, Listeria, and other microorganisms participate in the metabolism of bile acids in the gut [62]. In this study, antibiotic exposure resulted in intestinal microbiome disorder and increased the proportion of pathogenic bacteria. Abnormal intestinal flora leads to loosening of tight junctions and alter the integrity of mucus layers, allowing pathogens and endotoxins to enter the liver. These endotoxins enter the liver, releasing arachidonic acid products and inflammatory factors such as TNF-α, IL-1β, and IL-6. Therefore, we examined the arachidonic acid metabolism pathway in the LM + BL group. Hepatogenic inflammatory cytokines downregulate the production of bile in liver cells and aggravate the disruption of intestinal microecology, forming a vicious cycle [63]. In this study, baicalin inhibited the abundance of Proteobacteria, which was considered to be the main pathogenic bacteria releasing endotoxins [64] in order to counteract the lincomycin-induced increase in Klebsiella and Citrobacter, which were reported to cause intestinal disease [65,66]. These results provide evidence that baicalin inhibits the growth of intestinal pathogens, promotes the synthesis and secretion of bile acids in liver cells, regulates intestinal immune balance, and maintains liver-intestinal circulation.
In summary, the results indicate that lincomycin exposure causes intestinal and liver injury and inflammation in mice, but baicalin treatment alleviates the lincomycin-induced intestinal and liver injury. This is because baicalin alters gut microbiota dynamics and regulates the balance of Th1, Th2, and Th17, especially the differentiation of Th17, which contributes to the production of IL-22. Furthermore, baicalin influences the expression of genes involved in the regulation of immune response in intestines, lipid metabolism, and bile acid secretion pathways in the liver. These results reveal the importance of baicalin in the management of gastrointestinal and liver complications associated with lincomycin and prophylactic treatment of related antibiotics. In addition, the effects of baicalin on the complex consequences of long-term antibiotic exposure are worth further study in the future.

4. Materials and Methods

4.1. Mice and Treatment

Forty-eight 21-day-old female ICR mice obtained from the School of Medicine, Peking University (Beijing, China), were housed in the animal facility of the Institute of Animal Science under controlled conditions (lighting cycle with light from 8:30 a.m. to 8:30 p.m. and temperature at 20 ± 5 °C). After 7 days of acclimatization, mice were randomized into three groups: control (CON), lincomycin (LM), and the lincomycin and baicalin (LM + BL) groups of 16 mice each. Mice in the LM and LM + BL groups were administered with 5 g/L lincomycin in drinking water for 1 week. In the second week, mice in the LM + BL group were administered with 500 mg/kg baicalin in feed, while mice in the LM group received control feed without baicalin. Mice in the control group received drinking water and control feed for 2 weeks. Lincomycin was obtained from Beijing Solarbio Technology Co., Ltd., with a purity of 850 μg/mg and was stored at 2–8 °C. The dose of lincomycin was selected according to our previous study [5]. Baicalin and its dose was provided by Beijing Center Technology Co., LTD, with a purity > 85%. All mice had free access to food and drinking water. Water containers and feeds were changed once every three days to supply fresh antibiotics and feed. During the experimental period, body weights and food and water intakes were monitored for each animal every week. At the end of the experiment (week 2), the liver, jejunum, colon, and colonic chyme were excised. All samples were either fixed in 4% paraformaldehyde or snap-frozen in nitrogen and stored at −80 °C until processing.

4.2. 16S rRNA Gene Sequencing Analysis

Microbial DNA was extracted using the E.Z.N.A.® soil DNA Kit (Omega Bio-tek, Norcross, GA, USA), as instructed by the manufacturer. As previously described [67], hypervariable regions (V3-V4) of the bacterial 16S rRNA gene were amplified with primer pairs 338F (5′-ACTCCTACGGGAGGCAGCAG-3′) and 806R (5′-GGACTACHVGGGTWTCTAAT-3′) using an ABI Gene Amp® 9700 PCR thermocycler (ABI, Foster City, CA, USA) [68]. Meta-genomic sequencing was performed on the basis of the Illumina platform using Miseq PE300. Raw reads were deposited into the NCBI Sequence Read Archive (SRA: PRJNA765910) database.
Raw sequences were processed using the Majorbio I-Sanger Cloud Platform (www.i-sanger.com, Majorbio, Shanghai, China, accessed on 20 March 2022), and chimeric sequences were removed. Operational taxonomic units (OTUs) with a 97% similarity cutoff were clustered using UPARSE (version 7.1, http://drive5.com/uparse/, accessed on 20 March 2022). Taxonomy for each OTU representative sequences were matched to the 16S rRNA database (Silva 138) with a confidence threshold of 0.7 using an RDP Classifier (http://rdp.cme.msu.edu/, accessed on 20 March 2022). Mothur b.1.30.1 [69] was used for refraction analysis, alpha-diversity analysis, and unweighted principal coordinate analysis (PCoA). Sobs, Shannon, and Chao indices were used to evaluate community diversity. Rarefaction curves indicated that the sequencing was deep enough to capture most of the operational units within our samples.

4.3. Transcriptome Analysis

Total RNA from mice colon and liver were extracted by the phenol chloroform method. RNA sequencing was performed by Majorbio company (Shanghai, China), and quality control was performed to obtain high-quality RNA samples (OD260/280 = 1.8–2.2, OD260/230 ≥ 1.0, RIN ≥ 6.5, 28S:18S ≥ 1.0, > 10 μg) to construct the sequencing library as described by Zhang et al. [70]. Raw data were submitted to the NCBI Sequence Read Archive (SRA: PRJNA765945 and PRJNA823501).
Differential gene expression analysis was performed by DESeq2 software with default parameters LM vs. CON and LM + BL vs. LM. Then, GO and KEGG enrichment analyses of differentially expressed genes (DEGs) were conducted on a Majorbio I-Sanger Cloud Platform (www.i-sanger.com, accessed on 20 March 2022), with the Benjamini–Hochberg method used to adjust the p-value. The correlation network diagram was generated by overlapping DEGs shared by LM vs. CON and LM + BL vs. LM. The correlation relationship between overlapping DEGs and the top 50 most abundant bacteria at the genus level was calculated by Spearman’s rank correlation coefficient.

4.4. Relative Concentrations of Short-Chain Fatty Acids

Colon chyme samples, approximately 0.1 g of each mouse, were suspended in 1 mL ddH2O in a 1.5 mL screw-capped tube for short-chain fatty acid (SCFA) composition analysis by gas chromatography (GC), as described by Wu et al. [71].

4.5. Intestinal and Hepatic Morphology

Liver, jejunum, and colon samples were collected according to Xu et al. [72] and perfusion-fixed in formalin for 24 h for intestinal morphology evaluation. Tissue slides were prepared as descried by Fan et al. [73]. Briefly, the liver, jejunum, and colon were sliced into 5 μm thick sections and stained with hematoxylin and eosin (H&E). Villous height and crypt depth from all well-oriented crypt-villi units per sample were measured in the jejunum, and the ratio of villous height/crypt depth was calculated. Then, crypt depths and muscular layer width in the colon were measured.

4.6. Gene Expression Related to Tight Junction Proteins and Inflammatory Cytokines

Total RNA for colon tissue was extracted using the TRIzol reagent (Ambion, UT, USA) and transcribed into cDNA using a gDNA Eraser provided by the PrimeScript™ RT reagent kit (Cat # RR047A, Takara, Shige, Japan). Quantitative real-time RT-PCR (qRT-PCR) was performed using TB Green Premix Ex Taq (TaKaRa, Kusatsu, Japan). Tight junction protein genes (Occludin, ZO-1, and Claudin-1), inflammatory cytokines genes (TNF-α, IL-1β, and IL-6), selected DEGs (IL-22, IL-23, PKCθ, CD4, LCK, LAT, ITK, Galnt5, Galnt10, Eci2, Hmgcr, Ehhah, Acat1, Acsl3, and Hmgcs1), and Mucin1 and Mucin2 were analyzed. Primers (Table 1) used for qRT-PCR were purchased from Sangon Biotech (Shanghai, China). All results of the target genes were normalized to the housekeeping gene, GAPDH.

4.7. Inflammatory Cytokines and GSH-PX, AST in Serum, and TBA in Liver

Blood samples were collected from mice in the CON, LM, and LM + BL groups by eyeball extraction. After standing at room temperature, serum was obtained, centrifuged at 4 °C 3000 r/min for 10 min, separated, and stored at −80 °C. Serum levels of IL-1β, IL-6, and TNF-α were measured using commercially available ELISA kits (Multiskan MK3, Thermo Fisher Scientific, Waltham, NC, USA), and GSH-PX and AST were determined according to a kit from the Nanjing Jiancheng Bioengineering Institute (Nanjing, China). Mouse liver was mixed with physiological saline and centrifuged at 2500 rpm and 4 °C for 10 min. Then, the upper tissue homogenate was obtained, after which TBA levels were determined according to kit instructions.

4.8. Statistical Analysis

Quantitative data are expressed as mean ± standard error of the mean (SEM). The SAS 9.4 software (SAS 9.4, Institute, Cary, NC, USA) was used for all analyses. Comparisons of means among groups was performed by one-way ANOVA followed by multiple comparisons using Tukey’s HSD test. Significance was established at p ≤ 0.05.

Supplementary Materials

The following supporting information can be downloaded at https://www.mdpi.com/article/10.3390/ijms23116072/s1.

Author Contributions

Conceptualization, S.Z., R.Z. and L.C.; software, S.Z.; validation, L.C. and H.Z.; formal analysis, S.Z., S.T. and L.C.; investigation, S.Z., R.Z., L.C., H.Z.; resources, R.Z., L.C., H.Z.; data curation, S.Z. and S.T.; writing-original draft preparation, S.Z.; writing-review and editing, S.Z., R.Z., H.H. and L.C.; visualization, H.Z.; supervision, L.C. and H.Z.; project administration, H.Z.; funding acquisition, L.C. and H.Z. All authors have read and agreed to the published version of the manuscript.

Funding

This study was supported by the National Natural Science Foundation of China (32102582), the Agricultural Science and Technology Innovation Program (CAAS-ZDRW202006-02, ASTIPIAS07), the Central Public-interest Scientific Institution Basal Research Fund (No. 2021-YWF-ZYSQ-01), and the State Key Laboratory of Animal Nutrition (2004DA125184G2102).

Institutional Review Board Statement

The experimental protocol was reviewed and approved by the Institutional Animal Care and Use Committee of the Institute of Animal Science at the Chinese Academy of Agricultural Sciences (IAS2020-85).

Informed Consent Statement

Not applicable.

Data Availability Statement

Raw reads for 16S rRNA gene sequencing were deposited into the NCBI Sequence Read Archive (SRA: PRJNA765910) database. Raw data for transcriptome were submitted to the NCBI Sequence Read Archive (SRA: PRJNA765945 for colon, and PRJNA823501 for liver).

Acknowledgments

We are grateful to Xueying Cai for her methodology assistance for performing this study.

Conflicts of Interest

The authors declare no conflict of interest.

References

  1. Maier, L.; Goemans, C.V.; Wirbel, J.; Kuhn, M.; Eberl, C.; Pruteanu, M.; Müller, P.; Garcia-Santamarina, S.; Cacace, E.; Zhang, B.; et al. Unravelling the collateral damage of antibiotics on gut bacteria. Nature 2021, 599, 120–124. [Google Scholar] [CrossRef] [PubMed]
  2. Koliarakis, I.; Athanasakis, E.; Sgantzos, M.; Mariolis-Sapsakos, T.; Xynos, E.; Chrysos, E.; Souglakos, J.; Tsiaoussis, J. Intestinal Microbiota in Colorectal Cancer Surgery. Cancers 2020, 12, 3011. [Google Scholar] [CrossRef] [PubMed]
  3. Wang, Q.; Du, W.; Xu, J. Retrospective analysis of adverse reactions of lincomycin. Chin. J. New Drugs Clin. Remedies 2003, 22, 571–574. [Google Scholar]
  4. Skirecki, T.; Borkowska-Zielinska, U.; Zlotorowicz, M.; Hoser, G. Sepsis Immunopathology: Perspectives of Monitoring and Modulation of the Immune Disturbances. Arch. Immunol. Ther. Exp. 2012, 60, 123–135. [Google Scholar] [CrossRef] [PubMed]
  5. Zhang, S.; Zhong, R.; Han, H.; Yi, B.; Yin, J.; Chen, L.; Zhang, H. Short-Term Lincomycin Exposure Depletion of Murine Microbiota Affects Short-Chain Fatty Acids and Intestinal Morphology and Immunity. Antibiotics 2020, 9, 907. [Google Scholar] [CrossRef]
  6. Ferrajolo, C.; Capuano, A.; Verhamme, K.M.C.; Schuemie, M.; Rossi, F.; Stricker, B.H.; Sturkenboom, M.C.J.M. Drug-induced hepatic injury in children: A case/non-case study of suspected adverse drug reactions in VigiBase. Br. J. Clin. Pharmacol. 2010, 70, 721–728. [Google Scholar] [CrossRef] [Green Version]
  7. Andrade, R.J.; Tulkens, P.M. Hepatic safety of antibiotics used in primary care. J. Antimicrob. Chemother. 2011, 66, 1431–1446. [Google Scholar] [CrossRef] [Green Version]
  8. Ferrajolo, C.; Verhamme, K.M.C.; Trifirò, G.; Jong, G.W.; Picelli, G.; Giaquinto, C.; Mazzaglia, G.; Stricker, B.H.; Rossi, F.; Capuano, A.; et al. Antibiotic-Induced Liver Injury in Paediatric Outpatients: A Case-Control Study in Primary Care Databases. Drug Saf. 2016, 40, 305–315. [Google Scholar] [CrossRef]
  9. Guo, W.; Zhou, X.; Li, X.; Zhu, Q.; Peng, J.; Zhu, B.; Zheng, X.; Lu, Y.; Yang, D.; Wang, B.; et al. Depletion of Gut Microbiota Impairs Gut Barrier Function and Antiviral Immune Defense in the Liver. Front. Immunol. 2021, 12, 897. [Google Scholar] [CrossRef]
  10. Albillos, A.; de Gottardi, A.; Rescigno, M. The gut-liver axis in liver disease: Pathophysiological basis for therapy. J. Hepatol. 2020, 72, 558–577. [Google Scholar] [CrossRef] [Green Version]
  11. Liao, P.; Li, Y.; Li, M.; Chen, X.; Yuan, D.; Tang, M.; Xu, K. Baicalin alleviates deoxynivalenol-induced intestinal inflammation and oxidative stress damage by inhibiting NF-κB and increasing mTOR signaling pathways in piglets. Food Chem. Toxicol. 2020, 140, 111326. [Google Scholar] [CrossRef] [PubMed]
  12. Zhu, L.; Xu, L.-Z.; Zhao, S.; Shen, Z.-F.; Shen, H.; Zhan, L.-B. Protective effect of baicalin on the regulation of Treg/Th17 balance, gut microbiota and short-chain fatty acids in rats with ulcerative colitis. Appl. Microbiol. Biotechnol. 2020, 104, 5449–5460. [Google Scholar] [CrossRef] [PubMed]
  13. Liu, P.; Xiao, Z.; Yan, H.; Lu, X.; Zhang, X.; Luo, L.; Long, C.; Zhu, Y. Baicalin suppresses Th1 and Th17 responses and promotes Treg response to ameliorate sepsis-associated pancreatic injury via the RhoA-ROCK pathway. Int. Immunopharmacol. 2020, 86, 106685. [Google Scholar] [CrossRef]
  14. Yang, J.-Y.; Li, M.; Zhang, C.-L.; Liu, D. Pharmacological properties of baicalin on liver diseases: A narrative review. Pharmacol. Rep. 2021, 73, 1230–1239. [Google Scholar] [CrossRef] [PubMed]
  15. Wu, T.; Liu, T.; Xing, L.; Ji, G. Baicalin and puerarin reverse epithelial-mesenchymal transition via the TGF-β1/Smad3 pathway in vitro. Exp. Ther. Med. 2018, 16, 1968–1974. [Google Scholar] [CrossRef] [Green Version]
  16. Miao, Z.; Cheng, R.; Zhang, Y.; Liang, H.; Jiang, F.; Shen, X.; Chen, G.; Zhang, Q.; He, F.; Li, M. Antibiotics can cause weight loss by impairing gut microbiota in mice and the potent benefits of lactobacilli. Biosci. Biotechnol. Biochem. 2019, 84, 411–420. [Google Scholar] [CrossRef]
  17. Wang, L.-S.; Wang, J.-Y.; Jian-Yao, W.; Cao, X.; Zhang, R.; Li-Sheng, W.; Xu, Z.-L.; Zhang, D.-G. Protective effect of baicalin against experimental colitis via suppression of oxidant stress and apoptosis. Pharmacogn. Mag. 2016, 12, 225–234. [Google Scholar] [CrossRef] [Green Version]
  18. Hunter, D.J. Pharmacologic therapy for osteoarthritis—the era of disease modification. Nat. Rev. Rheumatol. 2010, 7, 13–22. [Google Scholar] [CrossRef]
  19. Alonso, M.N.; Wong, M.T.; Zhang, A.L.; Winer, D.; Suhoski, M.M.; Tolentino, L.L.; Gaitan, J.; Davidson, M.G.; Kung, T.H.; Galel, D.M.; et al. TH1, TH2, and TH17 cells instruct monocytes to differentiate into specialized dendritic cell subsets. Blood 2011, 118, 3311–3320. [Google Scholar] [CrossRef] [Green Version]
  20. Nakagawa, T.; Hirano, T.; Nakagawa, N.; Yoshizaki, K.; Kishimoto, T. Effect of recombinant IL 2 and gamma-IFN on proliferation and differentiation of human B cells. J. Immunol. 1985, 134, 959–966. [Google Scholar]
  21. Osborne, L.C.; A Duthie, K.; Seo, J.H.; Gascoyne, R.D.; Abraham, N. Selective ablation of the YxxM motif of IL-7Rα suppresses lymphomagenesis but maintains lymphocyte development. Oncogene 2010, 29, 3854–3864. [Google Scholar] [CrossRef] [PubMed] [Green Version]
  22. Truong, A.D.; Hong, Y.H.; Lillehoj, H.S. RNA-seq Profiles of Immune Related Genes in the Spleen of Necrotic Enteritis-afflicted Chicken Lines. Asian-Australasian J. Anim. Sci. 2015, 28, 1496–1511. [Google Scholar] [CrossRef] [PubMed] [Green Version]
  23. Holmes, T.D.; Wilson, E.B.; Black, E.V.I.; Benest, A.V.; Vaz, C.; Tan, B.; Tanavde, V.M.; Cook, G.P. Licensed human natural killer cells aid dendritic cell maturation via TNFSF14/LIGHT. Proc. Natl. Acad. Sci. USA 2014, 111, E5688–E5696. [Google Scholar] [CrossRef] [PubMed] [Green Version]
  24. Valatas, V.; Kolios, G.; Bamias, G. TL1A (TNFSF15) and DR3 (TNFRSF25): A Co-stimulatory System of Cytokines With Diverse Functions in Gut Mucosal Immunity. Front. Immunol. 2019, 10, 583. [Google Scholar] [CrossRef] [Green Version]
  25. Fava, V.M.; Cobat, A.; Van Thuc, N.; Latini, A.C.P.; Stefani, M.M.A.; Belone, A.F.; Ba, N.N.; Orlova, M.; Manry, J.; Mira, M.; et al. Association of TNFSF8 Regulatory Variants With Excessive Inflammatory Responses but not Leprosy Per Se. J. Infect. Dis. 2014, 211, 968–977. [Google Scholar] [CrossRef] [Green Version]
  26. von Andrian, U.H.; Chambers, J.D.; McEvoy, L.M.; Bargatze, R.F.; E Arfors, K.; Butcher, E.C. Two-step model of leukocyte-endothelial cell interaction in inflammation: Distinct roles for LECAM-1 and the leukocyte beta 2 integrins in vivo. Proc. Natl. Acad. Sci. USA 1991, 88, 7538–7542. [Google Scholar] [CrossRef] [Green Version]
  27. Tian, D.; Li, Y.; Li, X.; Tian, Z. Aloperine inhibits proliferation, migration and invasion and induces apoptosis by blocking the Ras signaling pathway in human breast cancer cells. Mol. Med. Rep. 2018, 18, 3699–3710. [Google Scholar] [CrossRef] [Green Version]
  28. Abdel-Salam, B.K.A.-H. Comparing effects of interleukin-2 and interleukin-4 on the expression of MHC class II, CD80 and CD86 on polymorphonuclear neutrophils. Egypt. J. Med. Hum. Genet. 2010, 11, 115–120. [Google Scholar] [CrossRef] [Green Version]
  29. Urban, D.; Thanabalasingam, U.; Stibenz, D.; Kaufmann, J.; Meyborg, H.; Fleck, E.; Gräfe, M.; Stawowy, P. CD40/CD40L interaction induces E-selectin dependent leukocyte adhesion to human endothelial cells and inhibits endothelial cell migration. Biochem. Biophys. Res. Commun. 2011, 404, 448–452. [Google Scholar] [CrossRef]
  30. Rosenthal, R.; Milatz, S.; Krug, S.M.; Oelrich, B.; Schulzke, J.-D.; Amasheh, S.; Günzel, D.; Fromm, M. Claudin-2, a component of the tight junction, forms a paracellular water channel. J. Cell Sci. 2010, 123, 1913–1921. [Google Scholar] [CrossRef] [Green Version]
  31. Zeissig, S.; Bürgel, N.; Günzel, D.; Richter, J.; Mankertz, J.; Wahnschaffe, U.; Kroesen, A.J.; Zeitz, M.; Fromm, M.; Schulzke, J.D. Changes in expression and distribution of claudin 2, 5 and 8 lead to discontinuous tight junctions and barrier dysfunction in active Crohn’s disease. Gut 2007, 56, 61–72. [Google Scholar] [CrossRef] [PubMed]
  32. El-Husseini, A.A.; Sheashaa, H.A.; Sabry, A.A.; Moustafa, F.E.; Sobh, M.A. Acute Postinfectious Crescentic Glomerulonephritis: Clinicopathologic Presentation and Risk Factors. Int. Urol. Nephrol. 2005, 37, 603–609. [Google Scholar] [CrossRef] [PubMed]
  33. Kremer, V.; Ligtenberg, M.A.; Zendehdel, R.; Seitz, C.; Duivenvoorden, A.; Wennerberg, E.; Colón, E.; Scherman-Plogell, A.-H.; Lundqvist, A. Genetic engineering of human NK cells to express CXCR2 improves migration to renal cell carcinoma. J. Immunother. Cancer 2017, 5, 73. [Google Scholar] [CrossRef] [PubMed]
  34. Pageon, S.V.; Tabarin, T.; Yamamoto, Y.; Ma, Y.; Nicovich, P.R.; Bridgeman, J.S.; Cohnen, A.; Benzing, C.; Gao, Y.; Crowther, M.D.; et al. Functional role of T-cell receptor nanoclusters in signal initiation and antigen discrimination. Proc. Natl. Acad. Sci. USA 2016, 113, E5454–E5463. [Google Scholar] [CrossRef] [Green Version]
  35. Wang, H.; Zeng, X.; Fan, Z.; Lim, B. RhoH modulates pre-TCR and TCR signalling by regulating LCK. Cell. Signal. 2011, 23, 249–258. [Google Scholar] [CrossRef]
  36. Shimamura, M.; Huang, Y.-Y.; Kobayashi, M.; Goji, H. Altered production of immunoregulatory cytokines by invariant V 19 TCR-bearing cells dependent on the duration and intensity of TCR engagement. Int. Immunol. 2008, 21, 179–185. [Google Scholar] [CrossRef] [Green Version]
  37. Zhao, J.-L.; Wang, X.; Wang, Y.-S. Relationships between Th1/Th2 cytokine profiles and chest radiographic manifestations in childhood Mycoplasma pneumoniae pneumonia. Ther. Clin. Risk Manag. 2016, 12, 1683–1692. [Google Scholar] [CrossRef] [Green Version]
  38. Loria-Cervera, E.N.; Sosa-Bibiano, E.I.; Villanueva-Lizama, L.E.; Van Wynsberghe, N.R.; Schountz, T.; Andrade-Narvaez, F.J. Cloning and sequence analysis of Peromyscus yucatanicus (Rodentia) Th1 (IL-12p35, IFN-γ and TNF) and Th2 (IL-4, IL-10 and TGF-β) cytokines. Cytokine 2014, 65, 48–55. [Google Scholar] [CrossRef]
  39. Mejía, D.; Salvatierra, G.; Maximiliano, J.; Rímac, R.; Carhuaricra, D.; Almeyda, M.; Luna, L.; Rosadio, R.; Maturrano, L. Expresión de citoquinas Th1 (IL-2, IL-12, IFN-γ, TNF-α), Th2 (IL-4, IL-10, TGF-β) y Th17 (IL-17) en linfocitos circulantes de cuyes inoculados con una cepa de campo de Salmonella Typhimurium. Rev. De Investig. Vet. Del Perú 2019, 30, 1750–1761. [Google Scholar] [CrossRef] [Green Version]
  40. Schulze-Koops, H.; Lipsky, P.E.; Davis, L.S. Human memory T cell differentiation into Th2-like effector cells is dependent on IL-4 and CD28 stimulation and inhibited by TCR ligation. Eur. J. Immunol. 1998, 28, 2517–2529. [Google Scholar] [CrossRef]
  41. Torres, K.C.; Dutra, W.O.; Gollob, K.J. Endogenous IL-4 and IFN-γ are essential for expression of Th2, but not Th1 cytokine message during the early differentiation of human CD4+ T helper cells. Hum. Immunol. 2004, 65, 1328–1335. [Google Scholar] [CrossRef] [PubMed]
  42. Li, J.; Lin, X.; Liu, X.; Ma, Z.; Li, Y. Baicalin regulates Treg/Th17 cell imbalance by inhibiting autophagy in allergic rhinitis. Mol. Immunol. 2020, 125, 162–171. [Google Scholar] [CrossRef] [PubMed]
  43. Fernandes, J.R.; Berthoud, T.K.; Kumar, A.; Angel, J.B. IL-23 signaling in Th17 cells is inhibited by HIV infection and is not restored by HAART: Implications for persistent immune activation. PLoS ONE 2017, 12, e0186823. [Google Scholar] [CrossRef] [PubMed]
  44. Wang, F.; Cui, Y.; Shen, X.; Wang, S.; Yang, G.-B. IL-17A and IL-17F repair HIV-1 gp140 damaged Caco-2 cell barriers by upregulating tight junction genes. Microbes Infect. 2019, 21, 393–400. [Google Scholar] [CrossRef] [PubMed]
  45. Kong, X.; Feng, D.; Wang, H.; Hong, F.; Bertola, A.; Wang, F.-S.; Gao, B. Interleukin-22 induces hepatic stellate cell senescence and restricts liver fibrosis in mice. Hepatology 2012, 56, 1150–1159. [Google Scholar] [CrossRef] [PubMed]
  46. Clevers, H. The Intestinal Crypt, A Prototype Stem Cell Compartment. Cell 2013, 154, 274–284. [Google Scholar] [CrossRef] [Green Version]
  47. Van der Flier, L.G.; Clevers, H. Stem Cells, Self-Renewal, and Differentiation in the Intestinal Epithelium. Annu. Rev. Physiol. 2009, 71, 241–260. [Google Scholar] [CrossRef]
  48. Barker, N.; Clevers, H. Tracking Down the Stem Cells of the Intestine: Strategies to Identify Adult Stem Cells. Gastroenterology 2007, 133, 1755–1760. [Google Scholar] [CrossRef]
  49. Thin, L.; Lawrance, I.; Spilsbury, K.; Kava, J.; Olynyk, J. Detection of liver injury in IBD using transient elastography. J. Crohn’s Colitis 2014, 8, 671–677. [Google Scholar] [CrossRef] [Green Version]
  50. Ooi, K.; Shiraki, K.; Sakurai, Y.; Morishita, Y.; Nobori, T. Clinical significance of abnormal lipoprotein patterns in liver diseases. Int. J. Mol. Med. 2005, 15, 655–660. [Google Scholar] [CrossRef]
  51. Benedetti, E.; D’Angelo, B.; Cristiano, L.; Di Giacomo, E.; Fanelli, F.; Moreno, S.; Cecconi, F.; Fidoamore, A.; Antonosante, A.; Falcone, R.; et al. Involvement of peroxisome proliferator-activated receptor β/δ (PPAR β/δ) in BDNF signaling during aging and in Alzheimer disease: Possible role of 4-hydroxynonenal (4-HNE). Cell Cycle 2014, 13, 1335–1344. [Google Scholar] [CrossRef] [PubMed]
  52. Wu, W.; Feng, J.; Jiang, D.; Zhou, X.; Jiang, Q.; Cai, M.; Wang, X.; Shan, T.; Wang, Y. AMPK regulates lipid accumulation in skeletal muscle cells through FTO-dependent demethylation of N6-methyladenosine. Sci. Rep. 2017, 7, 41606. [Google Scholar] [CrossRef] [PubMed] [Green Version]
  53. Chaumontet, C.; Even, P.C.; Schwarz, J.; Simonin-Foucault, A.; Piedcoq, J.; Fromentin, G.; Azzout-Marniche, D.; Tomé, D. High dietary protein decreases fat deposition induced by high-fat and high-sucrose diet in rats. Br. J. Nutr. 2015, 114, 1132–1142. [Google Scholar] [CrossRef] [PubMed] [Green Version]
  54. Migita, T.; Takayama, K.; Urano, T.; Obinata, D.; Ikeda, K.; Soga, T.; Takahashi, S.; Inoue, S. ACSL3 promotes intratumoral steroidogenesis in prostate cancer cells. Cancer Sci. 2017, 108, 2011–2021. [Google Scholar] [CrossRef] [PubMed]
  55. Dai, J.; Liang, K.; Zhao, S.; Jia, W.; Liu, Y.; Wu, H.; Lv, J.; Cao, C.; Chen, T.; Zhuang, S.; et al. Chemoproteomics reveals baicalin activates hepatic CPT1 to ameliorate diet-induced obesity and hepatic steatosis. Proc. Natl. Acad. Sci. USA 2018, 115, E5896–E5905. [Google Scholar] [CrossRef] [Green Version]
  56. Campbell, C.; McKenney, P.T.; Konstantinovsky, D.; Isaeva, O.; Schizas, M.; Verter, J.; Mai, C.; Jin, W.-B.; Guo, C.-J.; Violante, S.; et al. Bacterial metabolism of bile acids promotes generation of peripheral regulatory T cells. Nature 2020, 581, 475–479. [Google Scholar] [CrossRef]
  57. Hang, S.; Paik, D.; Yao, L.; Kim, E.; Trinath, J.; Lu, J.; Ha, S.; Nelson, B.N.; Kelly, S.P.; Wu, L.; et al. Bile acid metabolites control TH17 and Treg cell differentiation. Nature 2019, 576, 143–148. [Google Scholar] [CrossRef]
  58. Thibaut, M.M.; Bindels, L.B. Crosstalk between bile acid-activated receptors and microbiome in entero-hepatic inflammation. Trends Mol. Med. 2022, 28, 223–236. [Google Scholar] [CrossRef]
  59. Atarashi, K.; Tanoue, T.; Oshima, K.; Suda, W.; Nagano, Y.; Nishikawa, H.; Fukuda, S.; Saito, T.; Narushima, S.; Hase, K.; et al. Treg induction by a rationally selected mixture of Clostridia strains from the human microbiota. Nature 2013, 500, 232–236. [Google Scholar] [CrossRef]
  60. Quraishi, M.N.; Acharjee, A.; Beggs, A.D.; Horniblow, R.; Tselepis, C.; Gkoutos, G.; Ghosh, S.; E Rossiter, A.; Loman, N.; van Schaik, W.; et al. A Pilot Integrative Analysis of Colonic Gene Expression, Gut Microbiota, and Immune Infiltration in Primary Sclerosing Cholangitis-Inflammatory Bowel Disease: Association of Disease With Bile Acid Pathways. J. Crohn’s Colitis 2020, 14, 935–947. [Google Scholar] [CrossRef] [Green Version]
  61. Sinha, S.R.; Haileselassie, Y.; Nguyen, L.P.; Tropini, C.; Wang, M.; Becker, L.S.; Sim, D.; Jarr, K.; Spear, E.T.; Singh, G.; et al. Dysbiosis-Induced Secondary Bile Acid Deficiency Promotes Intestinal Inflammation. Cell Host Microbe 2020, 27, 659–+. [Google Scholar] [CrossRef]
  62. Song, X.; Sun, X.; Oh, S.F.; Wu, M.; Zhang, Y.; Zheng, W.; Geva-Zatorsky, N.; Jupp, R.; Mathis, D.; Benoist, C.; et al. Microbial bile acid metabolites modulate gut RORγ+ regulatory T cell homeostasis. Nature 2020, 577, 410–415. [Google Scholar] [CrossRef] [PubMed]
  63. Zhu, L.; Zong, X.; Xiao, X.; Cheng, Y.; Fu, J.; Lu, Z.; Jin, M.; Wang, F.; Wang, Y. Multi-Omics Analysis of the Gut-Liver Axis Reveals the Mechanism of Liver Injury in Colitis Mice. Front. Immunol. 2022, 12, 773070. [Google Scholar] [CrossRef] [PubMed]
  64. Ueyama, J.; Nadai, M.; Kanazawa, H.; Iwase, M.; Nakayama, H.; Hashimoto, K.; Yokoi, T.; Baba, K.; Takagi, K.; Takagi, K.; et al. Endotoxin from various gram-negative bacteria has differential effects on function of hepatic cytochrome P450 and drug transporters. Eur. J. Pharmacol. 2005, 510, 127–134. [Google Scholar] [CrossRef]
  65. Koroleva, E.P.; Halperin, S.; Gubernatorova, E.O.; Macho-Fernandez, E.; Spencer, C.M.; Tumanov, A.V. Citrobacter rodentium -induced colitis: A robust model to study mucosal immune responses in the gut. J. Immunol. Methods 2015, 421, 61–72. [Google Scholar] [CrossRef]
  66. Youn, Y.; Lee, S.W.; Cho, H.-H.; Park, S.; Chung, H.-S.; Seo, J.W. Antibiotics-Associated Hemorrhagic Colitis Caused by Klebsiella oxytoca: Two Case Reports. Pediatr. Gastroenterol. Hepatol. Nutr. 2018, 21, 141–146. [Google Scholar] [CrossRef] [Green Version]
  67. Wang, S.; Huang, M.; You, X.; Zhao, J.; Chen, L.; Wang, L.; Luo, Y.; Chen, Y. Gut microbiota mediates the anti-obesity effect of calorie restriction in mice. Sci. Rep. 2018, 8, 13037. [Google Scholar] [CrossRef] [Green Version]
  68. Evans, C.C.; LePard, K.J.; Kwak, J.W.; Stancukas, M.C.; Laskowski, S.; Dougherty, J.; Moulton, L.; Glawe, A.; Wang, Y.; Leone, V.; et al. Exercise Prevents Weight Gain and Alters the Gut Microbiota in a Mouse Model of High Fat Diet-Induced Obesity. PLoS ONE 2014, 9, e92193. [Google Scholar] [CrossRef]
  69. Shang, Q.; Song, G.; Zhang, M.; Shi, J.; Xu, C.; Hao, J.; Li, G.; Yu, G. Dietary fucoidan improves metabolic syndrome in association with increased Akkermansia population in the gut microbiota of high-fat diet-fed mice. J. Funct. Foods 2017, 28, 138–146. [Google Scholar] [CrossRef]
  70. Zhang, M.; Zou, X.; Zhao, D.; Zhao, F.; Li, C. Pork Meat Proteins Alter Gut Microbiota and Lipid Metabolism Genes in the Colon of Adaptive Immune-Deficient Mice. Mol. Nutr. Food Res. 2020, 64, 1901105. [Google Scholar] [CrossRef]
  71. Wu, W.; Xie, J.; Zhang, H. Dietary fibers influence the intestinal SCFAs and plasma metabolites profiling in growing pigs. Food Funct. 2016, 7, 4644–4654. [Google Scholar] [CrossRef] [PubMed]
  72. Xu, Y.; Liu, L.; Long, S.; Pan, L.; Piao, X. Effect of organic acids and essential oils on performance, intestinal health and digestive enzyme activities of weaned pigs. Anim. Feed Sci. Technol. 2018, 235, 110–119. [Google Scholar] [CrossRef]
  73. Fan, P.; Liu, P.; Song, P.; Chen, X.; Ma, X. Moderate dietary protein restriction alters the composition of gut microbiota and improves ileal barrier function in adult pig model. Sci. Rep. 2017, 7, srep43412. [Google Scholar] [CrossRef] [PubMed]
Figure 1. Growth performance and liver morphologies. (A) Body weight gain (n = 16). (B) IL-1β, IL-6, and TNF-α levels in serum (n = 12). (C) Staining profiles by H&E of liver (scale bars: 500 μm). (D) Liver weight/body weight. (E) AST and GSH-PX levels in serum (n = 8). (F) TBA levels in liver (n = 8). Values are means with their standard error means represented by vertical bars. Comparisons of means among groups was performed by one-way ANOVA followed by multiple comparisons using Tukey’s HSD test. Different letters indicate significant differences between the two groups (p < 0.05), while the same or no letter indicates insignificant differences (p > 0.05).
Ijms 23 06072 g001
Figure 2. Intestinal morphologies. (A) Staining profiles by H&E of jejunum (scale bars: 500 μm) and colon (scale bars: 1000 μm). (B) Villus height, crypt depth, and villus height/crypt depth of jejunum. (C) Crypt depth and muscular layer width of colon. Values are means (n = 12/diet), with their standard error means represented by vertical bars. Comparisons of means among groups was performed by one-way ANOVA followed by multiple comparisons using the Tukey’s HSD test. Different letters indicate significant differences between the two groups (p < 0.05), while the same or no letter indicates insignificant differences (p > 0.05).
Ijms 23 06072 g002
Figure 3. Colon transcriptome. (A) Upregulated (red bars) and downregulated (green bars) DEG numbers and volcano plots of identified genes by comparisons between LM + BL and LM, between LM + BL and CON, and between LM and CON (n = 4 in CON and n = 5 in LM and LM + BL). The p-adjust < 0.05 and absolute fold change ≥ 2 were used as the thresholds to filter the DEGs. Green spots indicate downregulated genes, while red spots indicate upregulated genes and gray ones indicate the genes that are not significant. (B) GO function analysis for DEGs in LM vs. CON and in LM + BL vs. LM. (C) KEGG pathway enrichment analysis for DEGs in LM vs. CON and in LM + BL vs. LM. The top 10 functions are shown.
Ijms 23 06072 g003
Figure 4. Liver transcriptome. (A) Volcano plots of identified genes by comparisons between LM and CON (n = 5), and (B) between LM + BL and LM. The p-value < 0.05 and absolute fold change ≥ 2 was used as the thresholds to filter the DEGs. Yellow spots indicate downregulated genes, while the red spots indicate upregulated genes, and blue ones indicate the genes that were not significant. (C) Heat map clustering for DEGs in LM vs. CON. (D) GO function analysis for DEGs in LM vs. CON and (E) in LM + BL vs. LM. The top 15 functions are shown. (F) KEGG pathway enrichment analysis for DEGs in LM vs. CON and (G) in LM + BL vs. LM.
Ijms 23 06072 g004
Figure 5. The mRNA expression of key DEGs: (A) Related cytokines IL-1β, IL-6, TNF-α, IL-22, and IL-23, and PKCθ, CD4, LCK, LAT, ITK, Galnt5, Galnt10 in colon, and (B) Eci2, Hmgcr, Ehhadh, Acat1, Acsl3, and Hmgcs1 in liver. Values are means with their standard error means represented by vertical bars (n = 10). * means p < 0.05, ** means p < 0.01.
Ijms 23 06072 g005
Figure 6. Colon microbiome. (A) PCoA analyze. (B) Alpha-diversity of fecal microbiota in colon chyme of Shannoneven index. (C) Relative abundance of microbiota at the phylum level and genus levels. (D) Heat map and trend of bacterial at the genus level. (E) Phylum level bacterial statistical comparison in three groups. (F) Genus level bacterial statistical comparison in three groups. (G) Scatter plot for short-chain fatty acid concentration in colon contents (n = 10 in CON and LM, n = 8 in LM + BL). Intergroup difference test was performed by Wilcoxon rank-sum test. * means statistically significant (p < 0.05), ** means p < 0.01. Less than 1% abundance of the phyla or genus was merged into others. Different letters indicate significant differences between the two groups (p < 0.05), while the same letter indicates insignificant differences (p > 0.05).
Ijms 23 06072 g006
Figure 7. Transcriptomics revealed that baicalin regulates intestinal immunity and repairs intestinal damage. Fold change of differentially expressed genes related to (A) NF-κB signaling pathway and ras signaling pathway; (B) intestinal immunity cell adhesion molecules and complement and coagulation cascades; (C) chemokine signaling pathway and O-glycan biosynthesis; (D) cytokine–cytokine receptor interaction as well as T-cell receptor signaling pathway; and (E) the process of Th1/Th2 and Th17 cell differentiation. The red arrows indicate upregulation.
Ijms 23 06072 g007
Figure 8. Transcriptomics revealed that baicalin regulates lipid metabolism and bile secretion. Fold change of differential expressed genes related to (A) fatty acid degradation and glyoxylate and dicarboxylate metabolism, and (B) bile secretion, PPAR signaling pathway, and AMPK signaling pathway. (C) The process of fatty acid degradation, peroxisome, fatty acid biosynthesis, and bile secretion. (D) The process of glyoxylate and dicarboxylate metabolism. The red words indicate upregulation and green words indicate downregulation.
Ijms 23 06072 g008
Table 1. Primers Used for qRT-PCR analysis.
GeneForward Nucleotide Sequence Primers (5′-3′)Reverse Nucleotide Sequence Primers (5′-3′)Product Size (bp)
GAPDHACCACAGTCCATGCCATCACTCCACCACCCTGTTGCTGTA172
IL-1βTCGCAGCAGCACATCAACAAGAGAGGTCCACGGGAAAGACACAGG97
IL-6AGAGGATACCACTCCCAACAGACCAGCCACTCCTTCTGTGACTCCAG97
TNF-αGGACTAGCCAGGAGGGAGAACAGGCCAGTGAGTGAAAGGGACAGAAC103
Claudin-1AGATACAGTGCAAAGTCTTCGACAGGATGCCAATTACCATCAAG86
ZO-1CTGGTGAAGTCTCGGAAAAATGCATCTCTTGCTGCCAAACTATC97
OcculdinTGCTTCATCGCTTCCTTAGTAAGGGTTCACTCCCATTATGTACA155
Mucin1ACGTGAAGTCACAGCTTATACAAGGGCAAGGAAATAGACGATAG193
Mucin2TGCTGACGAGTGGTTGGTGAATGTGATGAGGTGGCAGACAGGAGAC137
IL-22GCAGATAACAACACAGATGTCCGTCTTCCAGGGTGAAGTTGAG111
IL-23CAGCGGGACATATGAATCTACTTTGAAGATGTCAGAGTCAAGCA184
PKCƟCGCCGACAGAGCACTCATCAACCAGTTCCCAGAGAGAAGGCAAATCC144
CD4CAGCATGGCAAAGGTGTATTAAGACTGAAGGTCACTTTGAACAC202
LCKAGGGAGAAGTGGTGAAACATTAAATCCGGGAAAAGTGATACGAG85
LATCAGCAGAATTCAGATGATGAGCTTCACGTAATCTTCACACGACT200
ITKCTACCTGGAAAAAGCTTGTGTCCGTGGAGCTGGTATATTGATCA136
Galnt5ACGCAGGCAGAGAGTGACAGGGCAACAGCAGCAGCAGTAGGAG114
Galnt10CCCAACACCAGCATCATCATCCCGACCAACACAATCTCCGCCACTAG117
Eci2CTTGTCACTGAAGTTTTCCCTGCTTTGGTTTTCTGGAGACGAAG234
HmgcrGGTGCAAAGTTCCTTAGTGATGGAATAGACACACCACGTTCATG112
EhhadhGAATGGACTCCAGAAAGCTAGTCGCTGTATTTCATCTACCAAGC150
Acat1AGGTAGCTCAGTCGGTAGTGTTGGTGGATCGTTTCTCGGTTCGTTTCTC138
Acsl3CGGAAATCATGGATCGGATCTAGTGGAGTACTACACCCTTTTGA132
Hmgcs1AAGCACAGCCACCGAGCATATTCACCATCCCACCCCACACTGAAG150
Publisher’s Note: MDPI stays neutral with regard to jurisdictional claims in published maps and institutional affiliations.

