
Semi-Empirical Calculation of Bodipy Aggregate Spectroscopic Properties through Direct Sampling of Configurational Ensembles


Abstract

1. Introduction
2. Materials and Methods
Aggregate Sampling
3. Results and Discussion
3.1. Rational Sampling
3.2. Comparative Analysis
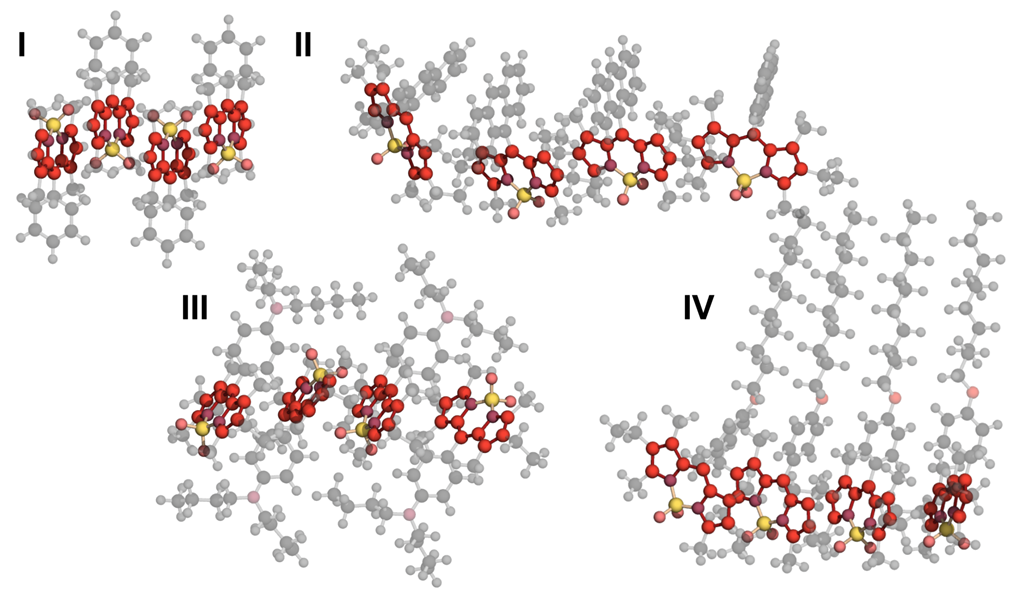
- (I)
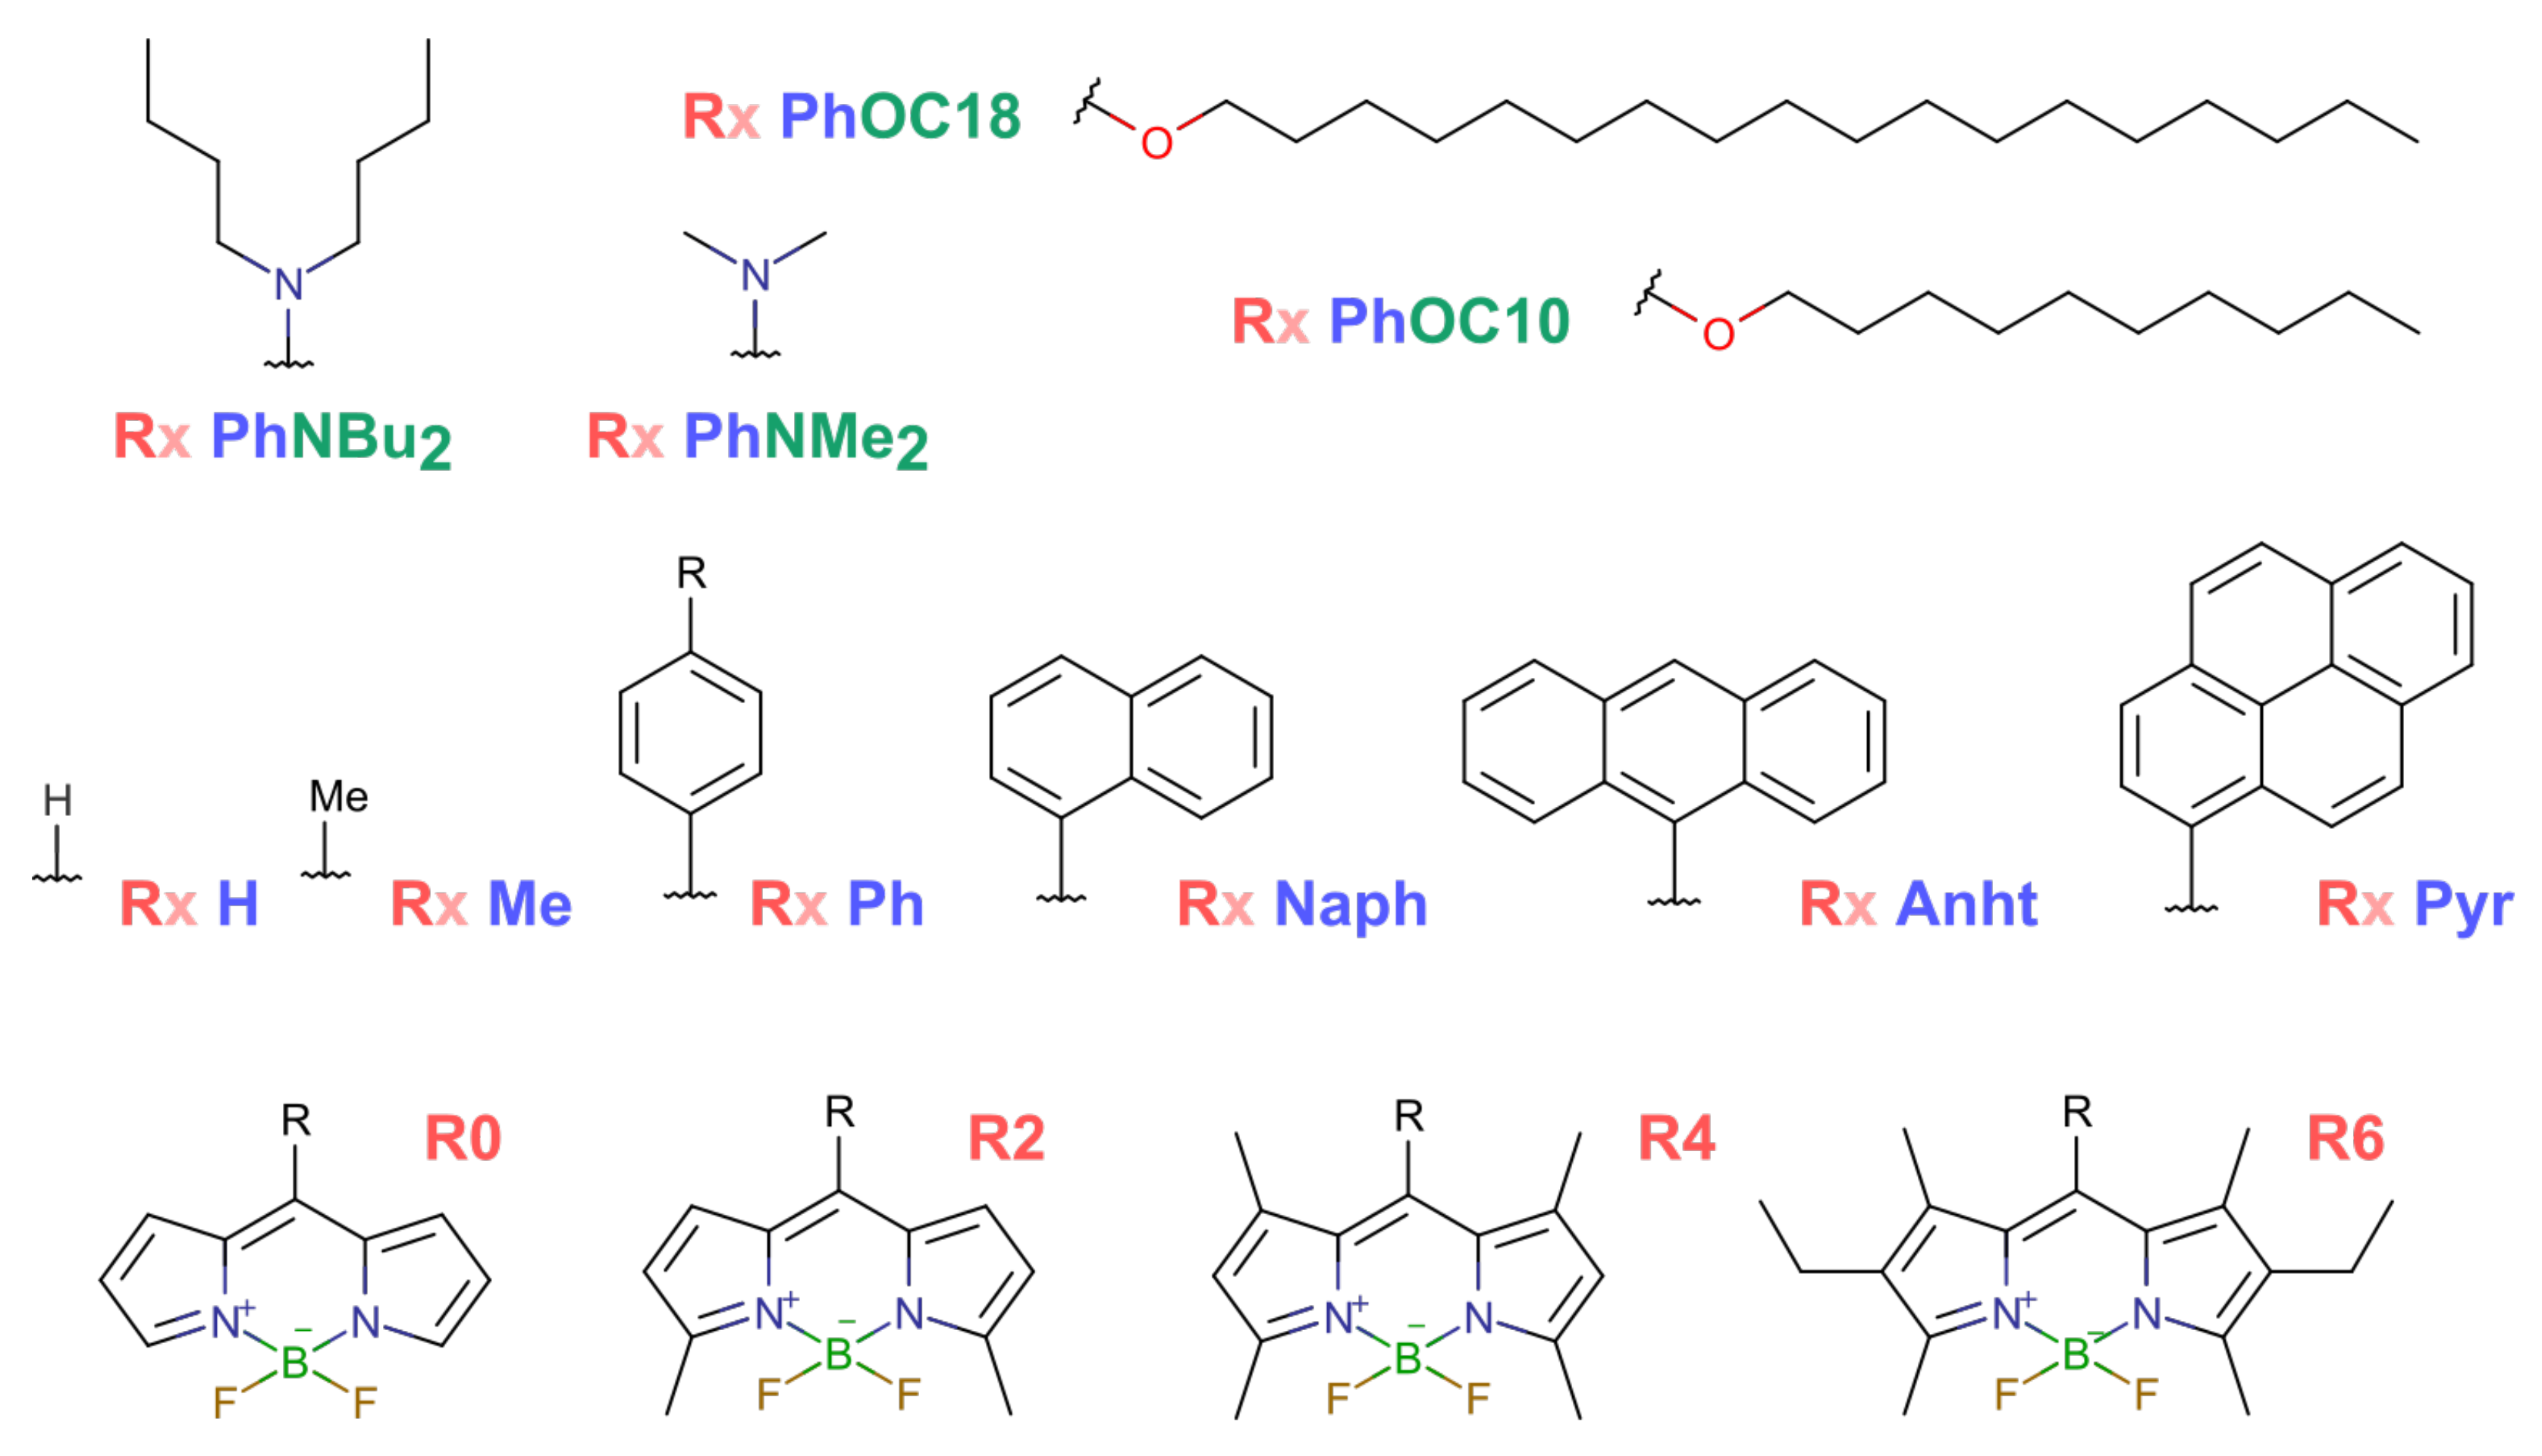
- Sparse core substitution: R0 Ph, R2 Ph, R4 Ph, R4 Me and R4 H;
- (II)
- Different size aromatic moiety: R6 H, R6 Ph, R6 Naph, R6 Anht and R6 Pyr;
- (III)
- Donating nitrogen in μ-position: R6 PhNMe and R6 PhNBu;
- (IV)
- Donating oxygen in μ-position and long aliphatic: R6 PhOC10 and R6 PhOC18.
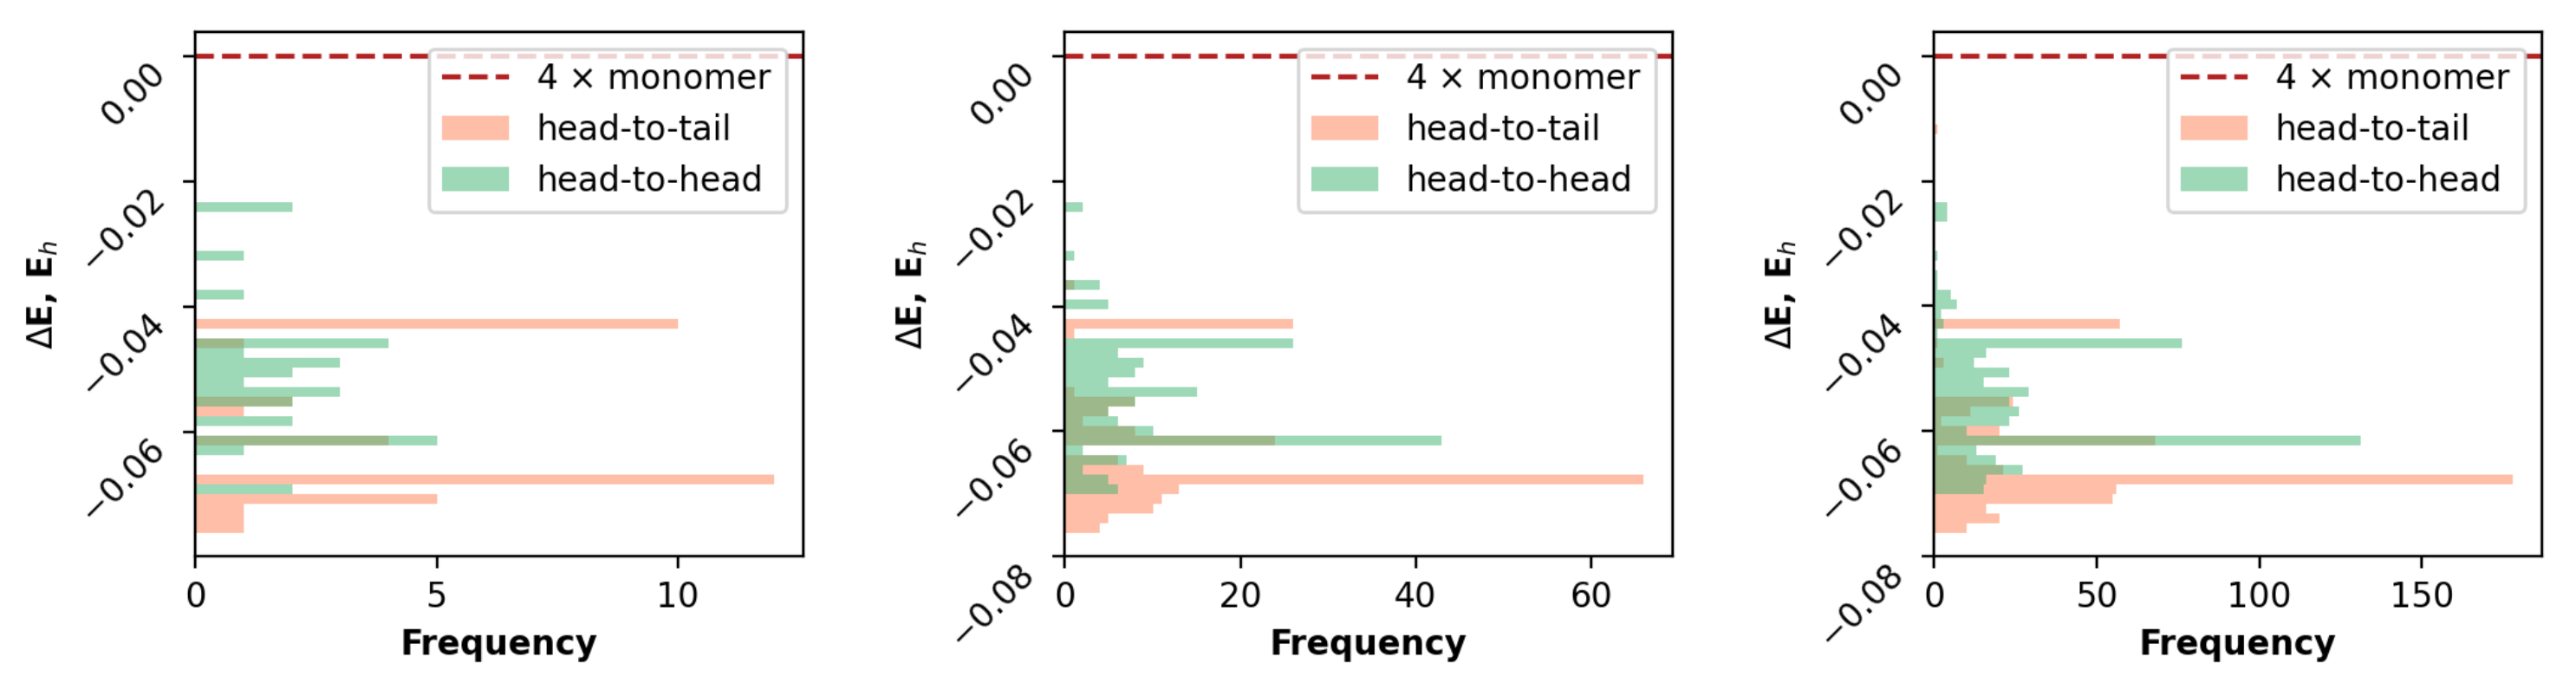
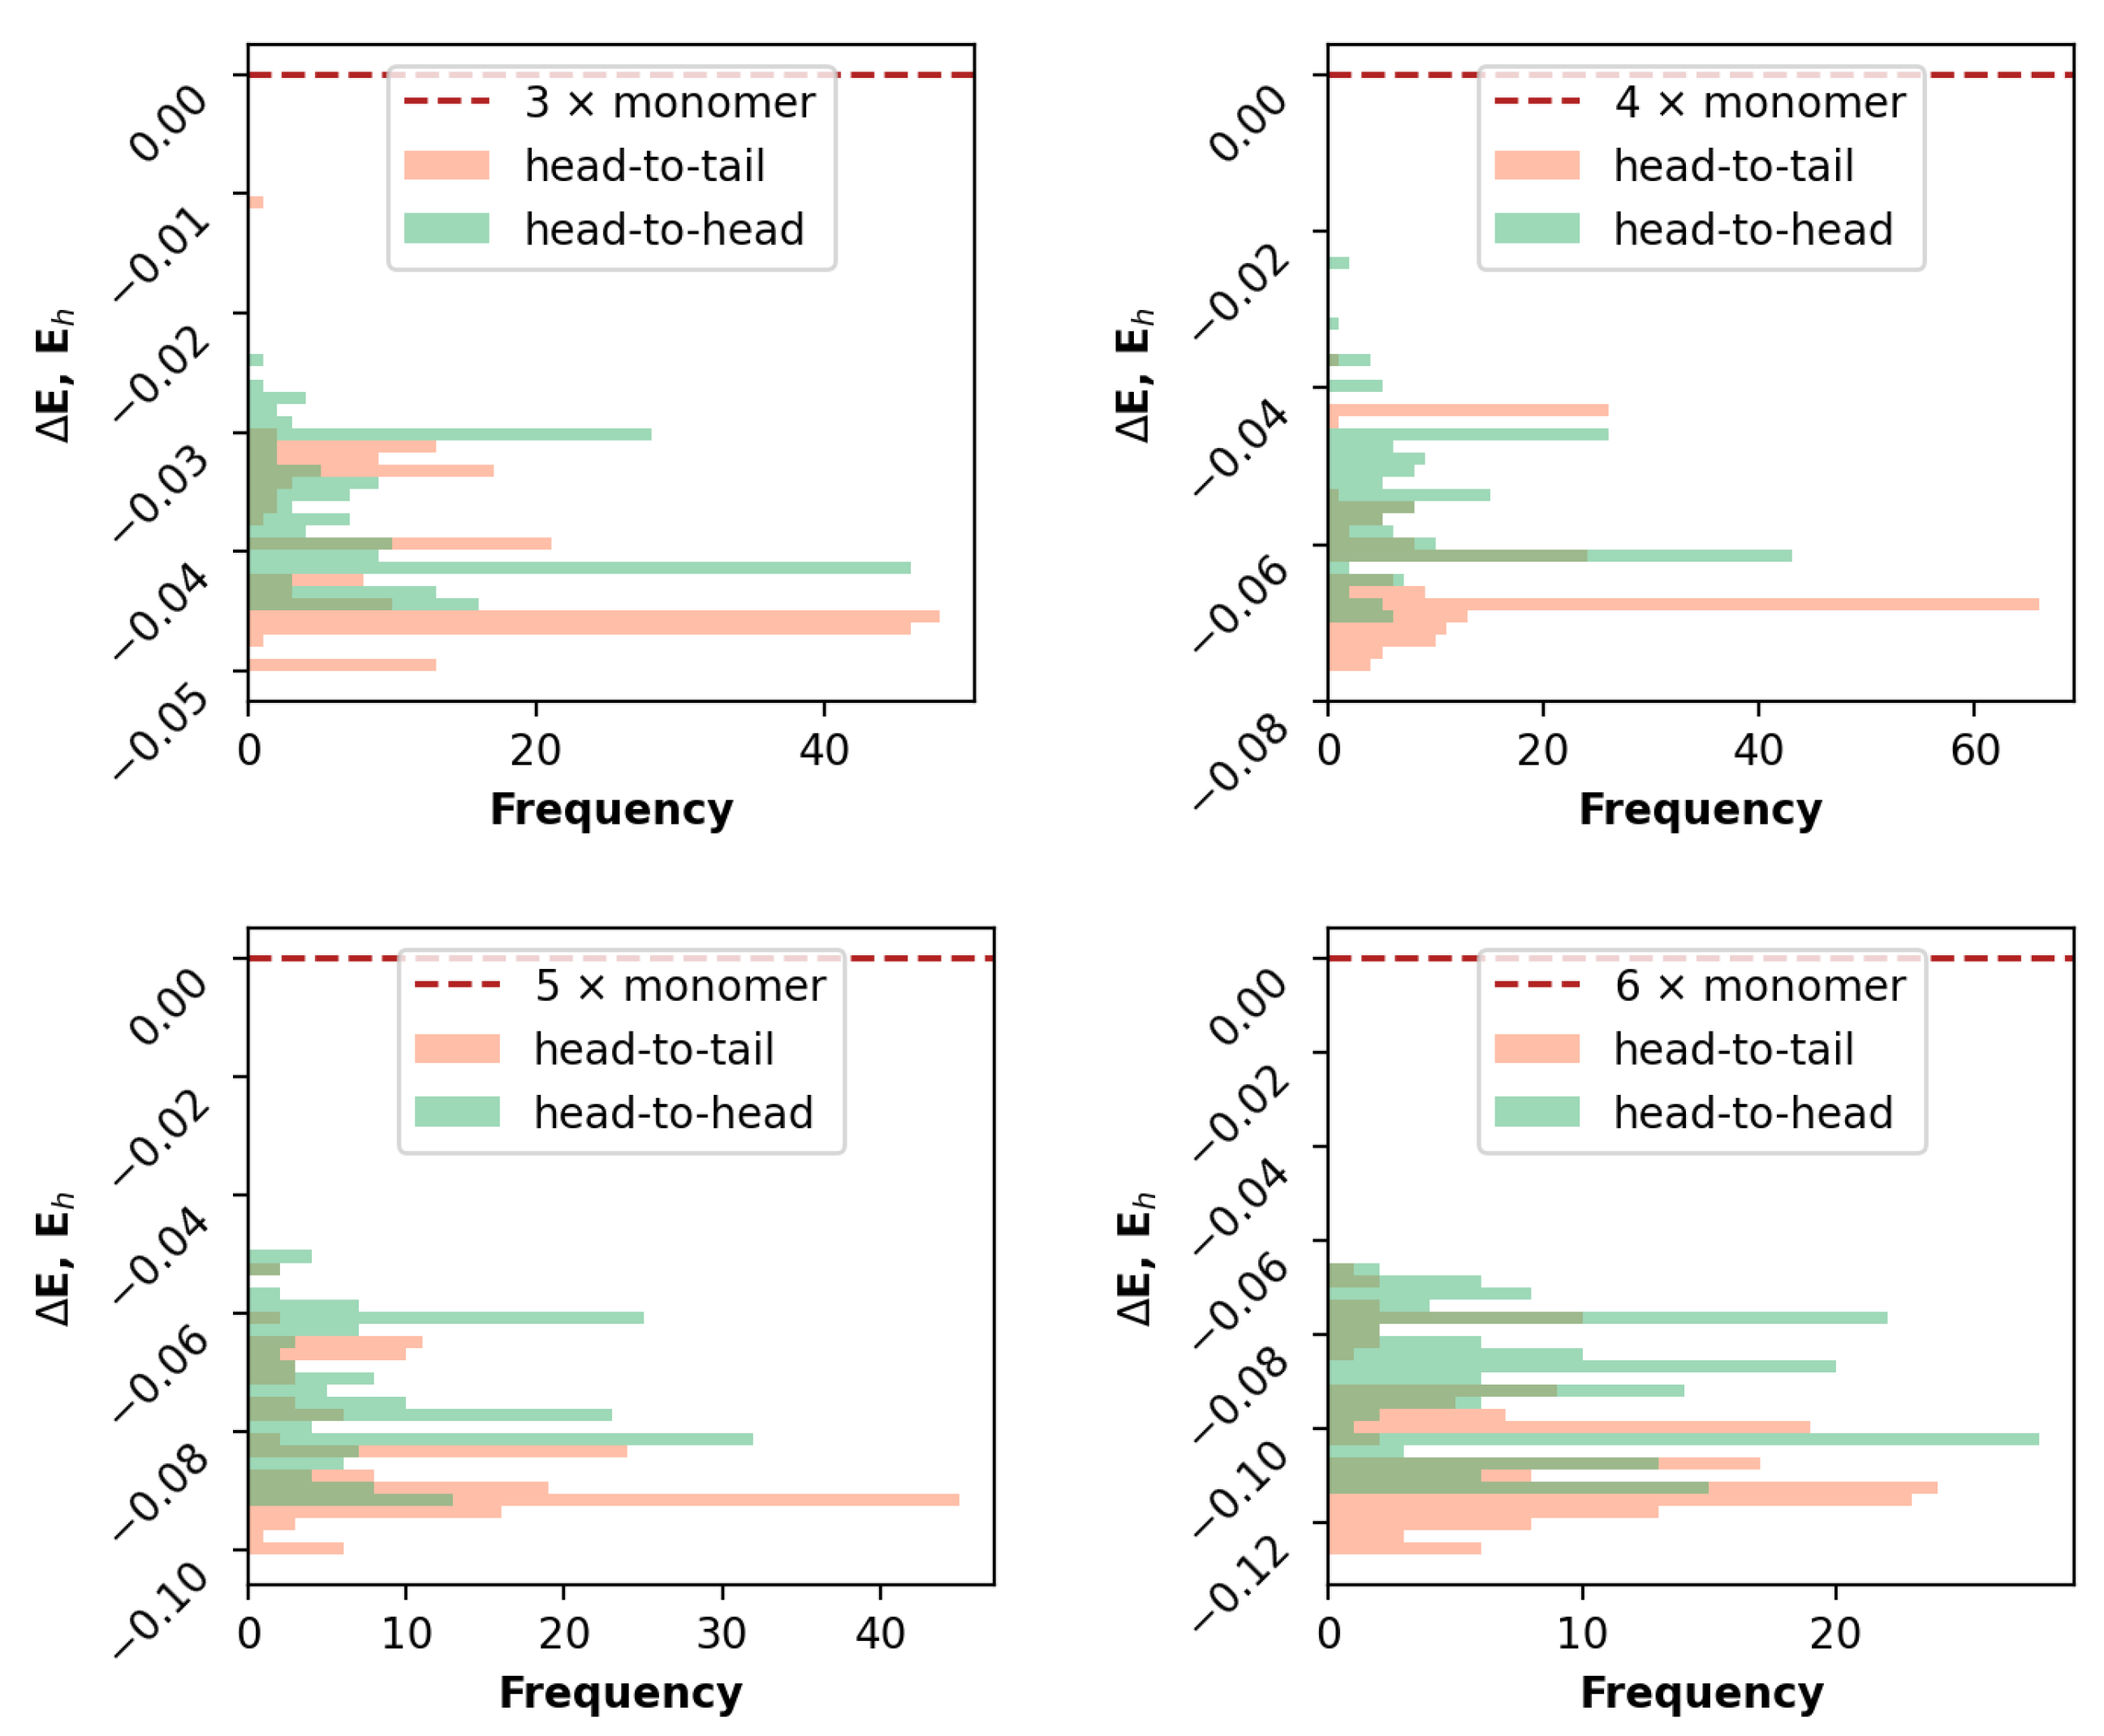
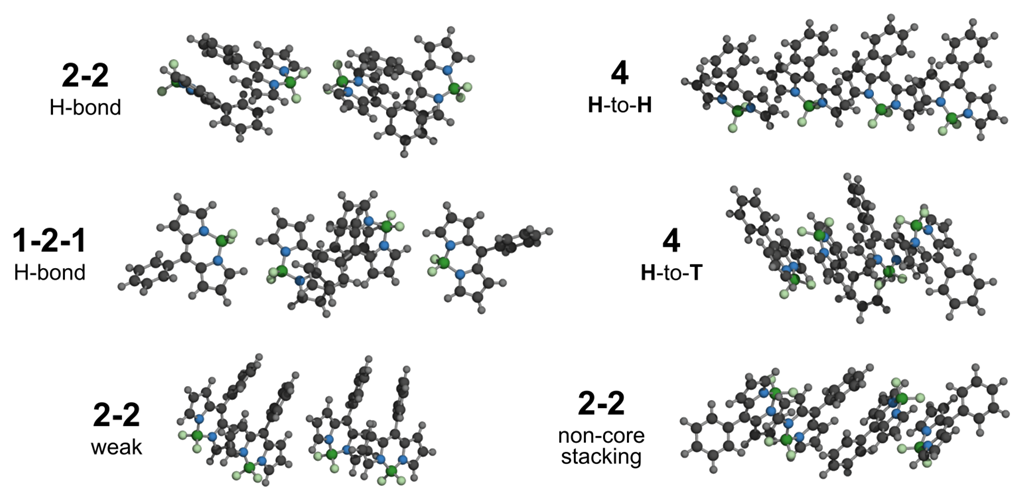
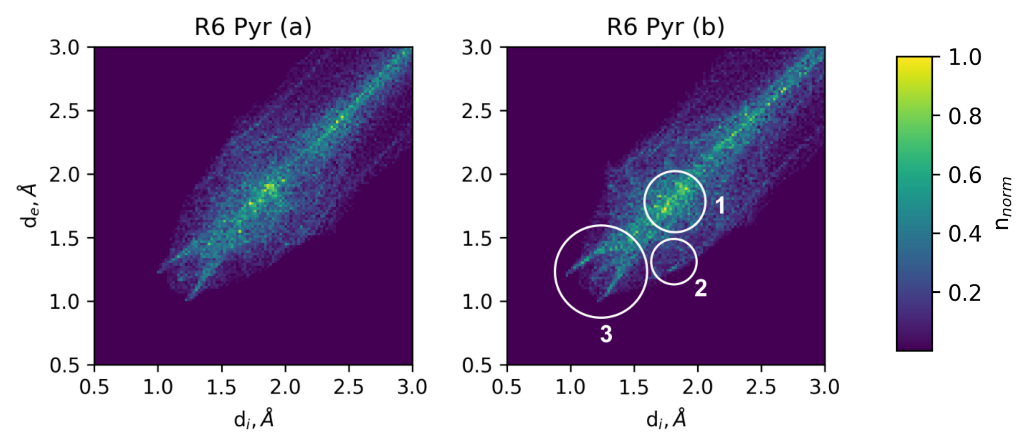
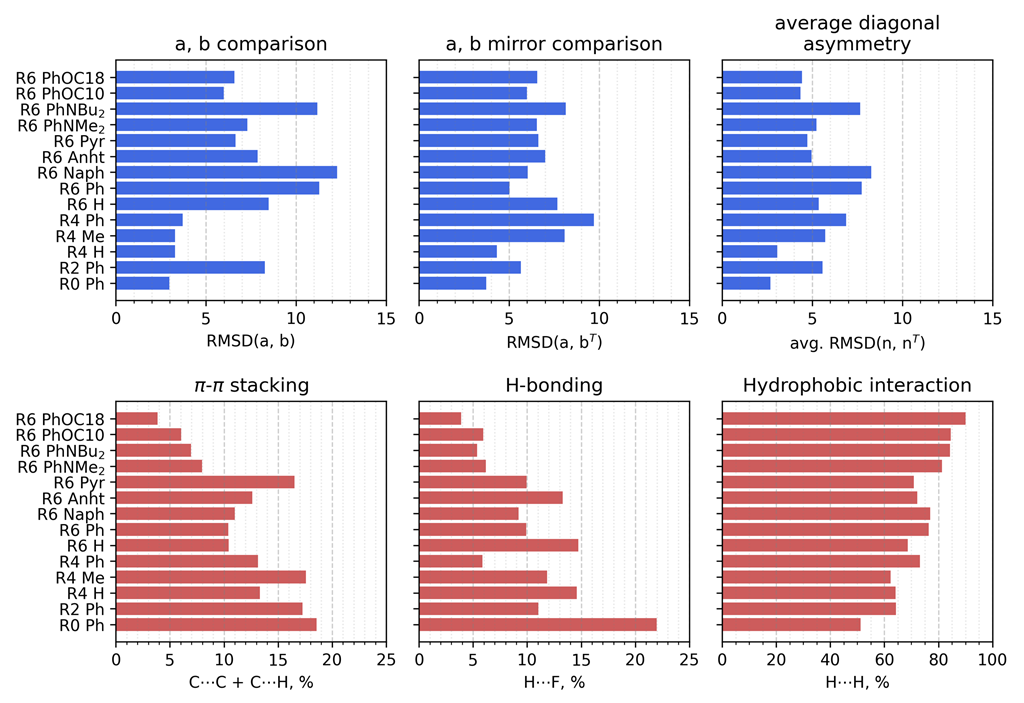
3.2.1. Geometrical Organization
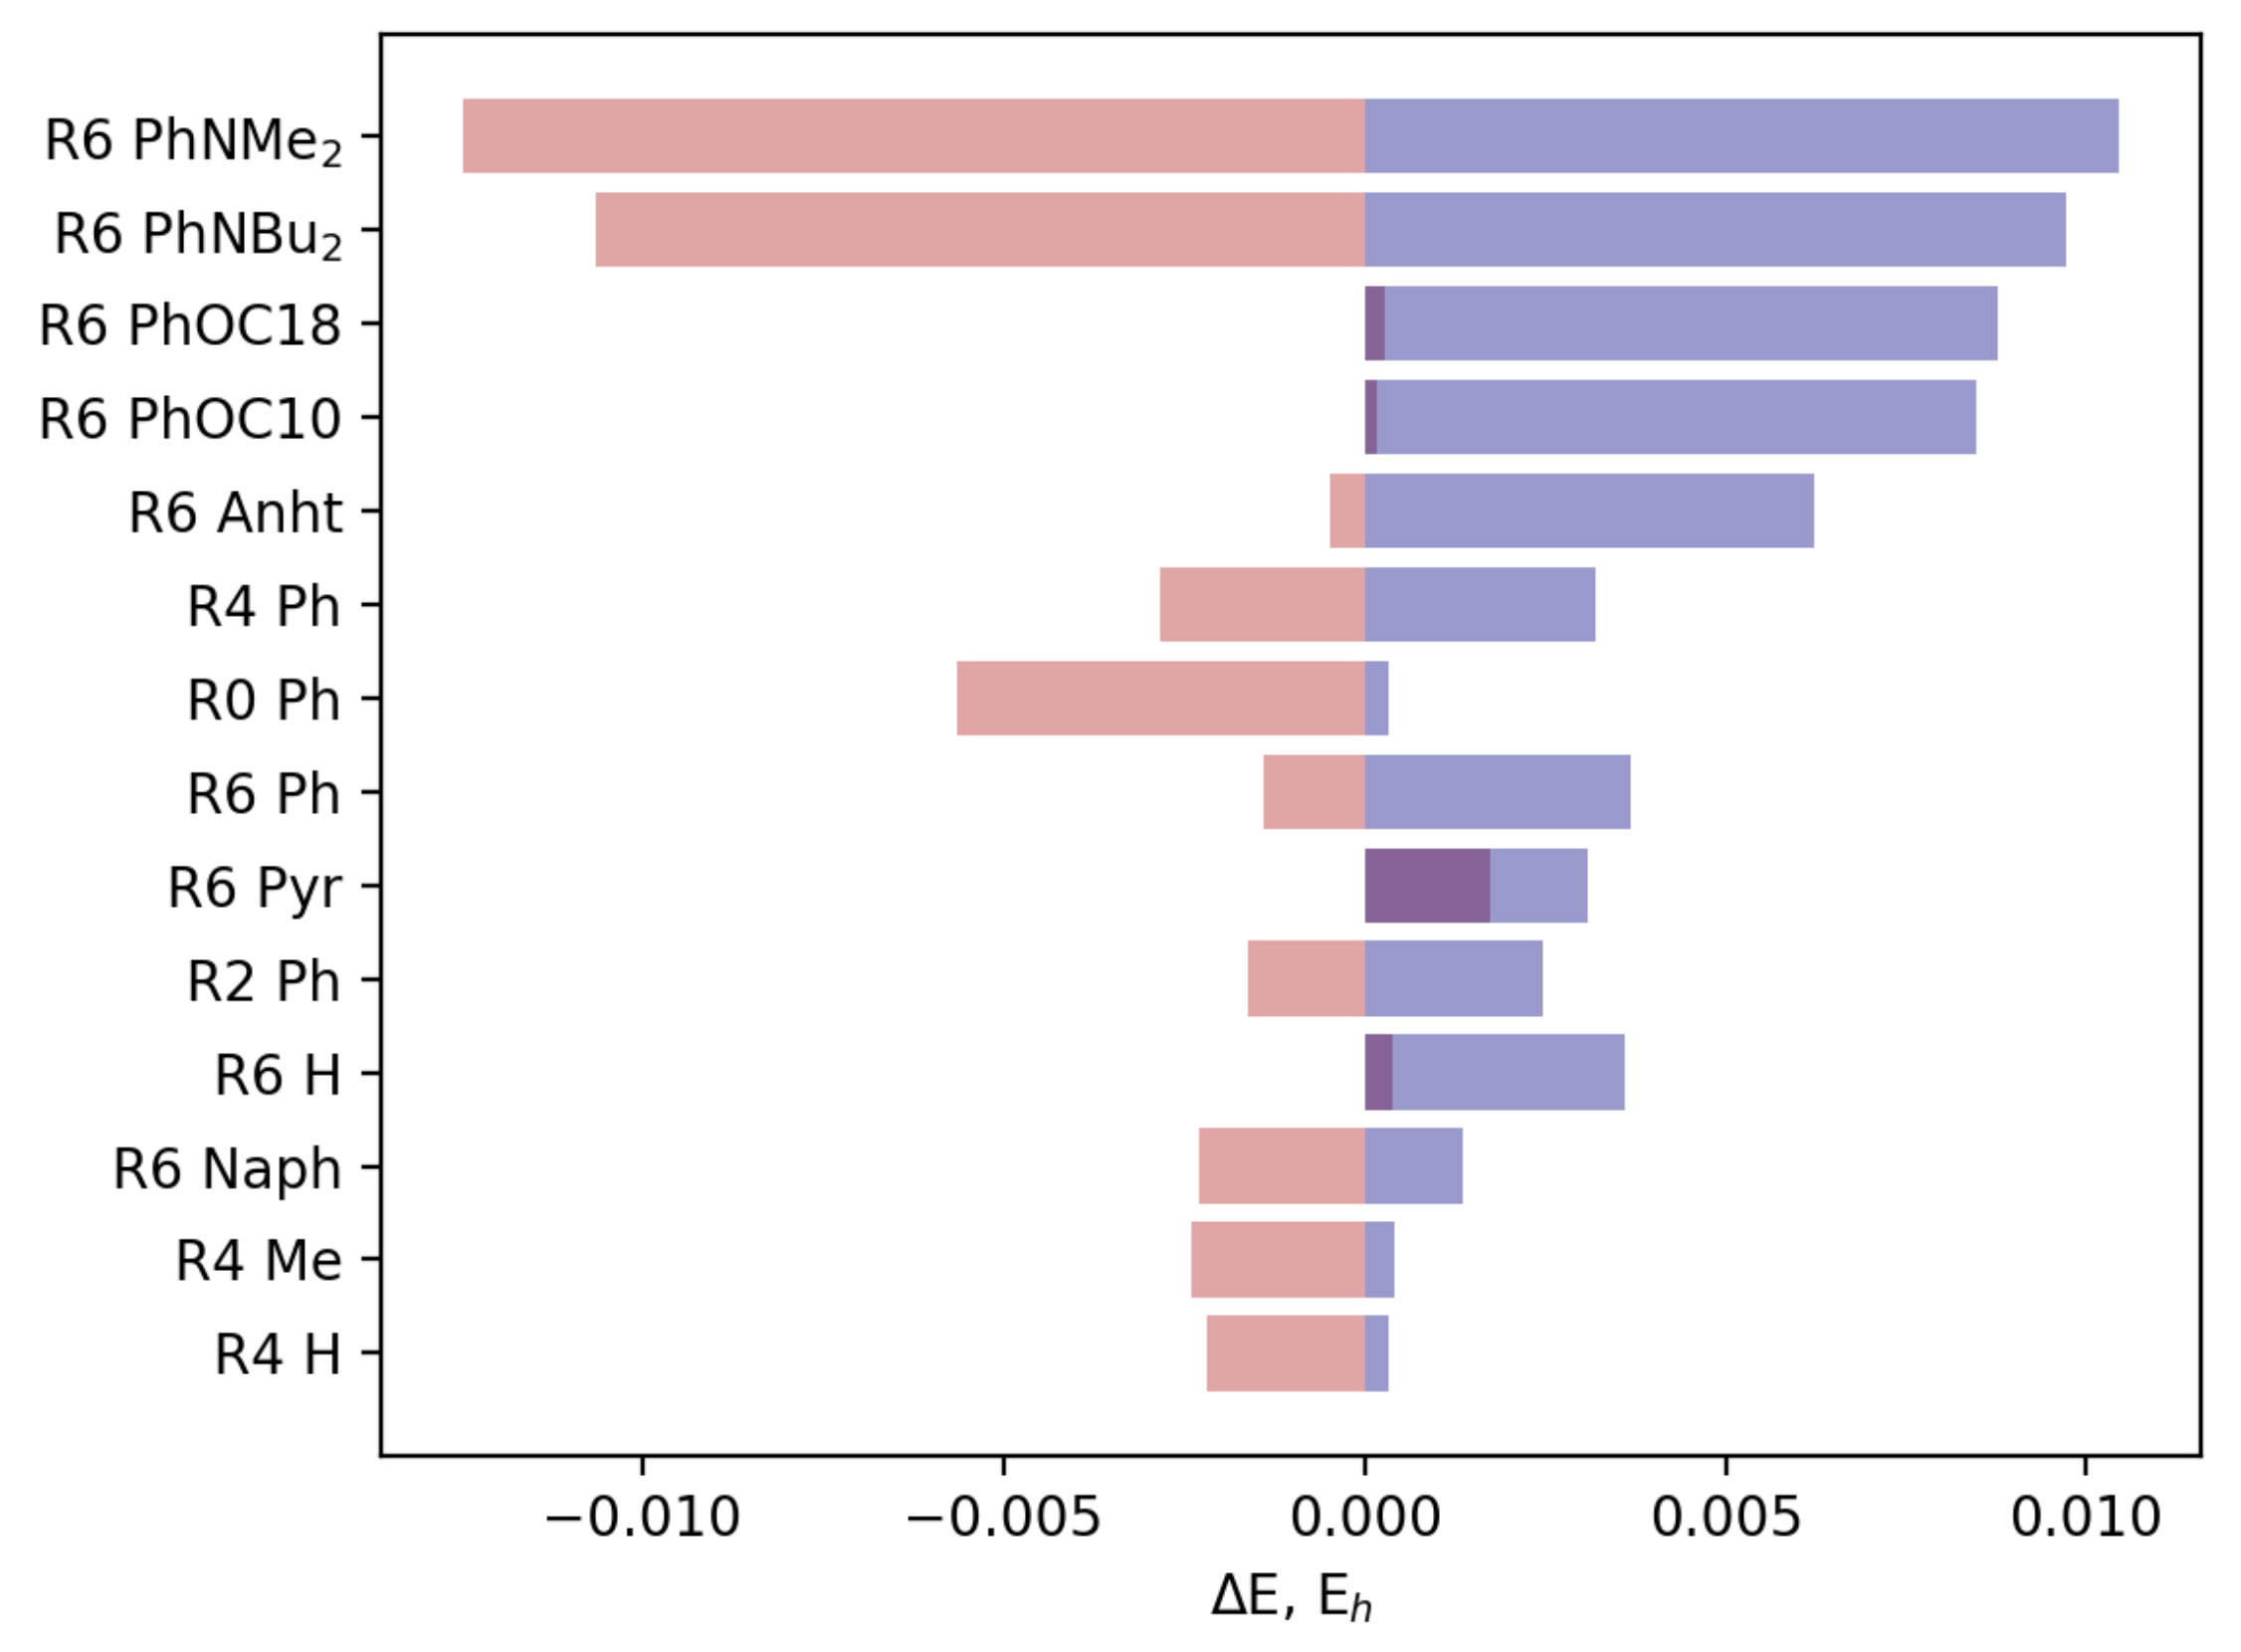
3.2.2. Field Susceptibility
3.3. Photophysical Behavior of the Aggregates
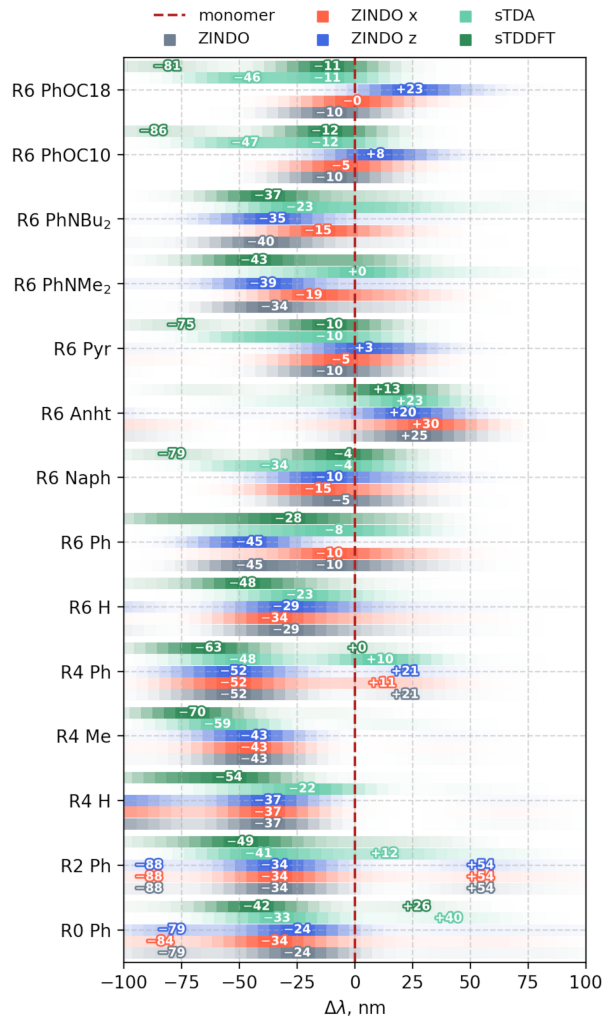
3.3.1. Vertical Excitations
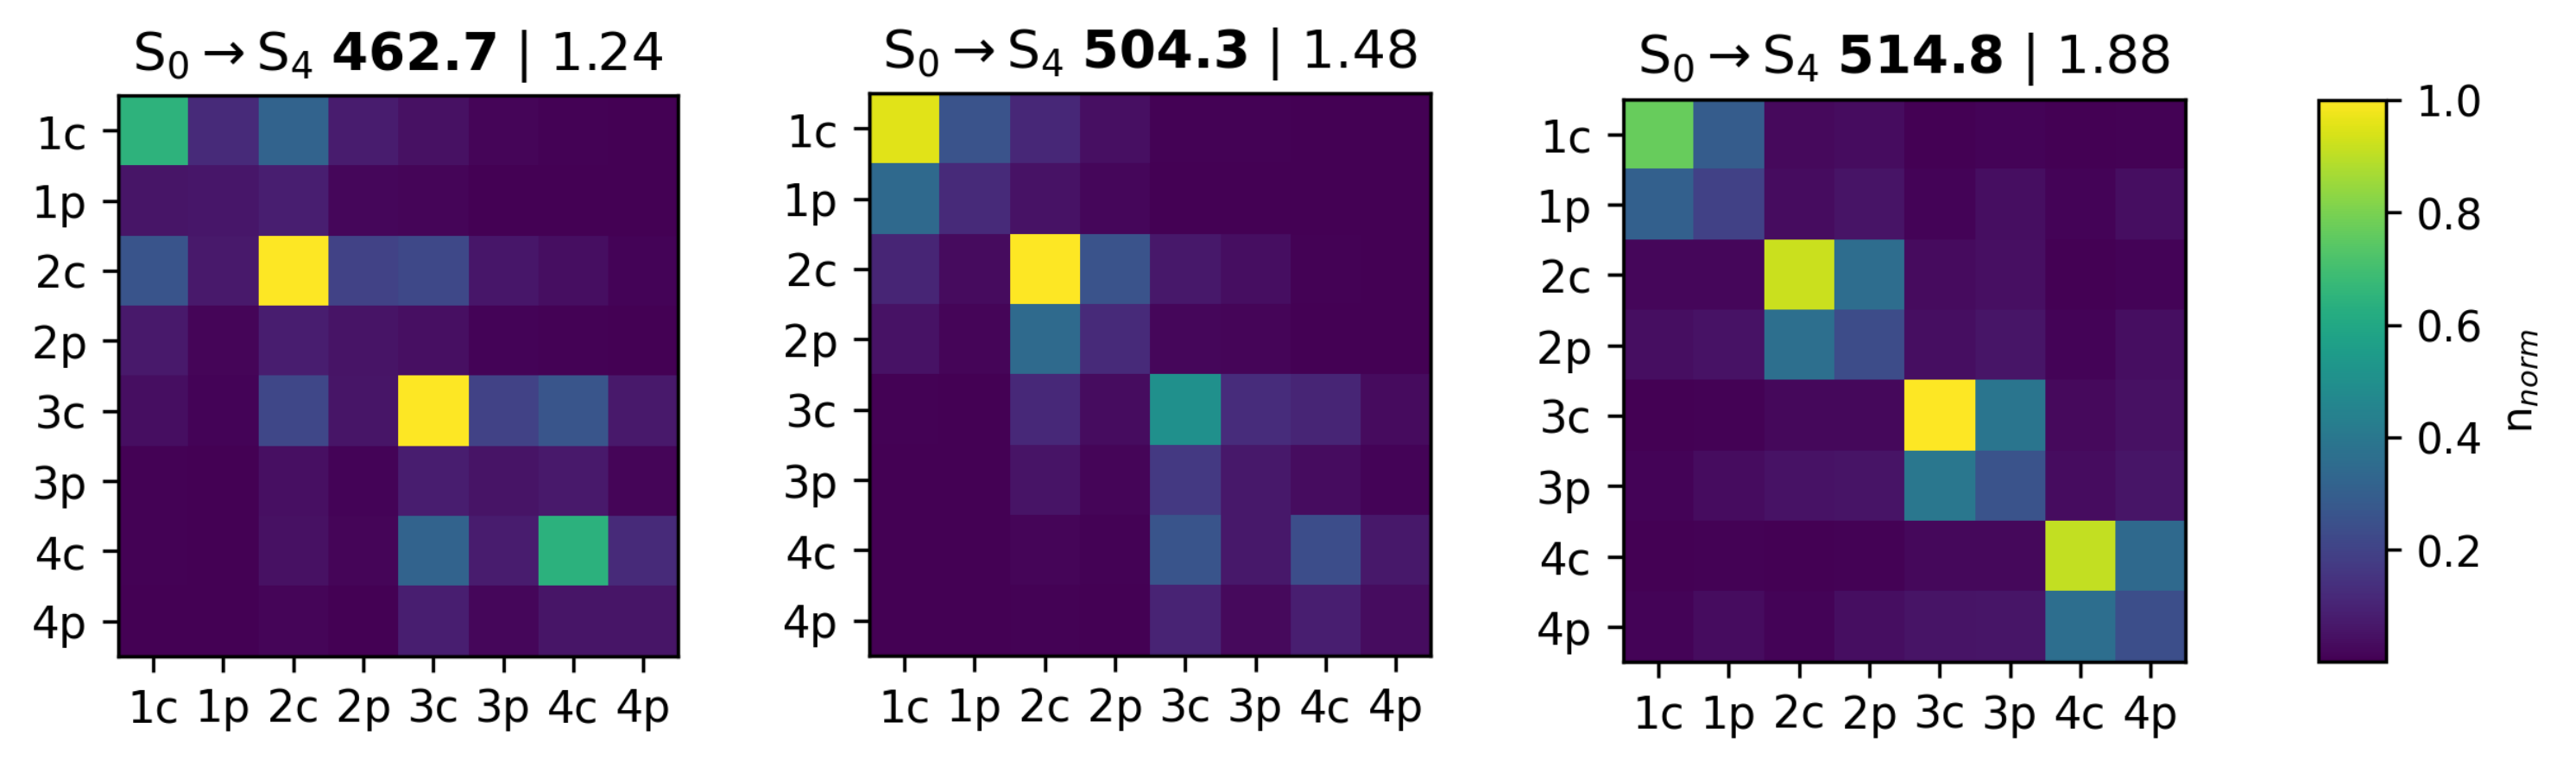
3.3.2. Transition Density Analysis
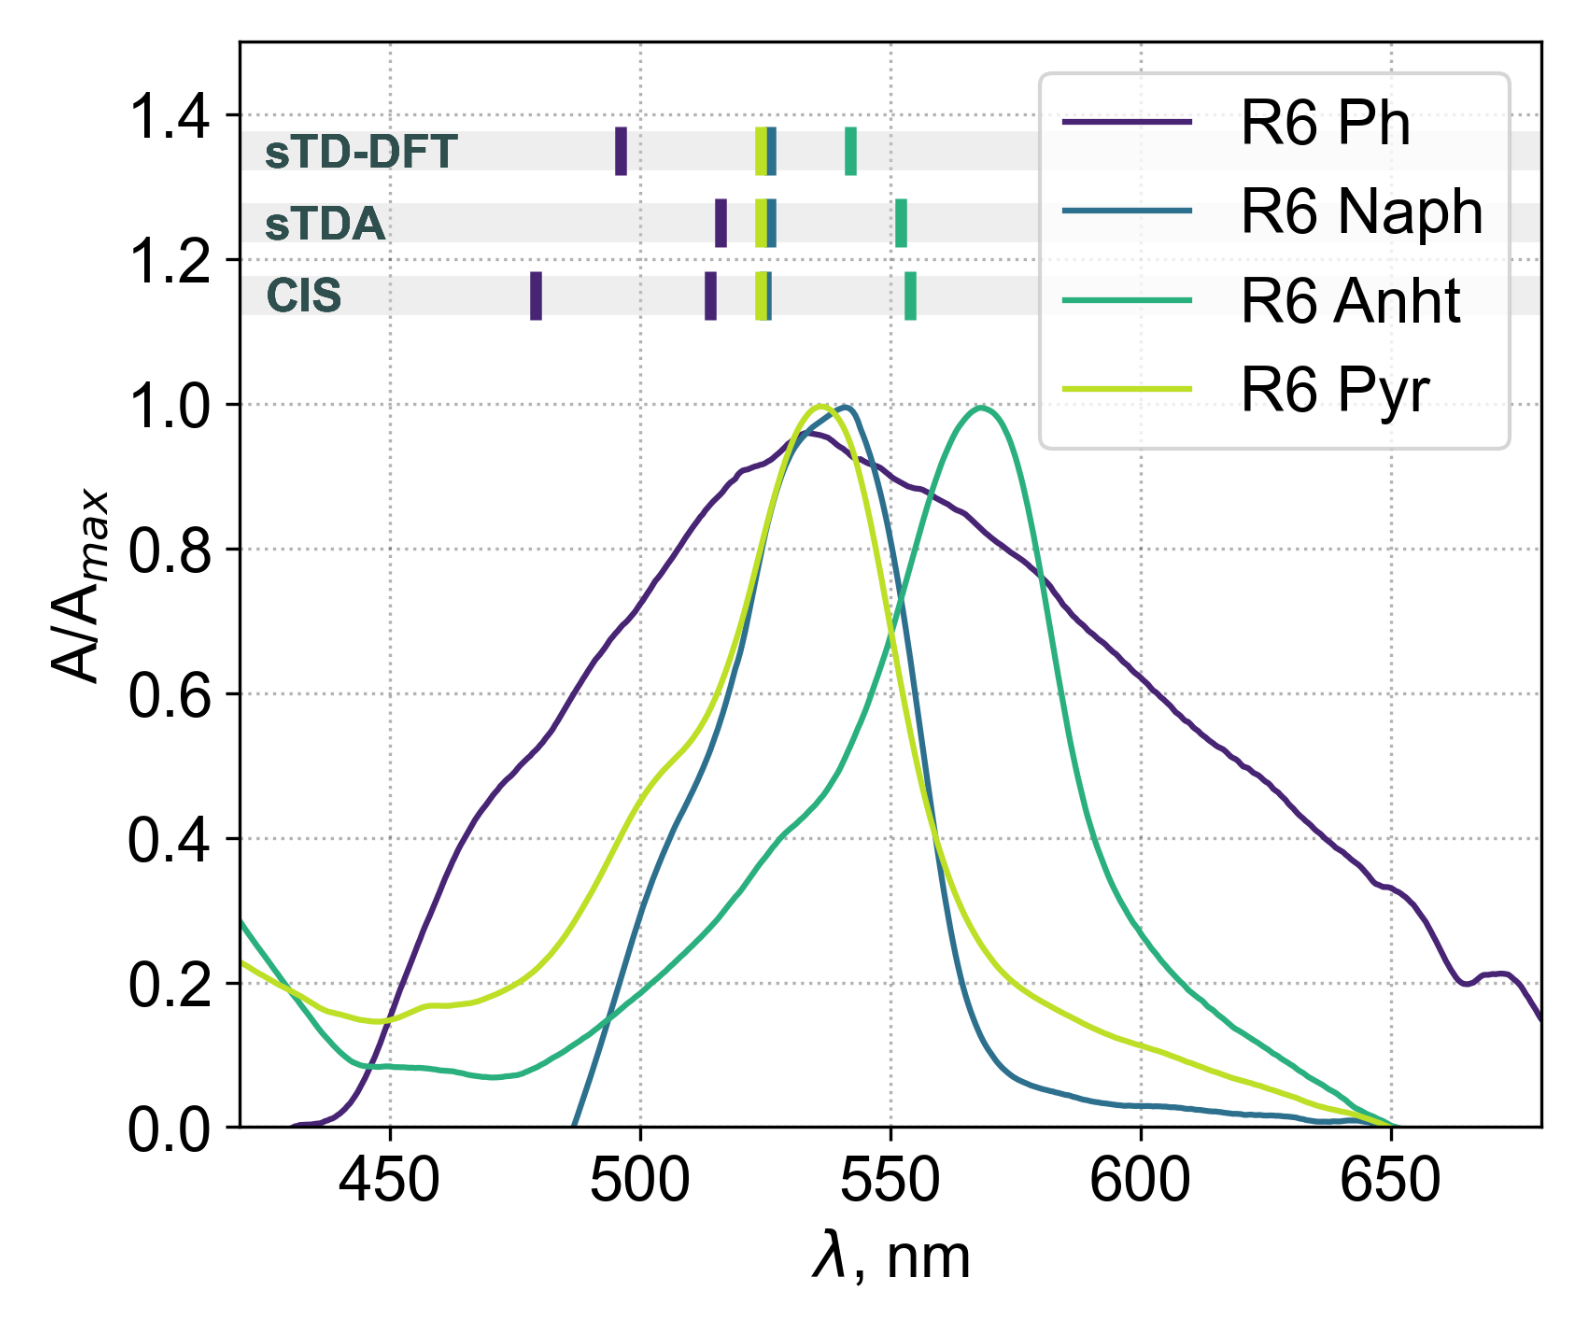
3.4. Experimental Results
4. Conclusions
Supplementary Materials
Author Contributions
Funding
Conflicts of Interest
References
- Sia, R.C.E.; Arellano-Reyes, R.A.; Keyes, T.E.; Guthmuller, J. Radiative lifetime of a BODIPY dye as calculated by TDDFT and EOM-CCSD methods: Solvent and vibronic effects. Phys. Chem. Chem. Phys. 2021, 23, 26324–26335. [Google Scholar] [CrossRef] [PubMed]
- Jiang, G.; Tang, Z.; Han, H.; Ding, J.; Zhou, P. Effects of Intermolecular Hydrogen Bonding and Solvation on Enol–Keto Tautomerism and Photophysics of Azomethine–BODIPY Dyads. J. Phys. Chem. B 2021, 125, 9296–9303. [Google Scholar] [CrossRef] [PubMed]
- Giovannini, T.; Macchiagodena, M.; Ambrosetti, M.; Puglisi, A.; Lafiosca, P.; Gerfo, G.L.; Egidi, F.; Cappelli, C. Simulating vertical excitation energies of solvated dyes: From continuum to polarizable discrete modeling. Int. J. Quantum Chem. 2019, 119, e25684. [Google Scholar] [CrossRef]
- Irfan, A.; Assiri, M.; Al-Sehemi, A.G. Exploring the optoelectronic and charge transfer performance of diaza[5]helicenes at molecular and bulk level. Org. Electron. 2018, 57, 211–220. [Google Scholar] [CrossRef]
- Ortega-Guerrero, A.; Fumanal, M.; Capano, G.; Smit, B. From Isolated Porphyrin Ligands to Periodic Al-PMOF: A Comparative Study of the Optical Properties Using DFT/TDDFT. J. Phys. Chem. C 2020, 124, 21751–21760. [Google Scholar] [CrossRef]
- Nematiaram, T.; Padula, D.; Troisi, A. Bright Frenkel Excitons in Molecular Crystals: A Survey. Chem. Mater. 2021, 33, 3368–3378. [Google Scholar] [CrossRef]
- Sun, C.; Li, B.; Zhao, M.; Wang, S.; Lei, Z.; Lu, L.; Zhang, H.; Feng, L.; Dou, C.; Yin, D.; et al. J-Aggregates of Cyanine Dye for NIR-II in Vivo Dynamic Vascular Imaging beyond 1500 nm. J. Am. Chem. Soc. 2019, 141, 19221–19225. [Google Scholar] [CrossRef]
- Bialas, D.; Kirchner, E.; Röhr, M.I.S.; Würthner, F. Perspectives in Dye Chemistry: A Rational Approach toward Functional Materials by Understanding the Aggregate State. J. Am. Chem. Soc. 2021, 143, 4500–4518. [Google Scholar] [CrossRef]
- Li, M.; Sun, W.; Tian, R.; Cao, J.; Tian, Y.; Gurram, B.; Fan, J.; Peng, X. Smart J-aggregate of cyanine photosensitizer with the ability to target tumor and enhance photodynamic therapy efficacy. Biomaterials 2021, 269, 120532. [Google Scholar] [CrossRef]
- Yu, G.; Wilson, M.R. Molecular simulation studies of self-assembly for a chromonic perylene dye: All-atom studies and new approaches to coarse-graining. J. Mol. Liq. 2022, 345, 118210. [Google Scholar] [CrossRef]
- Haverkort, F.; Stradomska, A.; de Vries, A.H.; Knoester, J. Investigating the Structure of Aggregates of an Amphiphilic Cyanine Dye with Molecular Dynamics Simulations. J. Phys. Chem. B 2013, 117, 5857–5867. [Google Scholar] [CrossRef]
- Tirri, B.; Mazzone, G.; Ottochian, A.; Gomar, J.; Raucci, U.; Adamo, C.; Ciofini, I. A combined Monte Carlo/DFT approach to simulate UV-vis spectra of molecules and aggregates: Merocyanine dyes as a case study. J. Comput. Chem. 2021, 42, 1054–1063. [Google Scholar] [CrossRef] [PubMed]
- Marfin, Y.; Vodyanova, O.; Merkushev, D.; Usoltsev, S.; Kurzin, V.; Rumyantsev, E. Effect of π-Extended Substituents on Photophysical Properties of BODIPY Dyes in Solutions. J. Fluoresc. 2016, 26, 1975–1985. [Google Scholar] [CrossRef] [PubMed]
- Gao, C.; Hossain, M.K.; Wahab, M.A.; Xiong, J.; Qiu, B.M.; Luo, H.; Li, W. Understanding the details of aggregation-induced emission (AIE) effect in D-π-A type imidazolium-based compounds through the stepwise change of rotatable moieties. Dyes Pigment. 2019, 160, 909–914. [Google Scholar] [CrossRef]
- Huang, S.; Ding, J.; Bi, A.; Yu, K.; Zeng, W. Insights into Optical Probes Based on Aggregation-Induced Emission: From Restriction of Intramolecular Motions to Dark State. Adv. Opt. Mater. 2021, 9, 2100832. [Google Scholar] [CrossRef]
- Rybczynski, P.; Kaczmarek-Kedziera, A. BODIPY dimers: Structure, interaction, and absorption spectrum. Struct. Chem. 2021, 32, 953–965. [Google Scholar] [CrossRef]
- Li, F.Z.; Li, X.Y.; Ni, W.; Wu, Z.W.; Lin, C.; Gurzadyan, G.G.; Kuang, G.C. Aggregation, energy transfer and intramolecular charge transfer in donor-acceptor-donor BODIPY derivative lead to single component white light emission. Dyes Pigment. 2021, 195, 109736. [Google Scholar] [CrossRef]
- Egorov, V.V.; Alfimov, M.V. Theory of the J-band: From the Frenkel exciton to charge transfer. Physics-Uspekhi 2007, 50, 985. [Google Scholar] [CrossRef]
- Zhang, Y.; Yuan, S.; Liu, P.; Jing, L.; Pan, H.; Ren, X.K.; Chen, Z. J-aggregation induced emission enhancement of BODIPY dyes via H-bonding directed supramolecular polymerization: The importance of substituents at boron. Org. Chem. Front. 2021, 8, 4078–4085. [Google Scholar] [CrossRef]
- Descalzo, A.B.; Ashokkumar, P.; Shen, Z.; Rurack, K. On the Aggregation Behaviour and Spectroscopic Properties of Alkylated and Annelated Boron-Dipyrromethene (BODIPY) Dyes in Aqueous Solution. ChemPhotoChem 2020, 4, 120–131. [Google Scholar] [CrossRef]
- Kim, S.; Bouffard, J.; Kim, Y. Tailoring the Solid-State Fluorescence Emission of BODIPY Dyes by meso Substitution. Chem.-A Eur. J. 2015, 21, 17459–17465. [Google Scholar] [CrossRef] [PubMed]
- Marfin, Y.S.; Usoltsev, S.D.; Kazak, A.V.; Smirnova, A.I.; Rumyantsev, E.V.; Molchanov, E.E.; Kuznetsov, V.V.; Chumakov, A.S.; Glukhovskoy, E.G. Synthesis and spectral properties of preorganized BODIPYs in solutions and Langmuir-Schaefer films. Appl. Surf. Sci. 2017, 424, 228–238. [Google Scholar] [CrossRef]
- Marfin, Y.S.; Usoltsev, S.D.; Kazak, A.V.; Vodyanova, O.S.; Novikova, N.E.; Verin, I.A.; Rumyantsev, E.V.; Kholodkov, I.V.; Merkushev, D.A. Supramolecular organization and optical properties of BODIPY derivatives in Langmuir–Schaefer films. New J. Chem. 2020, 44, 19046–19053. [Google Scholar] [CrossRef]
- Momeni, M.R.; Brown, A. Why Do TD-DFT Excitation Energies of BODIPY/Aza-BODIPY Families Largely Deviate from Experiment? Answers from Electron Correlated and Multireference Methods. J. Chem. Theory Comput. 2015, 11, 2619–2632. [Google Scholar] [CrossRef]
- Wen, J.; Han, B.; Havlas, Z.; Michl, J. An MS-CASPT2 Calculation of the Excited Electronic States of an Axial Difluoroborondipyrromethene (BODIPY) Dimer. J. Chem. Theory Comput. 2018, 14, 4291–4297. [Google Scholar] [CrossRef]
- Sarkar, R.; Loos, P.F.; Boggio-Pasqua, M.; Jacquemin, D. Assessing the Performances of CASPT2 and NEVPT2 for Vertical Excitation Energies. J. Chem. Theory Comput. 2022, 18, 2418–2436. [Google Scholar] [CrossRef]
- Hill, N.S.; Coote, M.L. A comparison of methods for theoretical photochemistry: Applications, successes and challenges. In Annual Reports in Computational Chemistry; Elsevier: Amsterdam, The Netherlands, 2019; pp. 203–285. [Google Scholar] [CrossRef]
- Pulay, P. A perspective on the CASPT2 method. Int. J. Quantum Chem. 2011, 111, 3273–3279. [Google Scholar] [CrossRef]
- Martynov, A.G.; Mack, J.; May, A.K.; Nyokong, T.; Gorbunova, Y.G.; Tsivadze, A.Y. Methodological Survey of Simplified TD-DFT Methods for Fast and Accurate Interpretation of UV–Vis–NIR Spectra of Phthalocyanines. ACS Omega 2019, 4, 7265–7284. [Google Scholar] [CrossRef]
- Adamo, C.; Jacquemin, D. The calculations of excited-state properties with Time-Dependent Density Functional Theory. Chem. Soc. Rev. 2013, 42, 845–856. [Google Scholar] [CrossRef]
- Hirata, S.; Head-Gordon, M. Time-dependent density functional theory within the Tamm–Dancoff approximation. Chem. Phys. Lett. 1999, 314, 291–299. [Google Scholar] [CrossRef]
- Christensen, A.S.; Kubař, T.; Cui, Q.; Elstner, M. Semiempirical Quantum Mechanical Methods for Noncovalent Interactions for Chemical and Biochemical Applications. Chem. Rev. 2016, 116, 5301–5337. [Google Scholar] [CrossRef] [PubMed]
- Grimme, S.; Bannwarth, C.; Shushkov, P. A Robust and Accurate Tight-Binding Quantum Chemical Method for Structures, Vibrational Frequencies, and Noncovalent Interactions of Large Molecular Systems Parametrized for All spd-Block Elements (Z = 1–86). J. Chem. Theory Comput. 2017, 13, 1989–2009. [Google Scholar] [CrossRef] [PubMed]
- Bannwarth, C.; Ehlert, S.; Grimme, S. GFN2-xTB—An Accurate and Broadly Parametrized Self-Consistent Tight-Binding Quantum Chemical Method with Multipole Electrostatics and Density-Dependent Dispersion Contributions. J. Chem. Theory Comput. 2019, 15, 1652–1671. [Google Scholar] [CrossRef] [PubMed]
- Grimme, S. A simplified Tamm-Dancoff density functional approach for the electronic excitation spectra of very large molecules. J. Chem. Phys. 2013, 138, 244104. [Google Scholar] [CrossRef]
- Bannwarth, C.; Grimme, S. A simplified time-dependent density functional theory approach for electronic ultraviolet and circular dichroism spectra of very large molecules. Comput. Theor. Chem. 2014, 1040–1041, 45–53. [Google Scholar] [CrossRef]
- Anderson, W.P.; Cundari, T.R.; Zerner, M.C. An intermediate neglect of differential overlap model for second-row transition metal species. Int. J. Quantum Chem. 1991, 39, 31–45. [Google Scholar] [CrossRef]
- Kotzian, M.; Rosch, N.; Zerner, M.C. Intermediate neglect of differential overlap spectroscopic studies on lanthanide complexes. Theor. Chim. Acta 1992, 81, 201–222. [Google Scholar] [CrossRef]
- Kirkpatrick, J. An approximate method for calculating transfer integrals based on the ZINDO Hamiltonian. Int. J. Quantum Chem. 2008, 108, 51–56. [Google Scholar] [CrossRef]
- Voityuk, A.A. Intermediate neglect of differential overlap for spectroscopy. Wiley Interdiscip. Rev. Comput. Mol. Sci. 2013, 3, 515–527. [Google Scholar] [CrossRef]
- Bellinger, D.; Pflaum, J.; Brüning, C.; Engel, V.; Engels, B. The electronic character of PTCDA thin films in comparison to other perylene-based organic semi-conductors: Ab initio-, TD-DFT and semi-empirical computations of the opto-electronic properties of large aggregates. Phys. Chem. Chem. Phys. 2017, 19, 2434–2448. [Google Scholar] [CrossRef]
- Avakyan, V.G.; Shapiro, B.I.; Alfimov, M.V. Dimers, tetramers, and octamers of mono- and trimethyne thiacarbocyanine dyes. Structure, formation energy, and absorption band shifts. Dyes Pigment. 2014, 109, 21–33. [Google Scholar] [CrossRef]
- Harris, C.R.; Millman, K.J.; van der Walt, S.J.; Gommers, R.; Virtanen, P.; Cournapeau, D.; Wieser, E.; Taylor, J.; Berg, S.; Smith, N.J.; et al. Array programming with NumPy. Nature 2020, 585, 357–362. [Google Scholar] [CrossRef] [PubMed]
- Virtanen, P.; Gommers, R.; Oliphant, T.E.; Haberland, M.; Reddy, T.; Cournapeau, D.; Burovski, E.; Peterson, P.; Weckesser, W.; Bright, J.; et al. SciPy 1.0: Fundamental algorithms for scientific computing in Python. Nat. Methods 2020, 17, 261–272. [Google Scholar] [CrossRef] [PubMed]
- Hunter, J.D. Matplotlib: A 2D Graphics Environment. Comput. Sci. Eng. 2007, 9, 90–95. [Google Scholar] [CrossRef]
- Schrödinger, LLC. The PyMOL Molecular Graphics System; Version 1.8; Schrödinger, LLC: New York, NY, USA.
- Bannwarth, C.; Caldeweyher, E.; Ehlert, S.; Hansen, A.; Pracht, P.; Seibert, J.; Spicher, S.; Grimme, S. Extended tight-binding quantum chemistry methods. WIREs Comput. Mol. Sci. 2021, 11, e1493. [Google Scholar] [CrossRef]
- Hourahine, B.; Aradi, B.; Blum, V.; Bonafé, F.; Buccheri, A.; Camacho, C.; Cevallos, C.; Deshaye, M.Y.; Dumitrică, T.; Dominguez, A.; et al. DFTB+, a software package for efficient approximate density functional theory based atomistic simulations. J. Chem. Phys. 2020, 152, 124101. [Google Scholar] [CrossRef]
- Neese, F. Software update: The ORCA program system—Version 5.0. WIREs Comput. Mol. Sci. 2022, 12, e1606. [Google Scholar] [CrossRef]
- Lu, T.; Chen, F. Multiwfn: A multifunctional wavefunction analyzer. J. Comput. Chem. 2012, 33, 580–592. [Google Scholar] [CrossRef]
- Lu, T.; Chen, F. Quantitative analysis of molecular surface based on improved Marching Tetrahedra algorithm. J. Mol. Graph. Model. 2012, 38, 314–323. [Google Scholar] [CrossRef]
- McKinnon, J.J.; Mitchell, A.S.; Spackman, M.A. Hirshfeld Surfaces: A New Tool for Visualising and Exploring Molecular Crystals. Chem.-A Eur. J. 1998, 4, 2136–2141. [Google Scholar] [CrossRef]
- Özcan, E.; Dedeoglu, B.; Chumakov, Y.; Zorlu, Y.; Çoşut, B.; Ayhan, M.M. Modulation of supramolecular self-assembly of BODIPY tectons via halogen bonding. CrystEngComm 2021, 23, 6365–6375. [Google Scholar] [CrossRef]
- Quarti, C.; Fazzi, D.; Zoppo, M.D. A computational investigation on singlet and triplet exciton couplings in acene molecular crystals. Phys. Chem. Chem. Phys. 2011, 13, 18615. [Google Scholar] [CrossRef] [PubMed]
- Quarti, C.; Fazzi, D.; Tommasini, M. A density matrix based approach for studying excitons in organic crystals. Chem. Phys. Lett. 2010, 496, 284–290. [Google Scholar] [CrossRef]
- Tretiak, S.; Mukamel, S. Density Matrix Analysis and Simulation of Electronic Excitations in Conjugated and Aggregated Molecules. Chem. Rev. 2002, 102, 3171–3212. [Google Scholar] [CrossRef] [PubMed]
- Curutchet, C.; Mennucci, B. Toward a Molecular Scale Interpretation of Excitation Energy Transfer in Solvated Bichromophoric Systems. J. Am. Chem. Soc. 2005, 127, 16733–16744. [Google Scholar] [CrossRef]
- Casida, M.E.; Wesolowski, T.A. Generalization of the Kohn-Sham equations with constrained electron density formalism and its time-dependent response theory formulation. Int. J. Quantum Chem. 2004, 96, 577–588. [Google Scholar] [CrossRef]


| Molecule | HH | HT | Total | Lowest |
|---|---|---|---|---|
| R0 Ph | 175 | 200 | 375 | HT |
| R2 Ph | 158 | 138 | 296 | HT |
| R4 Ph | 135 | 122 | 257 | HT |
| R4 H | 219 | 215 | 434 | HT |
| R4 Me | 214 | 208 | 422 | HT |
| R6 H | 148 | 127 | 275 | HT |
| R6 Ph | 62 | 46 | 108 | HH |
| R6 Naph | 67 | 14 | 81 | HH |
| R6 Anht | 15 | 2 | 17 | HH |
| R6 Pyr | 39 | 10 | 49 | HH |
| R6 PhNMe | 108 | 81 | 189 | HT |
| R6 PhNBu | 77 | 53 | 130 | HT |
| R6 PhOC10 | 110 | 87 | 197 | HH |
| R6 PhOC18 | 108 | 87 | 195 | HH |
Publisher’s Note: MDPI stays neutral with regard to jurisdictional claims in published maps and institutional affiliations. |
© 2022 by the authors. Licensee MDPI, Basel, Switzerland. This article is an open access article distributed under the terms and conditions of the Creative Commons Attribution (CC BY) license (https://creativecommons.org/licenses/by/4.0/).
Share and Cite
Usoltsev, S.; Shagurin, A.; Marfin, Y. Semi-Empirical Calculation of Bodipy Aggregate Spectroscopic Properties through Direct Sampling of Configurational Ensembles. Int. J. Mol. Sci. 2022, 23, 10955. https://doi.org/10.3390/ijms231810955
Usoltsev S, Shagurin A, Marfin Y. Semi-Empirical Calculation of Bodipy Aggregate Spectroscopic Properties through Direct Sampling of Configurational Ensembles. International Journal of Molecular Sciences. 2022; 23(18):10955. https://doi.org/10.3390/ijms231810955
Chicago/Turabian StyleUsoltsev, Sergey, Artem Shagurin, and Yuriy Marfin. 2022. "Semi-Empirical Calculation of Bodipy Aggregate Spectroscopic Properties through Direct Sampling of Configurational Ensembles" International Journal of Molecular Sciences 23, no. 18: 10955. https://doi.org/10.3390/ijms231810955
APA StyleUsoltsev, S., Shagurin, A., & Marfin, Y. (2022). Semi-Empirical Calculation of Bodipy Aggregate Spectroscopic Properties through Direct Sampling of Configurational Ensembles. International Journal of Molecular Sciences, 23(18), 10955. https://doi.org/10.3390/ijms231810955