Article

Increasing the Grain Yield and Grain Protein Content of Common Wheat (Triticum aestivum) by Introducing Missense Mutations in the Q Gene

1
State Key Laboratory of Crop Gene Exploration and Utilization in Southwest China, Chengdu 611130, China
2
Triticeae Research Institute, Sichuan Agricultural University, Chengdu 611130, China
3
Crop Research Institute, Shandong Academy of Agricultural Sciences, Jinan 250100, China
*
Author to whom correspondence should be addressed.
Int. J. Mol. Sci. 2022, 23(18), 10772; https://doi.org/10.3390/ijms231810772
Submission received: 28 August 2022 / Revised: 11 September 2022 / Accepted: 13 September 2022 / Published: 15 September 2022
(This article belongs to the Special Issue Molecular Genetics and Plant Breeding 2.0)

Abstract

:
Grain yield (GY) and grain protein content (GPC) are important traits for wheat breeding and production; however, they are usually negatively correlated. The Q gene is the most important domestication gene in cultivated wheat because it influences many traits, including GY and GPC. Allelic variations in the Q gene may positively affect both GY and GPC. Accordingly, we characterized two new Q alleles (Qs1 and Qc1-N8) obtained through ethyl methanesulfonate-induced mutagenesis. Compared with the wild-type Q allele, Qs1 contains a missense mutation in the sequence encoding the first AP2 domain, whereas Qc1-N8 has two missense mutations: one in the sequence encoding the second AP2 domain and the other in the microRNA172-binding site. The Qs1 allele did not significantly affect GPC or other processing quality parameters, but it adversely affected GY by decreasing the thousand kernel weight and grain number per spike. In contrast, Qc1-N8 positively affected GPC and GY by increasing the thousand kernel weight and grain number per spike. Thus, we generated novel germplasm relevant for wheat breeding. A specific molecular marker was developed to facilitate the use of the Qc1-N8 allele in breeding. Furthermore, our findings provide useful new information for enhancing cereal crops via non-transgenic approaches.

1. Introduction

Common wheat (Triticum aestivum) is a major food crop that serves as the primary protein source in the human diet. Wheat provides approximately 18% of the calories and 20% of the proteins consumed by humans worldwide [1]. Therefore, grain yield (GY) and grain protein content (GPC) are critical traits to be considered for wheat breeding and production. Because of increased demand driven by population growth and improvements in living conditions, there is an urgent need for wheat varieties with increased GY and GPC.
Nitrogen applications during wheat production are vital for increasing GY and GPC [2,3,4]. In order to produce wheat with a high GY and GPC, farmers tend to apply large amounts of nitrogen fertilizer to wheat fields, which increases cultivation costs and environmental pollution. Breeding to increase the wheat GY and GPC remains a considerable challenge because of the confirmed negative relationship between the two parameters [5,6,7,8].
Wheat flour has unique processing properties that enable it to be used to make diverse end-products. The end-use quality of wheat is significantly influenced by GPC. The unique processing quality of wheat flour depends on the seed storage proteins, especially gliadins and glutenins, which account for 60–80% of the total GPC [9,10]. Gliadins are monomeric compounds that contribute to dough extensibility [11], whereas glutenins, which are polymeric compounds linked by intermolecular disulfide bonds, affect dough elasticity. Glutenins consist of high and low molecular weight glutenin subunits [12,13].
Because the Q gene (TraesCS5A02G473800) influences many important traits, including GY, GPC, grain threshability, grain size, spike morphology, rachis fragility, plant height, and flowering time, it plays a major role in wheat domestication, de-domestication and breeding [14,15,16,17,18]. This gene is located on the long arm of chromosome 5A and encodes a member of the APETALA2 (AP2) transcription factor family [15,19]. The AP2 transcription factors have diverse functions affecting plant development [20]. The Q allele originated from a spontaneous mutation to the microRNA172-binding region of the q allele [15]. Similarly, the introduction of another point mutation in the microRNA172-binding site of the Q allele resulted in the Qc1 allele [17]. The q, Q, and Qc1 transcription levels are correlated with the number of point mutations in the microRNA172-binding site [15,17]. Compared with the effects of the Q allele, Qc1 increases GPC by approximately 60 g kg−1, reflecting the value of Qc1 for wheat breeding. However, Qc1 decreases the longitudinal cell size of rachises, resulting in compact spikes and decreases in GY [17]. Missense mutations in the Q sequence encoding the AP2 domain can lead to decreased spike density [15,21]. These challenges underline the need to identify or generate new Q alleles that positively affect GY and GPC.
In this study, we characterized two new Q alleles, namely Qs1 and Qc1-N8, which have a single missense mutation in the sequences encoding the first and second AP2 domains, respectively. They were obtained via the chemical treatment of common wheat lines carrying the Q and Qc1 alleles, respectively. The effects of Qs1 and Qc1-N8 on the wheat GY and GPC were investigated.

2. Results

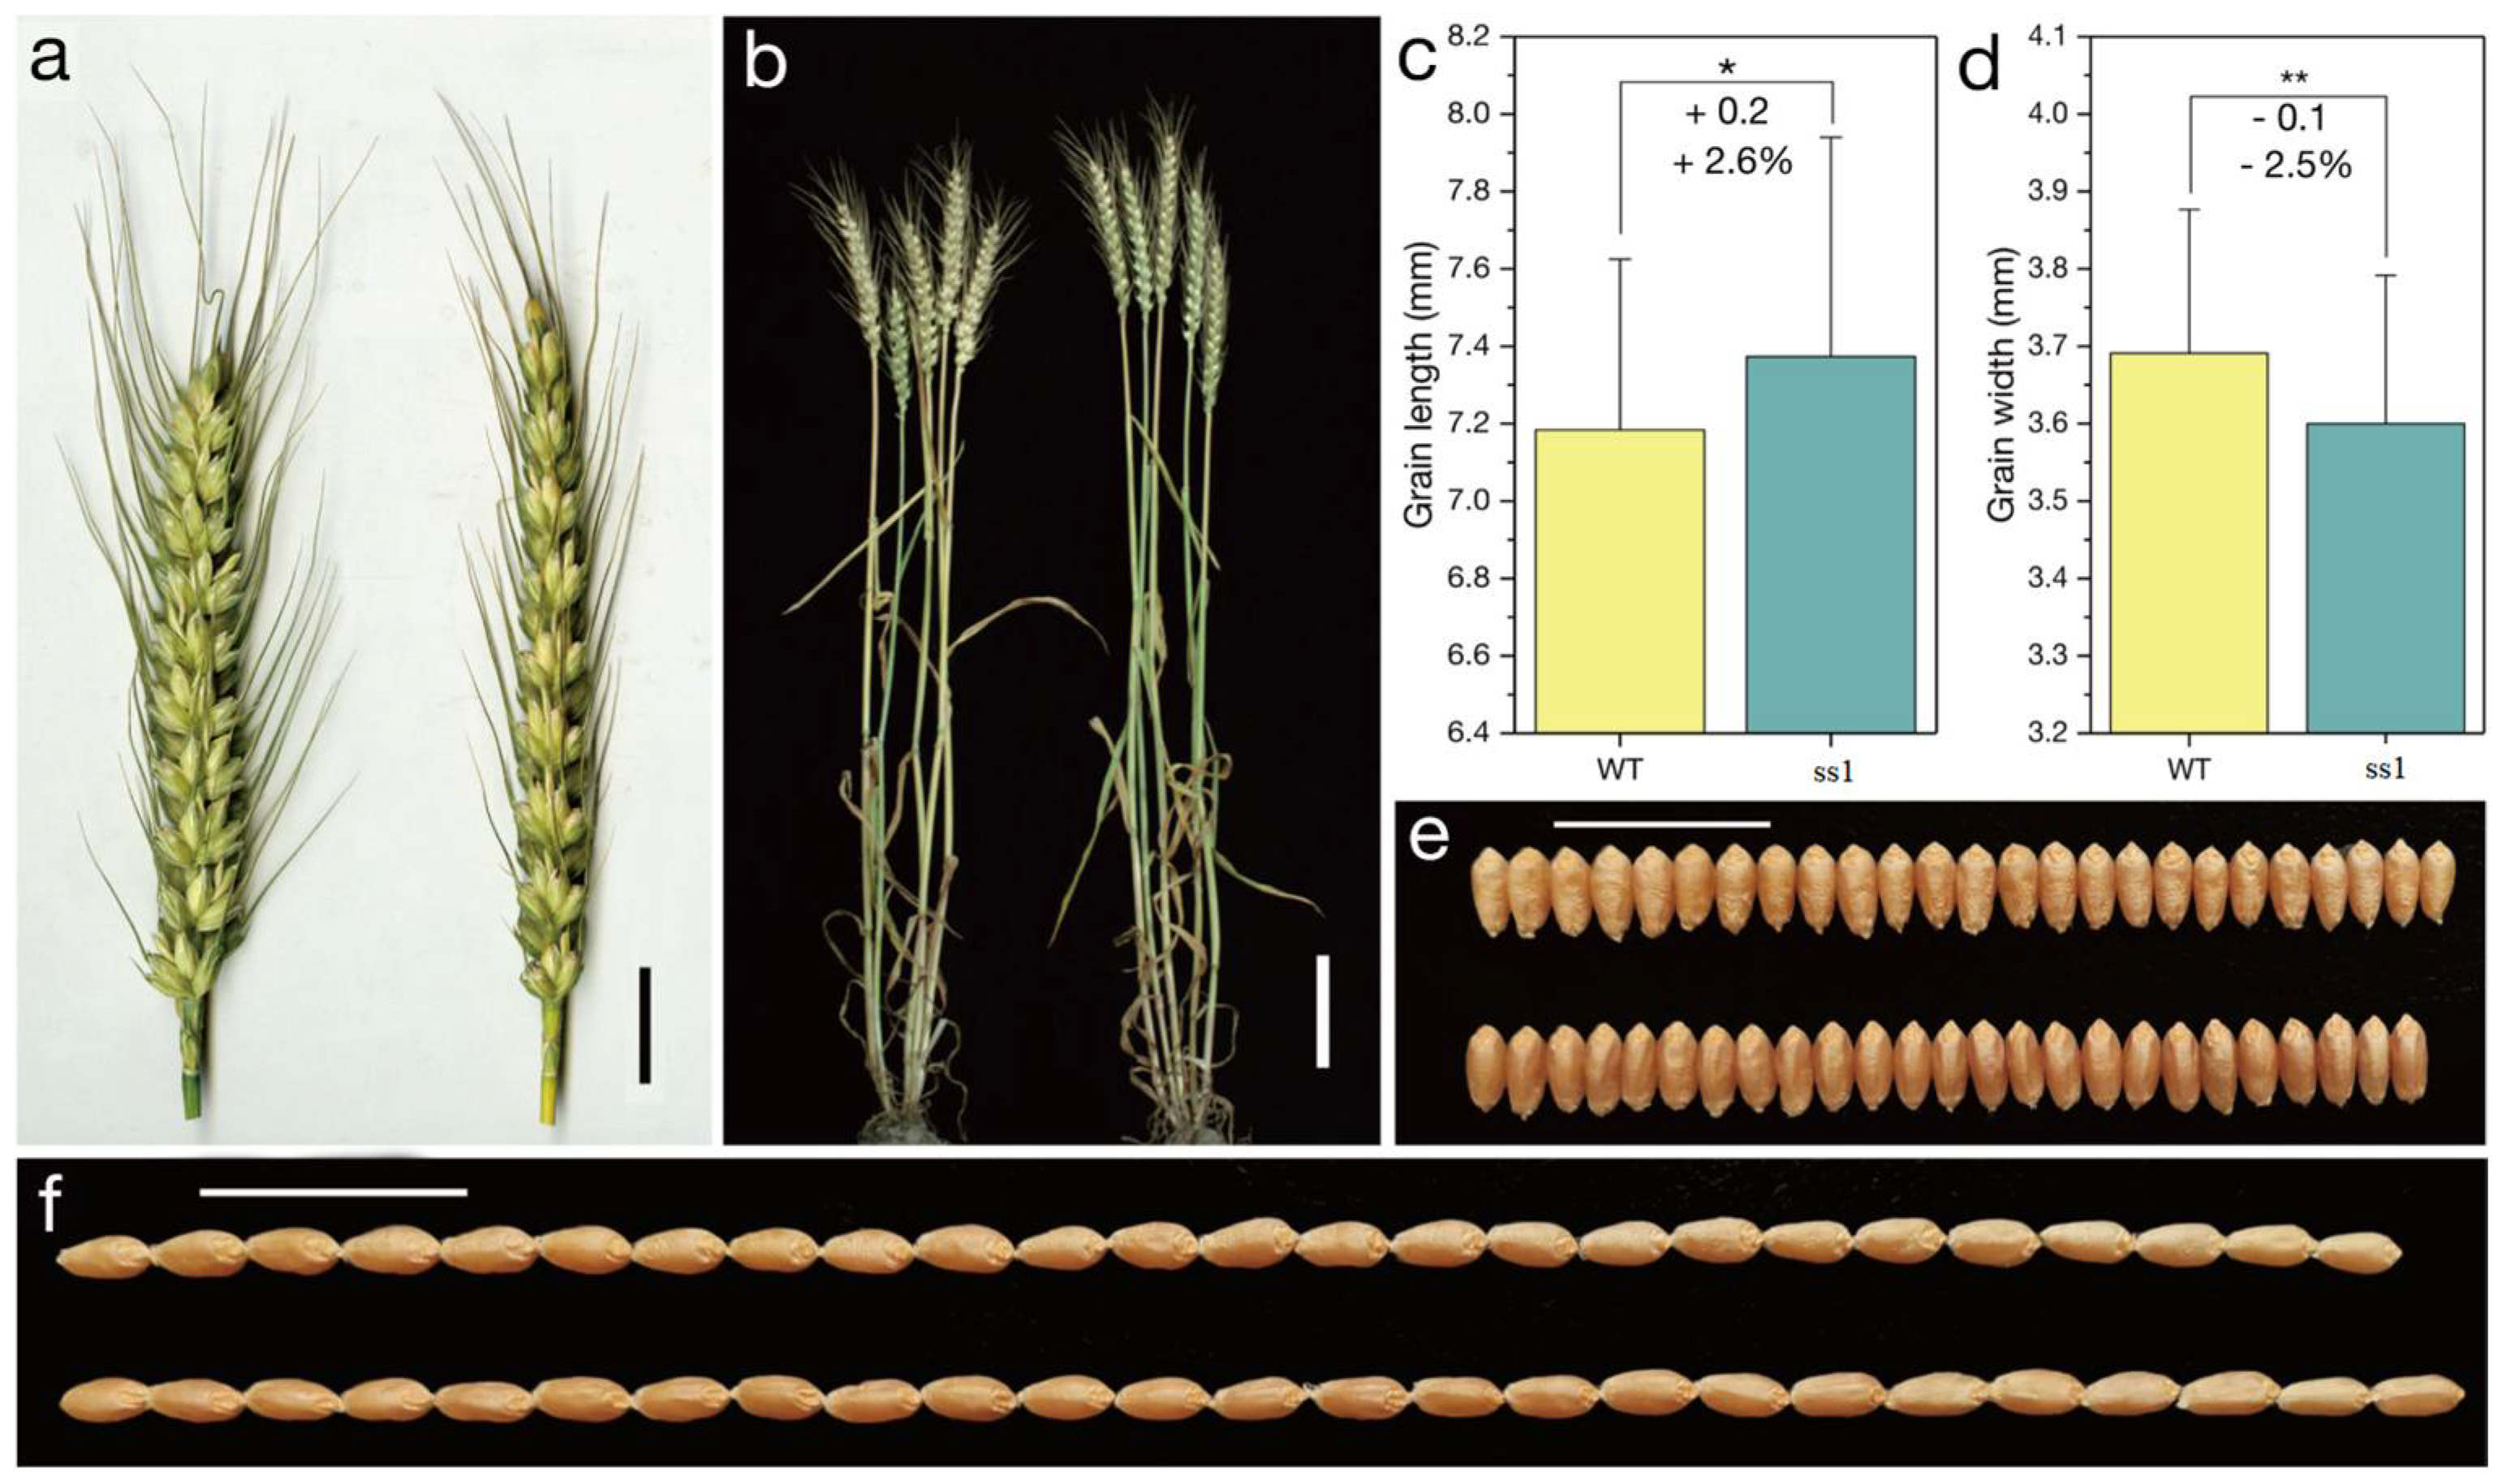
2.1. Phenotype of the Mutant ss1 Carrying the Qs1 Allele

In order to elevate the effect of missense mutations in the sequence encoding the AP2 domain of the Q protein, a mutant carrying the Qs1 allele (ss1; sparse spike 1) was isolated from the M2 population of the common wheat cultivar ‘Shumai482′ (Figure 1). The ss1 plants produced a speltoid-like spike (Figure 2a). In contrast to the Q allele (GenBank No. KX580301.2), Qs1 has a missense mutation (GenBank No. OK041024) in the sequence encoding the first AP2 domain (Figure 3 and Figure S1). Compared with the WT control (Figure 1), ss1 plants were taller (Figure 2b, Table 1) and had a longer main spike (Figure 2a, Table 1) but a lower spike density (Table 1).
Regarding the examined yield-related traits, the spikelet number per the main spike, grain number per the main spike, thousand kernel weight (Table 1), and grain width (Figure 2d,e) were lower for ss1 than for the WT control. In contrast, the grain length (Figure 2c,f) was greater for ss1 than for the WT control. Notably, there was no significant difference in the productive tiller number between the ss1 and WT plants (Table 1). Therefore, GY was significantly lower (p < 0.01) for ss1 (0.46 kg m−2) than for the WT control (0.58 kg m−2) in the 2018–2019 growing season. Under our experimental conditions, the Qs1 allele decreased GY by 20.6% by decreasing the thousand kernel weight and the grain number per spike.
An analysis of the processing quality traits revealed a lack of a significant difference between the ss1 and WT plants in terms of GPC, wet gluten content, gluten index, Zeleny sedimentation value, water absorption, development time, stability time, and loaf volume (Table 2; Figure 4).

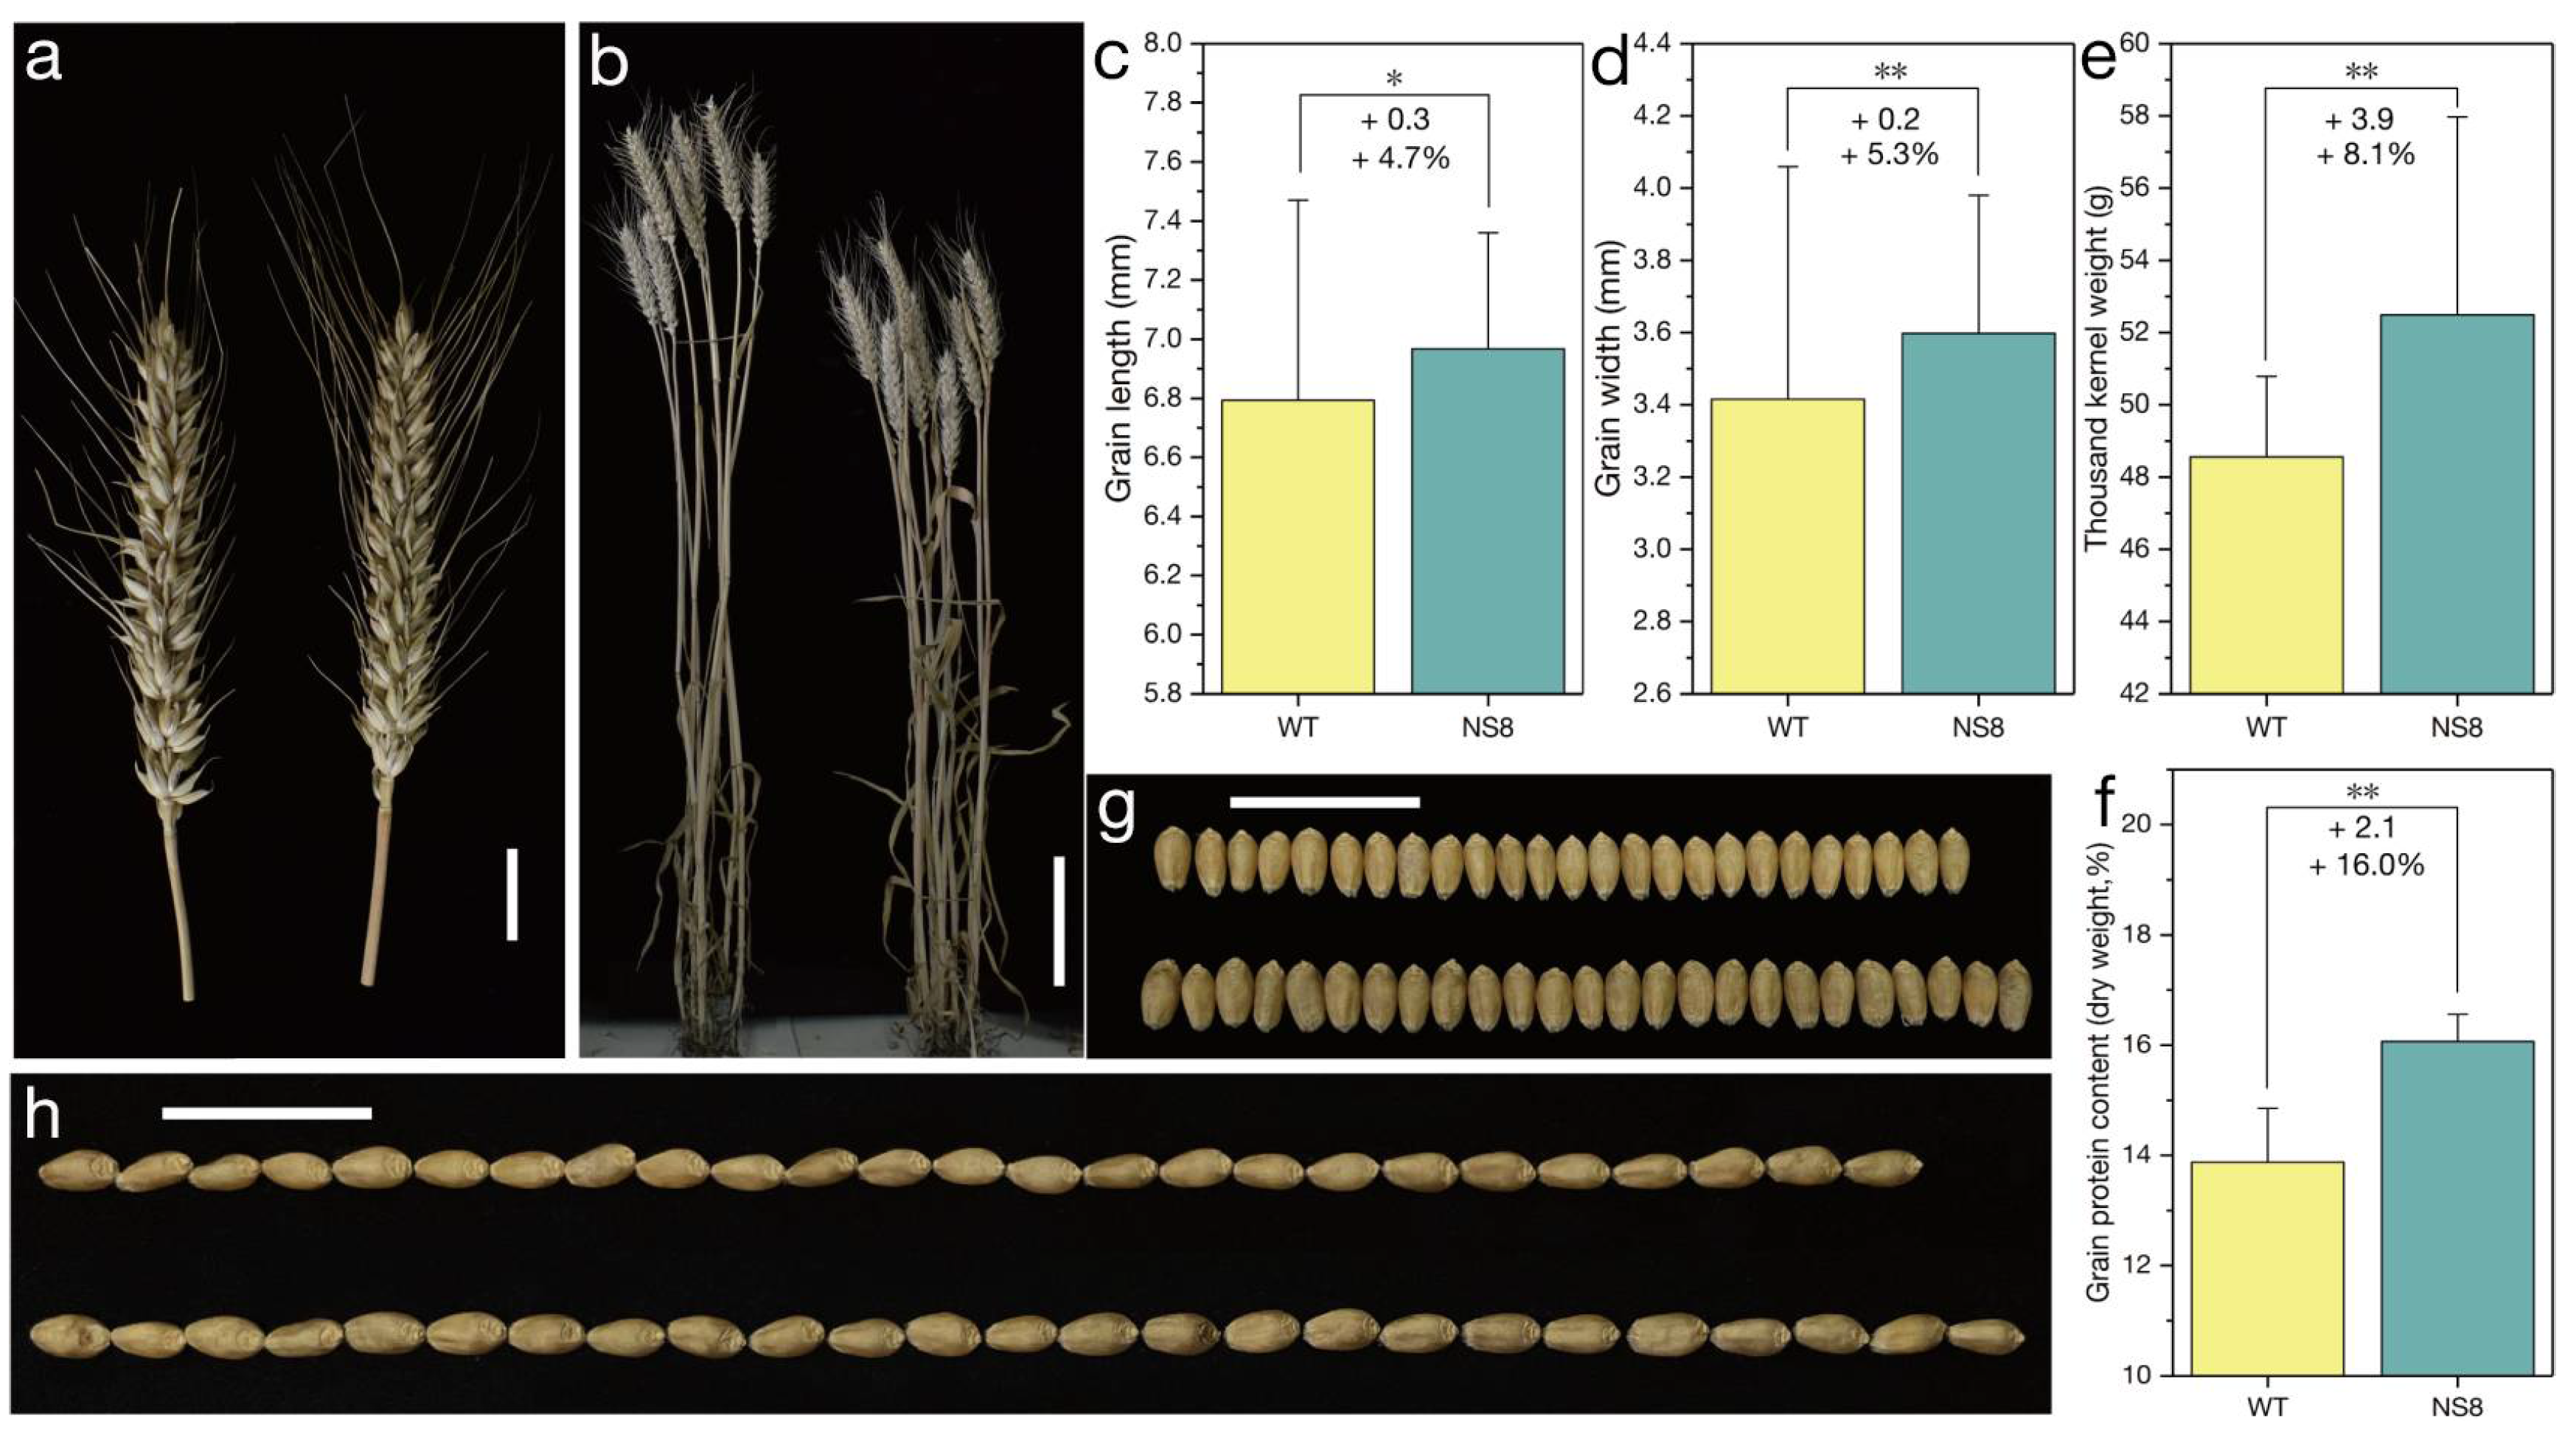
2.2. Characterization of the Mutant NS8 Carrying the Qc1-N8 Allele

Because a missense mutation in the sequence encoding the AP2 domain can decrease the spike density without altering processing quality parameters, the normal-spike mutant NS8 containing the Qc1-N8 allele was isolated from the M2 population of the mutant S-Cp1-1. The NS8 plants had a normal spike, which was similar to the ‘Shumai482′ spike (Figure 5a and Figure S2a). Compared with the Q allele sequence, Qc1-N8 contains two missense mutations (GenBank No. OK041023), with one in the sequence encoding the second AP2 domain and the other in the microRNA172-binding region (Figure 3 and Figure S1). When compared with the WT control (plants with only the Q allele; Figure 1), the mutant NS8 plants were shorter (Figure 5b, Figure 6b, and Figure S2b,j) but had a similar spike length (Figure 5a, Figure 6d, and Figure S2a,l) and spike density (Figure 6f and Figure S2n).
Of the yield-related traits, the grain number per spike (Figure 6a and Figure S2i), thousand kernel weight (Figure 5e and Figure S2e), grain width (Figure 5d,g and Figure S2d,g), and grain length (Figure 5c,h and Figure S2c,h), were greater for the mutant NS8 than for the WT control. However, there were no significant differences in the spikelet number per the main spike (Figure 6e and Figure S2m) and productive tiller number (Figure 6c and Figure S2k) between the NS8 and WT plants. As expected, the Qc1-N8 allele positively affected GPC (Figure 5f and Figure S2f) and GY by increasing the thousand kernel weight and grain number per spike.
In order to facilitate the use of the Qc1-N8 allele in breeding, the missense mutation in the sequence encoding the second AP2 domain was converted to a CAPS marker (Figure 7). The CAPS primer pair (N8-CAPS-F1 + N8-CAPS-R1; Table 3) amplified a 300 bp fragment from the genomic DNA of NS8 and WT. The 300 bp fragment of WT could be digested into 210 bp and 90 bp bands. In contrast, the amplicons of NS8 remained undigested.

3. Discussion

Because GY and GPC determine the profitability of wheat production, they are the primary traits upon which wheat breeders and growers focus. More specifically, GY is critical for ensuring food security, especially in many developing countries, while GPC is a crucial index for assessing the nutritional and unique processing quality of wheat [22]. Increasing both GY and GPC is important to improving the availability of high-quality food and, by extension, the living standards of humans. As an essential macronutrient for plants, nitrogen is crucial for establishing a balance between GY and GPC during wheat production [3,4,23]. Accordingly, the most frequent cultivation practice used by farmers to increase GY and GPC is the application of nitrogen fertilizers [4,24], but this leads to increased cultivation costs, decreased nitrogen use efficiency, and increased environmental pollution. Moreover, after incremental additions of nitrogen fertilizer, GPC reaches a maximum and then remains constant [24]. In this study, we created a new Q allele (i.e., Qc1-N8), which breaks the negative relationship between GY and GPC and can synchronously increase the wheat GY and GPC. Thus, Qc1-N8 may be useful for breeding more profitable wheat varieties.
‘Shumai482′ is an elite commercial wheat cultivar with a relatively high GY and GPC. The Qc1-N8 allele in the ‘Shumai482′ genetic background can increase both GY and GPC. Notably, Qc1-N8 decreased the plant height (Figure 5b, Figure 6b and Figure S2b,j), thereby enhancing lodging resistance. Lodging is still a major factor limiting global wheat production, especially in regions with heavy rain and strong winds, because it leads to serious decreases in GY. We are currently assessing the breeding value of Qc1-N8 in multiple environments, in diverse genetic backgrounds, and in field plot experiments.
As important parts of the Q protein, the AP2 domains are critical for DNA binding and for physical interaction with other proteins. Modifying the amino acids in the AP2 domains of the Q protein may reverse the unfavorable agronomic traits of the mutant S-Cp1-1 carrying the Qc1 allele [17] by affecting the expression of downstream genes and the interaction between Q and other proteins. For example, the transcription factor TaLAX1 physically interacts with Q to antagonistically regulate grain threshability and spike morphology [25]. However, most downstream genes of Q for regulating agronomic traits remain unknown. The mutation in the Qs1 allele results in a single amino acid change in the first AP2 domain (Figure 3 and Figure S1), which negatively affects the thousand kernel weight (Table 1). The overexpressed Qc1 allele has a missense mutation in the mircoRNA172-binding site (Figure 3 and Figure S1) that increases the thousand kernel weight [17]. It is likely that at least some missense mutations in the sequences encoding the AP2 domains and those in the microRNA172-binding site have the opposite effect on the thousand kernel weight. The Qc1-N8 allele has two missense mutations, with one in the sequence encoding the AP2 domain and the other in the microRNA172-binding site (Figure 3 and Figure S1); this allele is associated with an increase in the thousand kernel weight (Figure 5e and Figure S2e). Therefore, the opposite effects of the two-point mutations in the Qc1-N8 allele are relatively well balanced to increase the thousand kernel weight. However, further increases in GY require the creation of new alleles with mutation(s) beyond the AP2 domain-encoding sequences; four previously reported Qc alleles (i.e., Qc1Qc4) [17] might be useful for generating new alleles.
Common wheat is a hexaploid species (AABBDD; 2n = 6x = 42) that contains three homologous genomes (i.e., A, B, and D). An earlier study revealed the dosage effect of the Q gene in wheat [26]. To date, only the Q gene copy in the A genome has been optimized. To further improve GY and GPC, the stepwise optimization of the Q copies in the B and D genomes of common wheat and related species is ongoing.
Durum wheat (Triticum turgidum ssp. durum) is a tetraploid species (AABB; 2n = 4x = 28) and is the main and preferred raw material for pasta production [27]. The GPC is a determining factor influencing durum wheat quality, and grains with a high GPC tend to produce good cooking quality pasta [27,28,29]. The Qc1-N8 allele, which is located in the A genome, may be useful for durum wheat breeding.
In addition to the Q gene, many other plant genes include microRNA-binding sites, including some genes encoding a conserved AP2 domain. The directed evolution of these genes via the introduction of point mutations in their microRNA-binding sites and other domain-encoding sequences may be an efficient and effective way to ensure global food security.
Increases in GY and GPC are also required for other major cereal crops, such as rice, maize, barley, sorghum, and foxtail millet, all of which carry Q gene orthologs and homologs [20,30,31,32,33,34]. Moreover, these orthologous and homologous genes seem to have conserved functions among cereals [31,33,34]. Similar to the allele development in this study (i.e., Q allele to Qc1 and then to Qc1-N8), elite alleles for the Q gene orthologs and homologs can be created by the stepwise optimization of their expression (e.g., by introducing point mutations in the mircoRNA172-binding site or in other elements) and by enhancement of the activities of the encoded proteins (e.g., by introducing point mutations in the sequences encoding the AP2 domains or other domains), affecting specific downstream gene(s) and interacting protein(s). As they are applied in breeding programs involving non-transgenic methods, these attributes illustrate the utility of creating a set of elite alleles of the Q gene orthologs and homologs to increase the GY and GPC of cereal crops.

4. Materials and Methods

4.1. Plant Materials and Growth Conditions
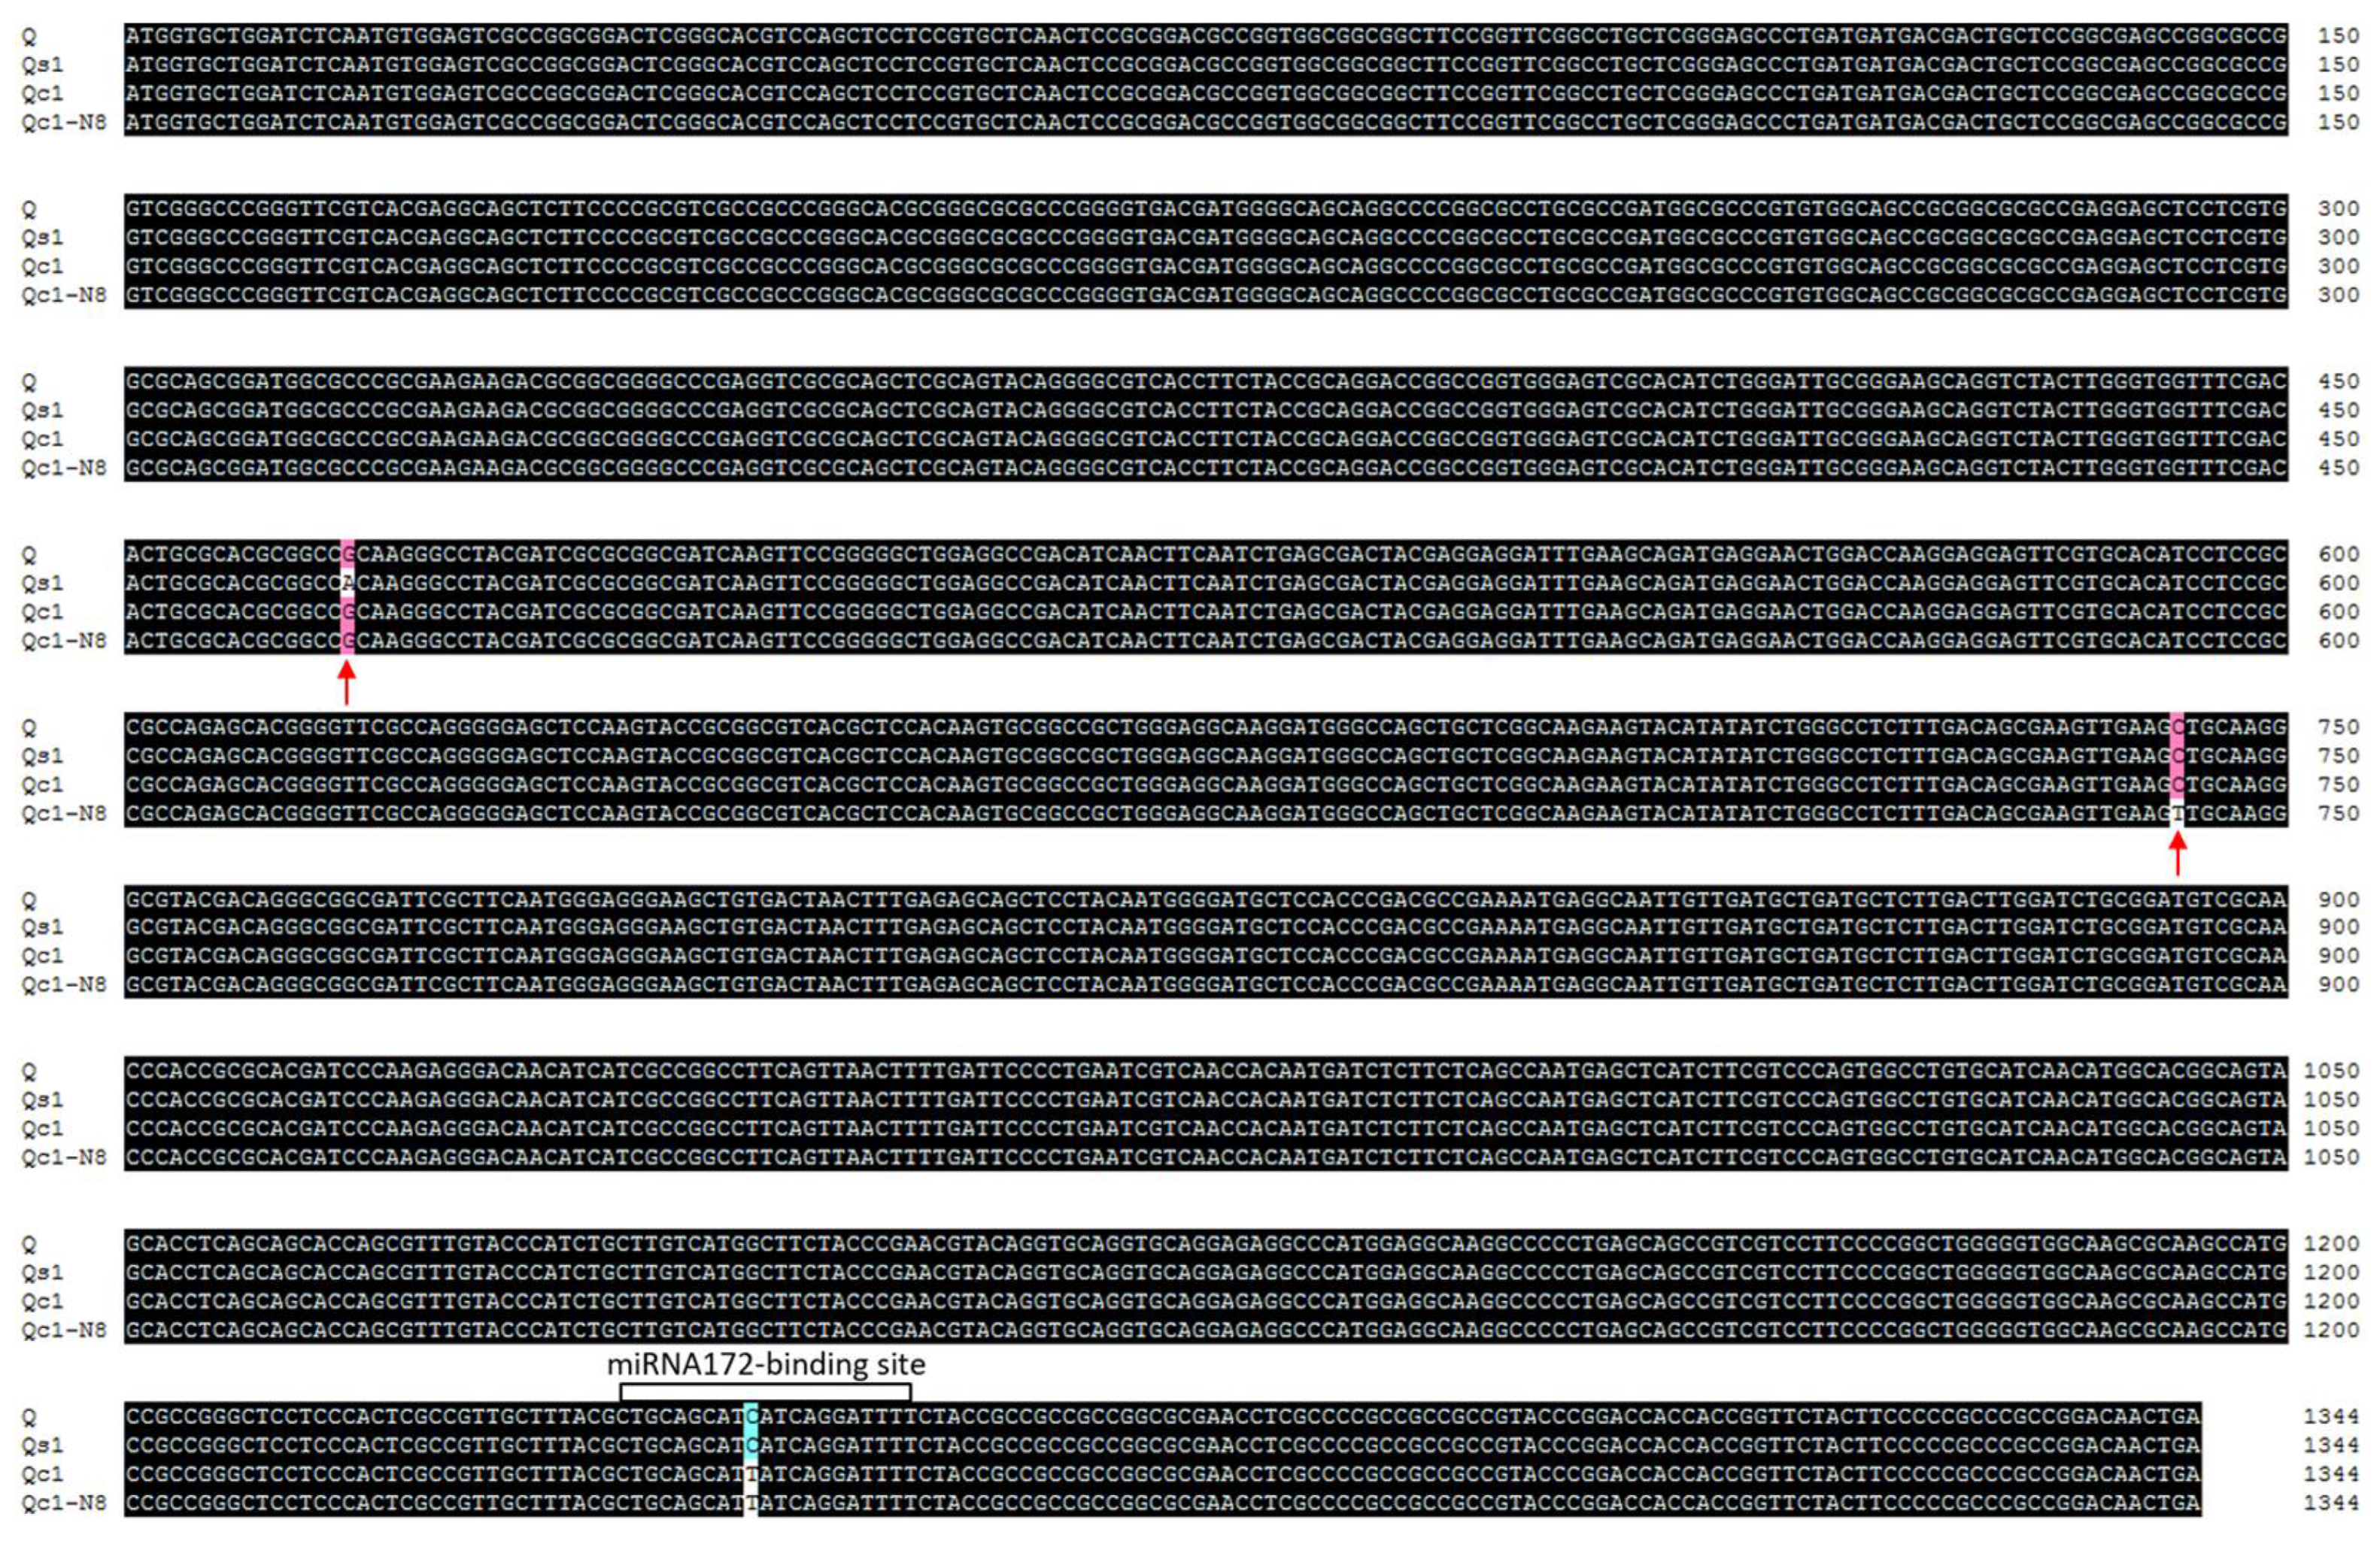
The seeds of common wheat cultivar ‘Shumai482′ (Q allele) and its compact-spike mutant S-Cp1-1 (Qc1 allele) [17] were treated with 0.8% and 0.4% ethyl methanesulfonate (Catalog number: M0880-100G; Sigma-Aldrich, St Louis, MO, USA), respectively. Seeds from the leading spikes of the M1 plants were harvested and sown to generate the M2 population. The mutant ss1 (sparse spike 1) was obtained from the M2 population of ‘Shumai482′. The mutant NS8 (normal spike 8) was isolated from the M2 population of S-Cp1-1. The Q genes of ss1 (Qs1 allele) and NS8 (Qc1-N8 allele) were sequenced.
The mutants were backcrossed with ‘Shumai482′ to assess the effects of Qs1 and Qc1-N8 on agronomic traits and processing quality parameters. Ten BC2F3 homozygous lines (five with the Q allele and five with the Qs1 allele) and 10 BC2F4 homozygous lines (five with the Q allele and five with the Qs1 allele) (Figure 1) were grown at the experimental farm of Sichuan Agricultural University in Wenjiang (30°43′16″ N, 103°52′15″ E) during the 2018–2019 and 2019–2020 wheat growing seasons, respectively. Field trials were performed using a randomized block design. Each line was cultivated in a 2 m × 3 m area, with a row spacing of 20 cm × 5 cm. The BC1F2 and BC2F2 plants carrying Q or Qc1-N8 (Figure 1) were grown with a row spacing of 20 cm × 10 cm in Wenjiang during the 2020–2021 and 2021–2022 growing seasons, respectively. A nitrogen:phosphorous:potassium (15:15:15) compound fertilizer was applied before sowing (450 kg per hectare).
At the GS87 growth stage [35], agronomic traits, including plant height (cm), spike length (cm), spikelet number per spike, grain number per spike, and productive tiller number, were recorded. Spike density was calculated as the ratio of the spike length to the spikelet number per spike. For the BC2F3 and BC2F4 homozygous lines with the Q or Qs1 allele, 20 representative plants of each line were examined. For the homozygous BC1F2 and BC2F2 plants carrying the Q or Qc1-N8 allele, the agronomic traits of 20–30 plants were also evaluated.
After harvesting samples and drying them under the sun at approximately 35 °C to a constant weight, the thousand kernel weight (g), grain length (mm), and grain width (mm) were determined. For each BC2F3 and BC2F4 homozygous line with the Q or Qs1 allele, the thousand kernel weight was measured by randomly selecting 1000 seeds. For the BC1F2 and BC2F2 plants carrying the Q or Qc1-N8 allele, the thousand kernel weight was measured on the basis of 200 randomly selected mature seeds. In order to measure the grain length and width, 100 randomly selected seeds were scanned using the Epson Eu-88 A3 Transparency Unit (Seiko Epson, Nagano, Japan). The resulting images were analyzed using the WinSEEDLE Analysis System (Regent Instruments, QC, Canada).

4.2. Gene Cloning

Young leaves collected from individual plants at the GS13 growth stage [35] were ground to a fine powder in liquid nitrogen. Genomic DNA and total RNA were extracted from the ground materials using Plant DNA/RNA extraction kits, respectively (Catalog numbers: DN32-100 and RN33050; Biofit, Chengdu, China). First-strand cDNA was synthesized using the Prime Script™ 1st Strand cDNA Synthesis Kit (Catalog number: 6110A; Takara, Dalian, China). All kits were used as recommended by the manufacturers.
The Q cDNA and genomic DNA sequences of the mutants ss1 and NS8 were cloned and sequenced. The PCR amplifications were completed in a 50 µL volume consisting of genomic DNA or cDNA, 200 µM dNTPs, 10 µM each primer, 1 U Phanta Max Super-Fidelity DNA Polymerase (Catalog number: P505-d1/d2/d3; Vazyme, Nanjing, China), and 25 µL 2× supplied buffer (with Mg2+). The PCR was performed using the Mastercycler Pro thermal cycler (Eppendorf, Hamburg, Germany) with the following program: 95 °C for 5 min; 35 cycles of 95 °C for 45 s, 60–68 °C for 30 s, and 72 °C for 2 min; 10 min at 72 °C. The PCR products were separated on a 1.5% agarose gel (Catalog number: 5260; Takara). The target fragments were purified using the FastPure Gel DNA Extraction Mini Kit (Catalog number: DC301-01; Vazyme) and then inserted into the pCE2 TA/Blunt-Zero vector using the 5 min TA/Blunt-Zero Cloning Kit (Catalog number: C602-01; Vazyme). Positive colonies were sequenced by Sangon Biotech (Chengdu, China). The cloning and sequencing experiments were repeated at least three times. Sequences were analyzed using DNAMAN (version 8) (Lynnon Biosoft, San Ramon, CA, USA). The primers used are listed in Table 3.

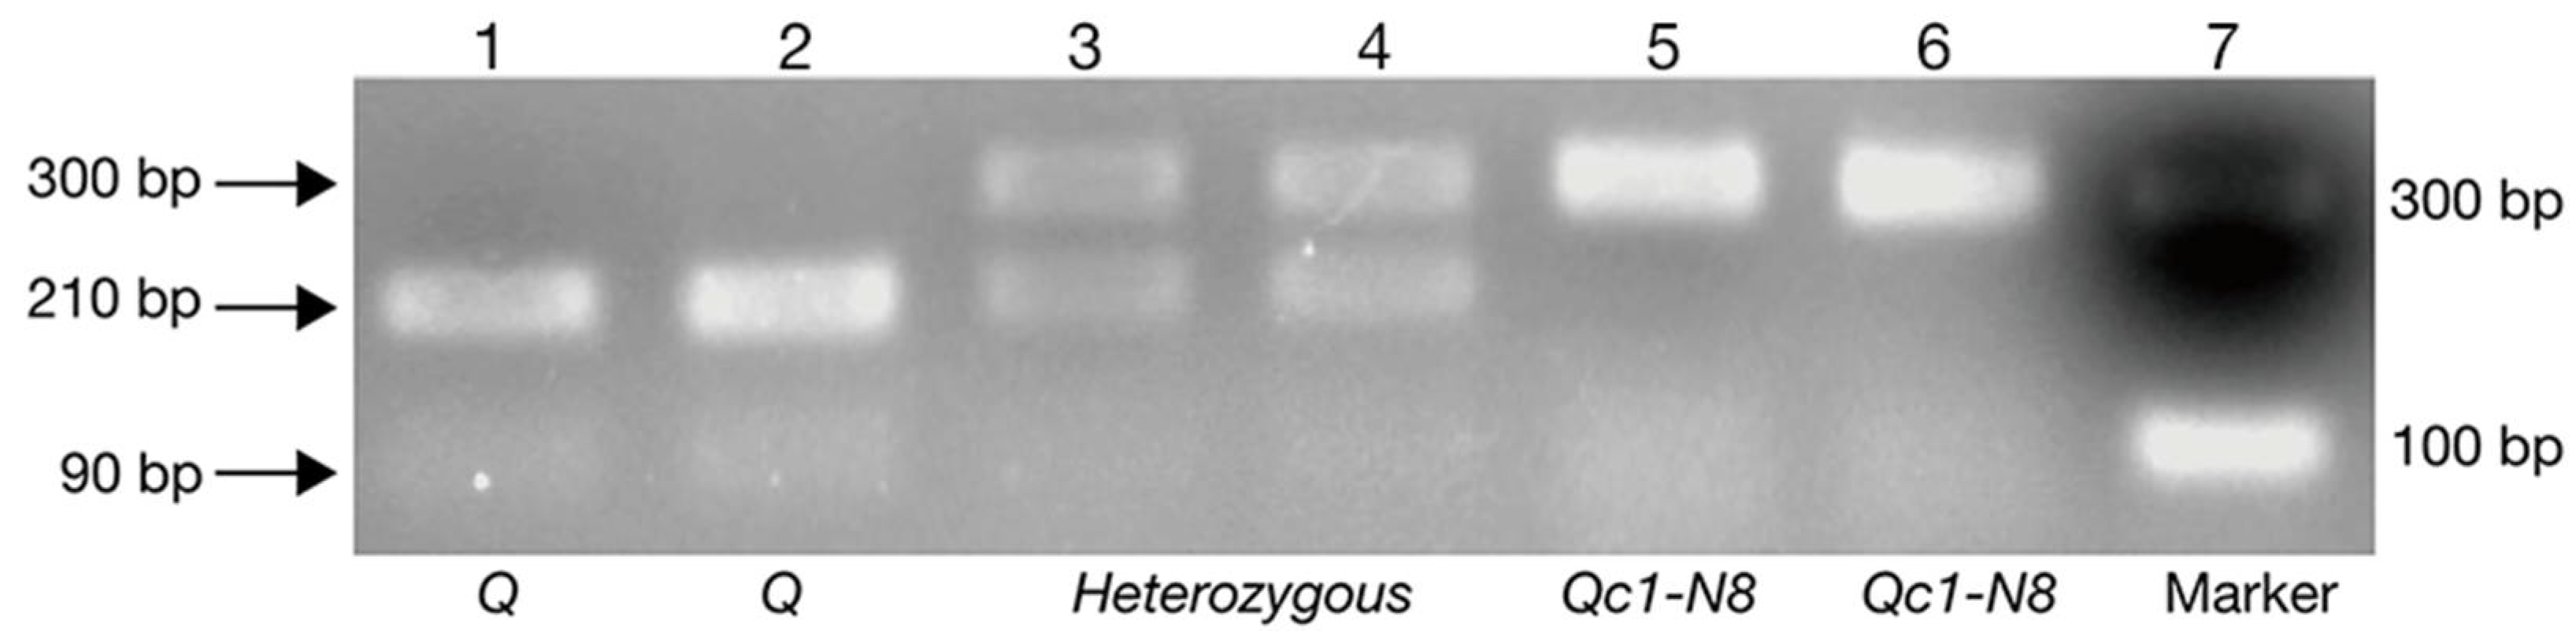
4.3. Genotyping for Qc1-N8

Genomic DNA extracted from individual plants in the BC1F2 and BC2F2 population of the mutant NS8 was used as the PCR template. The QF7 + QR7 primer pair (Table 3) flanking the microRNA172-binding site was used. The PCR amplifications were performed as described above. The PCR products were sequenced to determine the presence/absence of Qc1-N8.

4.4. Development of CAPS Marker for Qc1-N8

The point mutation in the sequence encoding the second AP2 domain of the Qc1-N8 allele was converted to the CAPS (Cleaved Amplified Polymorphic Sequence) marker by using DNAMAN (version 8). This CAPS marker (N8-CAPS-F1 + N8-CAPS-R1; Table 3) was tested in the BC1F2 and BC2F2 populations of the mutant NS8. The PCR amplifications were performed as described above. The PCR products (about 5 µg) were digested with five units of the restriction enzyme BbvI (Catalog number: R0173S; New England Biolabs, Ipswich, MA, USA) along with given buffer at 37 °C for 120 min. The digested fragments were separated on a 1.5% agarose gel.

4.5. Processing Quality Analysis

Mature grains were dried under the sun, cleaned, and stored at room temperature for 2 months. The GPC (dry weight) was measured as described by [36]. In order to assess the effect of Qs1 on processing quality, the moisture content of the ss1 (Figure 1) and wild-type (WT) grains were adjusted to 16.5% before the samples were milled using the CD1 Laboratory Mill (CHOPIN Technologies, Villeneuve-la-Garenne Cedex, France). The Zeleny sedimentation value, wet gluten content, gluten index, and dough rheological properties were determined as previously described [36]. A farinograph (Brabender GmbH & Co., Duisburg, Germany) was used to determine the rheological properties.
A baking test was performed according to a slightly modified version of AACC method 10.09-01 [37]. Specifically, a standard rapid mix test involving 50 g flour (14% moisture content) was conducted. There were two loaves of bread per flour sample. The loaf volume was determined using the BVM6630 volume meter (Pertern, Stockholm, Sweden), as described by the manufacturer.

4.6. Statistical Analysis

All data were calculated using Excel 2010 (Microsoft, Redmond, WA, USA). The significance of the differences in the mean values for the agronomic traits and processing quality parameters between the WT and mutant samples was determined according to Student’s t-test implemented in the Data Processing System (DPS) software (version 18.10) (Zhejiang University, Hangzhou, China) [38]. The DPS software was also used to perform an analysis of variance.

5. Conclusions

In this study, we characterized two new Q alleles (Qs1 and Qc1-N8) and demonstrated that the negative correlation between GY and GPC of wheat could be broken by Qc1-N8 via a non-transgenic approach. Qc1-N8 synchronously increases the wheat GY and GPC, and a specific molecular marker was developed to facilitate its use in breeding. It is possible to further increase both GY and GPC by progressively optimizing the Q gene in the three genomes of wheat.

Supplementary Materials

The following supporting information can be downloaded at: https://www.mdpi.com/article/10.3390/ijms231810772/s1.

Author Contributions

Conceptualization, P.Q.; data curation, P.Q., Q.C., Z.G., M.W., L.K., X.C., Y.W. (Yuming Wei), Y.J. and G.C.; formal analysis, P.Q., Q.C. and X.S.; methodology, P.Q., Q.C., Z.G., X.S., M.W., J.W., Q.J., Y.J. and Y.Z.; investigation, P.Q., Q.C., Z.G., X.S, M.W., Y.F., J.Z., T.Z., Y.W. (Yan Wang) and L.K.; resources, M.D., X.C., J.W., Y.W. (Yuming Wei), Q.J., G.C. and Y.Z.; validation, Q.C. and L.K.; visualization, P.Q., Q.C., Z.G., X.S, M.W. and Y.F.; project administration, P.Q.; writing—original draft preparation, P.Q. and Q.C.; writing—review and editing, P.Q., Q.C., Z.G. and X.S.; funding acquisition, P.Q., Q.C., Y.W. (Yuming Wei) and Y.Z. All authors have read and agreed to the published version of the manuscript.

Funding

This study was supported by the National Natural Science Foundation of China (grant numbers 32072054, 31971939, and 31901961), the Science and Technology Department of Sichuan Province (2019YFH0066, and 2020YFH0150). The wheat mutants are available upon request for wheat breeding.

Institutional Review Board Statement

Not applicable.

Informed Consent Statement

Not applicable.

Data Availability Statement

All data supporting the findings of this study are available within this article and the supplementary material published online.

Conflicts of Interest

The authors declare no conflict of interest.

References

  1. FAOSTAT. FAO Database. Food and Agriculture Organization of the United Nations. Available online: http://www.fao.org/faostat/en/#data (accessed on 26 July 2021).
  2. Kichey, T.; Heumez, E.; Pocholle, D.; Pageau, K.; Vanacker, H.; Dubois, F.; Le Gouis, J.; Hirel, B. Combined agronomic and physiological aspects of nitrogen management in wheat highlight a central role for glutamine synthetase. New Phytol. 2006, 169, 265–278. [Google Scholar] [CrossRef] [PubMed]
  3. Zhang, Y.; Zhang, Y.; Liu, N.; Su, D.; Xue, Q.; Stewart, B.A.; Wang, Z. Effect of source-sink manipulation on accumulation of micronutrients and protein in wheat grains. J. Plant Nutr. Soil Sci. 2012, 175, 622–629. [Google Scholar] [CrossRef]
  4. Zheng, T.; Qi, P.F.; Cao, Y.L.; Han, Y.N.; Ma, H.L.; Guo, Z.R.; Wang, Y.; Qiao, Y.Y.; Hua, S.Y.; Yu, H.Y.; et al. Mechanisms of wheat (Triticum aestivum) grain storage proteins in response to nitrogen applications and its impacts on processing quality. Sci. Rep. 2018, 8, 11928. [Google Scholar] [CrossRef] [PubMed]
  5. Laidig, F.; Piepho, H.P.; Dirk Rentel, D.; Thomas Drobek, T.; Meyer, U.; Huesken, A. Breeding progress, environmental variation and correlation of winter wheat yield and quality traits in German official variety trials and on-farm during 1983–2014. Theor. Appl. Genet. 2017, 130, 223–245. [Google Scholar] [CrossRef]
  6. Mirosavljevic, M.; Momcilovic, V.; Zivancev, D.; Acin, V.; Jockovic, B.; Mikic, S.; Takac, V.; Dencic, S. Genetic improvement of grain yield and bread-making quality of winter wheat over the past 90 years under the Pannonian Plain conditions. Euphytica 2020, 216, 184. [Google Scholar] [CrossRef]
  7. Subira, J.; Peña, R.J.; Álvaro, F.; Ammar, K.; Ramdani, A.; Royo, C. Breeding progress in the pasta-making quality of durum wheat cultivars released in Italy and Spain during the 20th Century. Crop Pasture Sci. 2014, 65, 16–26. [Google Scholar] [CrossRef]
  8. Tabbita, F.; Pearce, S.; Barneix, A.J. Breeding for increased grain protein and micronutrient content in wheat: Ten years of the GPC-B1 gene. J. Cereal Sci. 2017, 73, 183–191. [Google Scholar] [CrossRef]
  9. Rasheed, A.; Xia, X.; Yan, Y.; Appels, R.; Mahmood, T.; He, Z. Wheat seed storage proteins: Advances in molecular genetics, diversity and breeding applications. J. Cereal Sci. 2014, 60, 11–24. [Google Scholar] [CrossRef]
  10. Shewry, P.R. Wheat. J. Exp. Bot. 2009, 60, 1537–1553. [Google Scholar] [CrossRef]
  11. Qi, P.F.; Wei, Y.; Yue, Y.W.; Yan, Z.H.; Zheng, Y.L. Biochemical and molecular characterization of gliadins. Mol. Biol. 2006, 40, 713–723. [Google Scholar] [CrossRef]
  12. Payne, P.I. Genetics of wheat storage proteins and the effect of allelic variation on bread-making quality. Ann. Rev. Plant Physiol. 1987, 38, 141–153. [Google Scholar] [CrossRef]
  13. Wieser, H. Chemistry of gluten proteins. Food Microbiol. 2007, 24, 115–119. [Google Scholar] [CrossRef] [PubMed]
  14. Jiang, Y.F.; Chen, Q.; Wang, Y.; Guo, Z.R.; Xu, B.J.; Zhu, J.; Zhang, Y.Z.; Gong, X.; Luo, C.H.; Wu, W.; et al. Re-acquisition of the brittle rachis trait via a transposon insertion in domestication gene Q during wheat de-domestication. New Phytol. 2019, 224, 961–973. [Google Scholar] [CrossRef] [PubMed]
  15. Simons, K.J.; Fellers, J.P.; Trick, H.N.; Zhang, Z.; Tai, Y.; Gill, B.S.; Faris, J.D. Molecular characterization of the major wheat domestication gene Q. Genet. 2006, 172, 547–555. [Google Scholar] [CrossRef]
  16. Xie, Q.; Li, N.; Yang, Y.; Lv, L.; Yao, H.; Wei, R.; Sparkes, D.L.; Ma, Z.Q. Pleiotropic effects of the wheat domestication gene Q on yield and grain morphology. Planta 2018, 247, 1089–1098. [Google Scholar] [CrossRef] [PubMed]
  17. Xu, B.J.; Chen, Q.; Zheng, T.; Jiang, Y.F.; Qiao, Y.Y.; Guo, Z.R.; Cao, Y.L.; Wan, G.Y.; Zhang, Y.Z.; Zong, L.J.; et al. An overexpressed Q allele leads to increased spike density and improved processing quality. G3 Genes Genom. Genet. 2018, 8, 771–778. [Google Scholar] [CrossRef]
  18. Guo, Z.; Chen, Q.; Zhu, J.; Wang, Y.; Li, Y.; Li, Q.; Zhao, K.; Li, Y.; Tang, R.; Shi, X.; et al. The Qc5 allele increases wheat bread-making quality by regulating SPA and SPR. Int. J. Mol. Sci. 2022, 23, 7581. [Google Scholar] [CrossRef]
  19. Endo, T.R.; Gill, B.S. The deletion stocks of common wheat. J. Hered. 1996, 87, 295–307. [Google Scholar] [CrossRef]
  20. Solomon, C.S.; Drea, S. Besides and beyond flowering: Other roles of EuAP2 genes in plant development. Genes 2019, 10, 994. [Google Scholar] [CrossRef]
  21. Greenwood, J.R.; Finnegan, E.J.; Watanabe, N.; Trevaskis, B.; Swain, S.M. New alleles of the wheat domestication gene Q reveal multiple roles in growth and reproductive development. Development 2017, 144, 1959–1965. [Google Scholar] [CrossRef] [Green Version]
  22. Weegels, P.L.; Hamer, R.J.; Schofield, J.D. Functional properties of wheat glutenin. J. Cereal Sci. 1996, 23, 1–18. [Google Scholar] [CrossRef]
  23. Masoni, A.; Ercoli, L.; Mariotti, M.; Arduini, I. Post-anthesis accumulation and remobilization of dry matter, nitrogen and phosphorus in durum wheat as affected by soil type. Eur. J. Agron. 2007, 26, 179–186. [Google Scholar] [CrossRef]
  24. Barnex, A.J. Physiology and biochemistry of source-regulated protein accumulation in the wheat grain. J. Plant Physiol. 2007, 164, 581–590. [Google Scholar] [CrossRef]
  25. He, G.; Zhang, Y.; Liu, P.; Jing, Y.; Zhang, L.; Zhu, Y.; Kong, X.; Zhao, H.; Zhou, Y.; Sun, J. The transcription factor TaLAX1 interacts with Q to antagonistically regulate grain threshability and spike morphogenesis in bread wheat. New Phytol. 2021, 230, 988–1002. [Google Scholar] [CrossRef] [PubMed]
  26. Muramatsu, M. Dosage effect of the spelta gene q of hexaploid wheat. Genetics 1963, 48, 469–482. [Google Scholar] [CrossRef] [PubMed]
  27. Sissons, M. Role of durum wheat composition on the quality of pasta and bread. Food 2008, 2, 75–90. [Google Scholar]
  28. Porceddu, E.; Turchetta, T.; Masci, S.; D’Ovidio, R.; Lafiandra, D.; Kasarda, D.D.; Impiglia, A.; Nachit, M.M. Variation in endosperm protein composition and technological quality properties in durum wheat. Euphytica 1998, 100, 197–205. [Google Scholar] [CrossRef]
  29. Walsh, D.E.; Gilles, K.A. The influence of protein composition on spaghetti quality. Cereal Chem. 1971, 48, 544–553. [Google Scholar]
  30. Chuck, G.; Meeley, R.; Hake, S. Floral meristem initiation and meristem cell fate are regulated by the maize AP2 genes ids1 and sid1. Development 2008, 135, 3013–3019. [Google Scholar] [CrossRef]
  31. Dong, Z.; Alexander, M.; Chuck, G. Understanding grass domestication through maize mutants. Trends Genet. 2019, 35, 118–128. [Google Scholar] [CrossRef]
  32. Gil-Humanes, J.; Piston, F.; Martin, A.; Barro, F. Comparative genomic analysis and expression of the APETALA2-like genes from barley, wheat, and barley-wheat amphiploids. BMC Plant Biol. 2009, 9, 66. [Google Scholar] [CrossRef] [PubMed]
  33. Lee, D.; An, G. Two AP2 family genes, Supernumerary Bract (SNB) and Osindeterminate Spikelet 1 (OsIDS1), synergistically control inflorescence architecture and floral meristem establishment in rice. Plant J. 2012, 69, 445–461. [Google Scholar] [CrossRef] [PubMed]
  34. Wang, J.; Lin, Z.; Zhang, X.; Liu, H.; Zhou, L.; Zhong, S.; Li, Y.; Zhu, C.; Lin, Z. krn1, a major quantitative trait locus for kernel row number in maize. New Phytol. 2019, 223, 1634–1646. [Google Scholar] [CrossRef] [PubMed]
  35. Zadoks, J.C.; Chang, T.T.; Konzak, C.F. A decimal code for the growth stages of cereals. Weed Res. 1974, 14, 415–421. [Google Scholar] [CrossRef]
  36. Wang, Y.; Chen, Q.; Li, Y.; Guo, Z.R.; Liu, C.H.; Wan, Y.F.; Hawkesford, M.; Zhu, J.; Wu, W.; Wei, M.Q.; et al. Post-translational cleavage of HMW-GS Dy10 allele improves the cookie-making quality in common wheat (Triticum aestivum). Mol. Breed. 2021, 41, 49. [Google Scholar] [CrossRef]
  37. AACC International. Basic Straight-Dough Bread-Baking Method—Long Fermentation (Method 10-09.01); Cereals & Grains Association: St. Paul, MN, USA, 2010; Available online: http://methods.aaccnet.org/ (accessed on 8 February 2014).
  38. Tang, Q.Y.; Zhang, C.X. Data Processing System (DPS) software with experimental design, statistical analysis and data mining developed for use in entomological research. Insect Sci. 2013, 20, 254–260. [Google Scholar] [CrossRef]
Figure 1. Outline of the generation of the mutants ss1 and NS8 in the T. aestivum cv. ‘Shumai 482′ genetic background.
Ijms 23 10772 g001
Figure 2. Phenotype of the mutant ss1. (a) Spikes of the wild-type (WT) (left) and ss1 (right) plants. Scale bar, 2 cm. (b) WT (left) and ss1 (right) plants. Scale bar, 10 cm. Comparisons of grain length (c) and grain width (d). **, p < 0.01; *, p < 0.05. Data are presented as the mean ± standard deviation. ‘+’ and ‘−’ indicate more and less than the WT control, respectively. ‘+0.2′ in panel (c) indicates the ss1 grain was 0.2 mm longer than the WT grain (on average). ‘+ 2.6%’ in panel (c) indicates Qs1 increased the grain length by 2.6% (on average). (e) Kernel width of the WT (upper) and ss1 (lower) samples. Scale bar, 2 cm. (f) Kernel length of the WT (upper) and ss1 (lower) samples. Scale bar, 2 cm.
Ijms 23 10772 g002
Figure 3. Alignment of the Q (GenBank No. KX580301.2), Qs1 (OK041024), Qc1 (KX580302.2), and Qc1-N8 (OK041023) open reading frames. The red arrows indicate the two specific missense mutations in the Qs1 and Qc1-N8 alleles. The microRNA172-binding site is boxed.
Ijms 23 10772 g003
Figure 4. Qs1 has no effect on the bread loaf volume. (a) Comparison of the intact ss1 (left) and wild-type (WT) (right) loaves. Scale bar, 2 cm. (b) Comparison of the ss1 and WT loaf volumes. ns, not significant.
Ijms 23 10772 g004
Figure 5. Phenotype of the mutant NS8 during the 2020–2021 growing season. (a) Spikes of the wild-type (WT) (left) and NS8 (right) plants. Scale bar, 2 cm. (b) WT (left) and NS8 (right) plants. Scale bar, 10 cm. Comparisons of the grain length (c), grain width (d), thousand kernel weight (e), and grain protein contents (f) of the WT and NS8 samples. **, p < 0.01; *, p < 0.05. Data are presented as the mean ± standard deviation. ‘+’ indicates more than the WT control. ‘+0.3′ in panel (c) indicates the NS8 grain was 0.3 mm longer than the WT grain (on average). ‘+4.7%’ in panel (c) indicates that Qc1-N8 increased the grain length by 4.7% (on average). (g) Kernel width of the WT (upper) and NS8 (lower) samples. Scale bar, 2 cm. (h) Kernel length of the WT (upper) and NS8 (lower) samples. Scale bar, 2 cm.
Ijms 23 10772 g005
Figure 6. Effect of Qc1-N8 on agronomic traits during the 2020–2021 growing season. The subfigures (af) are the comparisons of the grain number per main spike, plant height, tiller number, main spike length, spikelet number per main spike, and spike density of the WT and NS8 samples, respectively. The data in the bar graphs are presented as the mean ± standard deviation. *, p < 0.05; ns, not significant. ‘+’ and ‘−’ indicate more and less than the wild-type (WT) control, respectively. ‘+7.1′ in panel (a) indicates NS8 plants had 7.1 more grains per main spike than the WT plants (on average). ‘+13.2%’ in panel (a) indicates that Qc1-N8 increased the grain number per main spike by 13.2% (on average).
Ijms 23 10772 g006
Figure 7. Gel separation of digested and undigested PCR products amplified by using the primer pair N8-CAPS-F1 + N8-CAPS-R1. Lanes 1 and 2 are the digested results of the Q allele. Lanes 3 and 4 are the digested results of the Q/Qc1-N8 alleles. Lanes 5 and 6 are the undigested results of the Qc1-N8 allele. Lane 7 is the DNA marker.
Ijms 23 10772 g007
Table 1. Comparison of the agronomic traits of the mutant ss1 and the wild-type (WT) control.
TraitsGrowing Seasonss1WTEGE × G
Plant height (cm)2018–2019
2019–2020
83.41 ± 4.05 **
71.82 ± 2.30 **
79.44 ± 3.09
67.11 ± 2.00
205.087 **24.459 **0.534
Spike length (cm)2018–2019
2019–2020
14.65 ± 0.68 *
12.88 ± 0.80 **
14.06 ± 0.75
11.87 ± 0.46
123.331 **15.408 **2.680
Spikelet number per main spike2018–2019
2019–2020
21.00 ± 1.15 **
19.93 ± 0.70 **
22.94 ± 1.44
21.43 ± 1.45
15.038 **24.858 **0.110
Spike density2018–2019
2019–2020
1.43 ± 0.07 **
1.55 ± 0.10 **
1.63 ± 0.09
1.80 ± 0.08
45.434 **84.944 **13.78
Grain number per main spike2018–2019
2019–2020
58.81 ± 5.83 *
50.43 ± 4.14 *
65.13 ± 8.23
54.64 ± 4.25
43.376 **8.860 **0.044
Thousand kernel weight (g)2018–2019
2019–2020
44.08 ± 1.71 *
48.76 ± 1.25 *
46.13 ± 0.43
51.90 ± 1.67
50.427 **13.780 **0.216
Tiller number2018–2019
2019–2020
5.30 ± 1.03
3.85 ± 0.74
5.25 ± 1.33
4.25 ± 0.79
27.478 **0.7301.207
**, p < 0.01; *, p < 0.05; E, environment; G, genotype; E × G, interaction between the environment and genotype. Data are presented as the mean ± standard deviation.
Table 2. Comparison of the processing quality parameters of the mutant ss1 and the wild-type (WT) control.
TrailsGrowing Seasonss1WTEGE × G
Grain protein content (%; dry weight)2018–2019
2019–2020
13.12 ± 0.43
14.53 ± 0.60
13.45 ± 0.36
15.16 ± 0.76
30.313 **2.5620.323
Zeleny sedimentation value (mL)2018–2019
2019–2020
32.65 ± 3.64
21.54 ± 2.51
27.73 ± 4.20
23.88 ± 1.98
29.114 **0.3014.315
Wet gluten content (%)2018–2019
2019–2020
24.72 ± 1.60
27.21 ± 1.49
24.98 ± 3.06
29.66 ± 2.05
14.645 **0.5702.996
Gluten index (%)2018–2019
2019–2020
92.87 ± 2.59
63.37 ± 9.02
87.32 ± 8.94
65.04 ± 6.69
65.599 **0.0040.315
Water absorption (%)2018–2019
2019–2020
50.36 ± 0.71
58.74 ± 1.12
50.88 ± 1.67
58.28 ± 0.45
428.875 **0.7830.077
Development time (s)2018–2019
2019–2020
78.00 ± 13.22
61.50 ± 10.71
77.67 ± 9.14
68.40 ± 10.46
7.440 *0.3652.875
Stability time (s)2018–2019
2019–2020
260.86 ± 121.40
193.20 ± 56.34
203.83 ± 66.50
230.40 ± 54.54
0.3940.1251.560
**, p < 0.01; *, p < 0.05; E, environment; G, genotype; E × G, interaction between the environment and genotype. Data are presented as the mean ± standard deviation.
Table 3. Primers used in this study.
Primers NameSequences (5′-3′)ReferenceObjective
AP2startFATGGTGCTGGATCTCAATGTGGAGTCGCCGGCGGA[15]Cloning of the genomic DNA sequence of Q gene
AP2.8RCGCGGCCAAATCGGGGCAAAGGAATTCAAACGA[15]
AP2.2-1FATCTTAGCTGTATGGGCTCGTGThis study
AP2.2-1RTCAACGGAGATAGGGGTGTGThis study
AP2.2-2FAGGCTCCACATAAGTATATGATCGAGTCThis study
AP2.2-2RCTTAATTTCAGGAACGAACTTGTCGThis study
AP2.16FCTGCTTGGTGCGCTGCTCCACCAGCTTACTGAAA[15]
AP45.1RCAGAAGGCCCAACGGTTAACGCAACAATGGC[15]
Q-mRNA-F2-123TCGGAGATGGTGCTGGATThis studyCloning the full open reading frame of Q gene
Q-mRNA-R1-1479GCCAGCTTCAGTTGTCCGThis study
QF7GACCAGCCAGTAGTGTCACCThis studyGenotyping of Qc1-N8 allele
QR7TCTTGCAGTTCCATCCGTCCThis study
N8-CAPS-F1ACTAGAGTGAGTGAGCAAAGATTThis studyCAPS marker for Qc1-N8 allele
N8-CAPS-R1AGCAACTGTTAGGCTCCACATAAThis study
Publisher’s Note: MDPI stays neutral with regard to jurisdictional claims in published maps and institutional affiliations.

