
Raman Spectra and Ancient Life: Vibrational ID Profiles of Fossilized (Bone) Tissues

 , ,
, ,  ,
,
Abstract
1. Introduction
2. Results and Discussion
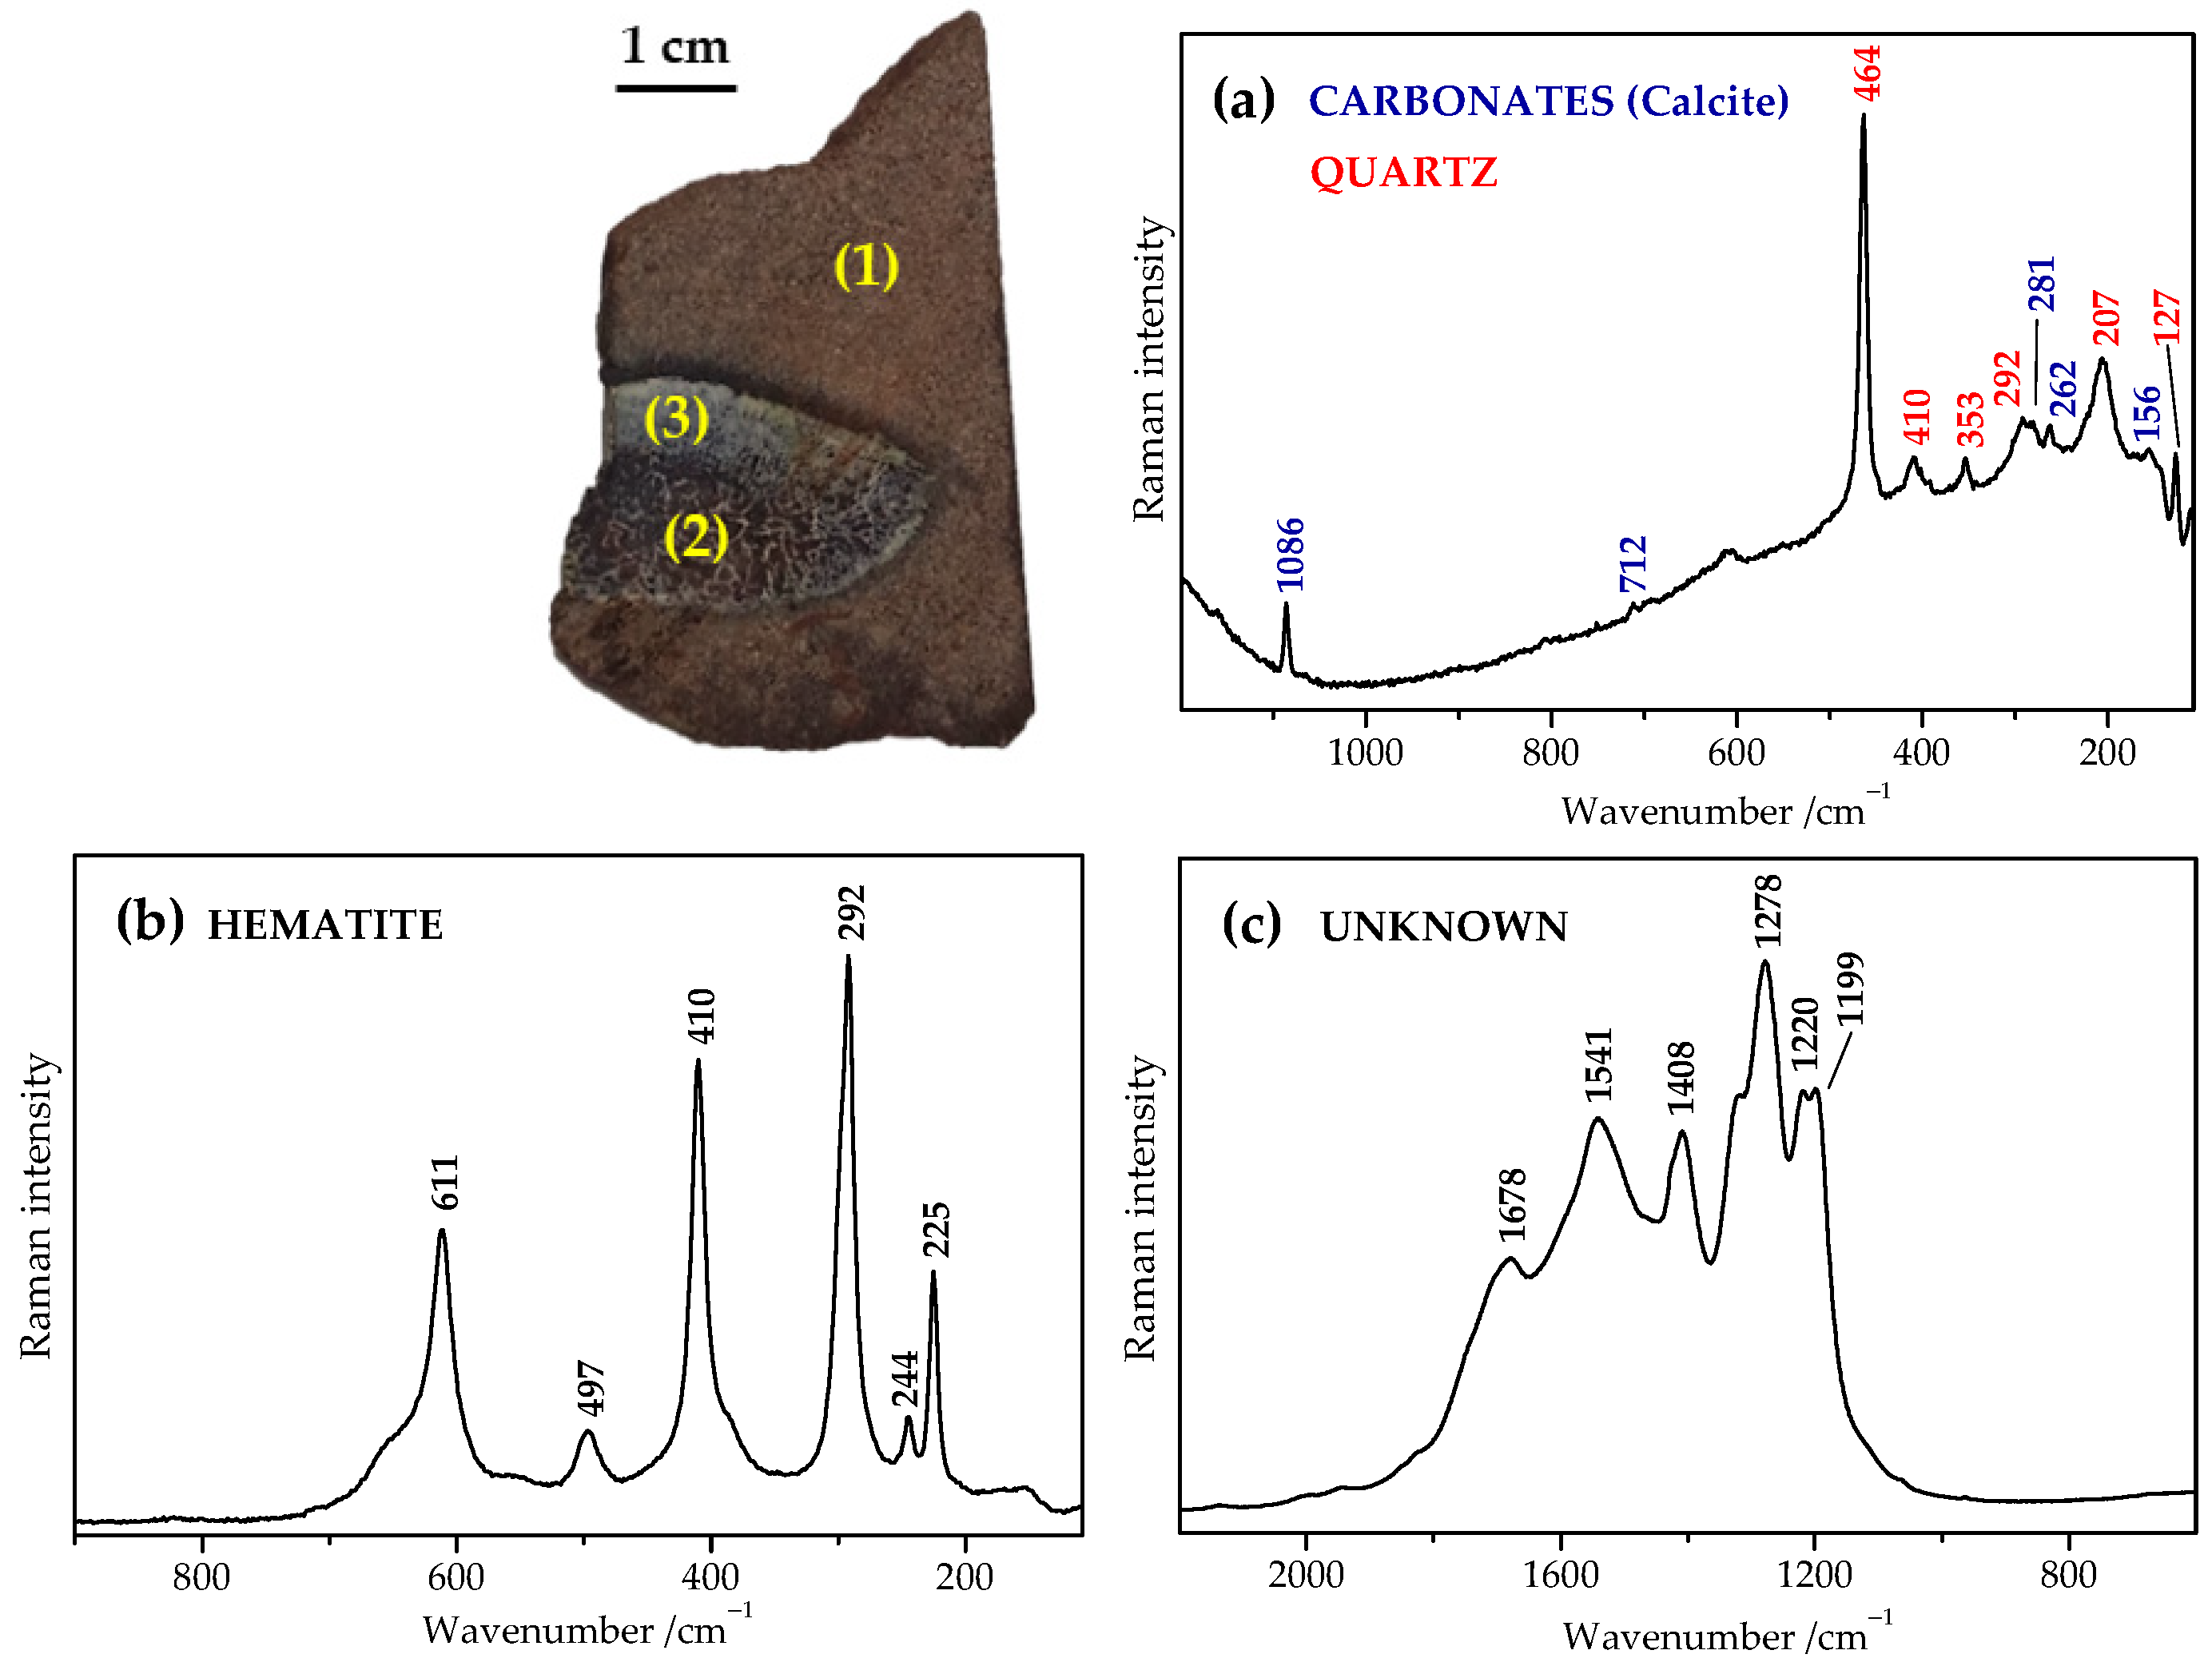
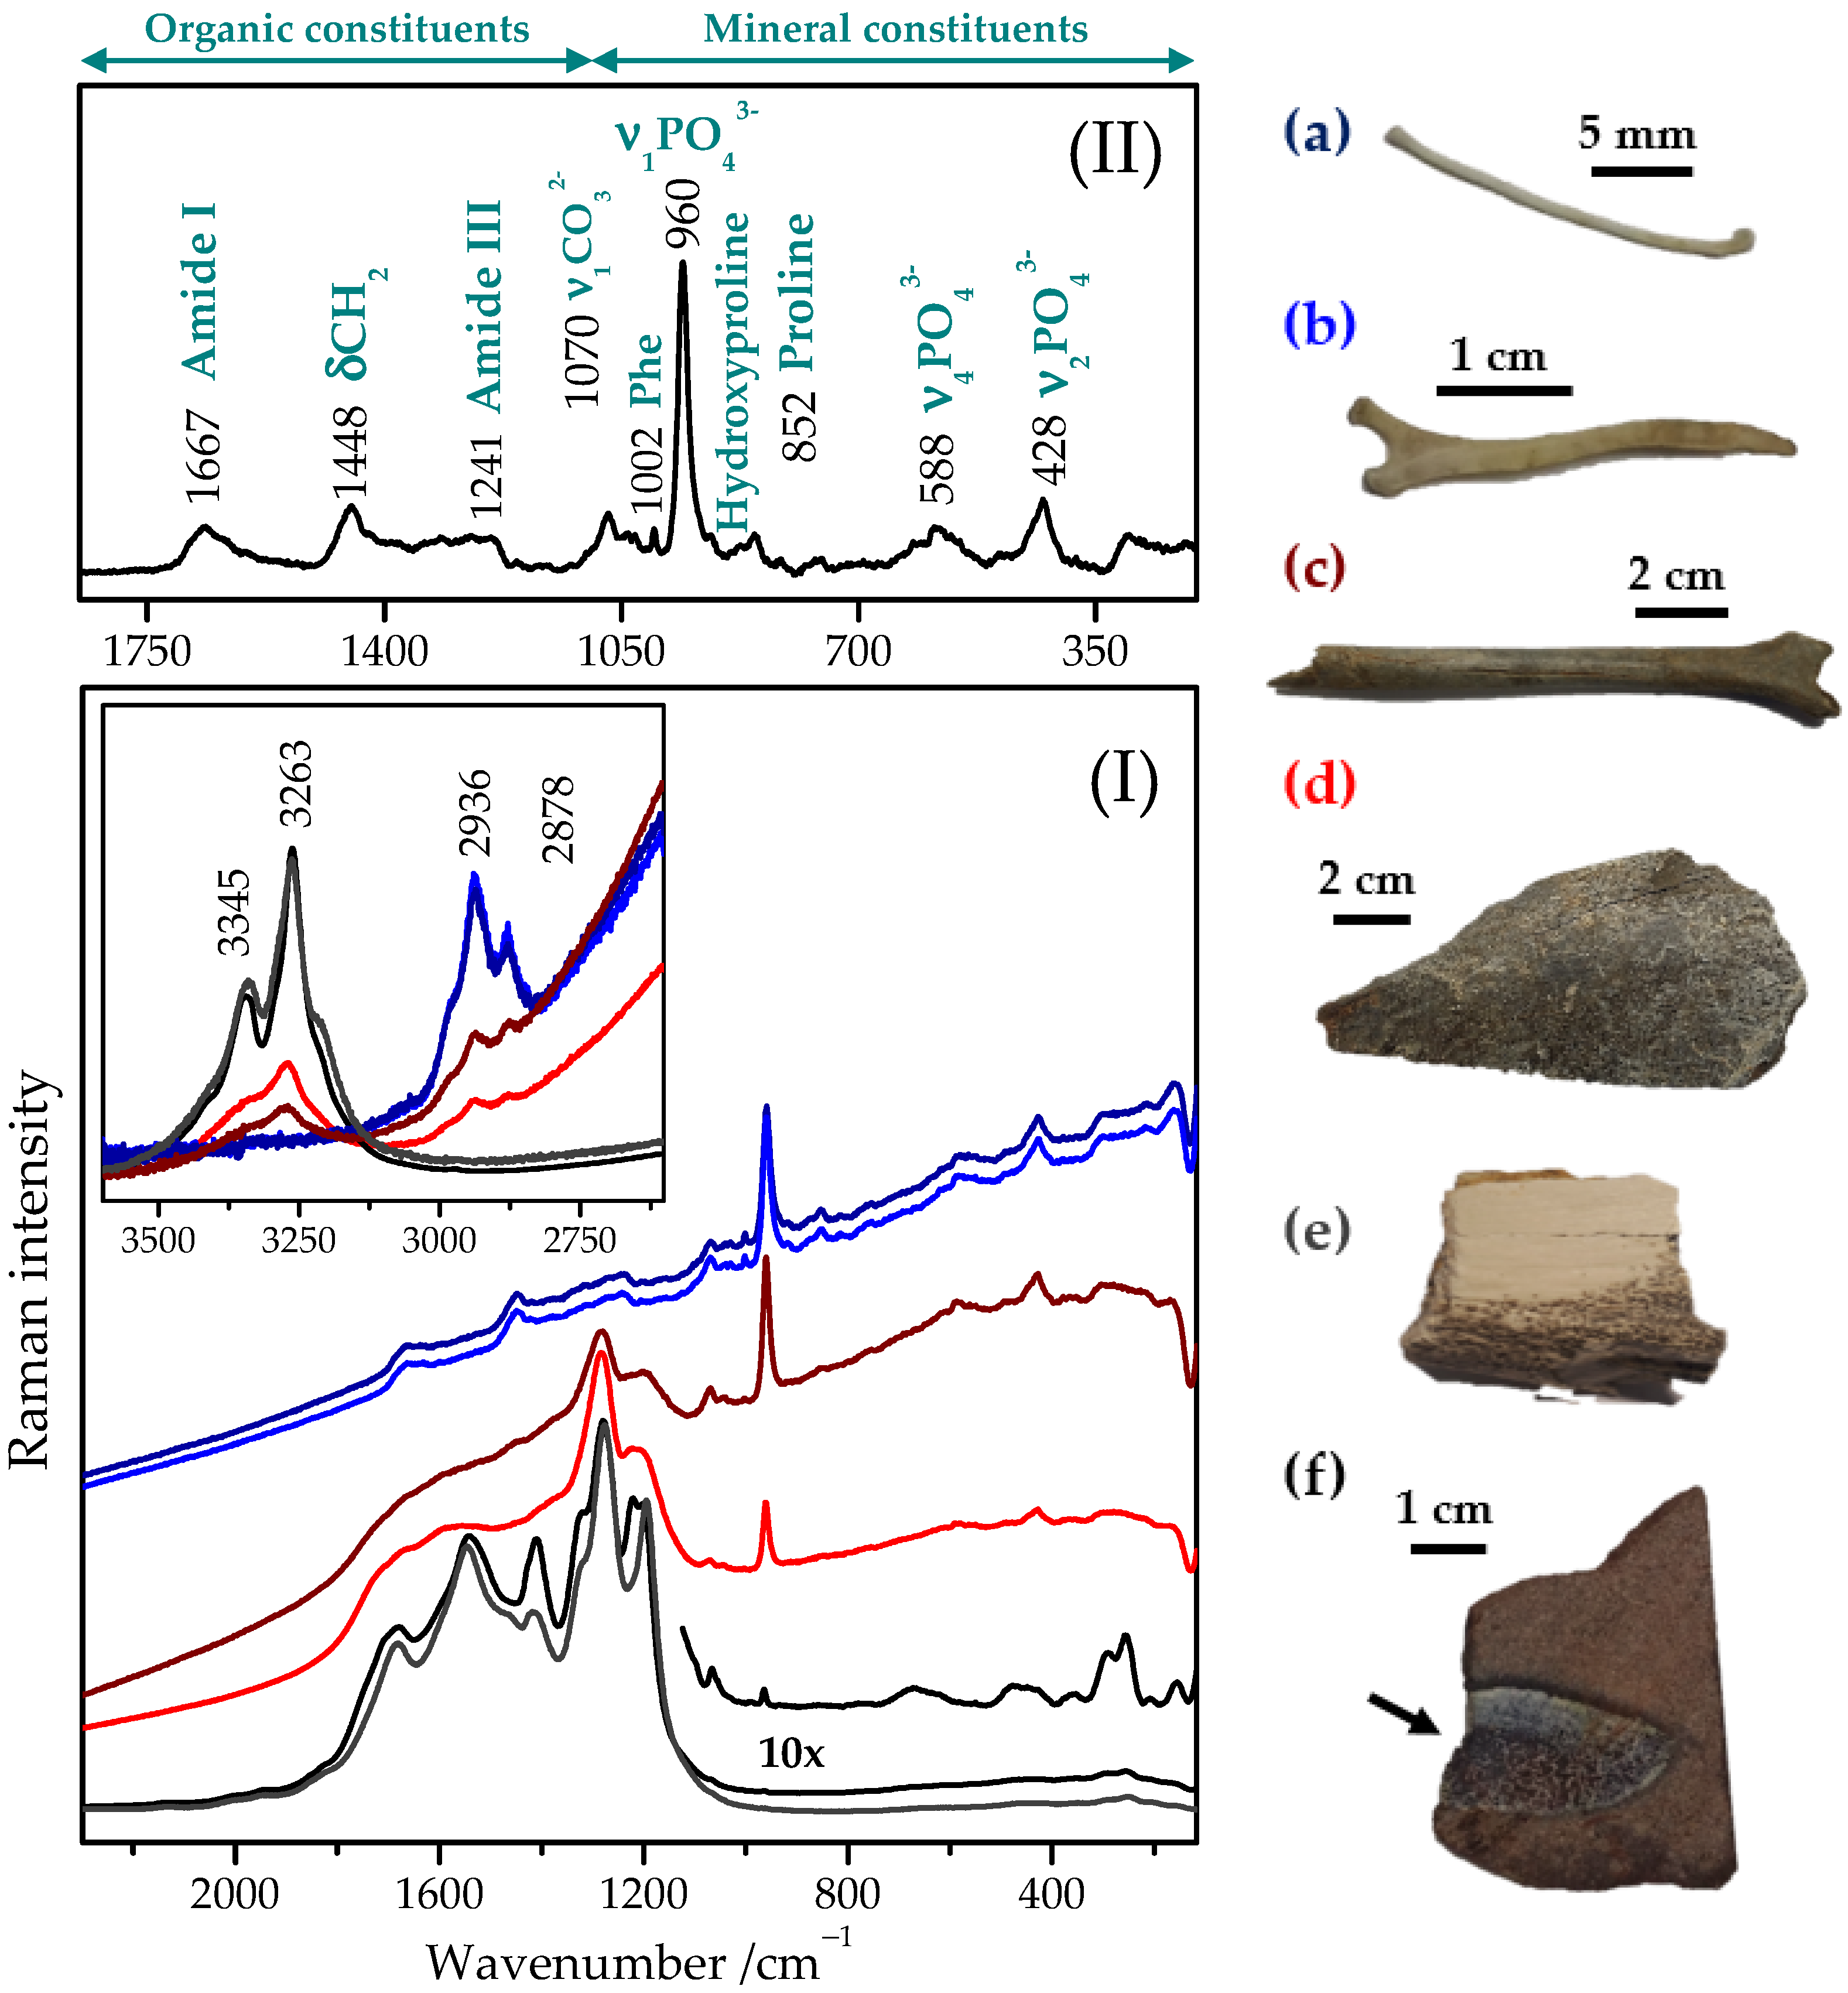
2.1. Typical Raman Spectrum of Bone Tissue
2.2. Raman Spectra of Recent, Subfossil, and Fossil Bones
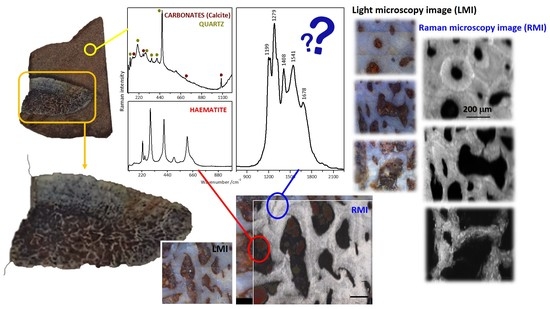
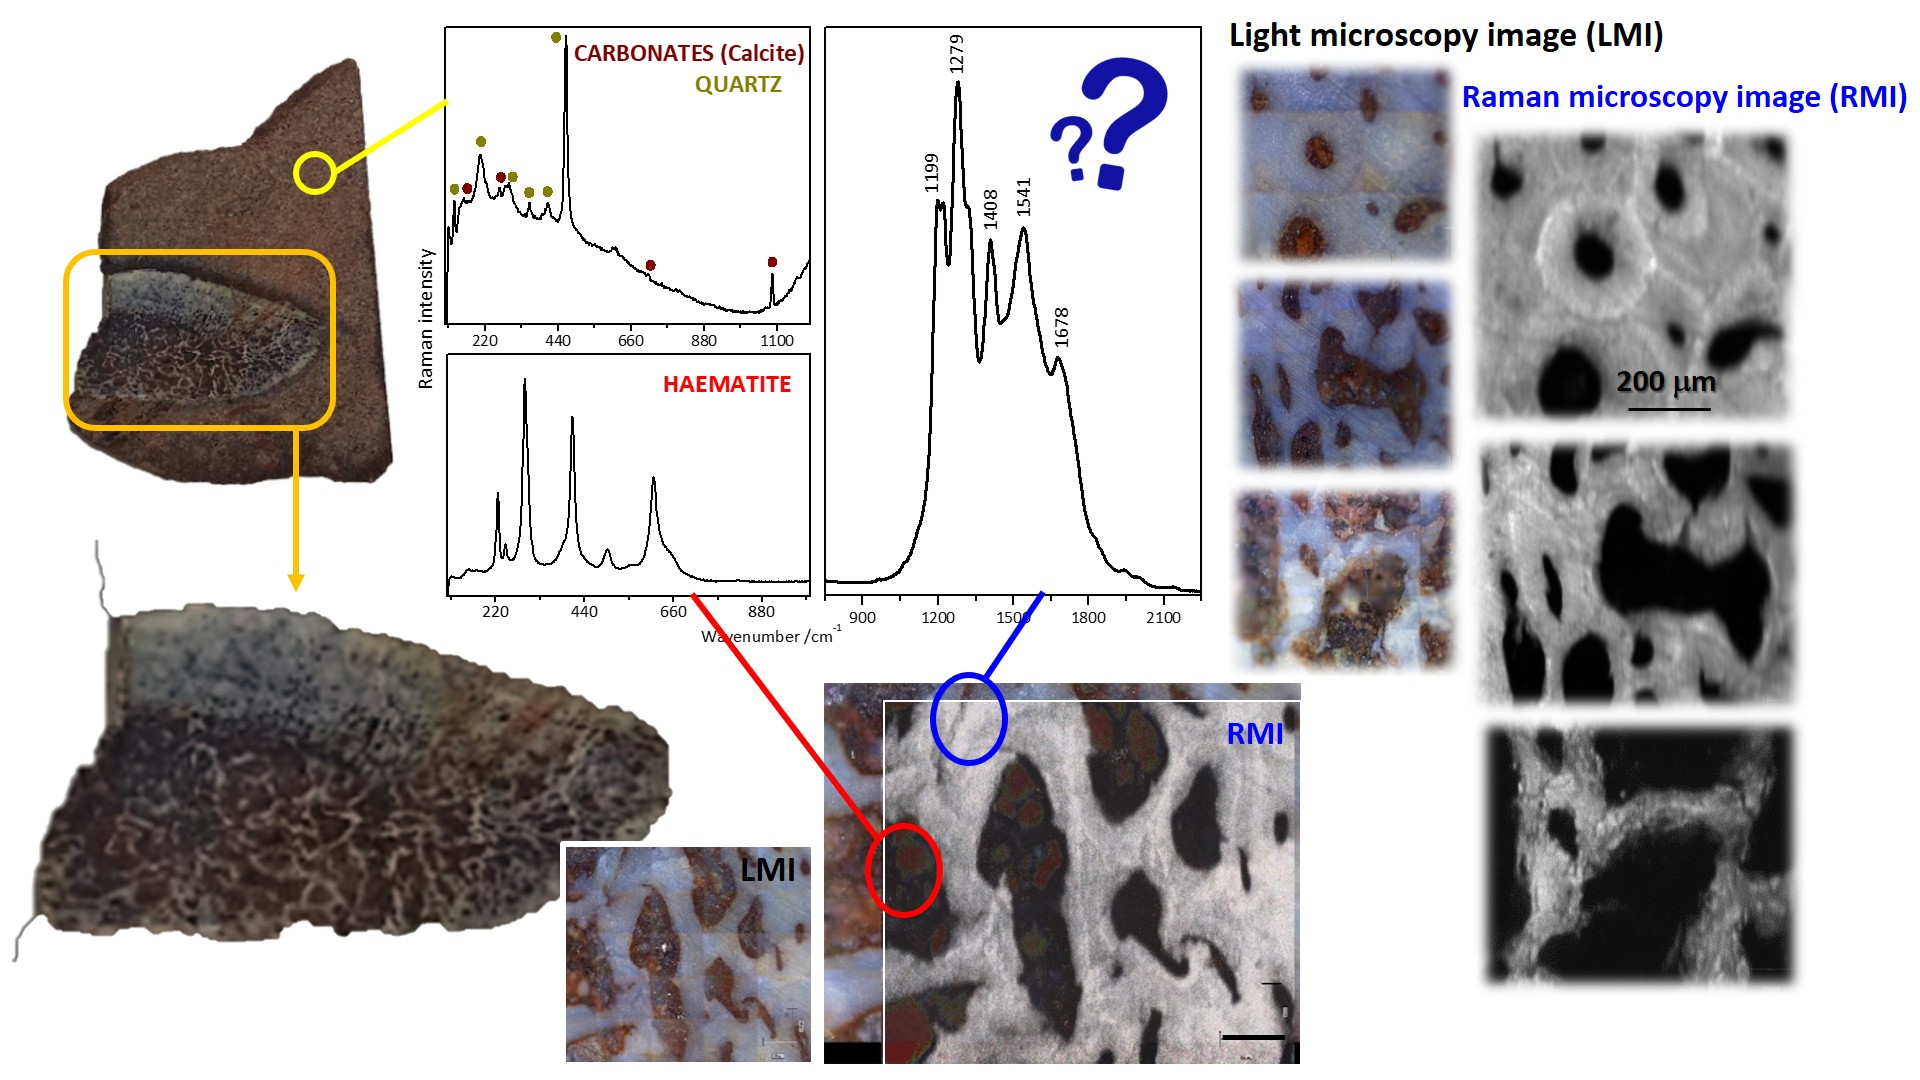
2.3. Raman Mapping Images of the Fossil Bones
2.4. Tentative Bands Interpretation
2.5. Inorganic vs. Organic Origin of These Enigmatic Compounds
3. Materials and Methods
4. Conclusions
Author Contributions
Funding
Institutional Review Board Statement
Informed Consent Statement
Data Availability Statement
Conflicts of Interest
References
- Fernández-Jalvo, Y.; Sanchez-Chillon, B.; Andrews, P.; Fernandez-Lopez, S.; Alcala Martinez, L. Morphological taphonomic transformations of fossil bones in continental environments, and repercussions on their chemical composition. Archaeometry 2002, 44, 353–361. [Google Scholar] [CrossRef]
- Fernández-Jalvo, Y.; Pesquero, M.D.; Tormo, L. Now a bone, then calcite. Palaeogeogr. Palaeoclimatol. Palaeoecol. 2016, 444, 60–70. [Google Scholar] [CrossRef]
- Pfretzschner, H.U. Fossilization of Haversian bone in aquatic environments. C. R. Palevol 2004, 3, 605–616. [Google Scholar] [CrossRef]
- Keenan, S.W. From bone to fossil: A review of the diagenesis of bioapatite. Am. Min. 2016, 101, 1943–1951. [Google Scholar] [CrossRef]
- Bada, J.L.; Wang, X.S.; Hamilton, H. Preservation of key biomolecules in the fossil record: Current knowledge and future challenges. Philos. Trans. R. Soc. B Biol. Sci. 1999, 354, 77–87. [Google Scholar] [CrossRef] [PubMed]
- Nielsen-Marsh, C. Biomolecules in fossil remains: Multidisciplinary approach to endurance. Biochemistry 2002, 24, 12–14. [Google Scholar] [CrossRef]
- Collins, M.J.; Nielsen-Marsh, C.M.; Hiller, J.; Smith, C.I.; Roberts, J.P.; Prigodich, R.V.; Wess, T.J.; Csapò, J.; Millard, A.R.; Turner-Walker, G. The survival of organic matter in bone: A review. Archaeometry 2002, 44, 383–394. [Google Scholar] [CrossRef]
- Colleary, C.E. Is the Presence of Biomolecules Evidence for Molecular Preservation in the Fossil Record? Ph.D. Thesis, Virginia Polytechnic Institute, State University, Blacksburg, VA, USA, 2018. [Google Scholar]
- Wiemann, J.; Fabbri, M.; Yang, T.-R.; Stein, K.; Sander, P.M.; Norell, M.A.; Briggs, D.E.G. Fossilization transforms vertebrate hard tissue proteins into N-heterocyclic polymers. Nat. Commun. 2018, 9, 4741. [Google Scholar] [CrossRef]
- Wiemann, J.; Crawford, J.M.; Briggs, D.E.G. Phylogenetic and physiological signals in metazoan fossil biomolecules. Sci. Adv. 2020, 6, eaba6883. [Google Scholar] [CrossRef]
- Tahoun, M.; Engeser, M.; Namasivayam, V.; Sander, P.M.; Müller, C.E. Chemistry and Analysis of Organic Compounds in Dinosaurs. Biology 2022, 11, 670. [Google Scholar] [CrossRef]
- Schweitzer, M.H. Soft Tissue Preservation in Terrestrial Mesozoic Vertebrates. Annu. Rev. Earth Planet. Sci. 2011, 39, 187–216. [Google Scholar] [CrossRef]
- Lee, Y.C.; Chiang, C.C.; Huang, P.Y.; Chung, C.Y.; Huang, T.D.; Wang, C.C.; Chen, C.I.; Chang, R.S.; Liao, C.H.; Reisz, R.R. Evidence of preserved collagen in an Early Jurassic sauropodomorph dinosaur revealed by synchrotron FTIR microspectroscopy. Nat. Commun. 2017, 8, 2–9. [Google Scholar] [CrossRef] [PubMed]
- Saitta, E.T.; Liang, R.; Lau, M.C.; Brown, C.M.; Longrich, N.R.; Kaye, T.G.; Novak, B.J.; Salzberg, S.L.; Norell, M.A.; Abbott, G.D.; et al. Cretaceous dinosaur bone contains recent organic material and provides an environment conducive to microbial communities. elife 2019, 8, e46205. [Google Scholar] [CrossRef] [PubMed]
- Adamiano, A.; Fabbri, D.; Falini, G.; Belcastro, G. A complementary approach using analytical pyrolysis to evaluate collagen degradation and mineral fossilization in archaeological bones: The case study of Vicenne-Campochiaro necropolis (Italy). J. Anal. Appl. Pyrolysis 2013, 100, 173–180. [Google Scholar] [CrossRef]
- Dauphin, Y. Vertebrate Taphonomy and Diagenesis: Implications of Structural and Compositional Alterations of Phosphate Biominerals. Minerals 2022, 12, 180. [Google Scholar] [CrossRef]
- Tütken, T.; Vennemann, T.W. Fossil bones and teeth: Preservation or alteration of biogenic compositions? Palaeogeogr. Palaeoclimatol. Palaeoecol. 2011, 310, 1–8. [Google Scholar] [CrossRef]
- Piga, G.; Santos-Cubedo, A.; Brunetti, A.; Piccinini, M.; Malgosa, A.; Napolitano, E.; Enzo, S. A multi-technique approach by XRD, XRF, FT-IR to characterize the diagenesis of dinosaur bones from Spain. Palaeogeogr. Palaeoclimatol. Palaeoecol. 2011, 310, 92–107. [Google Scholar] [CrossRef]
- Margariti, E.; Stathopoulou, E.T.; Sanakis, Y.; Kotopoulou, E.; Pavlakis, P.; Godelitsas, A. A geochemical approach to fossilization processes in Miocene vertebrate bones from Sahabi, NE Libya. J. Afr. Earth Sci. 2019, 149, 1–18. [Google Scholar] [CrossRef]
- Schweitzer, M.H.; Avci, R.; Collier, T.; Goodwind, M.B. Microscopic, chemical and molecular methods for examining fossil preservation. C. R. Palevol 2008, 7, 159–184. [Google Scholar] [CrossRef]
- de Sousa, D.V.; Eltink, E.; Pessoa Oliveira, R.A.; Félix, J.F.; de Moura Guimaraes, L. Diagenetic processes in Quaternary fossil bones form tropical limestone caves. Sci. Rep. 2020, 10, 21425. [Google Scholar] [CrossRef]
- Zougrou, I.M.; Katsikini, M.; Pinakidou, F.; Paloura, E.C.; Papadopoulou, L.; Tsoukala, E. Study of fossil bones by synchrotron radiation micro-spectroscopic techniques and scanning electron microscopy. J. Synchrotron Radiat. 2013, 21, 149–160. [Google Scholar] [CrossRef]
- Barrientos, G.; Sarmiento, P.; Galligani, P. Evaluación de la diagénesis ósea mediante el uso de microscopía electrónica de barrido (MEB): Aproximaciones analíticas aplicables a muestras arqueológicas. Rev. Arg. Antrop. Biol. 2016, 18, 1–13. [Google Scholar] [CrossRef]
- Cadena, E.A. In situ SEM/EDS compositional characterization of osteocytes and blood vessels in fossil and extant turtles on untreated bone surfaces: Different preservational pathways microns away. PeerJ 2020, 8, e9833. [Google Scholar] [CrossRef]
- Ryanskaya, A.D.; Kiseleva, D.V.; Shilovsky, O.P.; Shagalov, E.S. XRD study of the Permian fossil bone tissue. Powder Diffr. 2019, 34 (Suppl. S1), S14–S17. [Google Scholar] [CrossRef]
- Mckinnon, M.; Henneberg, M.; Simpson, E.; Higgins, D. A Comparison of Crystal Structure in Fresh, Burned and Archaic Bone—Implications for Forensic Sampling. Forensic Sci. Int. 2020, 313, 110328. [Google Scholar] [CrossRef]
- Stathopoulou, E.T.; Psycharis, V.; Chryssikos, G.D.; Gionis, V.; Theodorou, G. Bone diagenesis: New data from infrared spectroscopy and X-ray diffraction. Palaeogeogr. Palaeoclimatol. Palaeoecol. 2008, 266, 168–174. [Google Scholar] [CrossRef]
- Dal Sasso, G.; Asscher, Y.; Angelini, I.; Nodari, L.; Artioli, G. A universal curve of apatite crystallinity for the assessment of bone integrity and preservation. Sci. Rep. 2018, 8, 12025. [Google Scholar] [CrossRef] [PubMed]
- Lebon, M.; Reiche, I.; Bahain, J.J.; Chadefaux, C.; Moigne, A.M.; Fröhlich, F.; Sémah, F.; Schwarz, H.P.; Falguères, C. New parameters for the characterization of diagenetic alterations and heat-induced changes of fossil bone mineral using Fourier transform infrared spectrometry. J. Archaeol. Sci. 2010, 37, 2265–2276. [Google Scholar] [CrossRef]
- Mandair, G.S.; Morris, M.D. Contributions of Raman spectroscopy to the understanding of bone strength. BoneKEy Rep. 2015, 4, 620. [Google Scholar] [CrossRef]
- Thomas, D.B.; Fordyce, R.E.; Frew, R.D.; Gordon, K.C. A rapid, non-destructive method of detecting diagenetic alteration in fossil bone using Raman spectroscopy. J. Raman Spectrosc. 2007, 38, 1533–1537. [Google Scholar] [CrossRef]
- Morris, M.D.; Mandair, G.S. Raman Assessment of Bone Quality. Clin. Orthop. Relat. Res. 2011, 469, 2160–2169. [Google Scholar] [CrossRef] [PubMed]
- Wopenka, B.; Pasteris, J.D. A mineralogical perspective on the apatite in bone. Mater. Sci. Eng. C 2005, 25, 131–143. [Google Scholar] [CrossRef]
- Dal Sasso, G.; Angelini, I.; Maritan, L.; Artioli, G. Raman hyperspectral imaging as an effective and highly informative tool to study the diagenetic alteration of fossil bones. Talanta 2018, 179, 167–176. [Google Scholar] [CrossRef]
- Gueriau, P.; Réguer, S.; Leclercq, N.; Cupello, C.; Brito, P.M.; Jauvion, C.; Morel, S.; Charbonnier, S.; Thiaudière, D.; Mocuta, C. Visualizing mineralization processes and fossil anatomy using synchronous synchrotron X-ray fluorescence and X-ray diffraction mapping. J. R. Soc. Interface 2020, 17, 20200216. [Google Scholar] [CrossRef]
- Zougrou, I.M.; Katsikini, M.; Pinakidou, F.; Brzhezinskaya, M.; Papadopoulou, L.; Vlachos, E.; Tsoukala, E.; Paloura, E.C. Characterization of fossil remains using XRF, XPS and XAFS spectroscopies. J. Phys. Conf. Ser. 2016, 712, 012090. [Google Scholar] [CrossRef]
- Cleland, T.P.; Schroeter, E.R. A Comparison of Common Mass Spectrometry Approaches for Paleoproteomics. J. Proteome Res. 2018, 17, 936–945. [Google Scholar] [CrossRef]
- Schweitzer, M.H.; Schroeter, E.R.; Cleland, T.P.; Zheng, W. Paleoproteomics of Mesozoic dinosaurs and other Mesozoic fossils. Proteomics 2019, 19, 1800251. [Google Scholar] [CrossRef]
- Cersoy, S.; Daheur, G.; Zazzo, A.; Zirah, S.; Sablier, M. Pyrolysis comprehensive gas chromatography and mass spectrometry: A new tool to assess the purity of ancient collagen prior to radiocarbon dating. Anal. Chim. Acta 2018, 1041, 131–145. [Google Scholar] [CrossRef]
- Houssaye, A. Bone Histology of Fossil Tetrapods: Advancing Methods, Analysis, and Interpretation. J. Vertebr. Paleontol. 2014, 34, 1258. [Google Scholar] [CrossRef]
- Dal Sasso, G.; Maritan, L.; Usai, D.; Angelini, I.; Artioli, G. Bone diagenesis at the micro-scale: Bone alteration patterns during multiple burial phases at Al Khiday (Khartoum, Sudan) between the Early Holocene and the II century AD. Palaeogeogr. Palaeoclimatol. Palaeoecol. 2014, 416, 30–42. [Google Scholar] [CrossRef]
- Sanchez, S.; Ahlberg, P.E.; Trinajstic, K.M.; Mirone, A.; Tafforeau, P. Three-Dimensional Synchrotron Virtual Paleohistology: A New Insight into the World of Fossil Bone Microstructures. Microsc. Microanal. 2012, 18, 1095–1105. [Google Scholar] [CrossRef]
- Varricchio, D.J.; Kundrát, M.; Hogan, J. An Intermediate Incubation Period and Primitive Brooding in a Theropod Dinosaur. Sci. Rep. 2018, 8, 12454. [Google Scholar] [CrossRef] [PubMed]
- Golreihan, A.; Steuwe, C.; Woelders, L.; Deprez, A.; Fujita, Y.; Vellekoop, J.; Swennen, R.; Roeffaers, M.B.J. Improving preservation state assessment of carbonate microfossils in paleontological research using label-free stimulated Raman imaging. PLoS ONE 2018, 13, e0199695. [Google Scholar] [CrossRef] [PubMed]
- Dauphin, Y.; Williams, C.T.; Andrews, P.; Denys, C.; Fernandez-Jalvo, Y. Diagenetic alterations of micromammal fossil bones from Olduvai Bed I of the lower Pleistocene sequence at Olduvai Gorge, Tanzania. J. Sediment. Res. 1999, 69, 612–621. [Google Scholar] [CrossRef]
- Dal Sasso, G.; Lebon, M.; Angelini, I.; Maritan, L.; Usai, D.; Artioli, G. Bone diagenesis variability among multiple burial phases at Al Khiday (Sudan) investigated by ATR-FTIR spectroscopy. Palaeogeogr. Palaeoclimatol. Palaeoecol. 2016, 463, 168–179. [Google Scholar] [CrossRef]
- Miller, L.M.; Vairavamurthy, V.; Chance, M.R.; Mendelsohn, R.; Paschalis, E.P.; Betts, F.; Boskey, A.L. In situ analysis of mineral content and crystallinity in bone using infrared micro-spectroscopy of the ν4 PO43− vibration. Biochim. Biophys. Acta Gen. Subj. 2001, 1527, 11–19. [Google Scholar] [CrossRef]
- Marques, M.P.M.; Mamede, A.P.; Vassalo, A.R.; Makhoul, C.; Cunha, E.; Goncales, D.; Parker, S.F.; Batista de Carvalho, L.A.E. Heat-induced Bone Diagenesis Probed by Vibrational Spectroscopy. Sci. Rep. 2018, 8, 15935. [Google Scholar] [CrossRef]
- Bosser, C.; Ogier, A.; Imbert, L.; Hoc, T. Raman Spectroscopy as a Biomarker-Investigative Tool in Bone Metabolism. In Biomarkers in Bone Disease; Biomarkers in Disease: Methods, Discoveries and Applications; Patel, V.B., Preedy, V.R., Eds.; Springer: Dordrecht, The Netherlands, 2017; pp. 671–697. ISBN 978-94-007-7692-0. [Google Scholar]
- Turunen, M.J.; Saarakkala, S.; Rieppo, L.; Helminen, H.J.; Jurvelin, J.S.; Isaksson, H. Comparison between Infrared and Raman Spectroscopic Analysis of Maturing Rabbit Cortical Bone. Appl. Spectrosc. 2011, 65, 595–603. [Google Scholar] [CrossRef]
- Freeman, J.J.; Wopenka, B.; Silva, M.J.; Pasteris, J.D. Raman spectroscopic detection of changes in bioapatite in mouse femora as a function of age and in vitro fluoride treatment. Calcif. Tissue Int. 2001, 68, 156–162. [Google Scholar] [CrossRef]
- Marshall, A.O.; Wehrbein, R.L.; Lieberman, B.S.; Marshall, C.P. Raman spectroscopic investigations of burgess shale-type preservation: A new way forward. Palaios 2012, 27, 288–292. [Google Scholar] [CrossRef]
- Bordes, L. Analysing Micro-Residues on Prehistoric Stone Tools by Raman Microscopy and Determining Their Origins. Ph.D. Thesis, School of Earth, Atmospheric and Life Sciences, University of Wollongong, Wollongong, Australia, 2019. [Google Scholar]
- King, C.L.; Tayles, N.; Gordon, K.C. Re-examining the chemical evaluation of diagenesis in human bone apatite. J. Archaeol. Sci. 2011, 38, 2222–2230. [Google Scholar] [CrossRef]
- Thomas, D.B.; McGoverin, C.M.; Fordyce, R.E.; Frew, R.D.; Gordon, K.C. Raman spectroscopy of fossil bioapatite—A proxy for diagenetic alteration of the oxygen isotope composition. Palaeogeogr. Palaeoclimatol. Palaeoecol. 2011, 310, 62–70. [Google Scholar] [CrossRef]
- Shah, F.A. Towards refining Raman spectroscopy-based assessment of bone composition. Sci. Rep. 2020, 10, 16662. [Google Scholar] [CrossRef]
- Khan, A.F.; Awais, M.; Khan, A.S.; Tabassum, S.; Chaudhry, A.A.; Ur Rehman, I. Raman Spectroscopy of Natural Bone and Synthetic Apatites. Appl. Spectrosc. Rev. 2013, 48, 329–355. [Google Scholar] [CrossRef]
- Nguyen, T.T.; Gobinet, C.; Feru, J.; Brassart-Pasco, S.; Manfait, M.; Piot, O. Characterization of Type I and IV Collagens by Raman Microspectroscopy: Identification of Spectral Markers of the Dermo-Epidermal Junction. J. Spectrosc. 2012, 27, 421–427. [Google Scholar] [CrossRef]
- Ciubuc, J.; Manciu, M.; Maran, A.; Yaszemski, M.; Sundin, E.; Bennet, K.; Manciu, F. Raman Spectroscopic and Microscopic Analysis for Monitoring Renal Osteodystrophy Signatures. Biosensors 2018, 8, 38. [Google Scholar] [CrossRef] [PubMed]
- Ishimaru, Y.; Oshima, Y.; Imai, Y.; Iimura, T.; Takanezawa, S.; Hino, K.; Miura, H. Raman Spectroscopic Analysis to Detect Reduced Bone Quality after Sciatic Neurectomy in Mice. Molecules 2018, 23, 3081. [Google Scholar] [CrossRef] [PubMed]
- Kazanci, M.; Roschger, P.; Paschalis, E.P.; Klaushofer, K.; Fratzl, P. Bone osteonal tissues by Raman spectral mapping: Orientation–Composition. J. Struct. Biol. 2006, 156, 489–496. [Google Scholar] [CrossRef]
- Otto, C.; de Grauw, C.J.; Duindam, J.J.; Sijtsema, N.M.; Greve, J. Applications of Micro-Raman Imaging in Biomedical Research. J. Raman Spectrosc. 1997, 28, 143–150. [Google Scholar] [CrossRef]
- Kalisz, G.; Przekora, A.; Kazimierczak, P.; Gieroba, B.; Jedrek, M.; Grudzinski, W.; Gruszecki, W.I.; Ginalska, G.; Sroka-Bartnicka, A. Application of Raman Spectroscopic Imaging to Assess the Structural Changes at Cell-Scaffold Interface. Int. J. Mol. Sci. 2021, 22, 485. [Google Scholar] [CrossRef]
- Zhou, H.; Simmons, C.S.; Sarntinoranont, M.; Subhash, G. Raman Spectroscopy Methods to Characterize the Mechanical Response of Soft Biomaterials. Biomacromolecules 2020, 21, 3485–3497. [Google Scholar] [CrossRef] [PubMed]
- Shah, F.A.; Ruscsák, K.; Palmquist, A. Mapping Bone Surface Composition Using Real-Time Surface Tracked Micro-Raman Spectroscopy. Cells Tissues Organs 2021, 209, 266–275. [Google Scholar] [CrossRef] [PubMed]
- Alunni Cardinali, M.; Morresi, A.; Fioretto, D.; Vivarelli, L.; Dallari, D.; Govoni, M. Brillouin and Raman Micro-Spectroscopy: A Tool for Micro-Mechanical and Structural Characterization of Cortical and Trabecular Bone Tissues. Materials 2021, 14, 6869. [Google Scholar] [CrossRef] [PubMed]
- Pucéat, E.; Reynard, B.; Lecuyer, C. Can crystallinity be used to determine the degree of chemical alteration of biogenic apatites? Chem. Geol. 2004, 205, 83–97. [Google Scholar] [CrossRef]
- Kral, A.G.; Guagliardo, P.; Fougerouse, D.; Saxey, D.; Reddy, S.; Rickard, W.; Tütken, T.; Geisler, T. In vitro bone fossilization—micro to nanoscale alteration processes. In Proceedings of the Goldschmidt Conference, Barcelona, Spain, 18–23 August 2019. [Google Scholar]
- Mamede, A.P.; Gonçalves, D.; Marques, M.P.M.; Batista de Carvalho, L.A.E. Burned bones tell their own stories: A review of methodological approaches to assess heat-induced diagenesis. Appl. Spectrosc. Rev. 2017, 53, 603–635. [Google Scholar] [CrossRef]
- France, C.A.M.; Thomas, D.B.; Doney, C.R.; Madden, O. FT-Raman spectroscopy as a method for screening collagen diagenesis in bone. J. Archaeol. Sci. 2014, 42, 346–355. [Google Scholar] [CrossRef]
- Pan, Y.; Hu, L.; Zhao, T. Applications of chemical imaging techniques in paleontology. Natl. Sci. Rev. 2019, 6, 1040–1053. [Google Scholar] [CrossRef]
- Halcrow, S.E.; Rooney, J.; Beavan, N.; Gordon, K.C.; Tayles, N.; Gray, A. Assessing Raman Spectroscopy as a Prescreening Tool for the Selection of Archaeological Bone for Stable Isotopic Analysis. PLoS ONE 2014, 9, e98462. [Google Scholar]
- Boatman, E.M.; Goodwin, M.B.; Holman, H.Y.N.; Fakra, S.; Zheng, W.; Gronsky, R.; Schweitzer, M.H. Mechanisms of soft tissue and protein preservation in Tyrannosaurus rex. Sci. Rep. 2019, 9, 15678. [Google Scholar] [CrossRef]
- Trueman, C.N.; Palmer, M.R.; Field, J.; Privat, K.; Ludgate, N.; Chavagnac, V.; Eberth, D.A.; Cifelli, R.; Rogers, R.R. Comparing rates of recrystallisation and the potential for preservation of biomolecules from the distribution of trace elements in fossil bones. C. R. Palevol 2008, 7, 145–158. [Google Scholar] [CrossRef]
- Wiemann, J.; Yang, T.R.; Norell, M.A. Dinosaur egg colour had a single evolutionary origin. Nature 2018, 563, 555–558. [Google Scholar] [CrossRef] [PubMed]
- Fabbri, M.; Wiemann, J.; Manucci, F.; Briggs, D.E.G. Three-dimensional soft tissue preservation revealed in the skin of a non-avian dinosaur. Palaeontology 2019, 63, 185–193. [Google Scholar] [CrossRef]
- McCoy, V.E.; Wiemann, J.; Lamsdell, J.C.; Whalen, C.D.; Lidgard, S.; Mayer, P.; Petermann, H.; Briggs, D.E.G. Chemical signatures of soft tissues distinguish between vertebrates and invertebrates from the Carboniferous Mazon Creek Lagerstätte of Illinois. Geobiology 2020, 18, 560–565. [Google Scholar] [CrossRef] [PubMed]
- Wiemann, J.; Menéndez, I.; Crawford, J.M.; Fabbri, M.; Gauthier, J.A.; Hull, P.M.; Norell, M.A.; Briggs, D.E.G. Fossil biomolecules reveal an avian metabolism in the ancestral dinosaur. Nature 2022, 606, 522–526. [Google Scholar] [CrossRef]
- Penel, G.; Delfosse, C.; Descamps, M.; Leroy, G. Composition of bone and apatitic biomaterials as revealed by intravital Raman microspectroscopy. Bone 2005, 36, 893–901. [Google Scholar] [CrossRef]
- Thomas, G.J. Raman Spectroscopy of Proteins and Nucleic Acid Assemblies. Annu. Rev. Biophys. Biomol. Struct. 1999, 28, 1–27. [Google Scholar] [CrossRef]
- Rygula, A.; Majzner, K.; Marzec, K.M.; Kaczor, A.; Pilarczyk, M.; Baranska, M. Raman spectroscopy of proteins: A review. J. Raman Spectrosc. 2013, 44, 1061–1076. [Google Scholar] [CrossRef]
- Czamara, K.; Majzner, K.; Pacia, M.Z.; Kochan, K.; Kaczor, A.; Baranska, M. Raman spectroscopy of lipids: A review. J. Raman Spectrosc. 2015, 46, 4–20. [Google Scholar] [CrossRef]
- Yang, Q.; Wang, Y.L. Raman Spectra of Fossil Dinosaurs from Different Regions. Spectrosc. Spect. Anal. 2007, 27, 2468–2471. [Google Scholar]
- Korneisel, D.E.; Nesbitt, S.J.; Werning, S.; Xiao, S. Putative fossil blood cells reinterpreted as diagenetic structures. PeerJ 2021, 9, e12651. [Google Scholar] [CrossRef]
- Gunasekaran, S.; Anbalagan, G.; Pandi, S. Raman and infrared spectra of carbonates of calcite structure. J. Raman Spectrosc. 2006, 37, 892–899. [Google Scholar] [CrossRef]
- White, S.N. Laser Raman spectroscopy as a technique for identification of seafloor hydrothermal and cold seep minerals. Chem. Geol. 2009, 259, 240–252. [Google Scholar] [CrossRef]
- Ospitali, F.; Smith, D.C.; Lorblanchet, M. Preliminary investigations by Raman microscopy of prehistoric pigments in the wall-painted cave at Roucadour, Quercy, France. J. Raman Spectrosc. 2006, 37, 1063–1071. [Google Scholar] [CrossRef]
- Castrejón-Sánchez, V.H.; Camps, E.; Camacho-López, M. Quantification of phase content in TiO2 thin films by Raman spectroscopy. Superf. Y Vacío 2014, 27, 88–92. [Google Scholar]
- Julien, C.; Massot, M.; Poinsignon, C. Lattice vibrations of manganese oxides. Spectrochim. Acta A Mol. Biomol. Spectrosc. 2004, 60, 689–700. [Google Scholar] [CrossRef]
- Sepúlveda, M.; Gutiérrez, S.; Vallette, M.C.; Standen, V.G.; Arriaza, B.T.; Cárcamo-Vega, J.J. Micro-Raman spectral identification of manganese oxides black pigments in an archaeological context in Northern Chile. Herit. Sci. 2015, 3, 32. [Google Scholar] [CrossRef]
- Edwards, H.G.M.; Farwell, D.W.; Faria, D.L.A.D.; Monteiro, A.M.F.; Afonso, M.C.; DeBlasis, P.; Eggers, S. Raman spectroscopic study of 3000-year-old human skeletal remains from a sambaqui, Santa Catarina. J. Raman Spectrosc. 2001, 32, 17–22. [Google Scholar] [CrossRef]
- Wang, J.; Hao, X.; Kundrát, M.; Liu, Z.; Uesugi, K.; Jurašeková, Z.; Guo, B.; Hoshino, M.; Li, Y.; Monfroy, Q.; et al. Bone tissue histology of the Early Cretaceous bird Yanornis: Evidence for a diphyletic origin of modern avian growth strategies within Ornithuromorpha. Hist. Biol. 2020, 32, 1422–1434. [Google Scholar] [CrossRef]
- Niaura, G. Raman Spectroscopy in Analysis of Biomolecules. Encyclopedia of Analytical Chemistry; John Wiley & Sons: Chichester, UK, 2014; pp. 1–34. [Google Scholar]
- Li, Z.; Du, T.; Ruan, C.; Niu, X. Bioinspired mineralized collagen scaffolds for bone tissue engineering. Bioact. Mater. 2021, 6, 1491–1511. [Google Scholar] [CrossRef]
- Buchwald, T.; Niciejewksi, K.; Kozielski, M.; Szybowicz, M.; Siatkowski, M.; Krauss, H. Identifying compositional and structural changes in spongy and subchondral bone from the hip joints of patients with osteoarthritis using Raman spectroscopy. J. Biomed. Opt. 2012, 17, 017007. [Google Scholar] [CrossRef]
- Frost, R.L.; Xi, Y.; Scholz, R.; Belotti, F.M.; Dias Menezes Filho, M.A. Raman and infrared spectroscopic characterization of beryllonite, a sodium and beryllium phosphate mineral—Implications for mineral collectors. Spectrochim. Acta A Mol. Biomol. Spectrosc. 2012, 97, 1058–1062. [Google Scholar] [CrossRef] [PubMed][Green Version]
- Snoeck, C.; Lee-Thorp, J.A.; Schulting, R.J. From bone to ash: Compositional and structural changes in burned modern and archaeological bone. Palaeogeogr. Palaeoclimatol. Palaeoecol. 2014, 416, 55–68. [Google Scholar] [CrossRef]
- Golcuk, K.; Mandair, G.S.; Callender, A.F.; Sahar, N.; Kohn, D.H.; Morris, M.D. Is photobleaching necessary for Raman imaging of bone tissue using a green laser? Biochim. Biophys. Acta Biomembr. 2006, 1758, 868–873. [Google Scholar] [CrossRef] [PubMed]
- Timchenko, E.V.; Timchenko, P.E.; Volova, L.T.; Ponomareva, Y.V.; Taskina, L.A. Raman spectroscopy of the organic and mineral structure of bone grafts. Quantum Electron. 2014, 44, 696–699. [Google Scholar] [CrossRef]
- Frost, F.L.; Weier, M. Raman microscopy of autunite minerals at liquid nitrogen temperature. Spectrochim. Acta A Mol. Biomol. Spectrosc. 2004, 60, 2399–2409. [Google Scholar] [CrossRef]
- Baturin, G.N.; Dubinchuk, V.G. The Composition of Phosphatized Bones in Recent Sediments. Lithol. Miner. Resour. 2003, 38, 265–274. [Google Scholar] [CrossRef]
- Chadefaux, C.; Le Hô, A.S.; Bellot-Gurlet, L.; Reiche, I. Curve-fitting micro-ATR-FTIR studies of the amide I and II bands of type I collagen in archaeological bone materials. E-Preserv. Sci. 2009, 6, 129–137. [Google Scholar]
- Khalid, M.; Bora, T.; Al Ghaithi, A.; Thukral, S.; Dutta, J. Raman Spectroscopy detects changes in Bone Mineral Quality and Collagen Cross-linkage in Staphylococcus Infected Human Bone. Sci. Rep. 2018, 8, 9417. [Google Scholar] [CrossRef]
- Kourkoumelis, N.; Zhang, X.; Lin, Z.; Wang, J. Fourier Transform Infrared Spectroscopy of Bone Tissue: Bone Quality Assessment in Preclinical and Clinical Applications of Osteoporosis and Fragility Fracture. Clin. Rev. Bone Miner. Metab. 2019, 17, 24–39. [Google Scholar] [CrossRef]
- Talal, A.; Hamid, S.K.; Khan, M.; Khan, A.S. Structure of biological apatite: Bone and tooth. In Handbook of Ionic Substituted Hydroxyapatites; Woodhead Publishing Series in Biomaterials; Khan, A.S., Chaudhry, A.A., Eds.; Woodhead Publishing: Duxford, UK, 2020; pp. 1–19. [Google Scholar]
- Pasteris, J.D.; Wopenka, B.; Valsami-Jones, E. Bone and Tooth Mineralization: Why Apatite? Elements 2008, 4, 97–104. [Google Scholar] [CrossRef]
- Kendall, C.; Eriksen, A.M.H.; Kontopoulos, I.; Collins, M.J.; Turner-Walker, G. Diagenesis of archaeological bone and tooth. Palaeogeogr. Palaeoclimatol. Palaeoecol. 2018, 491, 21–37. [Google Scholar] [CrossRef]
- Montanari, S. Cracking the egg: The use of modern and fossil eggs for ecological, environmental and biological interpretation. R. Soc. Open Sci. 2018, 5, 180006. [Google Scholar] [CrossRef] [PubMed]
- Kafle, B.P. Raman spectroscopy. In Chemical Analysis and Material Characterization by Spectrophotometry; Elsevier: Amsterdam, The Netherlands, 2020; pp. 245–268. [Google Scholar]
- Grunenwald, A.; Keyser, C.; Sautereau, A.M.; Crubézy, E.; Ludes, B.; Drouet, C. Novel contribution on the diagenetic physicochemical features of bone and teeth minerals, as substrates for ancient DNA typing. Anal. Bioanal. Chem. 2014, 406, 4691–4704. [Google Scholar] [CrossRef] [PubMed]
- Kim, T.; Lee, Y.; Lee, Y.N. Fluorapatite diagenetic differences between Cretaceous skeletal fossils of Mongolia and Korea. Palaeogeogr. Palaeoclimatol. Palaeoecol. 2018, 490, 579–589. [Google Scholar] [CrossRef]
- Pfretzschner, H.U.; Tütken, T. Rolling bones—Taphonomy of Jurassic dinosaur bones inferred from diagenetic microcracks and mineral infillings. Palaeogeogr. Palaeoclimatol. Palaeoecol. 2011, 310, 117–123. [Google Scholar] [CrossRef]
- Dufresne, W.J.B.; Rufledt, C.J.; Marshall, C.P. Raman spectroscopy of the eight natural carbonate minerals of calcite structure. J. Raman Spectrosc. 2018, 49, 1999–2007. [Google Scholar] [CrossRef]
- Tuschel, D. Raman Spectroscopy of Oil Shale. Spectroscopy 2013, 28, 20. [Google Scholar]
- Cloutis, E.; Szymanski, P.; Applin, D.; Goltz, D. Identification and discrimination of polycyclic aromatic hydrocarbons using Raman spectroscopy. Icarus 2016, 274, 211–230. [Google Scholar] [CrossRef]
- Chen, J.; Huang, Y.W.; Zhao, Y. Characterization of polycyclic aromatic hydrocarbons using Raman and surface-enhanced Raman spectroscopy. J. Raman Spectrosc. 2015, 46, 64–69. [Google Scholar] [CrossRef]
- Culka, A.; Jehlička, J. Sequentially shifted excitation: A tool for suppression of laser-induced fluorescence in mineralogical applications using portable Raman spectrometers. J. Raman Spectrosc. 2018, 49, 526–537. [Google Scholar] [CrossRef]
- Horváth, E.; Kristóf, J.; Frost, R.L. Vibrational Spectroscopy of Intercalated Kaolinites. Part I. Appl. Spectrosc. Rev. 2010, 45, 130–147. [Google Scholar] [CrossRef]
- Salamon, M.; Tuross, N.; Arensburg, B.; Weiner, S. Relatively well preserved DNA is present in the crystal aggregates of fossil bones. Proc. Natl. Acad. Sci. USA 2005, 102, 13783–13788. [Google Scholar] [CrossRef] [PubMed]
- Menges, F. Spectragryph, Software for Optical Spectroscopy, Version 1.2.11, Oberstdorf, Germany, 2016–2019. Available online: https://spectroscopy.ninga (accessed on 1 March 2019).
- Origin 9.1, OriginLab Corporation: Northampton, MA, USA, 2013.
- Rasband, W.S. ImageJ; U.S. National Institutes of Health: Bethesda, MD, USA, 1997–2018. Available online: https://imagej.nih.gov/ij/ (accessed on 20 March 2019).


| Sample | Origin | Figure | |||
|---|---|---|---|---|---|
| Time | Place | ||||
| Subfossil bone | Sb1 | mammal | Holocene | Slovakia | Figure 2I(c) |
| Sb2 | mammal | Holocene | Slovakia | Figure 2I(d) | |
| Sb2 | Aepyornis (ratite bird) | ~1000 AD | Madagascar | --- | |
| Fossil bone | Fb1 | Yanornis (basal bird) | Mesozoic (Early Cretaceous) | Liaoning (China) | Figure 4c |
| Fb2 | Deinocheirus (ornithomimosaur dinosaur) | Mesozoic (Upper Cretaceous) | Gobi (Mongolia) | Figure 2I(e) and Figure 4a | |
| Fb3 | GSIM DB2 (reptile) | Mesozoic (Jurassic) | Kerman (Iran) | Figure 1, Figure 2I(f) and Figure 4b | |
| Fossil tooth | Ft | ceratopsian dinosaur | Mesozoic (Lower Cretaceous) | Kemerovo (Russia) | --- |
| Fossil eggshell | Fes | dinosaur | Mesozoic (Upper Cretaceous) | Inner Mongolia (China) | --- |
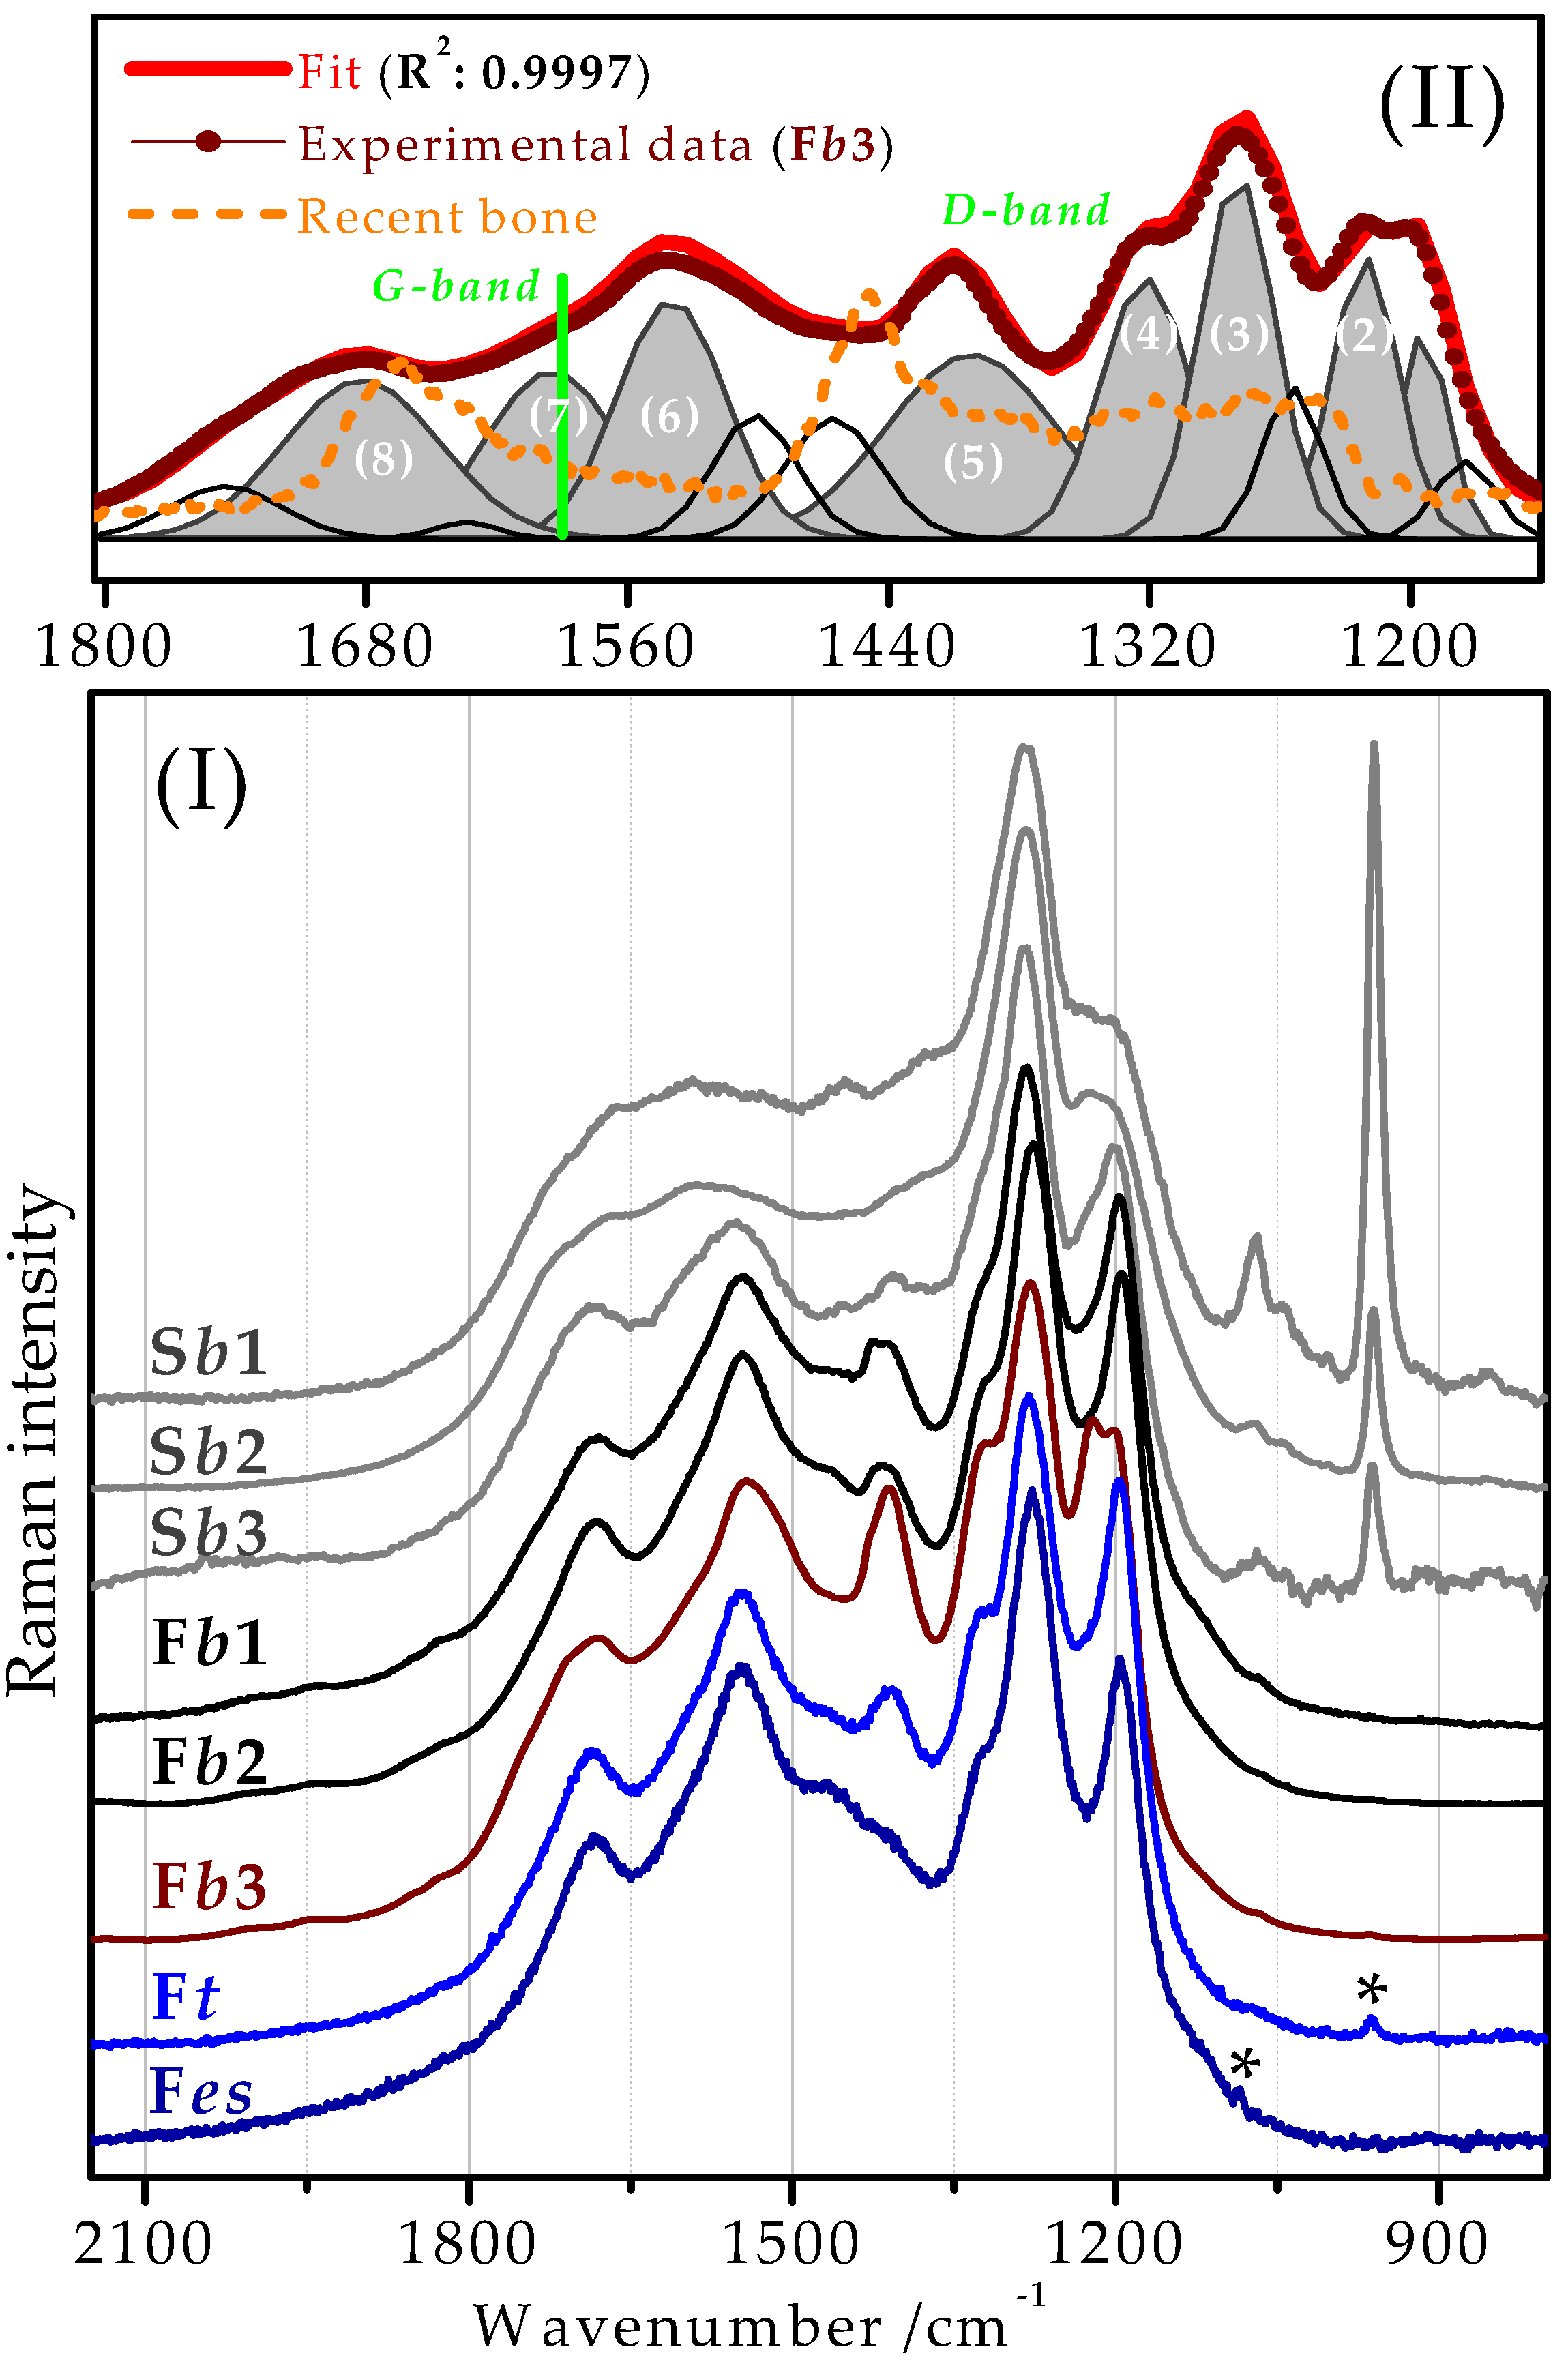
| Raman a/cm−1 | Peak Numbering and the Evidenced Frequency Shifts | Tentative Vibrational Assignment b | |
|---|---|---|---|
| 1175 wm | ν(CC), ν(COC), ν(CN) | ||
| 1197 ms | (1) | /1204 ← 1195 cm−1 | δ(CCH), δ(COC) |
| 1219 s | (2) | ν(CO), δ(CH2), δ(CH3), δ(NH2) | |
| 1253 m | ν(CO), δ(CC) | ||
| 1281 vs | (3)/1294 ← 1276 cm−1 | ν(CC), ν(CO), δ(CC) | |
| 1320 s | (4)/1320 ↔ - cm−1 | δ(CH), δ(CN) | |
| 1399 ms, br | (5)/1406 → 1418 cm−1 | ) | |
| 1466 m | δ(OH), δ(CH2), δas(CH3) | ||
| 1499 m | |||
| 1539 ms | (6)/1551 ← 1546 cm−1 | δs(NH), δ(CN) | |
| 1595 m, br | (7)/-------- - ---------- | ν(C=C) | |
| 1634 vw | ) | ||
| 1685 m, br | (8)/1689 ← 1680 cm−1 | ) | |
| 1746 wm, br | ν(C=O) | ||
Publisher’s Note: MDPI stays neutral with regard to jurisdictional claims in published maps and institutional affiliations. |
© 2022 by the authors. Licensee MDPI, Basel, Switzerland. This article is an open access article distributed under the terms and conditions of the Creative Commons Attribution (CC BY) license (https://creativecommons.org/licenses/by/4.0/).
Share and Cite
Jurašeková, Z.; Fabriciová, G.; Silveira, L.F.; Lee, Y.-N.; Gutak, J.M.; Ataabadi, M.M.; Kundrát, M. Raman Spectra and Ancient Life: Vibrational ID Profiles of Fossilized (Bone) Tissues. Int. J. Mol. Sci. 2022, 23, 10689. https://doi.org/10.3390/ijms231810689
Jurašeková Z, Fabriciová G, Silveira LF, Lee Y-N, Gutak JM, Ataabadi MM, Kundrát M. Raman Spectra and Ancient Life: Vibrational ID Profiles of Fossilized (Bone) Tissues. International Journal of Molecular Sciences. 2022; 23(18):10689. https://doi.org/10.3390/ijms231810689
Chicago/Turabian StyleJurašeková, Zuzana, Gabriela Fabriciová, Luis F. Silveira, Yuong-Nam Lee, Jaroslav M. Gutak, Majid Mirzaie Ataabadi, and Martin Kundrát. 2022. "Raman Spectra and Ancient Life: Vibrational ID Profiles of Fossilized (Bone) Tissues" International Journal of Molecular Sciences 23, no. 18: 10689. https://doi.org/10.3390/ijms231810689
APA StyleJurašeková, Z., Fabriciová, G., Silveira, L. F., Lee, Y.-N., Gutak, J. M., Ataabadi, M. M., & Kundrát, M. (2022). Raman Spectra and Ancient Life: Vibrational ID Profiles of Fossilized (Bone) Tissues. International Journal of Molecular Sciences, 23(18), 10689. https://doi.org/10.3390/ijms231810689