Article

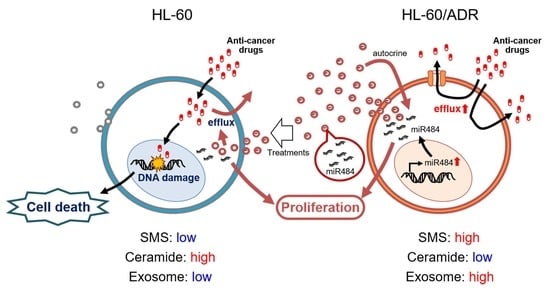
Ceramide Metabolism Regulated by Sphingomyelin Synthase 2 Is Associated with Acquisition of Chemoresistance via Exosomes in Human Leukemia Cells

1
Medical Research Institute, Kanazawa Medical University, Uchinada 920-0293, Japan
2
Research Institute for Bioresources and Biotechnology, Ishikawa Prefectural University, Nonoichi 921-8836, Japan
3
Material Research Department, Shalom Co., Ltd., Oshino 401-0511, Japan
4
Lipid Biofunction Section, Frontier Research Center for Advanced Material and Life Science, Faculty of Advanced Life Science, Hokkaido University, Sapporo 001-0021, Japan
5
Department of Hematological Malignancy, Institute of Medical Sciences, Tokai University, Isehara 259-1193, Japan
*
Author to whom correspondence should be addressed.
Int. J. Mol. Sci. 2022, 23(18), 10648; https://doi.org/10.3390/ijms231810648
Submission received: 16 August 2022 / Revised: 7 September 2022 / Accepted: 10 September 2022 / Published: 13 September 2022
(This article belongs to the Special Issue Advances in Ceramide Properties in Biological Processes)

Abstract

:
Ceramide levels controlled by the sphingomyelin (SM) cycle have essential roles in cancer cell fate through the regulation of cell proliferation, death, metastasis, and drug resistance. Recent studies suggest that exosomes confer cancer malignancy. However, the relationship between ceramide metabolism and exosome-mediated cancer malignancy is unclear. In this study, we elucidated the role of ceramide metabolism via the SM cycle in exosomes and drug resistance in human leukemia HL-60 and adriamycin-resistant HL-60/ADR cells. HL-60/ADR cells showed significantly increased exosome production and release compared with parental chemosensitive HL-60 cells. In HL-60/ADR cells, increased SM synthase (SMS) activity reduced ceramide levels, although released exosomes exhibited a high ceramide ratio in both HL-60- and HL-60/ADR-derived exosomes. Overexpression of SMS2 but not SMS1 suppressed intracellular ceramide levels and accelerated exosome production and release in HL-60 cells. Notably, HL-60/ADR exosomes conferred cell proliferation and doxorubicin resistance properties to HL-60 cells. Finally, microRNA analysis in HL-60 and HL-60/ADR cells and exosomes showed that miR-484 elevation in HL-60/ADR cells and exosomes was associated with exosome-mediated cell proliferation. This suggests that intracellular ceramide metabolism by SMS2 regulates exosome production and release, leading to acquisition of drug resistance and enhanced cell proliferation in leukemia cells.

Graphical Abstract

1. Introduction

Ceramides are classified as sphingolipids and are bioactive lipids involved in cell death, inflammation, and autophagy as well as functioning as major components of the cellular membrane including the plasma membrane [1]. In particular, increased cellular ceramides in response to numerous cellular stimuli such as anti-cancer drugs induce various types of cell death including apoptosis, necroptosis, ferroptosis, and autophagy-regulated cell death [2]. Ceramides are generated from three pathways: de novo synthesis from L-serine and palmitoyl-CoA; the salvage pathway through recycling of other sphingolipids such as glucosylceramide (GC); and the ceramide/sphingomyelin (SM) cycle utilizing sphingomyelin hydrolysis by sphingomyelinase (SMase) [2,3]. Previously, we found that malignant drug-resistant leukemia cells maintained low levels of ceramides via enhancing SM synthesis by SM synthase (SMS) and GC synthesis by GC synthase (GCS) to prevent ceramide-mediated cell death induced by anti-cancer drugs [4]. In addition, ceramide generation from SM hydrolysis by SMase involves the suppression of cancer progression through induction of cell death in response to anti-cancer treatments such as agents or irradiation [2].
Exosomes are small double-membrane bound vesicles (30–150 nm in diameter) that are derived from endosomes and are released from cells [5]. Extracellular exosomes act as intercellular transporters of cellular cargo such as proteins, mRNA, microRNA, and lipids [5,6]. Many studies accumulated evidence that exosomes are involved in cancer malignancy by controlling cancer cell proliferation, cancer metastasis, and drug resistance via the delivery of their contents [7,8].
Recent research has revealed that exosomes are formed and released through multiple molecular mechanisms. One well-established pathway uses the endosomal sorting complex required for the transport (ESCRT)-dependent pathway. In the ESCRT pathway, four protein complexes (ESCRT-0, -I, II, and -III) are involved in exosome formation in early endosome and cargo sorting [5,9]. As in other pathways, membrane lipids and their metabolic enzymes have been reported to be associated with exosome formation and release [10,11]. In particular, ceramide biogenesis through the ceramide/SM cycle mediates the curvature and budding of vesicles [12]. In this pathway, suppression of ceramide generation by inhibition of neutral SMase (nSMase2) results in the decrease in exosome release. SMase-generated ceramides enhanced exosome release to transfer miRNAs [13,14]. Therefore, evidence is accumulating that the production and release of exosomes regulated by ceramide generation through the SM cycle is involved in various cellular physiological functions. Yuyama et al. demonstrated that regulation of neuron-derived exosome release by the SM cycle involves clearance of amyloid β-peptide [15]. In cancer, neutral SMase2-dependent exosomal transfer of miRNA enhances angiogenesis and cancer metastasis [16]. Inversely, treatment of extracellular C6-ceramide suppresses the proliferation and angiogenic activity of human multiple myeloma cells through the enhancement of exosome release containing tumor-suppressive miRNAs [17,18]. However, little is known about how intracellular ceramide production via the ceramide/SM cycle is associated with anti-cancer drug resistance and cancer malignancy through exosome generation and release.
Therefore, we examined this mechanism by utilizing drug-resistant human leukemia HL-60/ADR cells, which show resistance to anti-cancer drugs including adriamycin through an enhanced drug-efflux pump function, and their parental drug-sensitive HL-60 cells. In particular, the effect of intracellular ceramide metabolism by the ceramide/SM cycle on exosome production and release was investigated. In addition, we attempted to elucidate exosomal functions related to the drug resistance and cancer cell proliferation by comparing the composition of microRNAs (miRNAs) in exosomes and cells.

2. Results

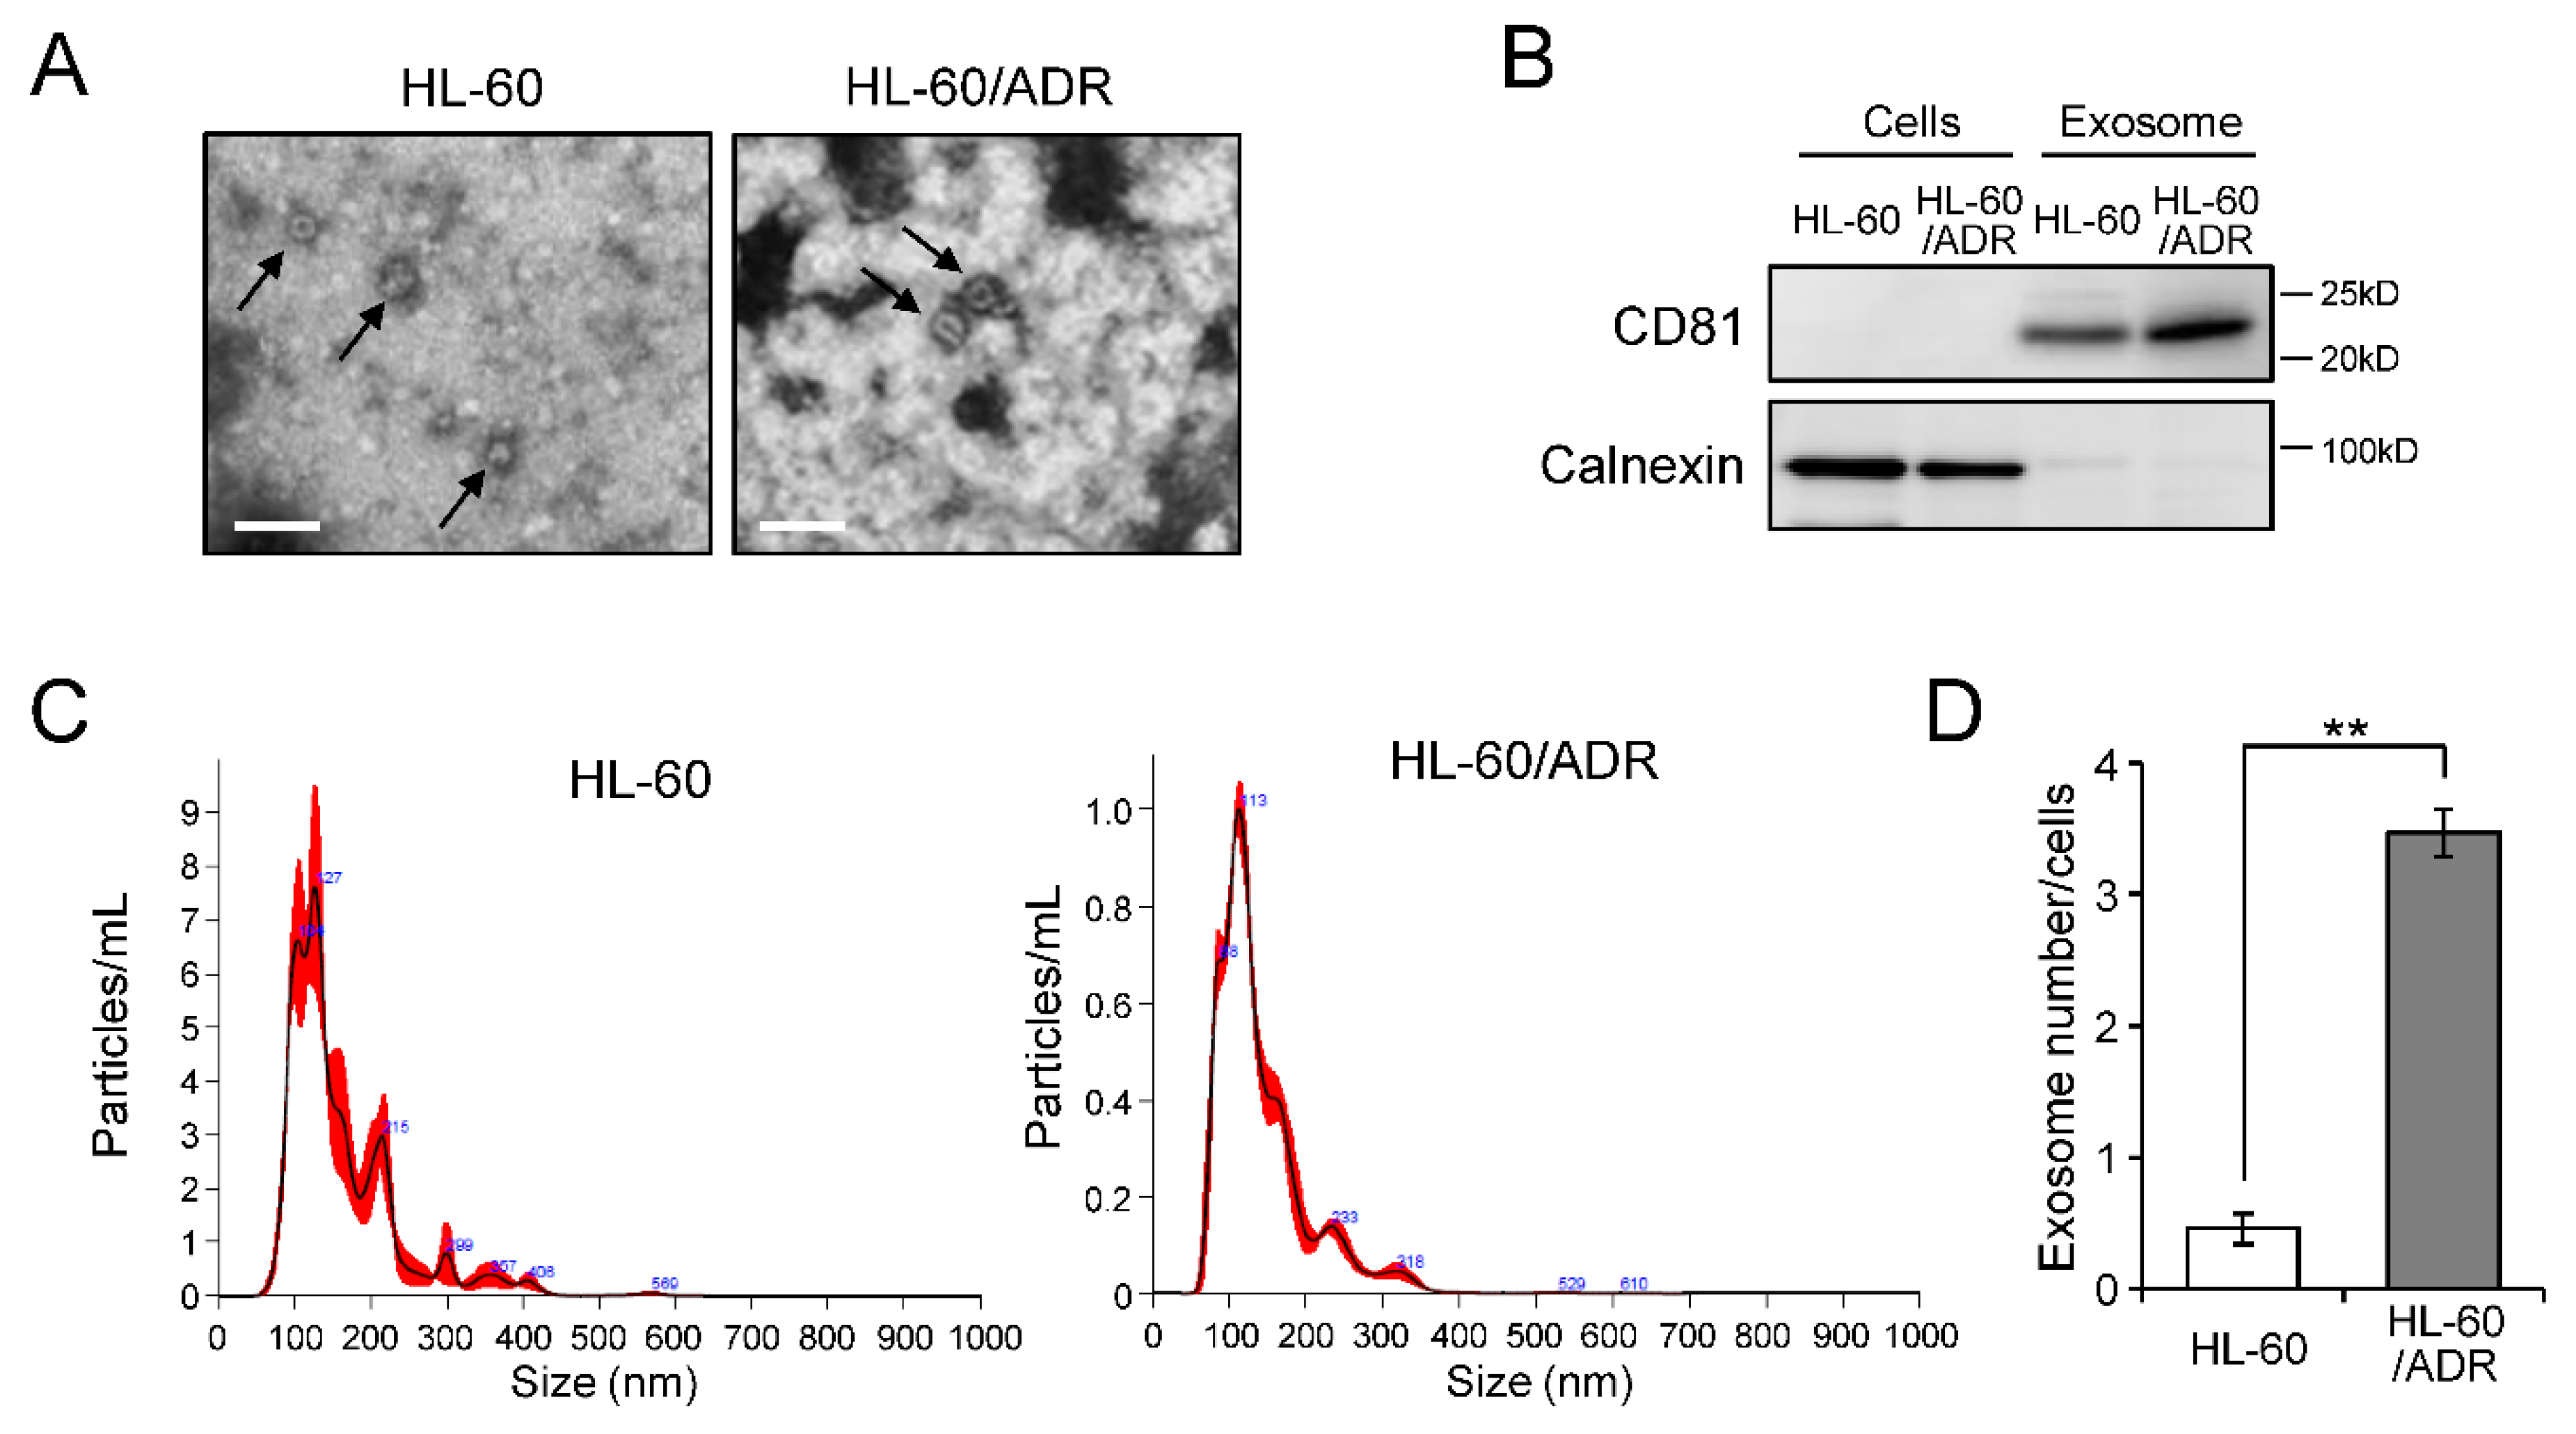
2.1. Exosome Release Is Promoted in Drug-Resistant Leukemia Cells

To examine the relationship between exosome production and the drug resistance of leukemia cells, we extracted exosomes from drug-sensitive HL-60 cells and adriamycin-resistant HL-60/ADR cells by ultracentrifugation. Exosomes extracted from both HL-60 and HL-60/ADR cells were detected as <200 nm particles under transmission electron microscopy (Figure 1A). Western blot analysis showed that exosomal marker CD81 was detected in exosomes without contamination of cellular organelles (Figure 1B and Figure S1). We then compared the size and number of HL-60 and HL-60/ADR exosomes by nanoparticle tracking analysis (Figure 1C,D). Although exosome size was the same between HL-60 cells and HL-60/ADR cells, at 100–200 nm, exosome numbers of HL-60/ADR cells were clearly higher than that of HL-60 cells (p = 0.0022) (Figure 1D). These results indicated that exosome release is more active in drug-resistant HL-60/ADR cells than in parental HL-60 cells.

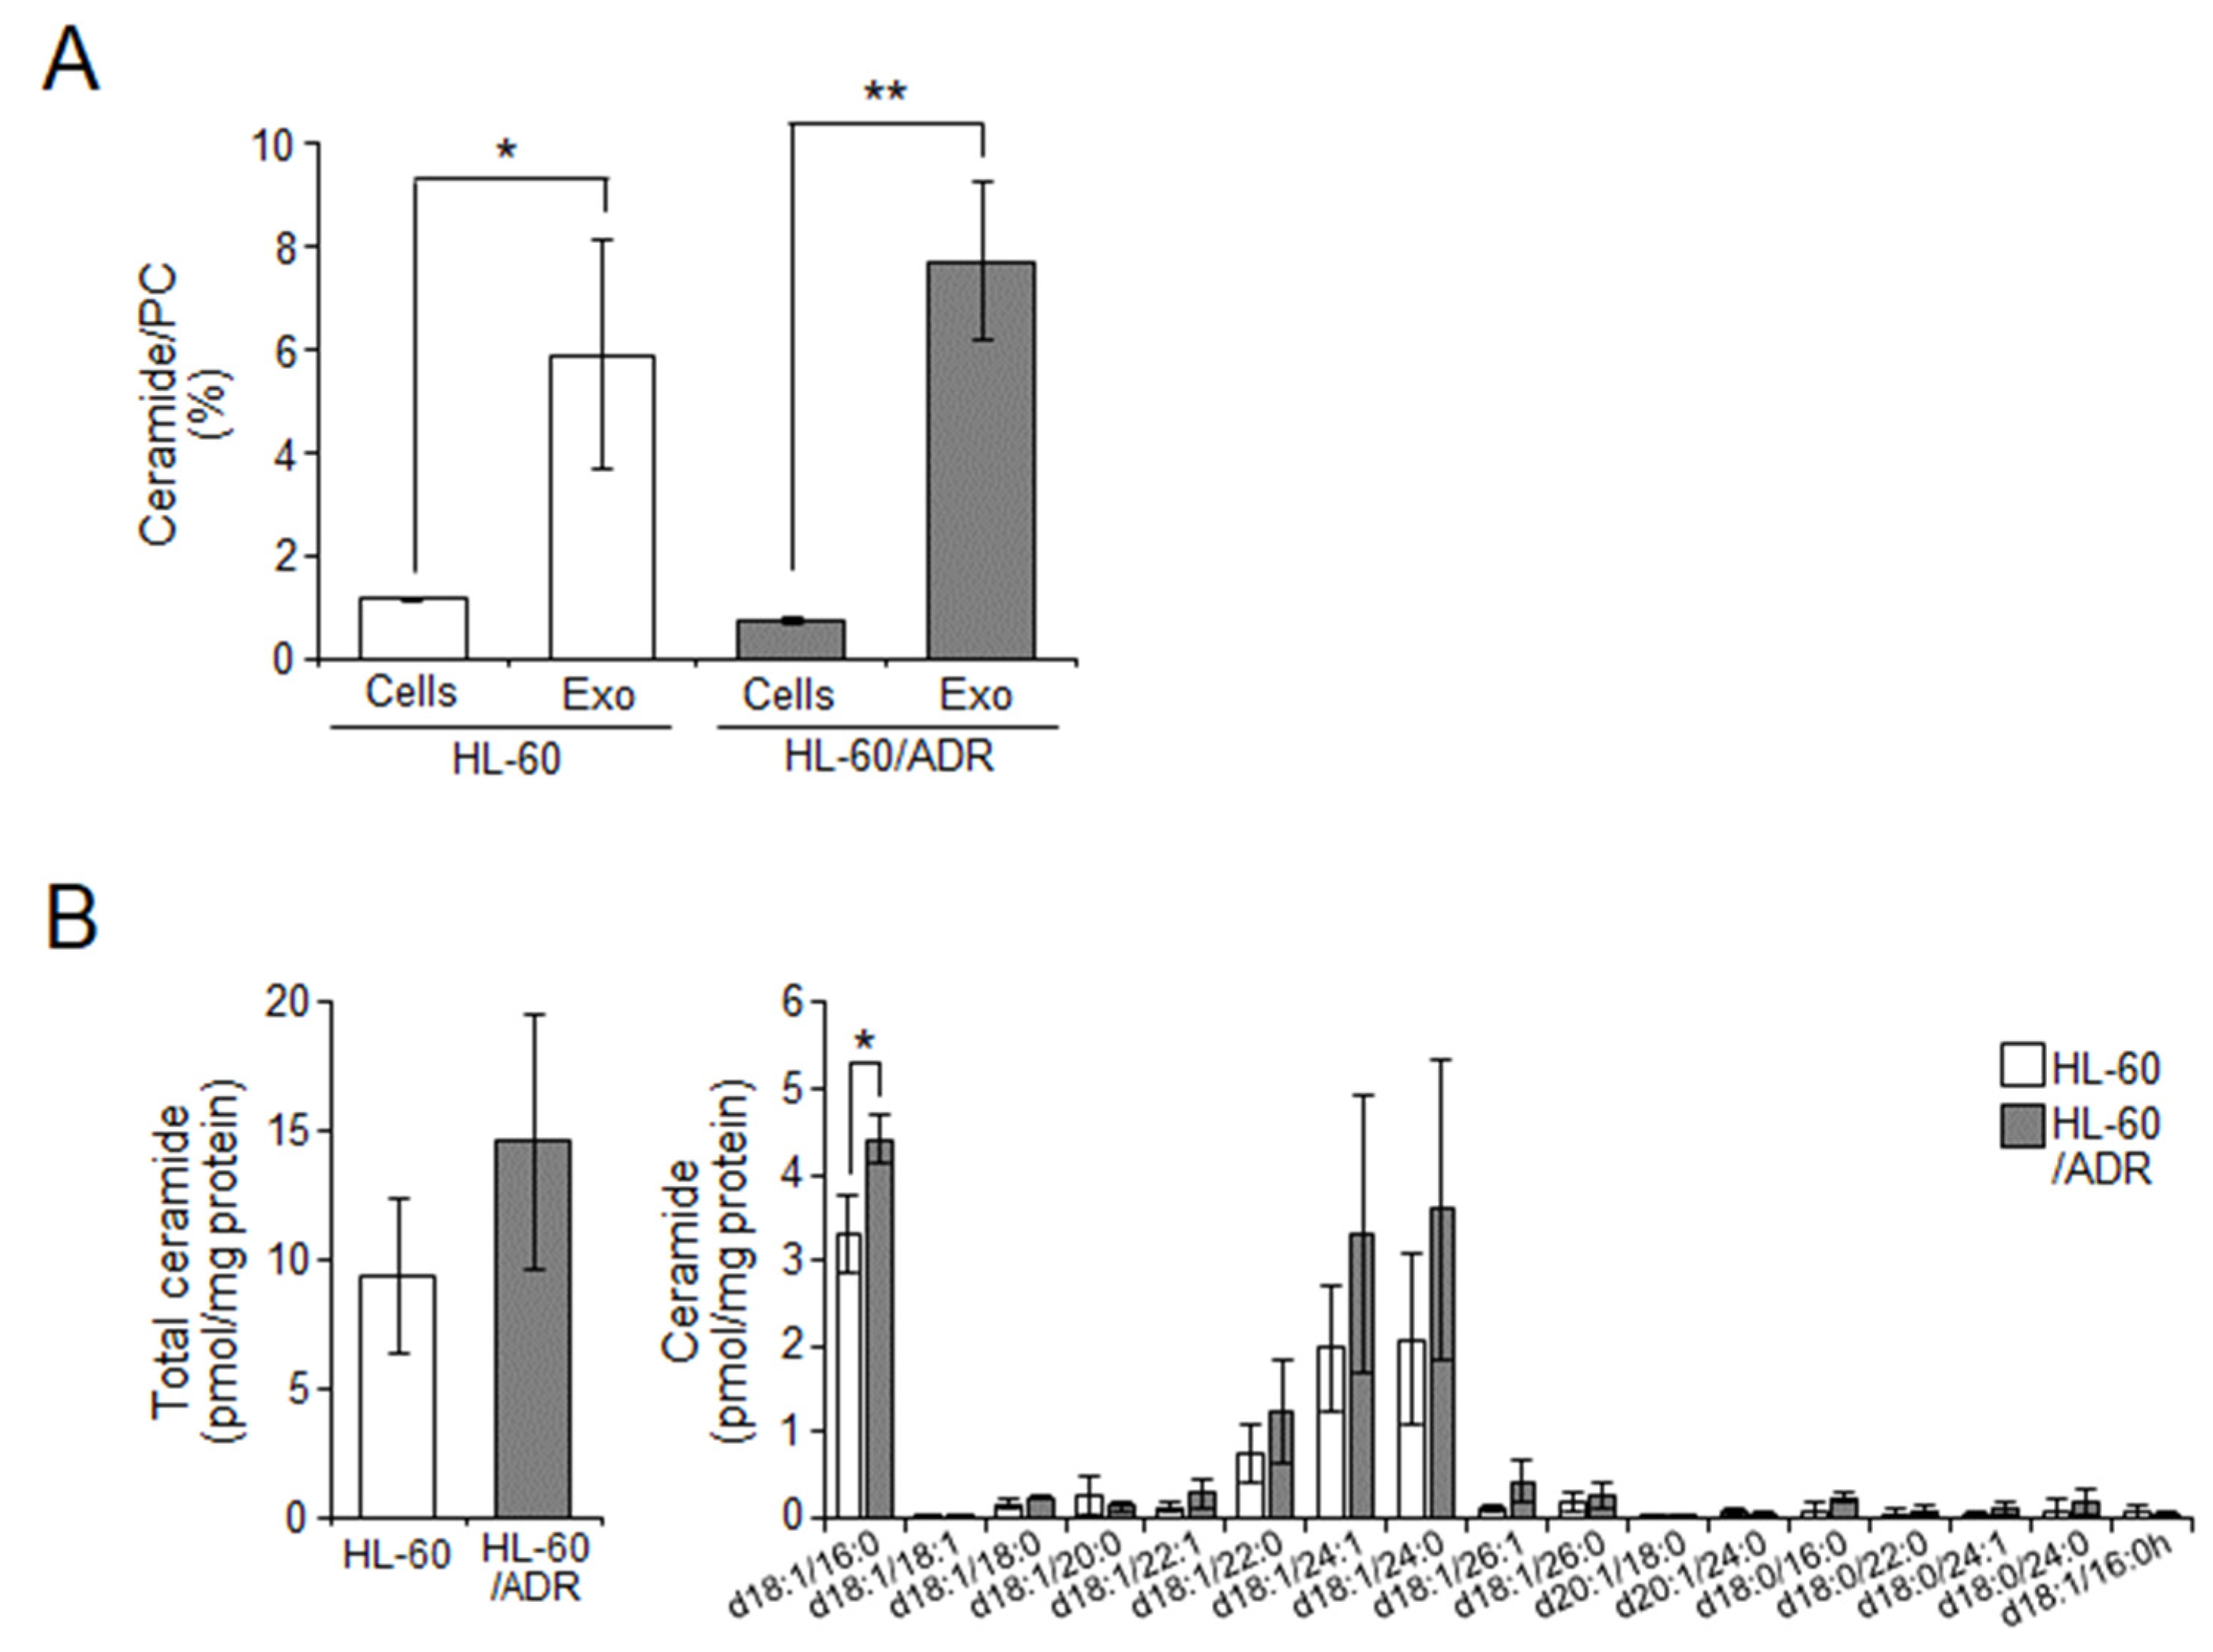
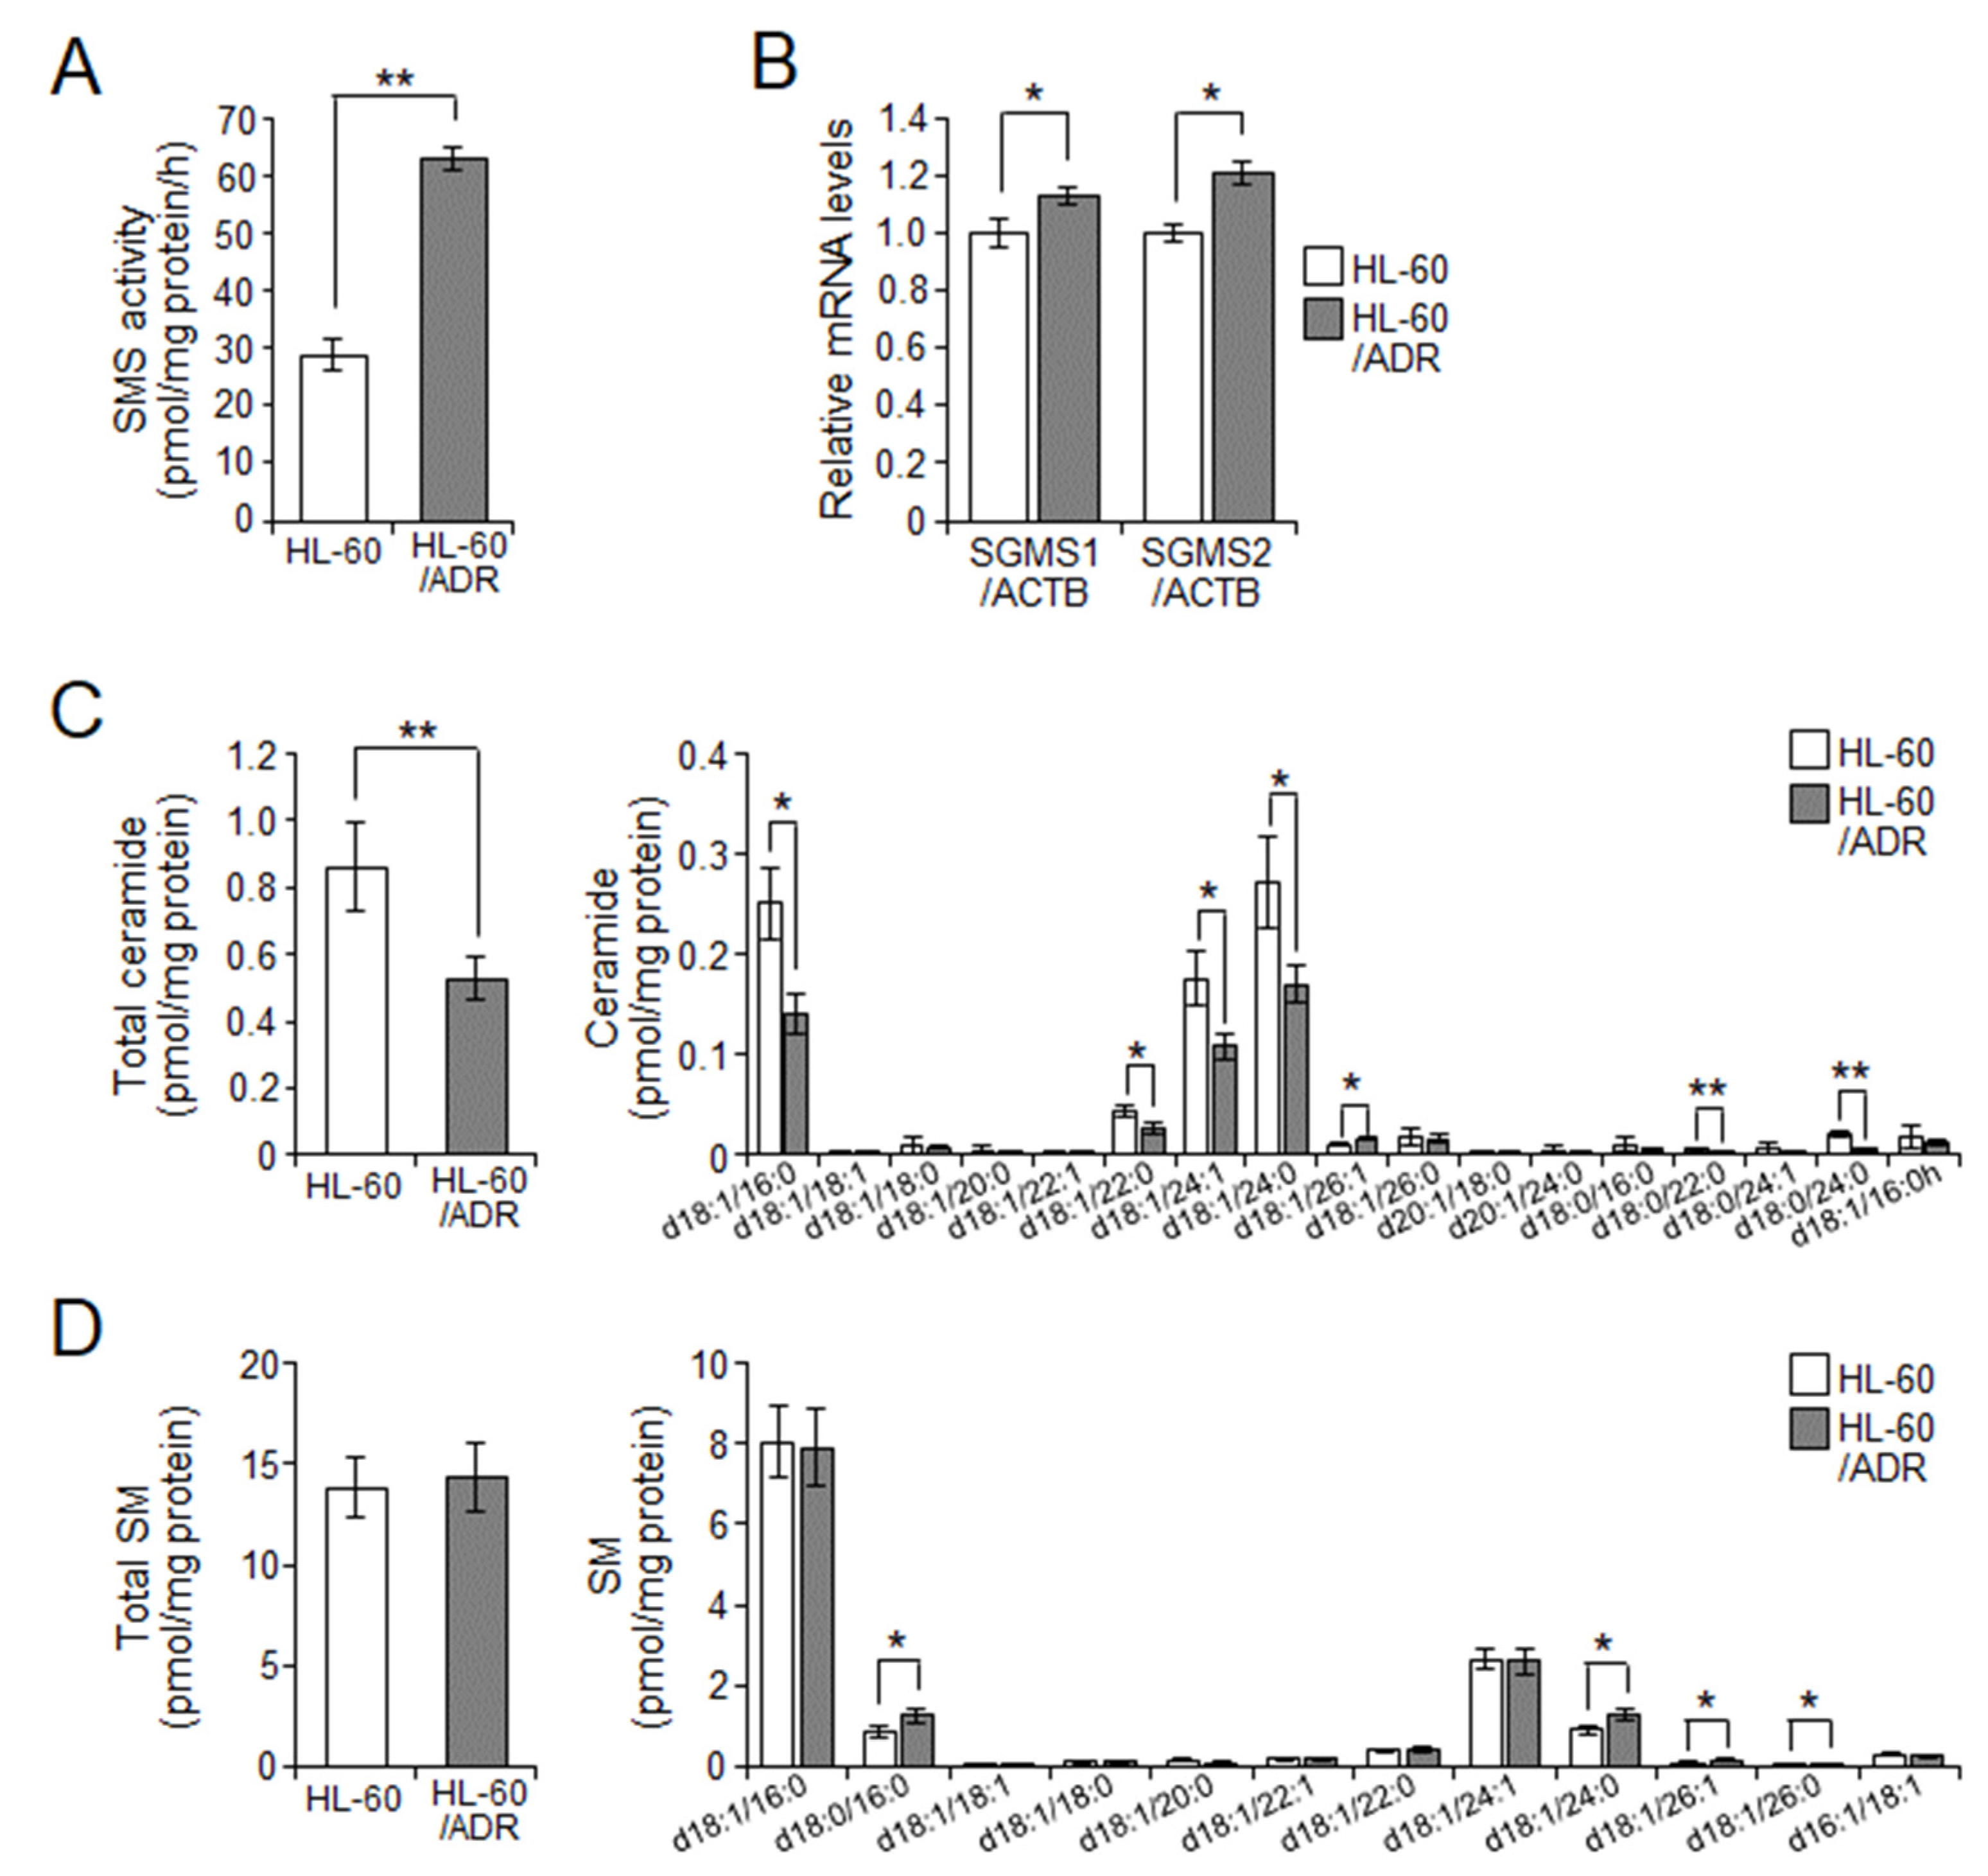
2.2. Cellular Ceramide Levels Are Related to Exosome Release in HL-60/ADR Cells

Several reports have shown that cellular ceramides are related to exosome budding and their release from cells [12]. In addition, it has been reported that the amount and ratio of exosomal ceramides were high in metastatic colorectal cancer (CRC) cells or CRC patients compared with those in non-metastatic CRC cells or healthy cells [19]. Therefore, considering whether the ceramide ratio in exosomes affects exosome production and release, we next examined ceramide contents in exosomes and cells by liquid chromatography tandem mass spectrometry (LC-MS/MS). As expected, exosomes showed a higher ratio of ceramides than the cells of both lines (Figure 2A,B). However, the d18:1/d16:0 ceramide ratio was a little higher in HL-60/ADR exosomes than in HL-60 exosomes (Figure 2B). These data suggested that the ceramide contents of exosomes do not determine exosome release from cells in drug-resistant leukemia cells.
It is known that SMS2, an SMS isoform, is involved in exosome production and its budding through SM and ceramide generation [15]. In addition, we previously showed that HL-60/ADR cells have higher SMS and GCS activity and lower ceramide levels compared with HL-60 cells (Figure 3A and Figure S2A,B) [4]. Therefore, we examined SM and ceramide production through SMS in HL-60 and HL-60/ADR cells (Figure 3). SMS has two isoforms, SMS1 and SMS2, which synthesize SM from ceramides and phosphatidylcholine [20]. As shown in Figure 3B, the expression of both SMS1 (SGMS1) and SMS2 (SGMS2) was higher in HL-60/ADR cells than in HL-60 cells. We next measured sphingolipid contents in HL-60 and HL-60/ADR cells by LC-MS/MS. Consistent with our previous data, ceramides, which are substrates of SMS, were decreased in HL-60/ADR cells compared with those in HL-60 cells (Figure 3C). However, total SM contents in HL-60/ADR cells were the same as that in HL-60 cells, even though some species of SM including d18:0/16:0, d18:1/24:0, d18:1/26:1, and d18:1/26:0 were higher in HL-60/ADR cells than in HL-60 cells (Figure 3D). In addition, GC levels were also unchanged between HL-60 and HL-60/ADR cells, although GCS activity in HL-60/ADR cells was higher than that in HL-60 cells (Figure S2A,B). These data suggested that suppression of intracellular ceramide levels through enhancement of SMS activity may be related to the elevation of exosome production and release in HL-60/ADR cells.

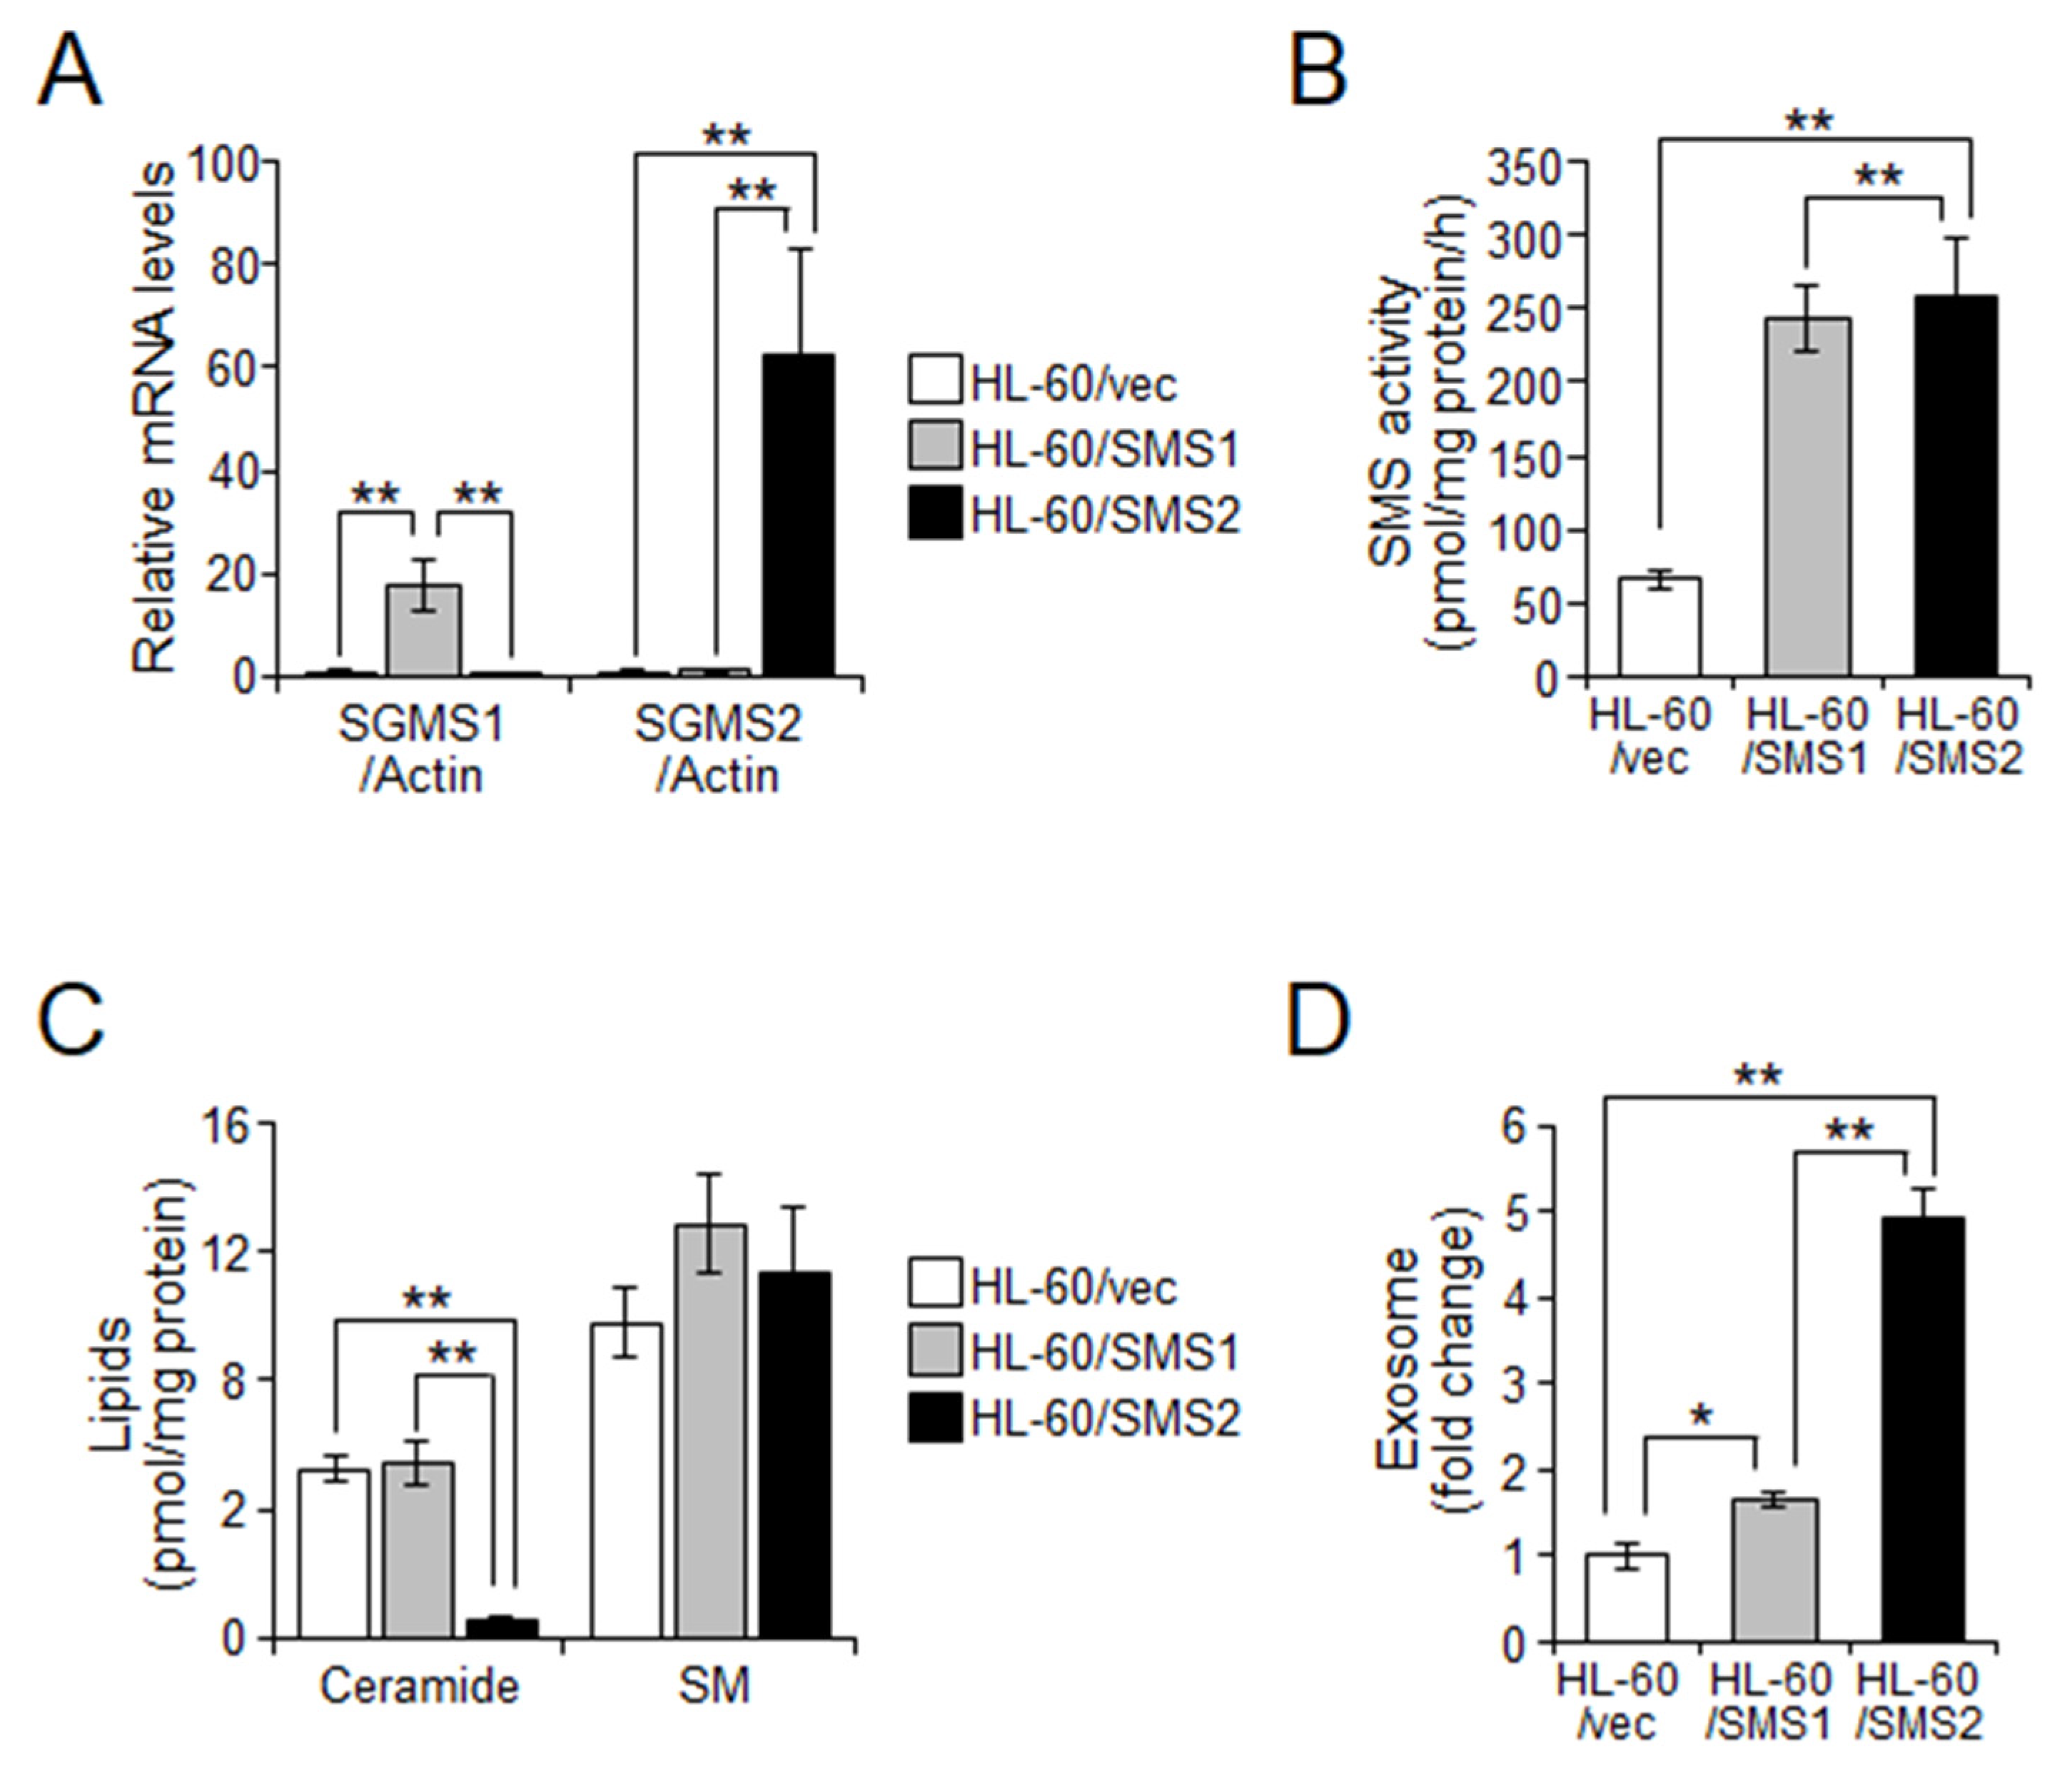
2.3. SMS2 Contributes to Exosome Release by Suppression of Ceramide Levels

The above data demonstrated the possibility that intracellular ceramides enhanced exosome release in drug-resistant cells. Therefore, to examine whether the suppression of ceramide levels by increased SMS activity affects exosome release, we established HL-60 cells expressing SMS1 or SMS2 (Figure 4A). In HL-60 cells, both SMS1 and SMS2 similarly increased SMS activity (Figure 4B). However, ceramide levels were decreased only when SMS2 was overexpressed but not SMS1 (Figure 4C). SM levels were unchanged when both SMS1 and SMS2 were overexpressed (Figure 4C). Next, we elucidated exosome release in SMS-overexpressing cells. As shown in Figure 4D, HL-60/SMS2 cells showed a 4.951 ± 0.342-fold increase in the number of released exosomes compared with HL-60/vec cells and a 2.992 ± 0.207-fold increase over HL-60/SMS1 cells. However, SMS1 overexpression also slightly increased exosome release (1.654 ± 0.088-fold). These data suggested that SMS2 mainly regulates exosome release from cells through suppression of ceramide levels.

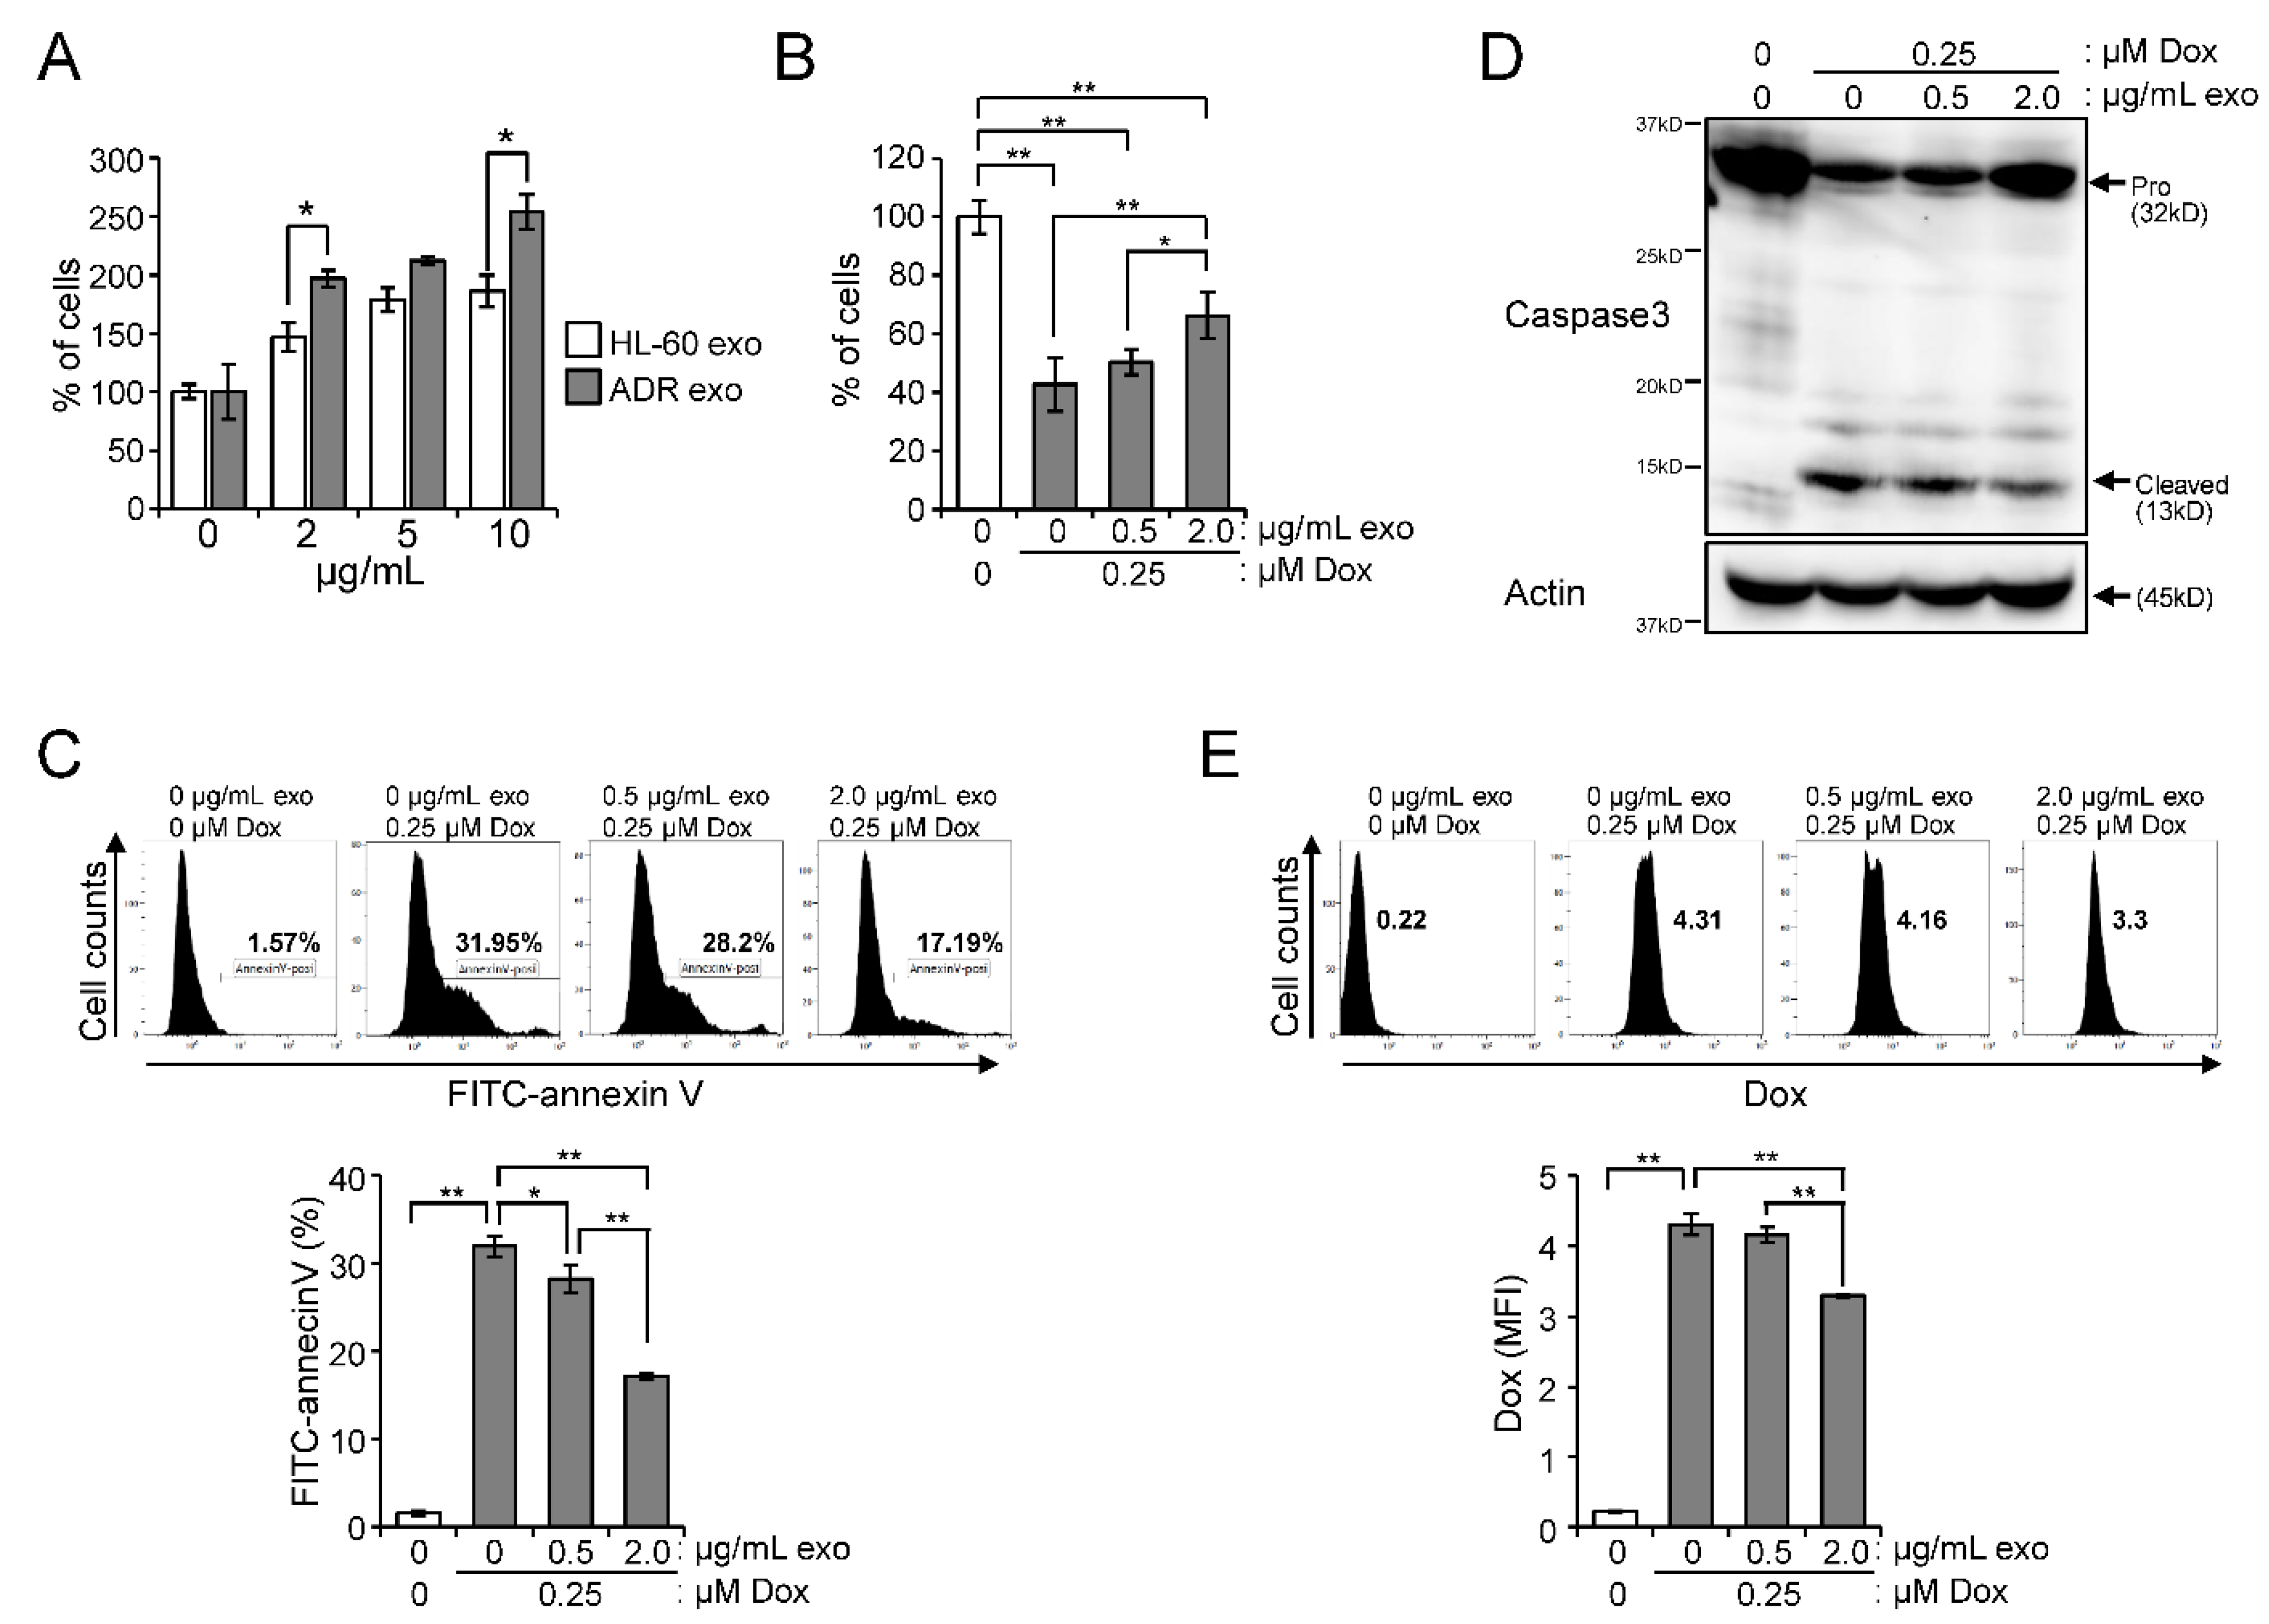
2.4. Effect of Exosomes Derived from HL-60/ADR Cells on Cell Proliferation and Drug Resistance

To investigate how exosomes of HL-60/ADR are associated with cancer cell proliferation and anti-cancer drug resistance, we treated HL-60 cells with exosomes extracted from HL-60 or HL-60/ADR cell culture media. Although treatment with both HL-60 and HL-60/ADR exosomes induced the proliferation of HL-60 cells in serum-free conditions, the effect was higher with HL-60/ADR exosomes than with HL-60 exosomes (Figure 5A). Doxorubicin (Dox), which is major anti-cancer drug against leukemia, induced apoptosis in HL-60 cells, while HL-60/ADR cells had resistance against Dox (Figure 5B,C and Figure S3). As expected, HL-60 exosome treatment did not confer the resistance to Dox on HL-60 ells (Figure S4). In contrast, treatment with HL-60/ADR exosomes decreased cell death induced by Dox in HL-60 cells (Figure 5B,C). In addition, HL-60/ADR exosomes suppressed caspase-3 activation induced by Dox in HL-60 cells (Figure 5D). Next, to examine whether drug elimination is enhanced by HL-60/ADR exosome treatment in HL-60 cells, the captured Dox was detected by flow cytometry. The remaining intracellular Dox was higher in HL-60 cells than in HL-60/ADR cells (Figure 5E and Figure S3D). Intracellular Dox fluorescence was decreased in HL-60 cells treated with HL-60/ADR exosomes (Figure 5E). These data suggested that HL-60/ADR exosomes confer drug-resistant properties to drug-sensitive HL-60 cells by enhancing the Dox elimination.

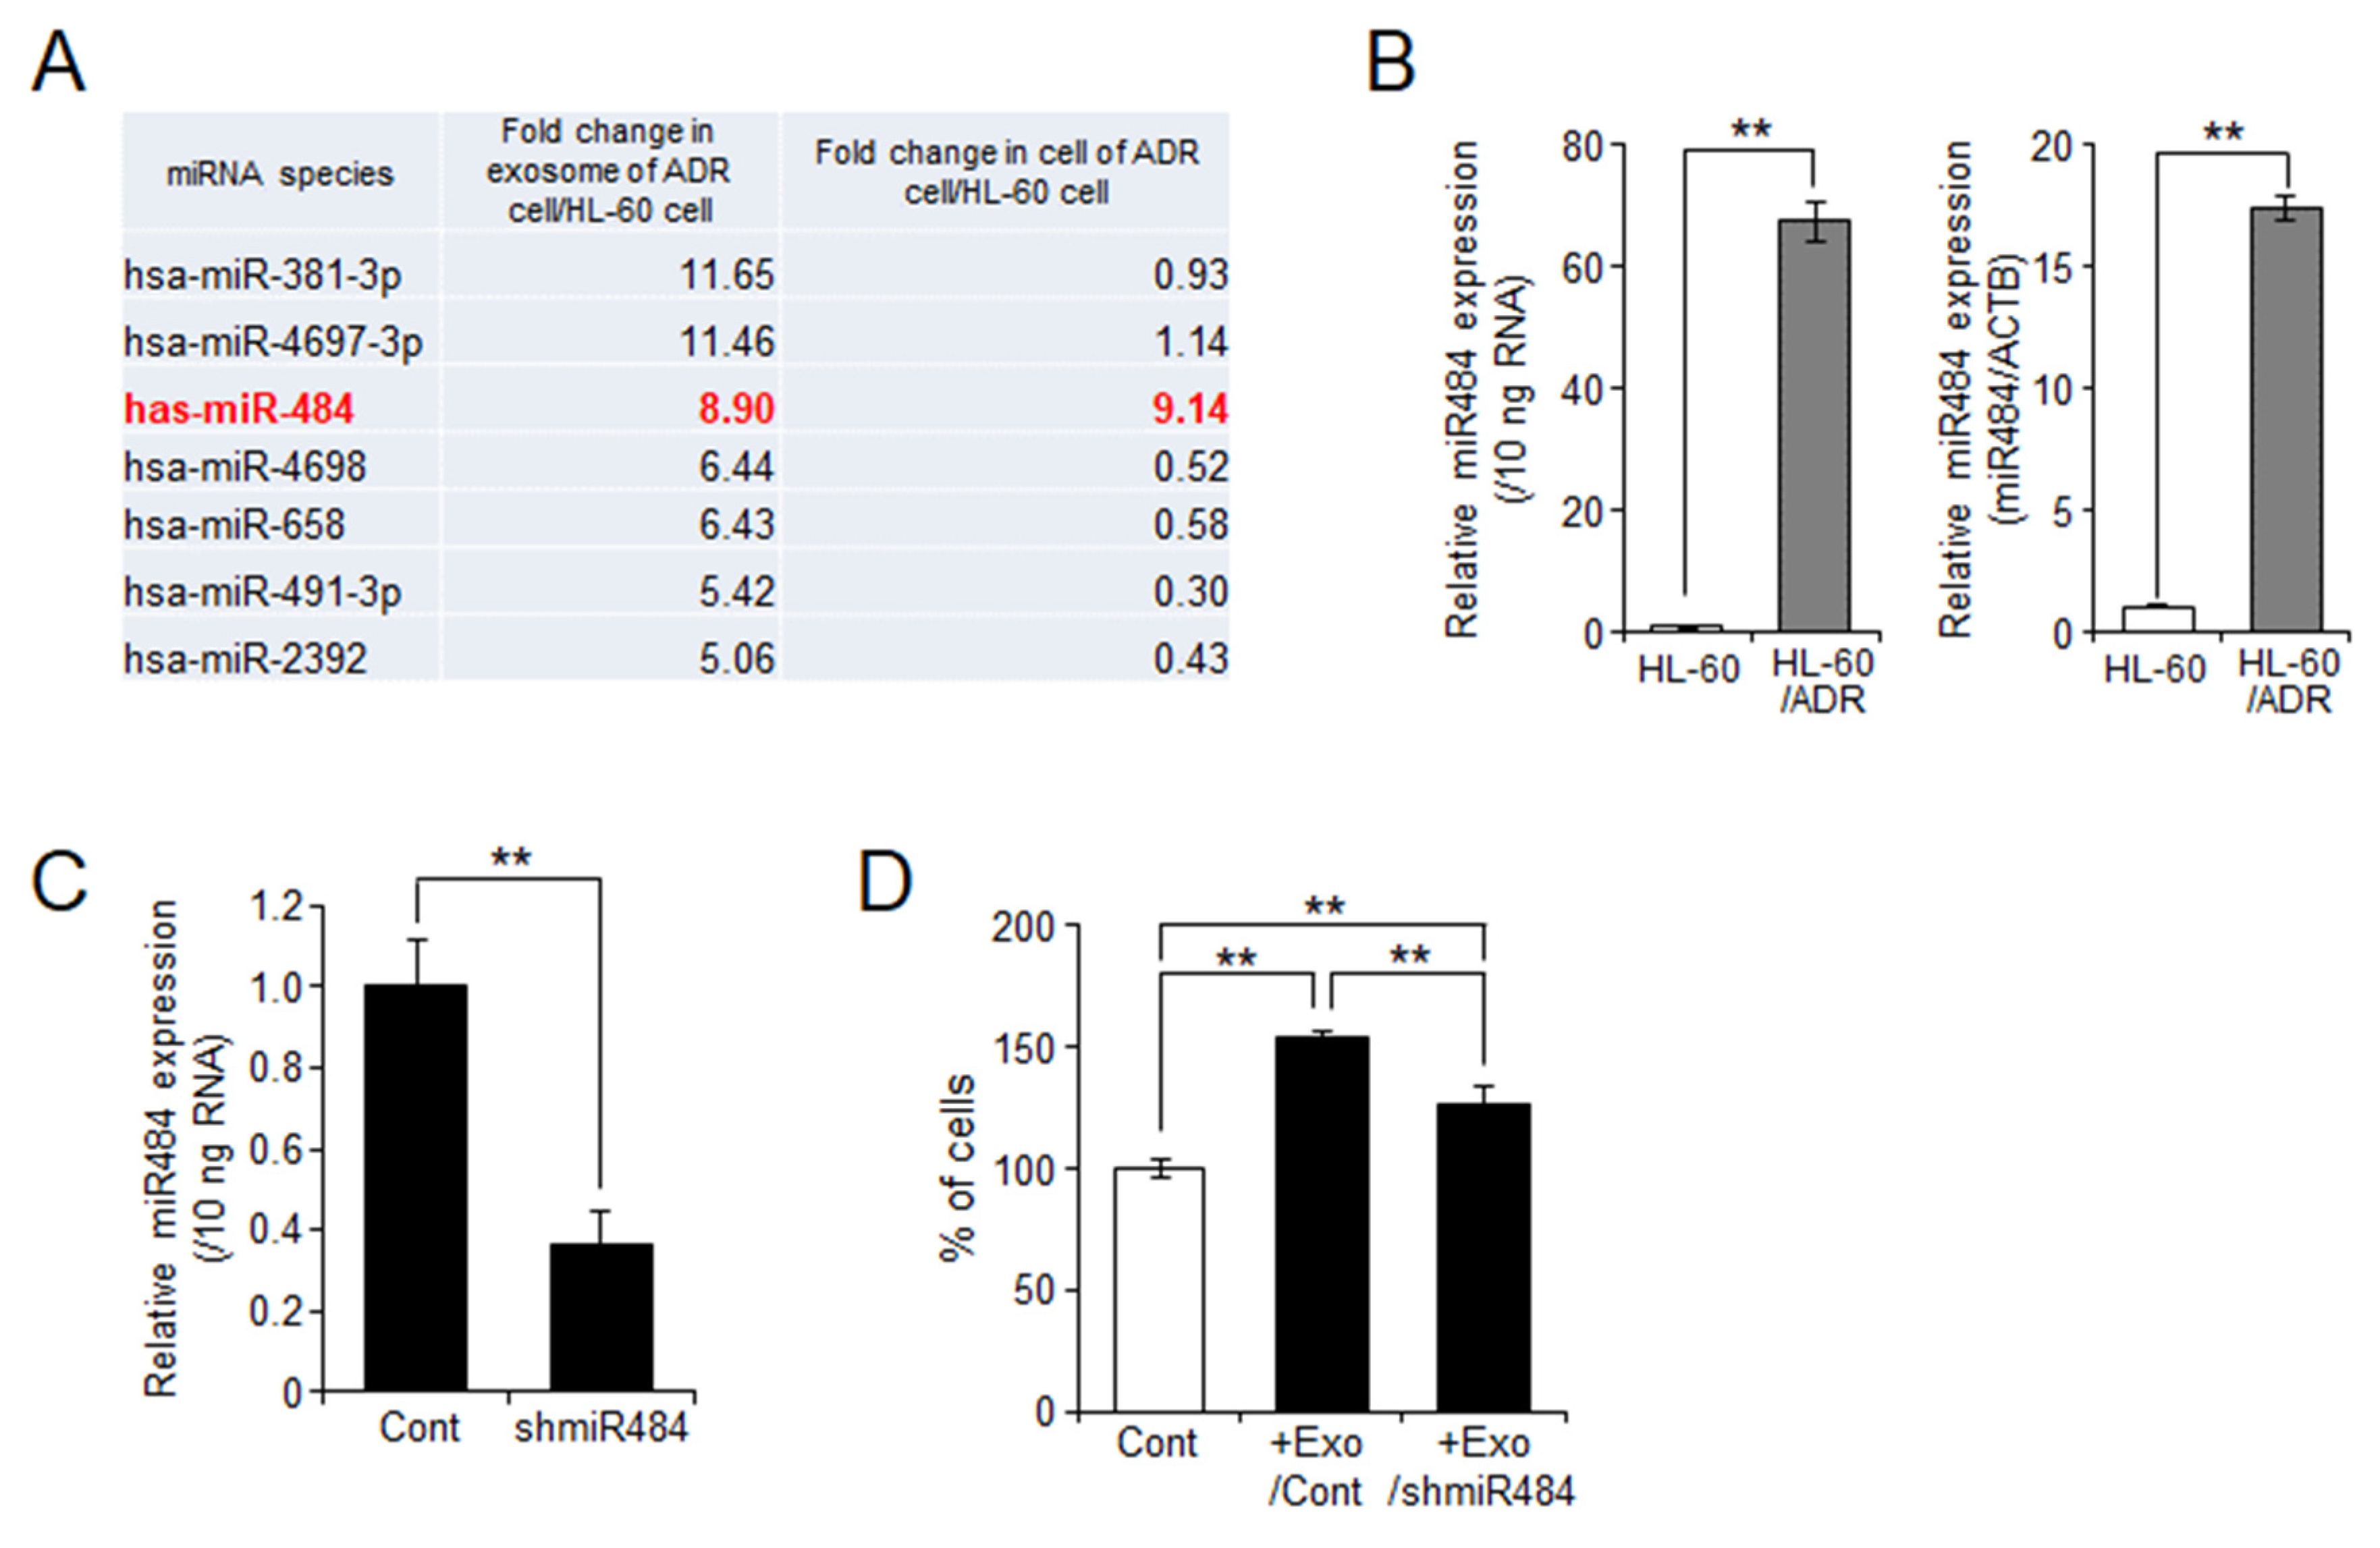
2.5. miR-484 Is Associated with HL-60 Cell Proliferation through Exosomes

The above data showed that HL-60/ADR exosomes induced cell proliferation more strongly than HL-60 exosomes (Figure 5A). miRNAs were recently demonstrated to be involved in cancer cell proliferation [21]. To elucidate the differences between HL-60 and HL-60/ADR exosomes, we compared exosomal and cellular miRNA expression in HL-60 and HL-60/ADR cells by miRNA microarray. In the exosomes of HL-60/ADR cells, we identified seven miRNA candidates (miR-381-3p, miR-4697-3p, miR-484, miR-4698, miR-658, miR491-3p, and miR2392) with more than five-fold higher expression than in HL-60 cells (Figure 6A). Among them, miR-484 only showed higher expression in both exosomes and cells. qPCR analysis confirmed elevation of miR-484 expression in HL-60/ADR exosomes and cells compared with that in HL-60 cells (Figure 6B). To analyze the function of miR-484 in cell proliferation in more detail, we performed miR-484 knockdown in human embryonic kidney fibroblast HEK293 cells, which express miR-484. miR-484 expression in the exosomes was decreased in miR-484-knockdown HEK293 cells compared with that in the control cells (Figure 6C). Finally, we examined the effects of exosomal miR-484 levels on HL-60 cell proliferation. As shown in Figure 6D, control exosomes extracted from HEK293/control cells (Exo/Cont) increased the proliferation of HL-60 cells. However, miR-484-knockdown exosomes (Exo/shmiR-484) had a lower effect on HL-60 cell proliferation (Figure 6D). These results suggested that miR-484, which is highly expressed in HL-60/ADR cells compared with that in HL-60 cells, may activate cell proliferation via exosomes.

3. Discussion

Exosomes are a well-known transporter of cellular molecules including proteins, nucleotides, and lipids [5]. Recent studies have shown that exosome-mediated cell-to-cell interactions are involved in cancer cell proliferation, metastasis, and drug resistance, leading to cancer malignancy [8]. In this study, we found that exosome production and release are enhanced in adriamycin-resistant leukemia HL-60/ADR cells compared with those in parental HL-60 cells, and SMS2 regulates intracellular ceramide metabolism, resulting in the acquisition of drug resistance and increased proliferation. In drug-resistant HL-60/ADR cells, intracellular ceramides were maintained at low levels through increased SMS activity. Therefore, overexpression of SMSs in HL-60 cells increased exosome production and release, suggesting that intracellular ceramide/SM levels are critical regulators of this process. In addition, exosomes derived from HL-60/ADR conferred drug-sensitive HL-60 cells with cell proliferation and drug resistance properties. Finally, we identified miR-484 as exosomal cargo that activates cancer cell proliferation.
Intracellular ceramide metabolism is an essential regulator of exosome production and release [12]. In addition, exosomal lipid compositions were reflected by cellular lipid conditions [10,11]. Previously, exosomal ceramides, especially C16:0 and C24:1 ceramides, were expressed at a higher ratio in metastatic CRC cells and CRC patient cells [19]. In addition, in glioblastoma, exosomal ceramide levels have been shown to be higher because they were closer to cancer stem cells [22]. These reports suggest an association between exosomal ceramides and cancer malignancy. Therefore, we first focused on ceramide levels in exosomes (Figure 2). However, the ceramide ratio in exosomes was almost the same between HL-60 cells and HL-60/ADR cells, and only C16:0 ceramide was slightly elevated in HL-60/ADR cells. Thus, we next examined the involvement between intracellular ceramide levels and exosomes that leads to chemoresistance.
Ceramide is well known as a bioactive lipid regulating cell death, differentiation, migration, and inflammatory responses [1,3]. In particular, in cancer, ceramide generation is known to be effective as a therapeutic target because it leads to cancer cell death and prevention of cancer malignancy [2]. Conversely, malignant cancer cells suppress ceramide production through enhancing its metabolism to SM or glycosphingolipids (GSLs) [23]. We previously reported that chemoresistant leukemia cells derived from patients have increased SMS and GCS activity, resulting in the maintenance of low ceramide levels [4]. In this study, HL-60/ADR cells also had higher SMS and GCS activity than HL-60 cells. In a recent study by Shammout et al., Dox-resistant human breast adenocarcinoma MCF-7 cells also showed lower ceramide levels and higher SMS2 expression compared with parental Dox-sensitive MCF-7 cells [24]. In particular, C16:0 and C22:0 ceramides in Dox-resistance MCF-7 cells were more than twice as high as in parental MCF-7 cells. Similarly, Huang et al. reported that C16:0 and C24:0 ceramides were decreased in taxol-resistant A2780 human ovarian cancer cells [25]. Inversely, SM levels became higher in chemoresistant cancer cells compared with levels in parental chemosensitive cells. In the present study, we confirmed increased SMS activity through the elevation of SMS expression including SMS1 and SMS2 and low ceramide levels including C16:0, C22:0, C24:1, and C24:0 ceramides in HL-60/ADR cells. However, total SM levels were similar between HL-60 cells and HL-60/ADR cells. Some species such as C16:0, C24:0, C26:0, and C26:1 SMs were slightly increased. Nonetheless, many studies have reported that the generation of GSLs including GC or hexosylceramide (HexCer) from ceramides is associated with chemoresistance [26]. Our previous study showed that overexpression of GCS enhanced resistance against Dox-induced cell death in HL-60 cells [4]. However, our data showed that total HexCer levels were not changed in HL-60/ADR cells compared with levels in HL-60 cells, although GCS activity was increased in HL-60/ADR cells (Figure S2). Therefore, these results suggest that suppression of ceramides is more important for chemoresistance in HL-60/ADR cells than increases in SM or GSLs from ceramides.
In our data, treatment of chemosensitive HL-60 cells with exosomes derived from chemoresistant HL-60/ADR cells enhanced cell proliferation and Dox-resistance (Figure 5). Exosomal cargos are associated with cancer malignancy including cell proliferation, metastasis, and chemoresistance [7,8]. In particular, miRNA is considered to be an important factor in exosome-mediated cancer malignancy [21]. Therefore, we finally examined the differences in exosomes between HL-60 cells and HL-60/ADR cells by miRNA microarray and identified seven miRNA candidates (miR-381-3p, miR-4697-3p, miR-4698, miR-658, miR-491-3p, miR-2392, and miR-484) with five-fold higher expression in HL-60/ADR exosomes than in HL-60 exosomes (Figure 6A). Among them, only miR-484 was higher in both HL-60/ADR cells and exosomes than in HL-60 cells and exosomes. Therefore, we focused on the function of miR-484 in cell proliferation. Recently, miR-484 was reported to have both physiological and pathological functions [27]. In particular, miR-484 expression exhibits the opposite role in cancer progression. Several reports showed that low miR-484 expression increases the risk of cancer cell proliferation, migration, and invasion in gastric cancer [28,29], CRC [30,31,32], pancreatic cancer [33], and prostate cancer [34]. Conversely, overexpression of miR-484 promotes tumorigenesis and malignancy in hepatocellular carcinoma [35,36,37], lung cancer [38,39,40], and glioma [41]. In our data, knockdown of miR-484 suppressed exosome-mediated proliferation of HL-60 cells, suggesting that miR-484 may be involved in cancer malignancy, at least in leukemia. However, the target of miR-484 is unknown and requires further investigation. As for the other candidates, the increased expression of some of them is involved in cancer malignancy. Wu et al. showed that miR-4697-3p expression was significantly higher in carboplatin-resistant ovarian cancer OVCAR3 cells than in drug-sensitive MR182 cells [42]. miR-4697-3p increases chemoresistance through the transcriptional regulation of MNX1-AS1 and HOXB13. Moreover, miR-4697-3p expression is involved in the pathogenesis of gastric cancer [43]. miR-658 was high in gastric cancer tissue and cells, resulting in tumor metastasis via activation of the PAX3–MET pathway [44,45]. In addition, Azuma et al. showed that exosomal miR-658 is increased in gefitinib-resistant human lung adenocarcinoma PS-9/ZD cells and is associated with acquisition of chemoresistance in chemosensitive PS-9 cells [46]. Thus, exosome-mediated cancer proliferation and drug resistance requires further investigation for these two miRNAs. Inversely, miR-381-3p, miR4698, miR491-3p, and miR-2392 are reported to have tumor-suppressive effects. Downregulation of miR-381-3p is associated with osteosarcoma growth [47], while miR-4698 has inhibitory effects on cancer cell proliferation in glioblastoma [48], hepatocellular carcinoma [49], and gastric carcinoma cells [50]. miR-491-3p acts as tumor suppressor and metastasis inhibitor in non-small cell lung cancer [51] and gastric cancer [52]. miR-2392 also has suppressive effects on cancer cell proliferation and metastasis in triple-negative breast cancer [53], hepatocellular carcinoma [54,55], and gastric cancer [56]. Therefore, these candidates may be upregulated in HL-60/ADR exosomes as negative feedback for chemoresistance. However, because the packaging mechanism of miRNA into exosomes via ceramides is largely unknown, this is a topic for future investigation.

4. Materials and Methods

4.1. Materials

Doxorubicin was obtained from Sigma–Aldrich (St. Louis, MO, USA). Anti-CD81 (sc-7637) and anti-actin (sc-1616) antibodies were purchased from Santa Cruz Biotechnologies (Dallas, TX, USA). Anti-calnexin (610523) antibody was obtained from BD Biosciences (San Jose, CA, USA). Anti-capase-3 antibody (9665S) was from Cell Signaling (Danvers, MA, USA). Horseradish peroxidase-conjugated secondary antibodies were purchased from Promega (Madison, WI, USA). The pLKO.1-TRC cloning vector (Addgene plasmid #10878) and the pLKO.1-TRC control (Addgene plasmid #10879) were gifted from David Root and were originally obtained from Addgene (Cambridge, MA, USA) [57].

4.2. Cell Culture

Human leukemia HL-60 cells and HL-60/ADR cells were cultured in RPMI 1640 (Wako, Tokyo, Japan) containing 10% (v/v) fetal bovine serum (FBS), as described previously [4,58]. HL-60 cells expressing SMS1 or SMS2 were established by the retroviral infection of pDON-hSMS1 (HL-60/SMS1), pDON-hSMS2 (HL-60/SMS2), and empty pDON-AI (HL-60/vec) [59]. Human embryonic kidney fibroblast HEK293 cells were maintained in DMEM supplemented with 10% (v/v) FBS. miR-484 knockdown in HEK293 cells was performed by transfection of pLKO.1 vector containing the shRNA sequence for miR-484 (5′-AAACCCCTAAATAG) with Lipofectamine 3000 (Thermo Fisher Scientific, Rockford, IL, USA). Viable cell numbers were measured by Cell Counting Kit 8 (Wako, Tokyo, Japan) or counted after staining with 0.25% (w/v) trypan blue.

4.3. Exosome Preparation

Exosomes were prepared from the culture media of HL-60 and HL-60/ADR cells as previously described [15]. In brief, cells were cultured in RPMI-1640 containing 5 μg/mL insulin and 5 μg/mL transferrin to avoid induction of cell death. After 24 h, the culture media were collected, centrifuged at 2000× g for 10 min, and passed through a 0.45-μm polyvinylidene difluoride (PVDF) filter. Then, media were centrifuged twice at 100,000× g for 70 min to obtain the exosomes as pellets. Exosome pellets were resolved in PBS(−) and used for other experiments.

4.4. Transmission Electron Microscopy

Transmission electron microscopy was performed as described previously [60]. Briefly, extracted exosomes were put onto carbon-coated copper grids (400 mesh) for 10 s. After washing with PBS, the grids were negatively stained with 2% (w/v) uranyl acetate for 1 min. Transmission images were obtained using a H-7100 transmission electron microscope (Hitachi, Tokyo, Japan) at 100 kV.

4.5. Analysis of Particle Number and Size

The number and size of the extracted exosomes were measured by nanoparticle tracking analysis (NTA) using a NanoSight NS300 (Malvern Instruments Ltd., Malvern, UK) according to the manufacturer’s protocol. For NTA of exosomes, samples were diluted with PBS(−). Three videos of 60 s each were captured with 1498 frames and a camera level at 15 using a syringe pump with constant flow injection. The recorded videos were analyzed with NTA software version 3.2 (Malvern Instruments Ltd., Malvern, UK) to determine the concentration and particle size.

4.6. Western Blot Analysis

Cells and exosomes were lysed in RIPA buffer (Wako, Tokyo, Japan) for 20 min on ice. Cell lysates were separated by SDS-polyacrylamide gel electrophoresis and transferred to PVDF membranes (Millipore, Bedford, MA, USA). After incubation with Blocking One solution (Nacalai Tesque, Kyoto, Japan) for 15 min at room temperature, the membranes were incubated overnight at 4 °C with primary antibodies. The membranes were then incubated with horseradish peroxidase-conjugated secondary antibodies for 45 min at room temperature. Immunoreactive protein bands were detected with the LAS-4000 system (Fujifilm, Tokyo, Japan).

4.7. LC-MS/MS

Lipid extractions from cells and exosomes were performed as described previously [61]. In brief, cells and exosomes were sonicated for 30 s with 0.1 mL of methanol/butanol (1:1), and then 0.7 mL butanol, 0.05 mL of 0.5 M phosphate buffer (pH 6.0), and 0.2 mL water were added. The samples were shaken, sonicated for 3 min, and centrifugated at 9000× g for 5 min. After collection of upper phase, remained solution was re-suspended with 0.35 mL each of hexane and ethyl acetate. After centrifugation at 9000× g for 5 min, upper phase was collected and mixed with first upper phase and 0.7 mL of methanol. Ten percent of this solution was dried and used for measurements of sphingolipids including ceramides, SM, GC, and PC with LC-MS/MS (Ultimate 3000 LC system, Thermo Fisher Scientific, Rockford, IL, USA), as described previously [61,62]. The protein concentrations in the residue of lipid extraction were measured by a BCA Protein Assay Kit (Thermo Fisher Scientific, Rockford, IL, USA) and used for normalization.

4.8. Measurement of SMS and GCS Activity

The activity of SMS and GCS was assessed using previously described methods [59,63]. Cells were homogenized in buffer containing 20 mM Tris-HCl (pH 7.5), 2 mM EDTA, 10 mM EGTA, and inhibitor cocktail (Roche, Basel, Switzerland). Homogenates (100 μg protein) were incubated in reaction solution (10 mM Tris-HCl (pH 7.5), 1 mM EDTA, 20 μM C6-NBD-ceramide (Matreya, Pleasant Gap, PA, USA), 0.1 mM UDP-glucose, 120 μM phosphatidylcholine) and incubated for 60 min at 37 °C. Lipids were extracted using the Bligh–Dyer method [64] applied onto thin layer chromatography plates, and developed with a solvent consisting of chloroform–methanol–12 mM MgCl2 (65:25:4, v/v/v). The fluorescent lipids were detected using LAS-4000 and quantified using Multi Gauge 3.1 (Fujifilm, Tokyo, Japan).

4.9. Quantitative Real-Time PCR (qPCR)

Total RNA and miRNA were extracted using an RNeasy mini kit (Qiagen, Hilden, Germany) and a miRNeasy mini kit (Qiagen, Hilden, Germany), respectively. Total RNA was converted to cDNA using ReverTra Ace qPCR RT Kit (Toyobo, Osaka, Japan). qPCR for SGMS1 (SMS1; Hs00983630_m1) and SGMS2 (SMS2; Hs00380453_m1) was performed using the QuantStudio 12K Flex Real-Time PCR system (Thermo Fisher Scientific, Rockford, IL, USA) with TaqMan Probes (Thermo Fisher Scientific, Rockford, IL, USA), as described previously [65]. SGMS1 and SGMS2 expression was normalized against ACTB (Hs01060665_g1) expression. A TaqMan Advanced miRNA cDNA Synthesis Kit (Thermo Fisher Scientific, Rockford, IL, USA) and TaqMan Advanced miRNA Assay (Thermo Fisher Scientific, Rockford, IL, USA) were used to assess miR-484 expression (has-miR-484, 478308_mir). In exosomes, 10 ng exosomal miRNA was used for assays and normalized against miRNA concentration. In cells, miR-484 expression was normalized against ACTB expression.

4.10. Flow Cytometry

Measurement of apoptotic cells was performed by detection of phosphatidylserine exposure using fluorescein isothiocyanate (FITC)-conjugated Annexin V (BD Biosciences, San Jose, CA, USA) and flow cytometry analysis (Gallios, Beckman Coulter, Miami, FL, USA), as described previously [66]. The percentage of FITC-Annexin V-positive cells was calculated as apoptotic cells using Kaluza software (Beckman Coulter, Miami, FL, USA). Intracellular fluorescence of Dox was detected by flow cytometry equipped with 488 nm excitation and 695 nm emission [67]. Fluorescent intensity was quantified with Kaluza software (Beckman Coulter, Miami, FL, USA) and represented as the mean fluorescent intensity (MFI).

4.11. Microarray for miRNA

Total RNA was extracted from exosomes and cells using 3D-Gene RNA extraction reagent (Toray Industries, Inc., Tokyo, Japan). The miRNA microarray analysis was performed with a 3D-Gene miRNA Labeling Kit and a 3D-Gene Human miRNA Oligo Chip version 21 (Toray Industries Inc., Tokyo, Japan) to detect 2565 human miRNAs. The chip was scanned with a 3D-Gene Scanner (Toray Industries Inc., Tokyo, Japan) and analyzed with a 3D-Gene Extraction Software (Toray Industries Inc., Tokyo, Japan). The digitalized fluorescence signal provided by this software was used as raw data. All normalized data were globally normalized per microarray such that the median signal intensity was adjusted to 25. From these data, miRNAs that were expressed in HL-60/ADR exosomes at greater than 5-fold higher levels than in HL-60 exosomes were listed.

4.12. Statistical Analysis

Statistical analyses were performed using GraphPad Prism 9 software (GraphPad Software Inc., San Diego, CA, USA). Data are represented as the mean ± standard deviation. Statistical significance was determined using paired t tests (between groups) or one-way ANOVA with a follow-up Tukey’s test (between multiple groups). A p value of less than 0.05 was considered statistically significant.

5. Conclusions

Chemoresistance against anti-cancer drugs is largely a clinical problem in various cancer types. However, the molecular mechanisms involved in drug resistance are diverse, and their elucidation is extremely difficult. In this study, we observed increased exosome numbers in chemoresistant HL-60/ADR cells compared with those in HL-60 cells, leading to acquisition of drug resistance and enhanced proliferation through the exosomal transport of miRNAs including miR-484. Promotion of exosome production and release is associated with intracellular ceramide metabolism by SMS2. Exosomes are well-known to be related in the cancer malignancy through transport of their cargo such miRNAs [7,8]. In addition, ceramide generation is also important to exosome production and release [12,13]. Furthermore, it is well known that ceramides are the anti-cancer sphingolipids to induce apoptosis or growth arrest and are kept at low levels in malignant cancer cells [4]. However, their relevance had been unknown. In this study, our results suggest that the balance between SM hydrolysis-mediated ceramide production and steady-state intracellular SM and ceramide levels is associated with ceramide-mediated exosome production and release through intracellular trafficking, results in cancer malignancy including cancer cell proliferation and chemoresistance. Therefore, suppression of exosome release by targeting ceramide metabolism such as inhibition of SMS2 may be a therapeutic strategy for cancers such as leukemia.

Supplementary Materials

The following supporting information can be downloaded at: https://www.mdpi.com/article/10.3390/ijms231810648/s1.

Author Contributions

M.T. performed the experiments, conducted the project, and wrote the manuscript. S.N. and K.Y. performed the experiments. A.K. performed the microarray and discussed the project. Y.I. supported and discussed the project. T.O. supervised the overall project and wrote the manuscript. All authors have read and agreed to the published version of the manuscript.

Funding

This work was partly supported by: the JSPS KAKENHI (grant/award number: 21K06827 to M.T., 18K06456 to K.Y., 20K21550 to A.K., and 22H02926 to T.O.); the Takeda Science Foundation; the Strategic Research Foundation Grant-Aided Project for Private Universities, the Ministry of Education, Culture, Sports, Science and Technology (MEXT) (grant number S1201004 to T.O.) in Japan; Ono Pharmaceutical Co., LTD. (to T.O.); and CREST from Japan Science and Technology Agency (JST) (grant number JPMJCR19H5 to A.K.).

Institutional Review Board Statement

Not applicable.

Informed Consent Statement

Not applicable.

Data Availability Statement

Not applicable.

Acknowledgments

We would like to acknowledge Chieko Hashizume, Rongfen Gao, and Hideo Ogiso, (Kanazawa Medical University) for their technical support. We thank Hideaki Hori, (Osaka Dental University) for performing the TEM. We also thank H. Nikki March for editing a draft of this manuscript.

Conflicts of Interest

The authors declare no conflict of interest.

References

  1. Ogretmen, B. Sphingolipid metabolism in cancer signalling and therapy. Nat. Rev. Cancer 2018, 18, 33–50. [Google Scholar] [CrossRef] [PubMed]
  2. Taniguchi, M.; Okazaki, T. Role of ceramide/sphingomyelin (SM) balance regulated through "SM cycle" in cancer. Cell. Signal. 2021, 87, 110119. [Google Scholar] [CrossRef] [PubMed]
  3. Hannun, Y.A.; Obeid, L.M. Sphingolipids and their metabolism in physiology and disease. Nat. Rev. Mol. Cell Biol. 2018, 19, 175–191. [Google Scholar] [CrossRef] [PubMed]
  4. Itoh, M.; Kitano, T.; Watanabe, M.; Kondo, T.; Yabu, T.; Taguchi, Y.; Iwai, K.; Tashima, M.; Uchiyama, T.; Okazaki, T. Possible role of ceramide as an indicator of chemoresistance: Decrease of the ceramide content via activation of glucosylceramide synthase and sphingomyelin synthase in chemoresistant leukemia. Clin. Cancer Res. 2003, 9, 415–423. [Google Scholar]
  5. Maas, S.L.N.; Breakefield, X.O.; Weaver, A.M. Extracellular Vesicles: Unique Intercellular Delivery Vehicles. Trends Cell Biol. 2017, 27, 172–188. [Google Scholar] [CrossRef]
  6. van Balkom, B.W.; Eisele, A.S.; Pegtel, D.M.; Bervoets, S.; Verhaar, M.C. Quantitative and qualitative analysis of small RNAs in human endothelial cells and exosomes provides insights into localized RNA processing, degradation and sorting. J. Extracell. Vesicles 2015, 4, 26760. [Google Scholar] [CrossRef]
  7. Hanahan, D.; Weinberg, R.A. Hallmarks of cancer: The next generation. Cell 2011, 144, 646–674. [Google Scholar] [CrossRef]
  8. Zomer, A.; van Rheenen, J. Implications of Extracellular Vesicle Transfer on Cellular Heterogeneity in Cancer: What Are the Potential Clinical Ramifications? Cancer Res. 2016, 76, 2071–2075. [Google Scholar] [CrossRef]
  9. Li, S.P.; Lin, Z.X.; Jiang, X.Y.; Yu, X.Y. Exosomal cargo-loading and synthetic exosome-mimics as potential therapeutic tools. Acta Pharmacol. Sin. 2018, 39, 542–551. [Google Scholar] [CrossRef]
  10. Skotland, T.; Sandvig, K.; Llorente, A. Lipids in exosomes: Current knowledge and the way forward. Prog. Lipid Res. 2017, 66, 30–41. [Google Scholar] [CrossRef]
  11. Skotland, T.; Hessvik, N.P.; Sandvig, K.; Llorente, A. Exosomal lipid composition and the role of ether lipids and phosphoinositides in exosome biology. J. Lipid Res. 2019, 60, 9–18. [Google Scholar] [CrossRef] [PubMed] [Green Version]
  12. Trajkovic, K.; Hsu, C.; Chiantia, S.; Rajendran, L.; Wenzel, D.; Wieland, F.; Schwille, P.; Brugger, B.; Simons, M. Ceramide triggers budding of exosome vesicles into multivesicular endosomes. Science 2008, 319, 1244–1247. [Google Scholar] [CrossRef] [PubMed]
  13. Kosaka, N.; Iguchi, H.; Yoshioka, Y.; Takeshita, F.; Matsuki, Y.; Ochiya, T. Secretory mechanisms and intercellular transfer of microRNAs in living cells. J. Biol. Chem. 2010, 285, 17442–17452. [Google Scholar] [CrossRef]
  14. Mittelbrunn, M.; Gutierrez-Vazquez, C.; Villarroya-Beltri, C.; Gonzalez, S.; Sanchez-Cabo, F.; Gonzalez, M.A.; Bernad, A.; Sanchez-Madrid, F. Unidirectional transfer of microRNA-loaded exosomes from T cells to antigen-presenting cells. Nat. Commun. 2011, 2, 282. [Google Scholar] [CrossRef]
  15. Yuyama, K.; Sun, H.; Mitsutake, S.; Igarashi, Y. Sphingolipid-modulated exosome secretion promotes clearance of amyloid-beta by microglia. J. Biol. Chem. 2012, 287, 10977–10989. [Google Scholar] [CrossRef] [PubMed]
  16. Kosaka, N.; Iguchi, H.; Hagiwara, K.; Yoshioka, Y.; Takeshita, F.; Ochiya, T. Neutral sphingomyelinase 2 (nSMase2)-dependent exosomal transfer of angiogenic microRNAs regulate cancer cell metastasis. J. Biol. Chem. 2013, 288, 10849–10859. [Google Scholar] [CrossRef]
  17. Cheng, Q.; Li, X.; Wang, Y.; Dong, M.; Zhan, F.H.; Liu, J. The ceramide pathway is involved in the survival, apoptosis and exosome functions of human multiple myeloma cells in vitro. Acta Pharmacol. Sin. 2018, 39, 561–568. [Google Scholar] [CrossRef]
  18. Liu, L.; Ye, Q.; Bihl, J.C.; Chen, Y.; Liu, J.; Cheng, Q. C6-ceramide treatment inhibits the proangiogenic activity of multiple myeloma exosomes via the miR-29b/Akt pathway. J. Transl. Med. 2020, 18, 298. [Google Scholar] [CrossRef]
  19. Elmallah, M.I.Y.; Ortega-Deballon, P.; Hermite, L.; Pais-De-Barros, J.P.; Gobbo, J.; Garrido, C. Lipidomic profiling of exosomes from colorectal cancer cells and patients reveals potential biomarkers. Mol. Oncol. 2022, 16, 2710–2718. [Google Scholar] [CrossRef]
  20. Taniguchi, M.; Okazaki, T. Ceramide/Sphingomyelin Rheostat Regulated by Sphingomyelin Synthases and Chronic Diseases in Murine Models. J. Lipid Atheroscler. 2020, 9, 380–405. [Google Scholar] [CrossRef]
  21. Kosaka, N.; Ochiya, T. Unraveling the Mystery of Cancer by Secretory microRNA: Horizontal microRNA Transfer between Living Cells. Front. Genet. 2011, 2, 97. [Google Scholar] [CrossRef] [PubMed] [Green Version]
  22. Melero-Fernandez de Mera, R.M.; Villasenor, A.; Rojo, D.; Carrion-Navarro, J.; Gradillas, A.; Ayuso-Sacido, A.; Barbas, C. Ceramide Composition in Exosomes for Characterization of Glioblastoma Stem-Like Cell Phenotypes. Front. Oncol. 2022, 11, 788100. [Google Scholar] [CrossRef] [PubMed]
  23. Senchenkov, A.; Litvak, D.A.; Cabot, M.C. Targeting ceramide metabolism--a strategy for overcoming drug resistance. J. Natl. Cancer Inst. 2001, 93, 347–357. [Google Scholar] [CrossRef] [PubMed]
  24. Shammout, O.D.A.; Ashmawy, N.S.; Shakartalla, S.B.; Altaie, A.M.; Semreen, M.H.; Omar, H.A.; Soliman, S.S.M. Comparative sphingolipidomic analysis reveals significant differences between doxorubicin-sensitive and -resistance MCF-7 cells. PLoS ONE 2021, 16, e0258363. [Google Scholar] [CrossRef] [PubMed]
  25. Huang, H.; Tong, T.T.; Yau, L.F.; Chen, C.Y.; Mi, J.N.; Wang, J.R.; Jiang, Z.H. LC-MS Based Sphingolipidomic Study on A2780 Human Ovarian Cancer Cell Line and its Taxol-resistant Strain. Sci. Rep. 2016, 6, 34684. [Google Scholar] [CrossRef]
  26. Bataller, M.; Sanchez-Garcia, A.; Garcia-Mayea, Y.; Mir, C.; Rodriguez, I.; ME, L.L. The Role of Sphingolipids Metabolism in Cancer Drug Resistance. Front. Oncol. 2021, 11, 807636. [Google Scholar] [CrossRef]
  27. Jia, Y.Z.; Liu, J.; Wang, G.Q.; Song, Z.F. miR-484: A Potential Biomarker in Health and Disease. Front. Oncol. 2022, 12, 830420. [Google Scholar] [CrossRef]
  28. Li, Y.; Liu, Y.; Yao, J.; Li, R.; Fan, X. Downregulation of miR-484 is associated with poor prognosis and tumor progression of gastric cancer. Diagn. Pathol. 2020, 15, 25. [Google Scholar] [CrossRef]
  29. Liu, J.; Li, S.M. MiR-484 suppressed proliferation, migration, invasion and induced apoptosis of gastric cancer via targeting CCL-18. Int. J. Exp. Pathol. 2020, 101, 203–214. [Google Scholar] [CrossRef]
  30. Shen, Y.; Qi, L.; Li, Y.; Zhang, Y.; Gao, X.; Zhu, Y.; Wang, K. The Downregulation of lncRNA pgm5-as1 Inhibits the Proliferation and Metastasis Via Increasing miR-484 Expression in Colorectal Cancer. Cancer Biother. Radiopharm. 2021, 36, 220–229. [Google Scholar] [CrossRef]
  31. Xie, S.; Ge, Q.; Wang, X.; Sun, X.; Kang, Y. Long non-coding RNA ZFAS1 sponges miR-484 to promote cell proliferation and invasion in colorectal cancer. Cell Cycle 2018, 17, 154–161. [Google Scholar] [CrossRef] [PubMed] [Green Version]
  32. Luo, X.; Yue, M.; Li, C.; Sun, D.; Wang, L. Long Non-Coding RNA LINC00239 Functions as a Competitive Endogenous RNA by Sponging microRNA-484 and Enhancing KLF12 Expression to Promote the Oncogenicity of Colorectal Cancer. OncoTargets Ther. 2020, 13, 12067–12081. [Google Scholar] [CrossRef]
  33. Li, N.; Yang, G.; Luo, L.; Ling, L.; Wang, X.; Shi, L.; Lan, J.; Jia, X.; Zhang, Q.; Long, Z.; et al. lncRNA THAP9-AS1 Promotes Pancreatic Ductal Adenocarcinoma Growth and Leads to a Poor Clinical Outcome via Sponging miR-484 and Interacting with YAP. Clin. Cancer Res. 2020, 26, 1736–1748. [Google Scholar] [CrossRef] [PubMed]
  34. Guo, X.; Han, T.; Hu, P.; Zhu, C.; Wang, Y.; Chang, S. Five microRNAs in serum as potential biomarkers for prostate cancer risk assessment and therapeutic intervention. Int. Urol. Nephrol. 2018, 50, 2193–2200. [Google Scholar] [CrossRef] [PubMed]
  35. Qiu, L.; Huang, Y.; Li, Z.; Dong, X.; Chen, G.; Xu, H.; Zeng, Y.; Cai, Z.; Liu, X.; Liu, J. Circular RNA profiling identifies circADAMTS13 as a miR-484 sponge which suppresses cell proliferation in hepatocellular carcinoma. Mol. Oncol. 2019, 13, 441–455. [Google Scholar] [CrossRef]
  36. Wang, S.; Wang, W.; Han, X.; Wang, Y.; Ge, Y.; Tan, Z. Dysregulation of miR484-TUSC5 axis takes part in the progression of hepatocellular carcinoma. J. Biochem. 2019, 166, 271–279. [Google Scholar] [CrossRef]
  37. Yang, Y.; Lin, X.; Lu, X.; Luo, G.; Zeng, T.; Tang, J.; Jiang, F.; Li, L.; Cui, X.; Huang, W.; et al. Interferon-microRNA signalling drives liver precancerous lesion formation and hepatocarcinogenesis. Gut 2016, 65, 1186–1201. [Google Scholar] [CrossRef]
  38. Zhuang, Z.; Sun, C.; Gong, H. High serum miR-484 expression is associated with the diagnosis and prognosis of patients with non-small cell lung cancer. Exp. Ther. Med. 2019, 18, 4095–4102. [Google Scholar] [CrossRef]
  39. Li, T.; Ding, Z.L.; Zheng, Y.L.; Wang, W. MiR-484 promotes non-small-cell lung cancer (NSCLC) progression through inhibiting Apaf-1 associated with the suppression of apoptosis. Biomed. Pharmacother. 2017, 96, 153–164. [Google Scholar] [CrossRef]
  40. Xue, X.; Wang, C.; Xue, Z.; Wen, J.; Han, J.; Ma, X.; Zang, X.; Deng, H.; Guo, R.; Asuquo, I.P.; et al. Exosomal miRNA profiling before and after surgery revealed potential diagnostic and prognostic markers for lung adenocarcinoma. Acta Biochim. Biophys. Sin. 2020, 52, 281–293. [Google Scholar] [CrossRef]
  41. Yi, R.; Feng, J.; Yang, S.; Huang, X.; Liao, Y.; Hu, Z.; Luo, M. miR-484/MAP2/c-Myc-positive regulatory loop in glioma promotes tumor-initiating properties through ERK1/2 signaling. J. Mol. Histol. 2018, 49, 209–218. [Google Scholar] [CrossRef] [PubMed]
  42. Wu, A.; Liu, J.; Zhang, X.; Niu, C.; Shu, G.; Yin, G. Comprehensive network analysis of dysregulated genes revealed MNX1-AS1/hsa-miR-4697-3p/HOXB13 axis in ovarian cancer chemotherapy response. Cancer Sci. 2022, 113, 2627. [Google Scholar] [CrossRef] [PubMed]
  43. Li, D.F.; Yang, M.F.; Shi, S.L.; Du, Y.L.; Wang, H.; Zhou, Y.L.; Luo, Y.L.; Ren, L.L.; Nie, Y.Q. TM4SF5-CTD-2354A18.1-miR-4697-3P may play a key role in the pathogenesis of gastric cancer. Bratisl. Lek. Listy 2015, 116, 608–615. [Google Scholar] [CrossRef] [PubMed]
  44. Guo, J.; Miao, Y.; Xiao, B.; Huan, R.; Jiang, Z.; Meng, D.; Wang, Y. Differential expression of microRNA species in human gastric cancer versus non-tumorous tissues. J. Gastroenterol. Hepatol. 2009, 24, 652–657. [Google Scholar] [CrossRef]
  45. Wu, Y.; Wan, X.; Ji, F.; Song, Z.; Fang, X. Serum miR-658 induces metastasis of gastric cancer by activating PAX3-MET pathway: A population-based study. Cancer Biomark. 2018, 22, 111–118. [Google Scholar] [CrossRef]
  46. Azuma, Y.; Yokobori, T.; Mogi, A.; Yajima, T.; Kosaka, T.; Iijima, M.; Shimizu, K.; Shirabe, K.; Kuwano, H. Cancer exosomal microRNAs from gefitinib-resistant lung cancer cells cause therapeutic resistance in gefitinib-sensitive cells. Surg. Today 2020, 50, 1099–1106. [Google Scholar] [CrossRef]
  47. Yang, G.; He, F.; Duan, H.; Shen, J.; Dong, Q. lncRNA FLVCR-AS1 promotes osteosarcoma growth by targeting miR381-3p/CCND1. OncoTargets Ther. 2020, 13, 163–172. [Google Scholar] [CrossRef]
  48. Kalhori, M.R.; Arefian, E.; Fallah Atanaki, F.; Kavousi, K.; Soleimani, M. miR-548x and miR-4698 controlled cell proliferation by affecting the PI3K/AKT signaling pathway in Glioblastoma cell lines. Sci. Rep. 2020, 10, 1558. [Google Scholar] [CrossRef]
  49. Yu, D.; Zhu, L.; Tu, H.; Wu, L.; Yang, H.; Xu, C. miR-4698-Trim59 axis plays a suppressive role in hepatocellular carcinoma. Front. Biosci. 2020, 25, 1120–1131. [Google Scholar]
  50. Zhao, J.; Li, X.; Fu, L.; Zhang, N.; Yang, J.; Cai, J. lncRNA LIFRAS1 inhibits gastric carcinoma cell proliferation, migration and invasion by sponging miR4698. Mol. Med. Rep. 2020, 23, 153. [Google Scholar] [CrossRef]
  51. Zhang, G.; Zheng, H.; Wang, L. miR4913p functions as a tumor suppressor in nonsmall cell lung cancer by targeting fibroblast growth factor 5. Oncol. Rep. 2022, 48, 164. [Google Scholar] [CrossRef] [PubMed]
  52. Yu, H.; Luo, S. Low Expression of miR-491-3p Is Correlated with Lymph Node Metastasis in Gastric Cancer. Evid.-Based Complement. Altern. Med. 2022, 2022, 7807956. [Google Scholar] [CrossRef] [PubMed]
  53. Sueta, A.; Fujiki, Y.; Goto-Yamaguchi, L.; Tomiguchi, M.; Yamamoto-Ibusuki, M.; Iwase, H.; Yamamoto, Y. Exosomal miRNA profiles of triple-negative breast cancer in neoadjuvant treatment. Oncol. Lett. 2021, 22, 819. [Google Scholar] [CrossRef] [PubMed]
  54. Yang, J.; Li, C.; Li, H.; Changyong, E. LncRNA CACNA1G-AS1 facilitates hepatocellular carcinoma progression through the miR-2392/C1orf61 pathway. J. Cell. Physiol. 2019, 234, 18415–18422. [Google Scholar] [CrossRef]
  55. Sun, B.; Ji, W.; Liu, C.; Lin, X.; Chen, L.; Qian, H.; Su, C. miR-2392 functions as tumour suppressor and inhibits malignant progression of hepatocellular carcinoma via directly targeting JAG2. Liver Int. 2022, 42, 1658–1673. [Google Scholar] [CrossRef]
  56. Li, J.; Li, T.; Lu, Y.; Shen, G.; Guo, H.; Wu, J.; Lei, C.; Du, F.; Zhou, F.; Zhao, X.; et al. MiR-2392 suppresses metastasis and epithelial-mesenchymal transition by targeting MAML3 and WHSC1 in gastric cancer. FASEB J. 2017, 31, 3774–3786. [Google Scholar] [CrossRef]
  57. Moffat, J.; Grueneberg, D.A.; Yang, X.; Kim, S.Y.; Kloepfer, A.M.; Hinkle, G.; Piqani, B.; Eisenhaure, T.M.; Luo, B.; Grenier, J.K.; et al. A lentiviral RNAi library for human and mouse genes applied to an arrayed viral high-content screen. Cell 2006, 124, 1283–1298. [Google Scholar] [CrossRef]
  58. Uchida, Y.; Itoh, M.; Taguchi, Y.; Yamaoka, S.; Umehara, H.; Ichikawa, S.; Hirabayashi, Y.; Holleran, W.M.; Okazaki, T. Ceramide reduction and transcriptional up-regulation of glucosylceramide synthase through doxorubicin-activated Sp1 in drug-resistant HL-60/ADR cells. Cancer Res. 2004, 64, 6271–6279. [Google Scholar] [CrossRef]
  59. Shakor, A.B.A.; Taniguchi, M.; Kitatani, K.; Hashimoto, M.; Asano, S.; Hayashi, A.; Nomura, K.; Bielawski, J.; Bielawska, A.; Watanabe, K.; et al. Sphingomyelin synthase 1-generated sphingomyelin plays an important role in transferrin trafficking and cell proliferation. J. Biol. Chem. 2011, 286, 36053–36062. [Google Scholar] [CrossRef]
  60. Yamanaka, T.; Furukawa, T.; Matsumoto-Mashimo, C.; Yamane, K.; Sugimori, C.; Nambu, T.; Mori, N.; Nishikawa, H.; Walker, C.B.; Leung, K.P.; et al. Gene expression profile and pathogenicity of biofilm-forming Prevotella intermedia strain 17. BMC Microbiol. 2009, 9, 11. [Google Scholar] [CrossRef]
  61. Ogiso, H.; Taniguchi, M.; Araya, S.; Aoki, S.; Wardhani, L.O.; Yamashita, Y.; Ueda, Y.; Okazaki, T. Comparative Analysis of Biological Sphingolipids with Glycerophospholipids and Diacylglycerol by LC-MS/MS. Metabolites 2014, 4, 98–114. [Google Scholar] [CrossRef] [PubMed]
  62. Ogiso, H.; Taniguchi, M.; Okazaki, T. Analysis of lipid-composition changes in plasma membrane microdomains. J. Lipid Res. 2015, 56, 1594–1605. [Google Scholar] [CrossRef] [PubMed] [Green Version]
  63. Taniguchi, M.; Ogiso, H.; Takeuchi, T.; Kitatani, K.; Umehara, H.; Okazaki, T. Lysosomal ceramide generated by acid sphingomyelinase triggers cytosolic cathepsin B-mediated degradation of X-linked inhibitor of apoptosis protein in natural killer/T lymphoma cell apoptosis. Cell Death Dis. 2015, 6, e1717. [Google Scholar] [CrossRef] [PubMed]
  64. Bligh, E.G.; Dyer, W.J. A rapid method of total lipid extraction and purification. Can. J. Biochem. Physiol. 1959, 37, 911–917. [Google Scholar] [CrossRef] [PubMed]
  65. Taniguchi, M.; Ueda, Y.; Matsushita, M.; Nagaya, S.; Hashizume, C.; Arai, K.; Kabayama, K.; Fukase, K.; Watanabe, K.; Wardhani, L.O.; et al. Deficiency of sphingomyelin synthase 2 prolongs survival by the inhibition of lymphoma infiltration through ICAM-1 reduction. FASEB J. 2020, 34, 3838–3854. [Google Scholar] [CrossRef]
  66. Fujita, J.; Taniguchi, M.; Hashizume, C.; Ueda, Y.; Sakai, S.; Kondo, T.; Hashimoto-Nishimura, M.; Hanada, K.; Kosaka, T.; Okazaki, T. Nuclear Ceramide Is Associated with Ataxia Telangiectasia Mutated Activation in the Neocarzinostatin-Induced Apoptosis of Lymphoblastoid Cells. Mol. Pharmacol. 2022, 101, 322–333. [Google Scholar] [CrossRef]
  67. Sampson, A.; Peterson, B.G.; Tan, K.W.; Iram, S.H. Doxorubicin as a fluorescent reporter identifies novel MRP1 (ABCC1) inhibitors missed by calcein-based high content screening of anticancer agents. Biomed. Pharmacother. 2019, 118, 109289. [Google Scholar] [CrossRef]
Figure 1. Enhancement of exosome release in HL-60/ADR cells. Exosomes were prepared from the culture media of HL-60 cells and HL-60/ADR cells by sequential ultracentrifugation methods. (A) Purified exosomes of HL-60 were observed by transmission electron microscopy. The arrow indicates exosome. Bars, 250 nm. (B) Western blot analysis of exosome marker CD81 and endoplasmic reticulum marker calnexin in exosomes and cells. (C,D) Exosome size and number were analyzed by nanosight tracking analysis. Particle size distribution of exosomes purified from HL-60 (left) and HL-60/ADR cells (right) are represented (C). Exosome numbers were normalized by cell numbers (D). Values indicate mean ± SD (n = 3). ** p < 0.005.
Ijms 23 10648 g001
Figure 2. Ceramide contents in exosomes. Exosomal and cellular ceramides were measured by LC-MS/MS. (A) The ratio of ceramides was calculated by the amounts of phosphatidylcholine (PC). (B) Ceramide contents in exosomes. Values indicate mean ± SD (n = 3). * p < 0.05, ** p < 0.005.
Ijms 23 10648 g002
Figure 3. SMS regulates intracellular ceramide levels in HL-60/ADR cells. (A) Cellular SMS activity was analyzed using C6-NBD-ceramide as the substrate. (B) qPCR analysis of SGMS1 (SMS1) and SGMS2 (SMS2) in HL-60 and HL-60/ADR cells. Expression of SMSs was normalized against ACTB expression. (C,D) Sphingomyelin (SM) (C) and ceramide (D) levels were measured by LC-MS/MS. Values indicate mean ± SD (n = 3). * p < 0.05, ** p < 0.005.
Ijms 23 10648 g003
Figure 4. Overexpression of SMS2 increases exosome release in HL-60 cells. HL-60 cells overexpressing SMS1 or SMS2 were established by retroviral infection of hSMS1 (HL-60/SMS1) and hSMS2 (HL-60/SMS2). As a control, retrovirus vector containing empty vector was used (HL-60/vec). (A) qPCR analysis of SGMS1 (SMS1) and SGMS2 (SMS2) in HL-60/vec, HL-60/SMS1, and HL-60/SMS2 cells. Expression was normalized against ACTB expression (n = 3). (B) Cellular SMS activity was analyzed using C6-NBD-ceramide as the substrate (n = 3). (C) Ceramide and SM contents were measured by LC-MS/MS and normalized against cellular protein amounts (n = 4). (D) Exosome numbers were measured by Nanosight (n = 3). Values indicate mean ± SD. * p < 0.05, ** p < 0.005.
Ijms 23 10648 g004
Figure 5. Exosomes purified from HL-60/ADR suppress doxorubicin-induced apoptosis in HL-60 cells. (A) HL-60 and HL-60/ADR cells were treated with exosomes extracted from the media of HL-60 (HL-60 exo) or HL-60/ADR cells (ADR exo) at the indicated concentration and cultured in RPMI-1640 supplemented with 5 μg/mL insulin and 5 μg/mL transferrin. After 12 h, viable cells were measured by CCK8 assay and represented as percentage of vehicle treatment (0 μg/μL) (n = 3). (BE) HL-60 cells were pre-treated with ADR exo for 12 h and then treated with doxorubicin (Dox) for 12 h. (B) Viable cell numbers were counted after trypan blue exclusion and indicated as percentage of vehicle treatment (n = 4). (C) Cells were stained with FITC-conjugated annexin V and analyzed by flow cytometry (n = 3). (D) Western blot analysis of caspase-3 and actin. (E) Dox taken up by cells was analyzed by flow cytometry (n = 3). Values indicate mean ± SD. * p < 0.05, ** p < 0.005.
Ijms 23 10648 g005
Figure 6. Exosomes purified from HL-60/ADR suppress doxorubicin-induced apoptosis in HL-60 cells. (A) Microarray experiments were performed to identify miRNAs in exosomes and cells. The seven candidate miRNAs showed more than a 5.0-fold increase among the total 2563 miRNAs species in HL-60/ADR cells compared with those in HL-60 cells. (B) Validation of miR-484 levels in exosomes (left) and cells (right) was performed by qPCR. (C) Knockdown of miR-484 by shRNA (shmiR-484) was performed by transfection of pLKO.1-shmiR-484 vector in HEK293 cells. Control cells were introduced with pLKO.1 control vector. The expression of miR-484 in exosomes was analyzed by qPCR. (D) HL-60 cells were treated with 3 × 10⁹ exosomes from HEK293/control (Exo/Cont) or HEK293/shmiR-484 (Exo/shmiR-484) for 24 h. Viable cells were detected by trypan blue dye exclusion method. The values show the mean ± SD (n = 3). ** p < 0.005.
Ijms 23 10648 g006
Publisher’s Note: MDPI stays neutral with regard to jurisdictional claims in published maps and institutional affiliations.

