Article

Transcription Factor MAFB as a Prognostic Biomarker for the Lung Adenocarcinoma

1
Laboratory Animal Resource Center in Transborder Medical Research Center, Faculty of Medicine, University of Tsukuba, 1-1-1 Tennodai, Tsukuba 305-8575, Japan
2
Department of Pathology, Faculty of Veterinary Medicine, Mansoura University, Mansoura 35516, Egypt
3
Department of General Thoracic Surgery, Faculty of Medicine, University of Tsukuba, 1-1-1 Tennodai, Tsukuba 305-8575, Japan
4
Department of Anatomy and Embryology, Faculty of Medicine, University of Tsukuba, 1-1-1 Tennodai, Tsukuba 305-8575, Japan
5
Department of Medical Education and Training, Tsukuba Medical Center Hospital, 1-3-1 Amakubo, Tsukuba 305-8558, Japan
6
Ph.D. Program in Human Biology, School of Integrative and Global Majors, University of Tsukuba, 1-1-1 Tennodai, Tsukuba 305-8575, Japan
7
Doctoral Program in Biomedical Sciences, Graduate School of Comprehensive Human Sciences, University of Tsukuba, 1-1-1 Tennodai, Tsukuba 305-8575, Japan
8
International Institute for Integrative Sleep Medicine (WPI-IIIS), University of Tsukuba, 1-1-1 Tennodai, Tsukuba 305-8575, Japan
9
Life Science Center for Survival Dynamics, Tsukuba Advanced Research Alliance (TARA), University of Tsukuba, 1-1-1 Tennodai, Tsukuba 305-8577, Japan
*
Authors to whom correspondence should be addressed.
Int. J. Mol. Sci. 2022, 23(17), 9945; https://doi.org/10.3390/ijms23179945
Submission received: 25 July 2022 / Revised: 18 August 2022 / Accepted: 29 August 2022 / Published: 1 September 2022

Abstract

:
MAFB is a basic leucine zipper (bZIP) transcription factor specifically expressed in macrophages. We have previously identified MAFB as a candidate marker for tumor-associated macrophages (TAMs) in human and mouse models. Here, we analyzed single-cell sequencing data of patients with lung adenocarcinoma obtained from the GEO database (GSE131907). Analyzed data showed that general macrophage marker CD68 and macrophage scavenger receptor 1 (CD204) were expressed in TAM and lung tissue macrophage clusters, while transcription factor MAFB was expressed specifically in TAM clusters. Clinical records of 120 patients with lung adenocarcinoma stage I (n = 57), II (n = 21), and III (n = 42) were retrieved from Tsukuba Human Tissue Biobank Center (THB) in the University of Tsukuba Hospital, Japan. Tumor tissues from these patients were extracted and stained with anti-human MAFB antibody, and then MAFB-positive cells relative to the tissue area (MAFB+ cells/tissue area) were morphometrically quantified. Our results indicated that higher numbers of MAFB+ cells significantly correlated to increased local lymph node metastasis (nodal involvement), high recurrence rate, poor pathological stage, increased lymphatic permeation, higher vascular invasion, and pleural infiltration. Moreover, increased amounts of MAFB+ cells were related to poor overall survival and disease-free survival, especially in smokers. These data indicate that MAFB may be a suitable prognostic biomarker for smoker lung cancer patients.

1. Introduction

V-maf musculoaponeurotic fibrosarcoma oncogene homolog B (MAFB) belongs to the large Maf transcription factor family and is a bzip transcription factor that regulates target gene expression [1]. Mafb is expressed in several tissues and is associated with the differentiation of various cell types, such as kidney podocytes [2], keratinocytes [3], and pancreatic α-cells and β-cells [3,4].
In the hematopoietic cell lineage, a transcriptome analysis using multi-dendritic cell (DC) and macrophage subsets showed that the expression of Mafb is associated specifically with monocyte-macrophage lineage and not DC lineage [5]. An increase in Mafb expression was observed in anti-inflammatory M2-type macrophages in vitro [6]. Moreover, MAFB in macrophages plays an essential role in resolving inflammation in ischemic conditions, efferocytosis preventing autoimmunity, and inhibiting macrophage apoptosis in atherogenic conditions [7,8,9], indicating that MAFB regulates the homeostatic function of macrophages. Lung alveolar macrophages (AM) express a low level of MAFB [5]; however, exposure to cigarette smoke progressively increased the expression of Mafb in a mouse model [10]. Even though patients with chronic obstructive pulmonary disease also exhibit increased Mafb expression [11], the relationship between exposure to cigarette smoke, Mafb expression, and lung cancer remains largely unidentified.
Tumor-associated macrophages (TAM) are the major cell populations of the tumor microenvironment (TME) and promote tumor progression, metastasis, angiogenesis, and resistance to therapy [12]. A higher infiltration of TAMs is often associated with a high mortality rate in various cancers [13]. M2 macrophage markers such as CD163, CD68, CD206, and CD204 are TAM markers that are widely used to assess cancer progression [14]. However, distinguishing M1 and M2 macrophages within the TAM in vivo remains challenging [15]. Consistent with this, CD163 and CD206 are reported to be expressed on M1-like TAMs or DCs that stimulate T cell activity in gastrointestinal tumors and ovarian ascites [16,17]. CD204 is also expressed in dendritic cells [18] in angioblastic T cell lymphoma (AITL); however, CD204 was not expressed in TAM [19]. Even though CD68, CD163, and CD204 have been widely used to assess the severity and outcome of human cancers [14,20], opinion on what constitutes the definitive TAM marker remains controversial.
We have previously reported Mafb expression in M2-type TAMs in a mouse tumor model of Lewis lung carcinoma. Furthermore, we have shown a significant upregulation of MAFB in human lung carcinomas (stage I and stage III) [21]. However, the lack of expression of Mafb in AM, along with its cigarette smoke-induced increase in expression [5,10], led us to hypothesize that MAFB could be a potential TAM marker for lung cancer. Here, we analyzed the single-cell RNA sequence (scRNA-seq) data of human lung cancer previously reported to exhibit a lack of MAFB expression in AM but expressed specifically in another macrophage lineage. Further, the lung tissue of 120 patients with lung cancer was immunostained using an anti-MAFB antibody, and the association between MAFB and cancer-related parameters was analyzed. Our results indicated that Mafb is highly specific for TAM and is a potential prognostic marker. Moreover, MAFB was also identified as a prognostic marker that can predict the risk of mortality among smoker patients.

2. Results

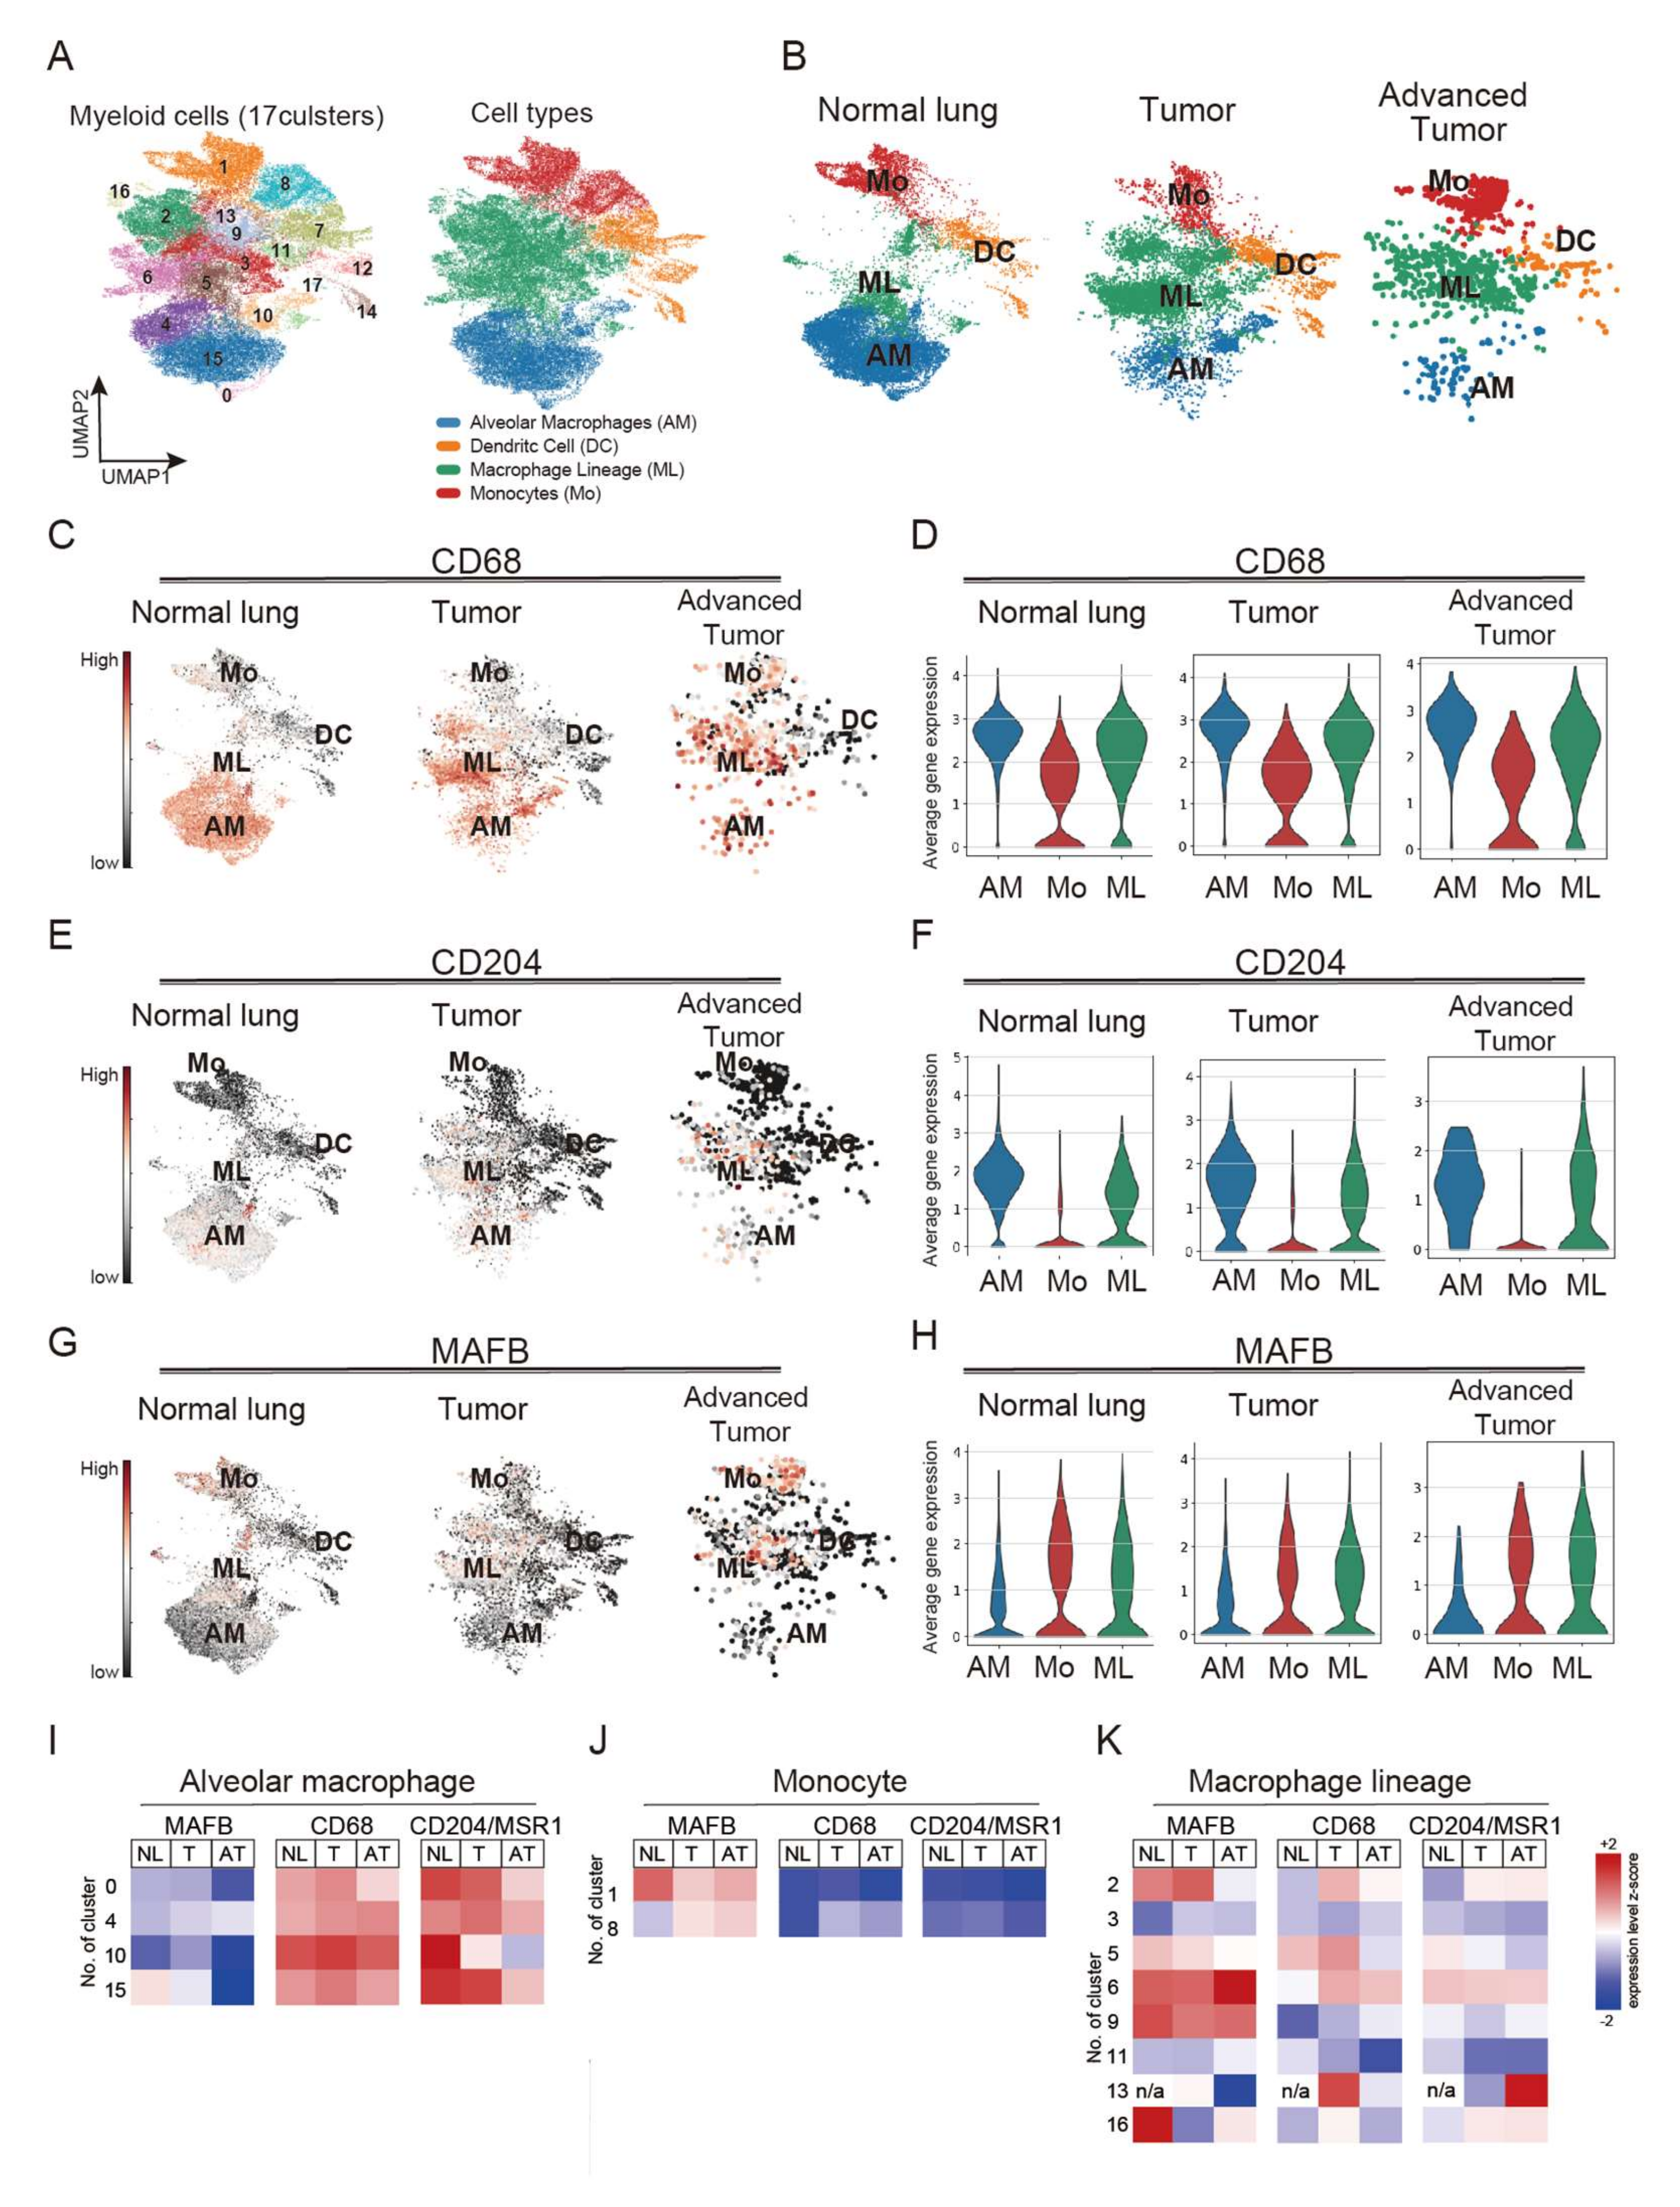
2.1. MAFB Is Specifically Expressed in Monocytes/Macrophages but Not Alveolar Macrophages in Both Normal and Cancerous Tissue

It has been shown that in a mouse model, Mafb is not expressed in AM [5]. Expecting the same for humans, MAFB may be a more specific TAM marker in lung cancer than other M2 macrophage markers. Therefore, we compared the distribution of MAFB and other macrophage markers, CD68 and CD204, using scRNA sequencing data of lung cancer patients, including normal lung, tumor tissue (stage I and III, n = 7), and advanced tumor tissue (stage IV, n = 4), as reported by Kim et al. (GSE131907) [22]. There were 34 clusters in all samples (Figure S2A). The myeloid series was extracted and analyzed using myeloid markers, LYZ, MARCO, CD68, and FCGR3A (Figure S2B). The extracted myeloid population had 18 (labeled 0–17) clusters, which were classified according to the expression of marker genes into AM, (cluster 0, 4, 10, 15), ML (cluster 2, 3, 5, 6, 9, 11, 13, 16), Mo (cluster 1, 8), and DC (cluster 7, 12, 14, 17) (Figure 1A and Figure S3A). Interestingly, all macrophage populations were identified in normal lung, tumor, and advanced tumor samples. AM was found in cancer tissue; however, the number of AM decreased with advancement in cancer stage (Figure 1B).
We further analyzed the expression patterns of CD68 and CD204 in normal lung and cancer tissues. Our results showed that CD68 was expressed in ML and Mo clusters in normal lung and cancer tissues; however, strongly expressed in AM clusters (Figure 1C,D). CD204 was also expressed in the ML clusters in tumor tissues and the AM clusters (Figure 1E,F). Compared to CD68 and CD204, MAFB was markedly less expressed in AM and specifically expressed in ML and Mo in all data from normal lung and cancer tissues (Figure 1G,H). A heatmap analysis confirmed MAFB expression in myeloid clusters, and the results showed lower MAFB expression in all the AM clusters (0, 4, 10, 15) compared with expression levels of CD68 and CD204 (Figure 1I). A higher level of MAFB expression was observed in the Mo cluster, than CD68 and CD204, suggesting that MAFB is expressed in infiltrating monocytes (Figure 1J). Consistently, the expression pattern of CCR2, a chemokine receptor for monocytes, was similar to that of MAFB in the monocyte clusters (Figure S3B). In the ML, MAFB, CD68, and CD204 were all expressed in clusters 2, 5, and 6 of the stage I samples, while cluster 9 showed strong expression of MAFB. As for cluster 13, CD68 was strongly expressed in stage I and CD204 in the advanced tumor, but MAFB was not expressed (Figure 1K). These results indicate that MAFB, CD68, and CD204 could be identified as markers of TAM but have different expression patterns among subsets of human macrophages.

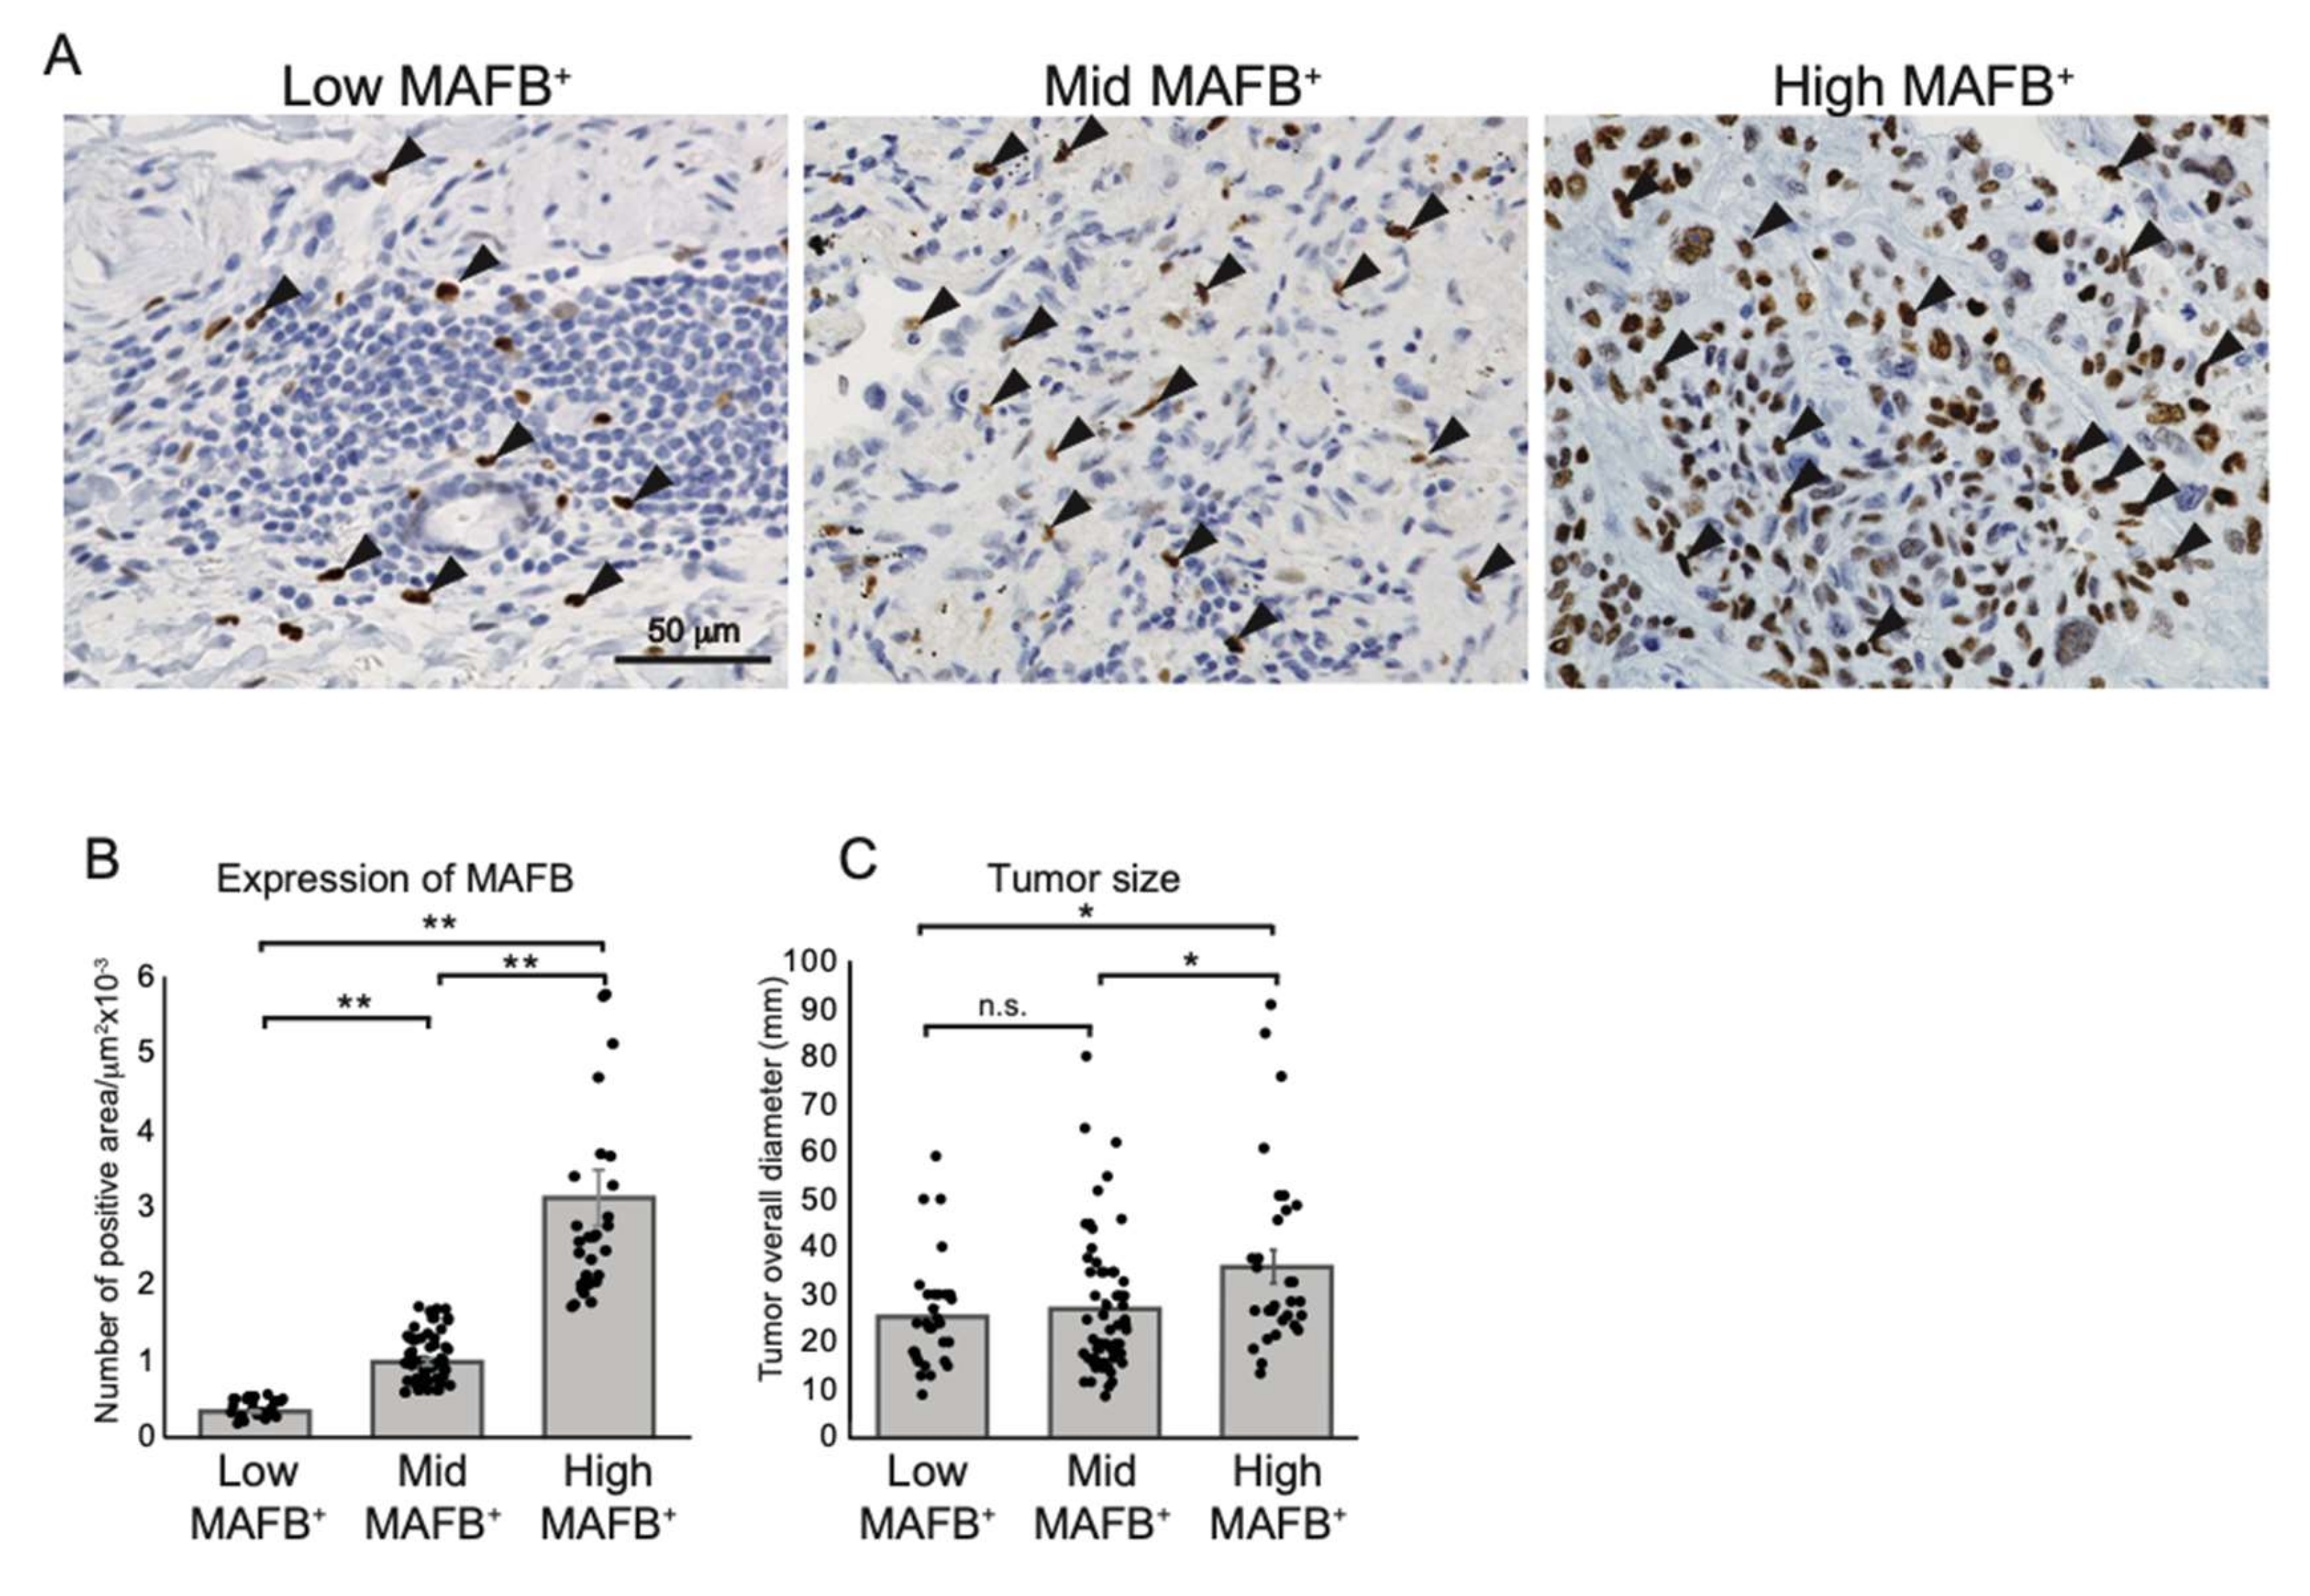
2.2. Higher MAFB+ Cell Density May Be Associated with Poor Clinical Prognosis among Lung Cancer Patients

Cancer diagnostic TAM markers, CD68, CD204, CD206, and CD163, are expressed on lung tissue AM (Figure 1 and Figure S3C); however, the poor MAFB expression on AM might significantly impact the assessment of cancer progression using TAM as an indicator. Therefore, to investigate whether the density of MAFB-positive cells is related to the clinical features of the tumor, we collected and analyzed cancer tissues from 120 patients with lung adenocarcinoma with or without nodal involvement (stage I, II, and III) admitted to the Tsukuba University Hospital between 2010 and 2019 (Table S1). The cancer tissues were immunostained using an anti-MAFB antibody, and the number of MAFB-positive cells relative to the tissue area was counted. The patients were ranked according to the MAFB+ cell density into low (25%) (low-MAFB+ group; n = 30, MAFB+ density ≤ 0.005), mid (49%) (mid MAFB+ group; n = 59, MAFB+ density = 0.006–0.016), and the higher (26%) (high-MAFB+ group; n = 31, MAFB+ density ≥ 0.017). The signals of MAFB staining differed significantly in each group (Figure 2A,B). Moreover, the high-MAFB+ group presented with significantly large tumors (Figure 2C). The correlation between the three groups, low-, mid-, and high- MAFB+ cell density with the recorded clinical features of the patients was analyzed using Fisher’s exact test (Table 1).
The patients did not differ significantly in age < 70 years versus ≥ 70 years (p = 0.22), or smoking status (p-value = 0.30). The female-to-male ratios were significantly different in the mid-MAFB+ group (male: female, 21:38) and the high-MAFB+ group (male:female, 20:11, p < 0.03). No significant association between smoking habits and the MAFB cell population was identified; however, patients with smoking habits tended to cluster more in the high-MAFB+ group (never: former/current, 8:23). Most of the patients with stage I adenocarcinoma were grouped into the low-MAFB+ (stage I: stage III, 24:6), while a significant number of patients with stage III adenocarcinoma were grouped into the high-MAFB+ group (stage I:stage III, 3:28, p < 0.01). Similarly, clinical characteristics related to cancer recurrence, including nodal involvement, lymphatic permeation, and vessel invasion, were lower in tissues with low-MAFB+, while the high-MAFB+ group showed a significant correlation. Most of the tissues with low-MAFB+ showed no pleural infiltration. These findings suggest that higher MAFB+ cell density may be associated with poor clinical prognosis among patients with stages I, II, and III lung adenocarcinoma.

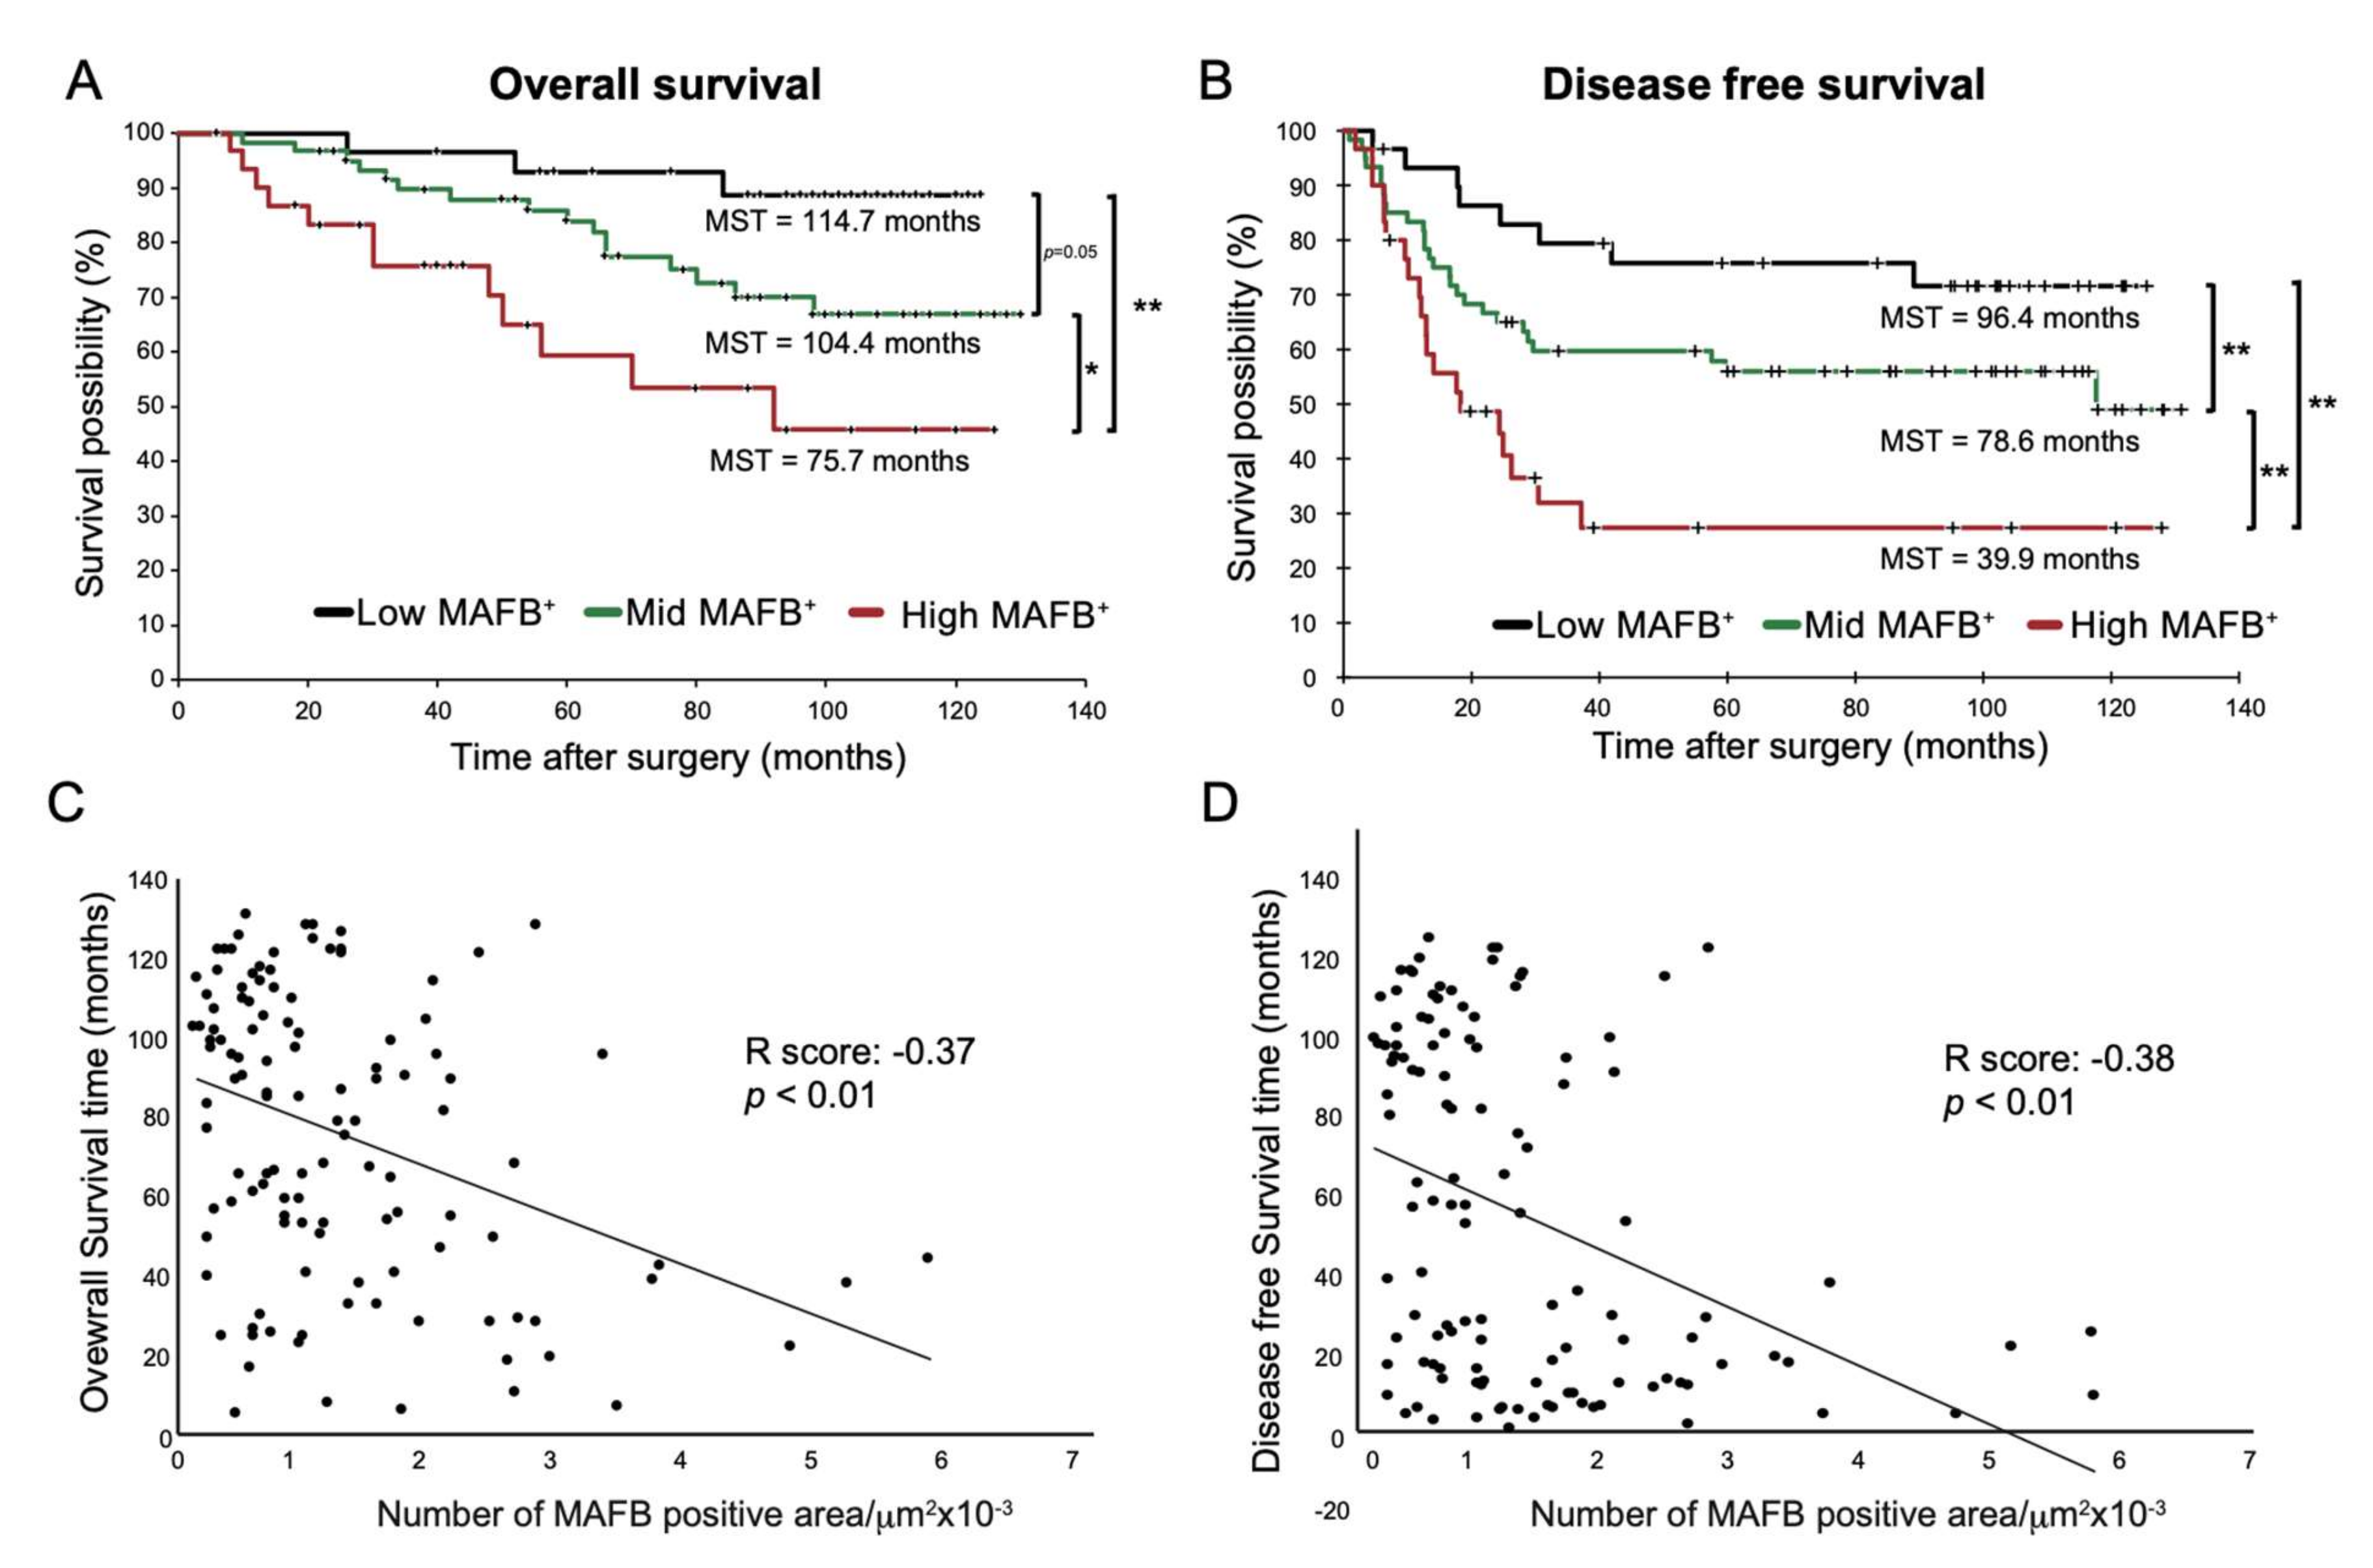
2.3. High-MAFB+ Cell Density Indicated a Higher Mortality Risk

Many studies have shown that TAM markers are associated with survival in lung cancer patients [13]. Therefore, we analyzed whether the MAFB+ cell density was associated with survival rates of the patients with non-metastatic (Stage I to III) lung adenocarcinoma. Figure 3A,B show the OS and DFS of low- (black line), mid- (green line), and high- (red line) MAFB+ cell density groups. The curves indicate that high-MAFB+ cell density indicated a higher mortality risk as the mean survival time (MST) for the low-, mid-, and high-MAFB+ groups were 114.7 months, 104.4 months, and 75.5 months (p < 0.001, log-rank test), respectively (Figure 3A).
In terms of DFS, the MST in the low-, mid-, and high-MAFB+ group was 96.4 months, 78.6 months, and 39.9 months (p < 0.001, log-rank test), respectively (Figure 3B). Compared with the MST of nodal involvement; negative (−) with an OS of 109.0 months and positive (+) with an OS of 92.4 months; the low-MAFB+ patients showed longer OS than patients with (−) nodal involvement and high-MAFB+ patients showed a 17 month shorter OS than patients with nodal involvement (Figure S4 and Figure 3A,B).
Furthermore, Pearson correlation analysis showed that MAFB+ cell density was negatively correlated with OS or DFS (Figure 3C, R score: −0.37, p < 0.001, D, R score: −0.38, p < 0.001). Consistently, the univariate analysis using the Cox hazard test disclosed that the OS (low vs. Mid, p = 0.0791, low vs. high, p = 0.0011) and DFS (low vs. mid, p = 0.0828, low vs. high, p = 0.0018) was associated with MAFB expression and other factors except for sex and age (Table 2).
On the other hand, multivariate analysis suggested that MAFB expression was less influential than smoking history and nodal involvement. (Table 2).
These results suggest that grouping by the degree of MAFB expression allows a more detailed examination of hazard and mortality risk in patients with stage I to stage III lung adenocarcinoma. Thus, MAFB+ cell density may be an ideal predictor of the hazard ratio and DFS in these patients after surgery.

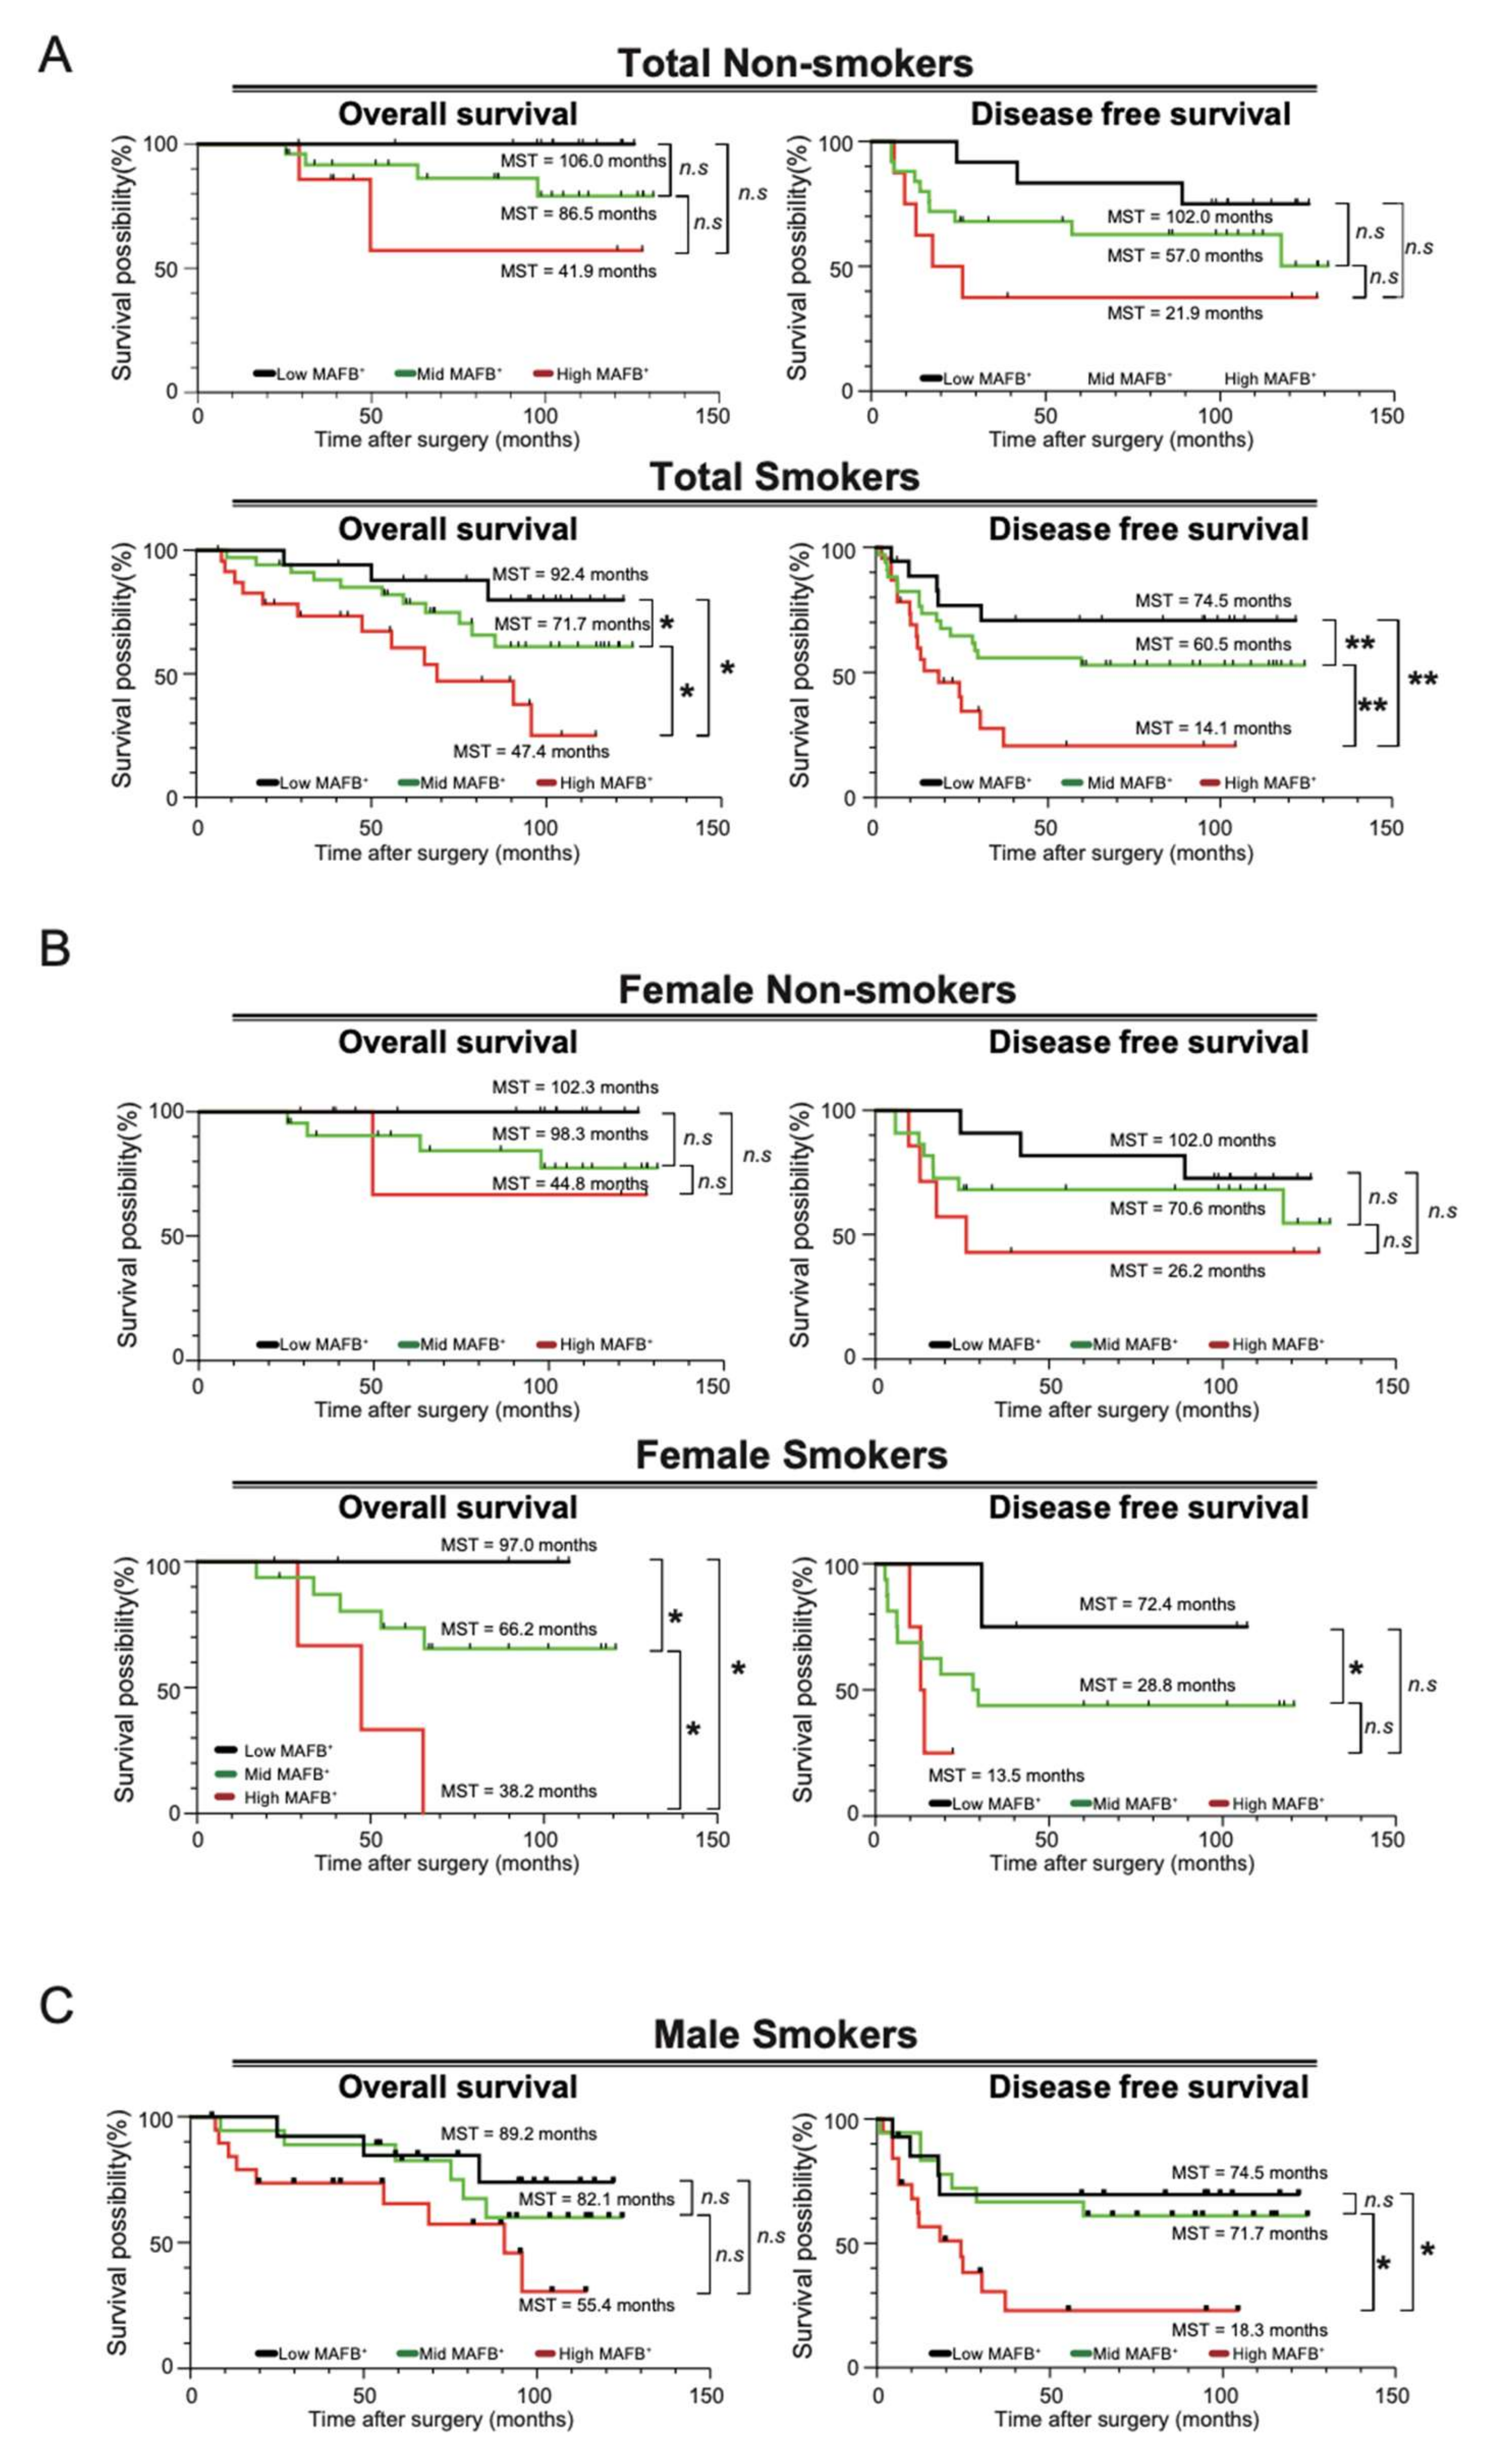
2.4. MAFB Could Be a Prognostic TAM Marker for Patients with Smoking Habits with Lung Adenocarcinoma

Univariate and multivariate analyses have revealed that smoking history and MAFB expression affect survival (Table 2). A previous study showed that cigarette smoke induces MAFB expression in lung macrophages in a mouse model [10]. Therefore, we decided to analyze whether there is any relationship between smoking and MAFB expression. We first checked the correlation between MAFB expression level and smoking index, but no association was observed (Figure S5). Next, we decided to ascertain whether the intensity of MAFB expression is related to survival in smokers and non-smokers. Our results showed that the OS rates of smokers (n = 75) were significantly lower compared to non-smokers (n = 45) (Figure S6A). Furthermore, we examined OS and DFS of low, mid, and high-MAFB+ in both smoking and non-smoking patients and found that the survival was significantly lower in the high-MAFB+ group only in smokers (Figure 4A).
The effects of cigarette smoking on men and women have long been a subject of controversy [19]. The samples included female smoker n = 24, female non-smoker n = 40, male smoker n = 51, and male non-smoker n = 5. Our results showed that female smokers had significantly lower OS rates (Figure S5B). In men, an accurate comparative analysis could not be performed as the number of non-smokers was only about 10% of smokers (Figure S6C). For women, we separately compared the survival curves for MAFB expression intensity for non-smokers and smokers. The results showed no significant difference in survival by MAFB expression intensity in the non-smoker group, but a dramatic difference in OS and DFS was observed in the smoker group. Since most of the men were smokers, we could not obtain data on survival curves for non-smokers; however, smokers showed a significant difference in DFS according to the intensity of MAFB (Figure 4C). These data indicate that MAFB could be a prognostic TAM marker for patients with smoking habits with lung adenocarcinoma.

3. Discussion

TAMs and AMs are thought to coexist in the lung tissues from the early stages of cancer [22]. However, the cell-specific expression of MAFB remains largely unidentified. In our previous report, tumor samples from patients with lung adenocarcinoma showed MAFB expression in locations comparable to CD68- and CD204-positive TAMs and were abundant in severe stages of cancer [21]. In this study, the scRNA-seq analysis of patients with lung cancer showed MAFB expression in monocytes of tumor and advanced tumor tissue, while no other markers (CD204, CD68, CD206) were expressed (Figure 1J). In particular, in myeloid cluster 8, MAFB expression increased in tumors and advanced tumors. Similar expression patterns for CCR2 were observed in Figure S3B. CCR2 is the receptor for CCL2 which induces monocyte infiltration in tumors including lung cancer [23]; therefore, MAFB may be a potential indicator for monocyte infiltration. Although it is difficult to measure the actual percentage of monocyte infiltration, the CCR2-expressing cells in this analyzed data accounted for approximately 3% of the total cells in normal lung tissue and increased to 6% or 11% in tumors or advanced tumors, respectively (Figure S3B). This may indicate that TAM infiltration increases as the tumor stage advances, but it is difficult to clearly measure the extent of TAM infiltration considering conditions such as tumor removal site, sample preparation method, and individual differences. Further study is required to analyze whether MAFB can be established as a marker of invasion.
Moreover, unlike other TAM markers, MAFB was not expressed in AM. Our results were consistent with previous reports stating that Mafb was highly expressed in macrophage-colony stimulating factor (M-CSF)-derived macrophages but not expressed in the alveolar granulocyte macrophage-colony stimulating factor (GM-CSF)-derived macrophages. Since MAFB inhibits the self-renewal of macrophages, AMs have self-renewal ability [24]. Hence, our study suggests that MAFB shows a higher specificity to the macrophage/monocyte cell population than other cancer markers studied and could be used to identify patients with early stages of lung adenocarcinoma.
Previous studies have identified CD204+ TAMs as prognostic markers in non-small cell lung carcinoma (NSCLC), especially in lung adenocarcinoma [25], and the combined use of CD47 and CD68 was reported to predict the survival of eastern-Asian patients with NSCLC [26]. Further, CD68+CD163+ or CD68+CD206+ markers were used to identify M2-polarized TAMs in lung adenocarcinoma. The levels of M2 macrophages (CD68+CD206+) were positively associated with peritumoral lymphatic microvessel density, but negatively associated with the patient’s prognosis [27]. Moreover, the accumulation of CD163+ macrophages is closely correlated with a poor prognosis in lung cancer, and the increased density of CD68+CD163+ macrophages in tumor nests and stroma was associated with lymph node metastases [27]. However, no such association was observed with recurrence-free survival, OS, and TNM stages [14,28]. Similarly, CD68+CD163+M2 were also correlated with OS and DFS in NSCLC. A higher correlation was observed between increased infiltration of macrophages and clinical characteristics, including LUSC, EGFR status, and smoking habits [29]. However, the use of MAFB as a predictive marker for the survival of patients with non-metastatic lung adenocarcinoma remains unidentified. Our results showed that MAFB+ cell density correlated with clinicopathological characteristics in patients with stage I, II, and III lung adenocarcinoma. A higher MAFB+ cell density correlated with poor clinical outcomes, including poor pathologic stage, higher recurrence rate, nodal involvement, lymphatic permeation, and vessel invasion. An association with high hazards rate, poor OS, and DFS was also observed among these patients.
Smoking habits or sex differences did not show significant differences in their correlation with the OS and DFS in MAFB+ cells. However, one of the limitations of our study was the relatively small sample size of non-smoking males. Even though only Japanese patients were included in this study, our results were consistent with previous reports where the risk of lung cancer was comparable in both women and men exposed to tobacco smoke in patients from Germany and Italy [30]. Compared to squamous cells or small cell carcinomas, adenocarcinoma was reported to have a weak association with tobacco smoking in women from France [19]. Interestingly, smoking was significantly correlated with a higher density of CD68- and CD204-positive macrophages in tumor stroma [25,31]. It has also been reported that Mafb expression is upregulated in macrophages following exposure to cigarette smoke in a mouse model [10]. However, whether the increase in MAFB expression was observed in resident or infiltrating macrophages remained unclear. Our results indicate that MAFB was expressed in the monocyte-derived macrophages, but not tissue-resident macrophages, suggesting higher specificity of MAFB expression in TAMs than other markers, CD68 and CD204. Moreover, all patients with smoking habits showed higher MAFB+ cell density and were at risk of poor OS and DFS, suggesting that MAFB could be a prognostic TAM marker in smoking patients with early-stage lung adenocarcinomas. We suggest that the correlation between MAFB+ cells density with OS and DFS in smokers and/or non-smokers patients did not seem to be a sex-related relationship.
Our results suggest that MAFB+ cells could be a suitable predictor for severity and a prognostic marker for hazard rate, OS, and DFS in patients with non-metastatic lung adenocarcinoma. Moreover, we suggest that a higher MAFB+ cell density in patients with smoking habits could also be associated with poor overall and disease-free survival; however, this association is not sex-related.

4. Material and Methods

4.1. Single-Cell RNA Sequencing (scRNA-seq) Analysis

The single cell RNA-seq recently generated from 44 patients with treatment-naïve lung adenocarcinoma were analyzed (GEO database accession GSE131907). Single-cell RNA raw data included normal lung tissue (n = 11), tumor tissue (stage I and III, n = 7), and advanced tumor tissue (stage IV, n = 4).
The raw data was downloaded, and we used Scanpy (v1.7.2) for the following analyses. The initial cell number and gene number were 208,506 and 29,634, respectively. We extracted highly variable genes using “scanpy.pp.highly_variable_genes” function, and 2243 genes were extracted. We conducted dimension reduction with PCA using the “scanpy.tl.pca” function and UMAP using the “scanpy.pp.neighbors” function and the “scanpy.tl.umap” function. By clustering with the Leiden Method using the “sc.tl.leiden” function, cells were divided into 34 clusters and six clusters which contained myeloid cells (41,726 cells) were extracted. Dimension reduction and clustering were conducted on these extracted cells using the same method for all cells. For information about the parameters for these analyses, please refer to our GitHub pages (https://github.com/Teppei-Nishino/TAM, accessed on 30 August 2022)).
We clustered myeloid cell lineages, Alveolar Macrophages (AM), Dendritic cells (DC), Macrophage Lineage (ML), and Monocytes (Mo), and the analysis was performed using only these clusters. Statistical analysis and visualization were performed using functions from Scanpy.

4.2. Immunostaining of Human Cancer Tissues

We analyzed the cancerous tissues of patients with lung adenocarcinoma (n = 120) from the Tsukuba Human Tissue Biobank Center (THB) at the University of Tsukuba Hospital. Frozen human lung tumor tissues were sectioned (5 μm), stained, and visualized, as previously described [21], using 1:50 anti-MAFB (clone OTI2A6; Lifespans Biosciences, Seattle, WA, USA). Means of three positively stained field areas relative to the tissue area (MAFB+ cells/tissue area) were morphometrically quantified (Supplementary Figure S1) using a BZ-X800 analyzer (Keyence, Itasca, IL, USA).

4.3. Evaluation of Clinicopathological Features

The clinical characteristics of patients with lung adenocarcinoma (n = 120) were retrieved from the clinical records of the University of Tsukuba. The following clinicopathological factors were considered: age (<70 years versus ≥70 years), sex (female vs. male), smoking history (non-smokers versus smokers), local metastasis to lymph nodes (nodal involvement; N0 versus N1), recurrence (positive vs. negative), pathological stage (I, II, and III), lymphatic permeation (present vs. absent), vascular invasion (present vs. absent), and pleural infiltration (present vs. absent). The UICC TNM staging system (The Union for International Cancer Control staging system for tumor size, lymphatic involvement, and metastasis) was used to classify the severity and extent of the cancer stage.

4.4. Statistical Analysis

Data are expressed as the mean ± SEM and analyzed using Welch’s t-test. The correlations between the grade of MAFB+ cells density and the clinicopathological factors were evaluated through Fisher’s exact test. The Kaplan–Meier method was used to estimate the overall survival time and the disease-free survival, while the difference in survival was compared using the log-rank test, the two paired groups using the Wilcoxon test, and the different survival distributions using the Tarone–Ware test. In survival analysis, we used Dunn–Šidák correction to adjust the p-value, and the curve comparisons were calculated using the Cox hazard test. The following variables were considered, MAFB+ cells density, sex, age, smoking, cancer recurrence, tumor stage, nodal involvement, lymphatic permeation, vessel invasion, and pleural infiltration. The correlation between MAFB+ cell density and overall survival (OS) or disease-free survival (DFS) was evaluated using the Pearson correlation test. Differences were considered statistically significant at p < 0.05.

Supplementary Materials

The following supporting information can be downloaded at: https://www.mdpi.com/article/10.3390/ijms23179945/s1.

Author Contributions

Conceptualization, O.S. and M.H.; methodology, O.S. and M.K.Y.; software, O.S., M.H., M.S. and T.N.; validation, O.S., M.H. and M.S.; formal analysis, O.S.; investigation, O.S. and M.H.; resources, N.K.; data curation, O.S., M.H. and T.N.; writing—original draft preparation, O.S.; writing—review and editing, O.S., M.H., S.T., M.S., Y.I.; visualization, O.S. and M.H.; supervision, M.H. and S.T.; project administration, M.H. and S.T.; funding acquisition, M.H. and S.T. All authors have read and agreed to the published version of the manuscript.

Funding

This work was funded by the Ministry of Education and Sports of Japan and the Ministry of Education JSPS KAKENHI (grant numbers 26221004, 25860205, 23118504, 16K18398, 19K07499, and 19H00966), Research Grant of Princess Takamatsu Cancer Research Fund, the Culture, Sports, Science and Technology of Japan (MEXT), the Uehara Memorial Foundation, Takeda Science Foundation, and the World Premier International Research Center Initiative, MEXT, Japan.

Institutional Review Board Statement

This study was approved by the Tsukuba Clinical Research & Development Organization (T-CReDO), Department of Medicine, University of Tsukuba Hospital (R02-075). All methods were carried out following the guidelines and regulations described in the proposal submitted to the Ethics Committee.

Informed Consent Statement

For donations for scientific research, informed consent was signed by the donor before death or by relatives after death, according to local guidelines of University of Tsukuba Hospital. The anonymity of the cadavers was maintained.

Data Availability Statement

The datasets used and/or analyzed during the current study are available from the corresponding author upon reasonable request. All source code is available from our GitHub page (https://github.com/Teppei-Nishino/TAM, accessed on 30 August 2022)).

Acknowledgments

We thank our laboratory co-workers from the Lab Animal Resource Center at the University of Tsukuba, Japan, for providing insights and assisting in the research. We also appreciate Tomoyo Takeuchi and Noriaki Sakamoto at Tsukuba Human Tissue Biobank Center (THB)/Tsukuba Pathological Analysis Support Service (T-PASS), the University of Tsukuba, Japan, for obtaining the human tissue sections.

Conflicts of Interest

The authors declare no conflict of interest.

Abbreviations

AMAlveolar macrophages
bZIPThe basic leucine zipper
CD204Cluster of differentiation 204
CD68Cluster of differentiation 68
DCDendritic cells
DFSDisease-free survival
FCGR3AFc gamma receptor IIIa gene
GEOGene expression omnibus
JSPSJapan Society for the Promotion of Science
LY2Lymphocyte antigen 2 gene
MafMusculoaponeurotic fibrosarcoma
MAFBV-maf musculoaponeurotic fibrosarcoma oncogene homolog B
MARCOMacrophage receptor with collagenous structure gene
MEXTThe Ministry of Education, Culture, Sports, Science, and Technology
MLMacrophage lineage
MoMonocytes
MSR1Macrophage scavenger receptor 1
MφsMacrophages
OSOverall survival
PCAPrincipal component analysis
PCsPrincipal components
scRNA-seqSingle-cell RNA sequencing
SEMStandard error of mean
SNNShared nearest neighbor
T-CReDOTsukuba clinical research and development organization
TAMTumor-associated macrophages
THPTsukuba Human Tissue Biobank Center
TMETumor microenvironment
TNMStaging system based on tumor size, nodal involvement, and metastasis
UICCThe Union for International Cancer Control
UMAPUniform Manifold Approximation and Projection
UMIsUnique molecular identifiers

References

  1. Kataoka, K.; Fujiwara, K.T.; Noda, M.; Nishizawa, M. MafB, a new Maf family transcription activator that can associate with Maf and Fos but not with Jun. Mol. Cell. Biol. 1994, 14, 7581–7591. [Google Scholar] [CrossRef] [PubMed]
  2. Sadl, V.S.; Jin, F.; Yu, J.; Cui, S.; Holmyard, D.; Quaggin, S.E.; Barsh, G.S.; Cordes, S.P. The Mouse Kreisler (Krml1/MafB) Segmentation Gene Is Required for Differentiation of Glomerular Visceral Epithelial Cells. Dev. Biol. 2002, 249, 16–29. [Google Scholar] [CrossRef] [PubMed]
  3. Hang, Y.; Stein, R. MafA and MafB activity in pancreatic β cells. Trends Endocrinol. Metab. 2011, 22, 364–373. [Google Scholar] [CrossRef] [PubMed]
  4. Nishimura, W.; Kondo, T.; Salameh, T.; El Khattabi, I.; Dodge, R.; Bonner-Weir, S.; Sharma, A. A switch from MafB to MafA expression accompanies differentiation to pancreatic β-cells. Dev. Biol. 2006, 293, 526–539. [Google Scholar] [CrossRef] [PubMed]
  5. Gautier, E.L.; Shay, T.; Miller, J.; Greter, M.; Jakubzick, C.; Ivanov, S.; Helft, J.; Chow, A.; Elpek, K.G.; Gordonov, S.; et al. Gene-expression profiles and transcriptional regulatory pathways that underlie the identity and diversity of mouse tissue macrophages. Nat. Immunol. 2012, 13, 1118–1128. [Google Scholar] [CrossRef] [PubMed]
  6. Daassi, D.; Hamada, M.; Jeon, H.; Imamura, Y.; Tran, M.T.N.; Takahashi, S. Differential expression patterns of MafB and c-Maf in macrophages in vivo and in vitro. Biochem. Biophys. Res. Commun. 2016, 473, 118–124. [Google Scholar] [CrossRef]
  7. Tran, M.T.N.; Hamada, M.; Jeon, H.; Shiraishi, R.; Asano, K.; Hattori, M.; Nakamura, M.; Imamura, Y.; Tsunakawa, Y.; Fujii, R.; et al. MafB is a critical regulator of complement component C1q. Nat. Commun. 2017, 8, 1700. [Google Scholar] [CrossRef]
  8. Shichita, T.; Ito, M.; Morita, R.; Komai, K.; Noguchi, Y.; Ooboshi, H.; Koshida, R.; Takahashi, R.K.S.; Kodama, T.; Yoshimura, A. MAFB prevents excess inflammation after ischemic stroke by accelerating clearance of damage signals through MSR1. Nat. Med. 2017, 23, 723–732. [Google Scholar] [CrossRef]
  9. Hamada, M.; Nakamura, M.; Tran, M.T.N.; Moriguchi, T.; Hong, C.; Ohsumi, T.; Dinh, T.T.H.; Kusakabe, M.; Hattori, M.; Katsumata, T.; et al. MafB promotes atherosclerosis by inhibiting foam-cell apoptosis. Nat. Commun. 2014, 5, 3147. [Google Scholar] [CrossRef]
  10. Machiya, J.-I.; Shibata, Y.; Yamauchi, K.; Hirama, N.; Wada, T.; Inoue, S.; Abe, S.; Takabatake, N.; Sata, M.; Kubota, I. Enhanced Expression of MafB Inhibits Macrophage Apoptosis Induced by Cigarette Smoke Exposure. Am. J. Respir. Cell Mol. Biol. 2007, 36, 418–426. [Google Scholar] [CrossRef] [Green Version]
  11. Sato-Nishiwaki, M.; Aida, Y.; Abe, S.; Shibata, Y.; Kimura, T.; Yamauchi, K.; Kishi, H.; Igarashi, A.; Inoue, S.; Sato, M.; et al. Reduced Number and Morphofunctional Change of Alveolar Macrophages in MafB Gene-Targeted Mice. PLoS ONE 2013, 8, e73963. [Google Scholar] [CrossRef]
  12. Mantovani, A.; Marchesi, F.; Malesci, A.; Laghi, L.; Allavena, P. Tumour-associated macrophages as treatment targets in oncology. Nat. Rev. Clin. Oncol. 2017, 14, 399–416. [Google Scholar] [CrossRef] [PubMed]
  13. Mehraj, U.; Qayoom, H.; Mir, M.A. Prognostic significance and targeting tumor-associated macrophages in cancer: New insights and future perspectives. Breast Cancer 2021, 28, 539–555. [Google Scholar] [CrossRef] [PubMed]
  14. Ma, J.; Liu, L.; Che, G.; Yu, N.; Dai, F.; You, Z. The M1 form of tumor-associated macrophages in non-small cell lung cancer is positively associated with survival time. BMC Cancer 2010, 10, 112. [Google Scholar] [CrossRef] [PubMed]
  15. Murray, P.J.; Allen, J.E.; Biswas, S.K.; Fisher, E.A.; Gilroy, D.W.; Goerdt, S.; Gordon, S.; Hamilton, J.A.; Ivashkiv, L.B.; Lawrence, T.; et al. Macrophage Activation and Polarization: Nomenclature and Experimental Guidelines. Immunity 2014, 41, 14–20. [Google Scholar] [CrossRef] [PubMed]
  16. Cavnar, M.J.; Zeng, S.; Kim, T.; Sorenson, E.C.; Ocuin, L.M.; Balachandran, V.P.; Seifert, A.M.; Greer, J.B.; Popow, R.; Crawley, M.H.; et al. KIT oncogene inhibition drives intratumoral macrophage M2 polarization. J. Exp. Med. 2013, 210, 2873–2886. [Google Scholar] [CrossRef]
  17. Segura, E.; Touzot, M.; Bohineust, A.; Cappuccio, A.; Chiocchia, G.; Hosmalin, A.; Dalod, M.; Soumelis, V.; Amigorena, S. Human Inflammatory Dendritic Cells Induce Th17 Cell Differentiation. Immunity 2013, 38, 336–348. [Google Scholar] [CrossRef]
  18. Yi, H.; Yu, X.; Gao, P.; Wang, Y.; Baek, S.-H.; Chen, X.; Kim, H.L.; Subjeck, J.R.; Wang, X.-Y. Pattern recognition scavenger receptor SRA/CD204 down-regulates Toll-like receptor 4 signaling–dependent CD8 T-cell activation. Blood 2009, 113, 5819–5828. [Google Scholar] [CrossRef]
  19. Rusmaully, J.; Tvardik, N.; Martin, D.; Billmann, R.; Cénée, S.; Antoine, M.; Blons, H.; Laurent-Puig, P.; Trédaniel, J.; Wislez, M.; et al. Risk of lung cancer among women in relation to lifetime history of tobacco smoking: A population-based case-control study in France (the WELCA study). BMC Cancer 2021, 21, 711. [Google Scholar] [CrossRef]
  20. Mei, J.; Xiao, Z.; Guo, C.; Pu, Q.; Ma, L.; Liu, C.; Lin, F.; Liao, H.; You, Z.; Liu, L. Prognostic impact of tumor-associated macrophage infiltration in non-small cell lung cancer: A systemic review and meta-analysis. Oncotarget 2016, 7, 34217–34228. [Google Scholar] [CrossRef] [Green Version]
  21. Yadav, M.K.; Inoue, Y.; Nakane-Otani, A.; Tsunakawa, Y.; Jeon, H.; Samir, O.; Teramoto, A.; Kulathunga, K.; Kusakabe, M.; Nakamura, M.; et al. Transcription factor MafB is a marker of tumor-associated macrophages in both mouse and humans. Biochem. Biophys. Res. Commun. 2019, 521, 590–595. [Google Scholar] [CrossRef] [PubMed]
  22. Kim, N.; Kim, H.K.; Lee, K.; Hong, Y.; Cho, J.H.; Choi, J.W.; Lee, J.-I.; Suh, Y.-L.; Ku, B.M.; Eum, H.H.; et al. Single-cell RNA sequencing demonstrates the molecular and cellular reprogramming of metastatic lung adenocarcinoma. Nat. Commun. 2020, 11, 2285. [Google Scholar] [CrossRef] [PubMed]
  23. Schmall, A.; Al-Tamari, H.M.; Herold, S.; Kampschulte, M.; Weigert, A.; Wietelmann, A.; Vipotnik, N.; Grimminger, F.; Seeger, W.; Pullamsetti, S.S.; et al. Macrophage and Cancer Cell Cross-talk via CCR2 and CX3CR1 Is a Fundamental Mechanism Driving Lung Cancer. Am. J. Respir. Crit. Care Med. 2015, 191, 437–447. [Google Scholar] [CrossRef] [PubMed]
  24. Cuevas, V.D.; Anta, L.; Samaniego, R.; Orta-Zavalza, E.; De La Rosa, J.V.; Baujat, G.; Domínguez-Soto, Á.; Sánchez-Mateos, P.; Escribese, M.M.; Castrillo, A.; et al. MAFB Determines Human Macrophage Anti-Inflammatory Polarization: Relevance for the Pathogenic Mechanisms Operating in Multicentric Carpotarsal Osteolysis. J. Immunol. 2017, 198, 2070–2081. [Google Scholar] [CrossRef] [PubMed]
  25. Li, Z.; Maeda, D.; Yoshida, M.; Umakoshi, M.; Nanjo, H.; Shiraishi, K.; Saito, M.; Kohno, T.; Konno, H.; Saito, H.; et al. The intratumoral distribution influences the prognostic impact of CD68- and CD204-positive macrophages in non-small cell lung cancer. Lung Cancer 2018, 123, 127–135. [Google Scholar] [CrossRef]
  26. Fu, F.; Zhang, Y.; Gao, Z.; Zhao, Y.; Wen, Z.; Han, H.; Li, Y.; Hu, H.; Chen, H. Combination of CD47 and CD68 expression predicts survival in eastern-Asian patients with non-small cell lung cancer. J. Cancer Res. Clin. Oncol. 2021, 147, 739–747. [Google Scholar] [CrossRef]
  27. Zhang, B.; Yao, G.; Zhang, Y.; Gao, J.; Yang, B.; Rao, Z.; Gao, J. M2-Polarized tumor-associated macrophages are associated with poor prognoses resulting from accelerated lymphangiogenesis in lung adenocarcinoma. Clinics 2011, 66, 1879–1886. [Google Scholar] [CrossRef]
  28. Jung, K.Y.; Cho, S.W.; A Kim, Y.; Kim, D.; Oh, B.-C.; Park, D.J.; Park, Y.J. Cancers with Higher Density of Tumor-Associated Macrophages Were Associated with Poor Survival Rates. J. Pathol. Transl. Med. 2015, 49, 318–324. [Google Scholar] [CrossRef]
  29. Ao, L.; Che, X.; Qiu, X.; Li, Z.; Yang, B.; Wang, S.; Hou, K.; Fan, Y.; Qu, X.; Liu, Y. M2 macrophage infiltration into tumor islets leads to poor prognosis in non-small-cell lung cancer. Cancer Manag. Res. 2019, 11, 6125–6138. [Google Scholar] [CrossRef]
  30. Kreuzer, M.; Boffetta, P.; Whitley, E.; Ahrens, W.; Gaborieau, V.; Heinrich, J.; Jöckel, K.H.; Kreienbrock, L.; Mallone, S.; Merletti, F.; et al. Gender differences in lung cancer risk by smoking: A multicentre case–control study in Germany and Italy. Br. J. Cancer 2000, 82, 227–233. [Google Scholar] [CrossRef] [Green Version]
  31. Ohtaki, Y.; Ishii, G.; Nagai, K.; Ashimine, S.; Kuwata, T.; Hishida, T.; Nishimura, M.; Yoshida, J.; Takeyoshi, I.; Ochiai, A. Stromal Macrophage Expressing CD204 is Associated with Tumor Aggressiveness in Lung Adenocarcinoma. J. Thorac. Oncol. 2010, 5, 1507–1515. [Google Scholar] [CrossRef] [PubMed] [Green Version]
Figure 1. Single-cell RNA sequencing (scRNA-seq) analysis obtained from 44 patients with treatment-naive lung adenocarcinoma. Single-cell RNA raw data included normal lung tissue (n = 11), tumor tissue (stage I and III, n = 7), and advanced tumor tissue (stage IV, n = 4). Raw data were downloaded and processed using sctransform function in Seurat (v3). (A) Identified 17 clusters of the myeloid population. (B) monocytes (Mo), alveolar macrophages (AM), macrophages lineage (ML), and dendritic cells (DC) cluster distribution in normal lung tissues, tumors, and advanced tumors. (C,D) CD68 expression pattern in normal lung tissues, tumor, and advanced tumor. (E,F) CD204 expression pattern in normal lung tissues, tumor, and advanced tumor. (G,H) MAFB expression pattern in normal lung tissues, tumor, and advanced tumor. (I) Heatmap analysis of the expression of MAFB, CD68, and CD204 in AM. (J) Heatmap analysis of the expression of MAFB, CD68, and CD204 in monocytes. (K) Heatmap analysis of the expression of MAFB, CD68, and CD204 in macrophage lineage.
Ijms 23 09945 g001
Figure 2. Grouping non-metastatic lung adenocarcinoma tissue according to MAFB+ cells density. (A) Representative data of immunohistochemical analysis of human lung adenocarcinomas with anti-human MAFB. Arrows point out the MAFB-positive cells. (B) MAFB-positive area relative to tissue area (MAFB/tissue area) was morphometrically quantified. Tissue samples were grouped into top 25% (high-MAFB+ group, MAFB expression area/tissue area = 0–0.005 (n = 30)), 25–50% (mid-MAFB+ group, MAFB expression area/tissue area = 0.006–0.016 (n = 59)), and bottom 25% (low-MAFB+ group, MAFB expression area/tissue area = 0.017–0.121 (n = 31)). (C) MAFB expression in three groups was tested for correlation to tumor sizes. Data are presented as means ± SEM; data is considered significant at * p < 0.05, ** p< 0.01.
Ijms 23 09945 g002
Figure 3. OS and DFS of low-, mid-, and high- in MAFB+ cells Kaplan–Meier analysis of (A) overall survival and (B) disease-free survival of the three groups: low-MAFB+, mid-MAFB+, and high-MAFB+. Difference in survival was compared using log-rank test. Pearson correlation analysis was performed between MAFB expression and (C) survival time (R score: −0.366, p = 0.000043) and (D) disease-free survival (R score: −0.378, p = 0.000023). Data are presented as means ± SEM; data is considered significant at * p < 0.05; ** p < 0.01.
Ijms 23 09945 g003
Figure 4. OS and DFS analysis in smokers and non-smoker patients. Kaplan–Meier analysis of (A) the overall survival and disease-free survival of the low-MAFB+, mid-MAFB+, and high-MAFB+ in the total smoking and non-smoking patients; (B) the overall survival and disease-free survival of the low-MAFB+, mid-MAFB+, and high-MAFB+ in female smoker and non-smoker groups; and (C) the overall survival and disease-free survival of the low-MAFB+, mid-MAFB+, and high-MAFB+ in male smoker and non-smoker groups. Difference in survival was compared using log-rank test. *, p < 0.05; **, p < 0.01.
Ijms 23 09945 g004
Table 1. Correlation between MAFB+ cell density and the clinicopathological factors in non-metastatic lung adenocarcinoma.
Low-MAFB+ (≤0.005)Mid-MAFB+ (0.006–0.016)High-MAFB+ (≥0.017)p-Value of
Fisher’s Exact Test
VariablesNo of Case n = 30 (25%)No of Case n = 59 (49%)No of Case n = 31 (26%)
Age (y)
<7020 (67%)39 (66%)15 (48%)0.2249
≥7010 (33%)20 (34%)16 (52%)
Gender
Male15 (50%)21 (36%) *20 (65%) *0.0302
Female15 (50%)38 (64%) *11 (35%) *
Smoking history
Never12 (40%)25 (42%)8 (26%)0.3046
Former or current18 (60%)34 (58%)23 (74%)
Clinical Stage
I (n = 57)24 (42%) ***30 (53%)3 (5%) ***<0.001
II + III (n = 63)6 (10%) ***29 (46%)28 (44%) ***
Cancer Recurrence
Negative22 (73%) *33 (56%)10 (32%) *0.006
Positive8 (27%) *26 (44%)21 (68%) *
Nodal involvement
Negative (N−)24 (80%) ***32 (54%)4 (13%) ***<0.0001
Positive (N+)6 (20%) ***27 (46%)27 (87%) ***
Lymphatic permeation
Ly(–)26 (87%) ***34 (58%)12 (39%) **<0.001
Ly(+)4 (13%) ***25 (42%)19 (61%) **
Vessel invasion
V(–)23 (77%) ***26 (44%)5 (16%) ***<0.0001
V(+)7 (23%) ***33 (56%)26 (84%) ***
Pleural infiltration
PL(–)23 (77%) *31 (53%)13 (42%)0.019
PL(+)7 (23%) *28 (47%)18 (58%)
According to density of cells expressing MAFB, 120 lung adenocarcinoma patients with stages I, II, and III were grouped into low-MAFB+, mid-MAFB+, and high-MAFB+ cell density groups. Correlation between MAFB expression and clinical factors among groups was recorded and statistically analyzed using Fisher’s exact test, * p < 0.05, ** p < 0.001, *** p < 0.0001.
Table 2. Univariate analysis of disease-free survival and overall survival in non-metastatic lung adenocarcinoma stages.
Univariate AnalysisMultivariate Analysis
Disease-Free SurvivalOverall Survival Disease-Free
Survival
Overall Survival
Hr (95% Ci)p ValueHr (95% Ci)p ValueHr (95% Ci)p ValueHr (95% Ci)p Value
MAFB (low versus mid)2.998 (0.9882–12.95)0.08283.039 (1.001–13.13)0.0791.665 (0.5008–7.565)0.44681.966 (0.5985–8.859)0.3086
MAFB (low versus high)7.423 (2.393–32.44)0.00188.105 (2.620–35.36)0.00111.773 (0.4873–8.669)0.42302.001 (0.5587–9.646)0.3263
Gender (male versus female)1.856 (0.9236–3.847)0.08611.826 (0.9081–3.790)0.095
Smoking (Yes versus No)3.115 (1.369–8.376)0.01220.3208 3.117 (1.368–8.390)0.01233.106 (1290–8.724)0.01822.989 (1.231–8.437)0.0235
Age (<70 versus ≥70)1.010 (0.9697–1.058)0.63971.013 (0.9715–1.062)0.5578
Pstage (I versus II + III)7.500 (3.194–20.72)<0.00018.464 (3.614–23.24)<0.0001
Nodal involvement (Yes versus No)6.497 (2.880–16.71)<0.00017.723 (3.411–19.85)<0.00014.382 (1.555–13.88)0.00785.304 (1.845–17.12)0.0032
Lymphatic invasion (Yes versus No)3.072 (1.522–6.398)0.0023.294 (1.626–6.887)0.00111.049 (0.4812–2.384)0.90641.094 (0.4918–2.522)0.8285
Vessel invasion (Yes versus No)5.444 (2.377–14.71)0.00024.875 (2.136–13.14)0.00051.843 (0.6468–5.939)0.27531.370 (0.4730–4.458)0.5786
Pleural infiltration (Yes versus No)2.740 (1.350–5.803)0.00622.644 (1.306–5.585)0.0081.228 (0.5665–2.793)0.61081.216 (0.5498–2.805)0.6363
Statistically significant differences between groups were determined using Cox proportional hazard model (p < 0.05). HR, hazard ratio; CI, confidence interval.
Publisher’s Note: MDPI stays neutral with regard to jurisdictional claims in published maps and institutional affiliations.

