Article

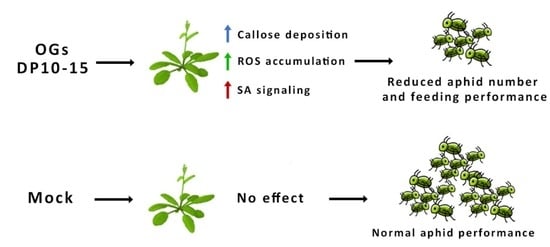
Oligogalacturonides Enhance Resistance against Aphids through Pattern-Triggered Immunity and Activation of Salicylic Acid Signaling

by
Christian Silva-Sanzana
1,2,3,
Diego Zavala
1,2,3,4,
Felipe Moraga
1,2,3,4,
Ariel Herrera-Vásquez
1,2,3,4 and
Francisca Blanco-Herrera
1,2,3,4,*
1
Centro de Biotecnología Vegetal, Facultad de Ciencias de la Vida, Universidad Andres Bello, Santiago 8370146, Chile
2
Millennium Science Initiative Program (ANID), Millennium Nucleus for the Development of Super Adaptable Plants (MN-SAP), Santiago 8370186, Chile
3
Millennium Science Initiative Program (ANID), Millennium Institute for Integrative Biology (iBio), Santiago 8370186, Chile
4
Center of Applied Ecology and Sustainability (CAPES), Santiago 8320000, Chile
*
Author to whom correspondence should be addressed.
Int. J. Mol. Sci. 2022, 23(17), 9753; https://doi.org/10.3390/ijms23179753
Submission received: 30 July 2022 / Revised: 22 August 2022 / Accepted: 25 August 2022 / Published: 28 August 2022
(This article belongs to the Special Issue Plant-Insect Interactions 2022)

Abstract

:
The remarkable capacity of the generalist aphid Myzus persicae to resist most classes of pesticides, along with the environmental and human health risks associated with these agrochemicals, has necessitated the development of safer and greener solutions to control this agricultural pest. Oligogalacturonides (OGs) are pectin-derived molecules that can be isolated from fruit industry waste. OGs have been shown to efficiently stimulate plant defenses against pathogens such as Pseudomonas syringae and Botrytis cinerea. However, whether OGs confer resistance against phytophagous insects such as aphids remains unknown. Here, we treated Arabidopsis plants with OGs and recorded their effects on the feeding performance and population of M. persicae aphids. We also identified the defense mechanism triggered by OGs in plants through the analysis of gene expression and histological approaches. We found that OG treatments increased their resistance to M. persicae infestation by reducing the offspring number and feeding performance. Furthermore, this enhanced resistance was related to a substantial accumulation of callose and reactive oxygen species and activation of the salicylic acid signaling pathway.

Graphical Abstract

1. Introduction

Aphids are a primary agricultural concern because they transmit viral diseases and reduce crop yield by feeding on phloem sap [1,2,3]. Agrochemicals are commonly used to control aphids. However, these insects have evolved resistance to most classes of insecticides [4,5] and have become one of the costliest pests in terms of pesticide applications [6]. In addition, the excessive use of insecticides adversely affects human health and pollutes the environment [7,8]. Thus, developing greener alternatives to control crop pests is necessitated.
Oligogalacturonides (OGs) are pectin-derived oligomers that can be extracted from fruit industry waste, such as citrus peel and apple pomace [9,10,11]. They have been shown to enhance the resistance of plants against relevant pathogens, such as Botrytis cinerea, Pectobacterium carotovorum, and Pseudomonas syringae [12,13,14,15]. OGs are naturally produced by plants following infection by pathogens harboring pectin-modifying enzymes, such as pectin methylesterases, polygalacturonases, and pectate lyases, which break down the homogalacturonan chains that constitute pectin to release OGs. The extracellular pectin-binding domain of the wall-associated kinases (WAKs) recognizes OGs, triggering a defense response through the mitogen-activated protein kinase signaling cascade [16,17,18,19], which involves common pattern-triggered immunity (PTI) responses, such as accumulation of reactive oxygen species (ROS) and deposition of callose [12,13,20,21,22]. OGs also increase the transcription of defense genes related to the salicylic acid (SA) and jasmonic acid signaling pathways [14,15]. Moreover, the defense responses triggered by OGs can vary depending on their degree of polymerization (DP), i.e., the number of galacturonic acid residues that constitute the oligomer. For instance, in Arabidopsis, longer OGs (DP = 10–15) induce higher levels of ROS synthesis and defense-related gene transcription than shorter OGs (DP = 3) [20].
Although OGs increase plant resistance to pathogens, whether they confer the same benefits against aphids remains unknown. Therefore, this study aimed to investigate the potential protective effect of OGs on Arabidopsis against aphids. Based on previous reports of enhanced Arabidopsis resistance against pathogens due to OGs [20,23,24], we used an OG mixture of DP10–15 in this study. We showed that treatment with OGs decreased the offspring number and feeding performance of Myzus persicae aphids, and this was associated with an accumulation of callose, ROS, and the activation of the SA signaling pathway.

2. Results

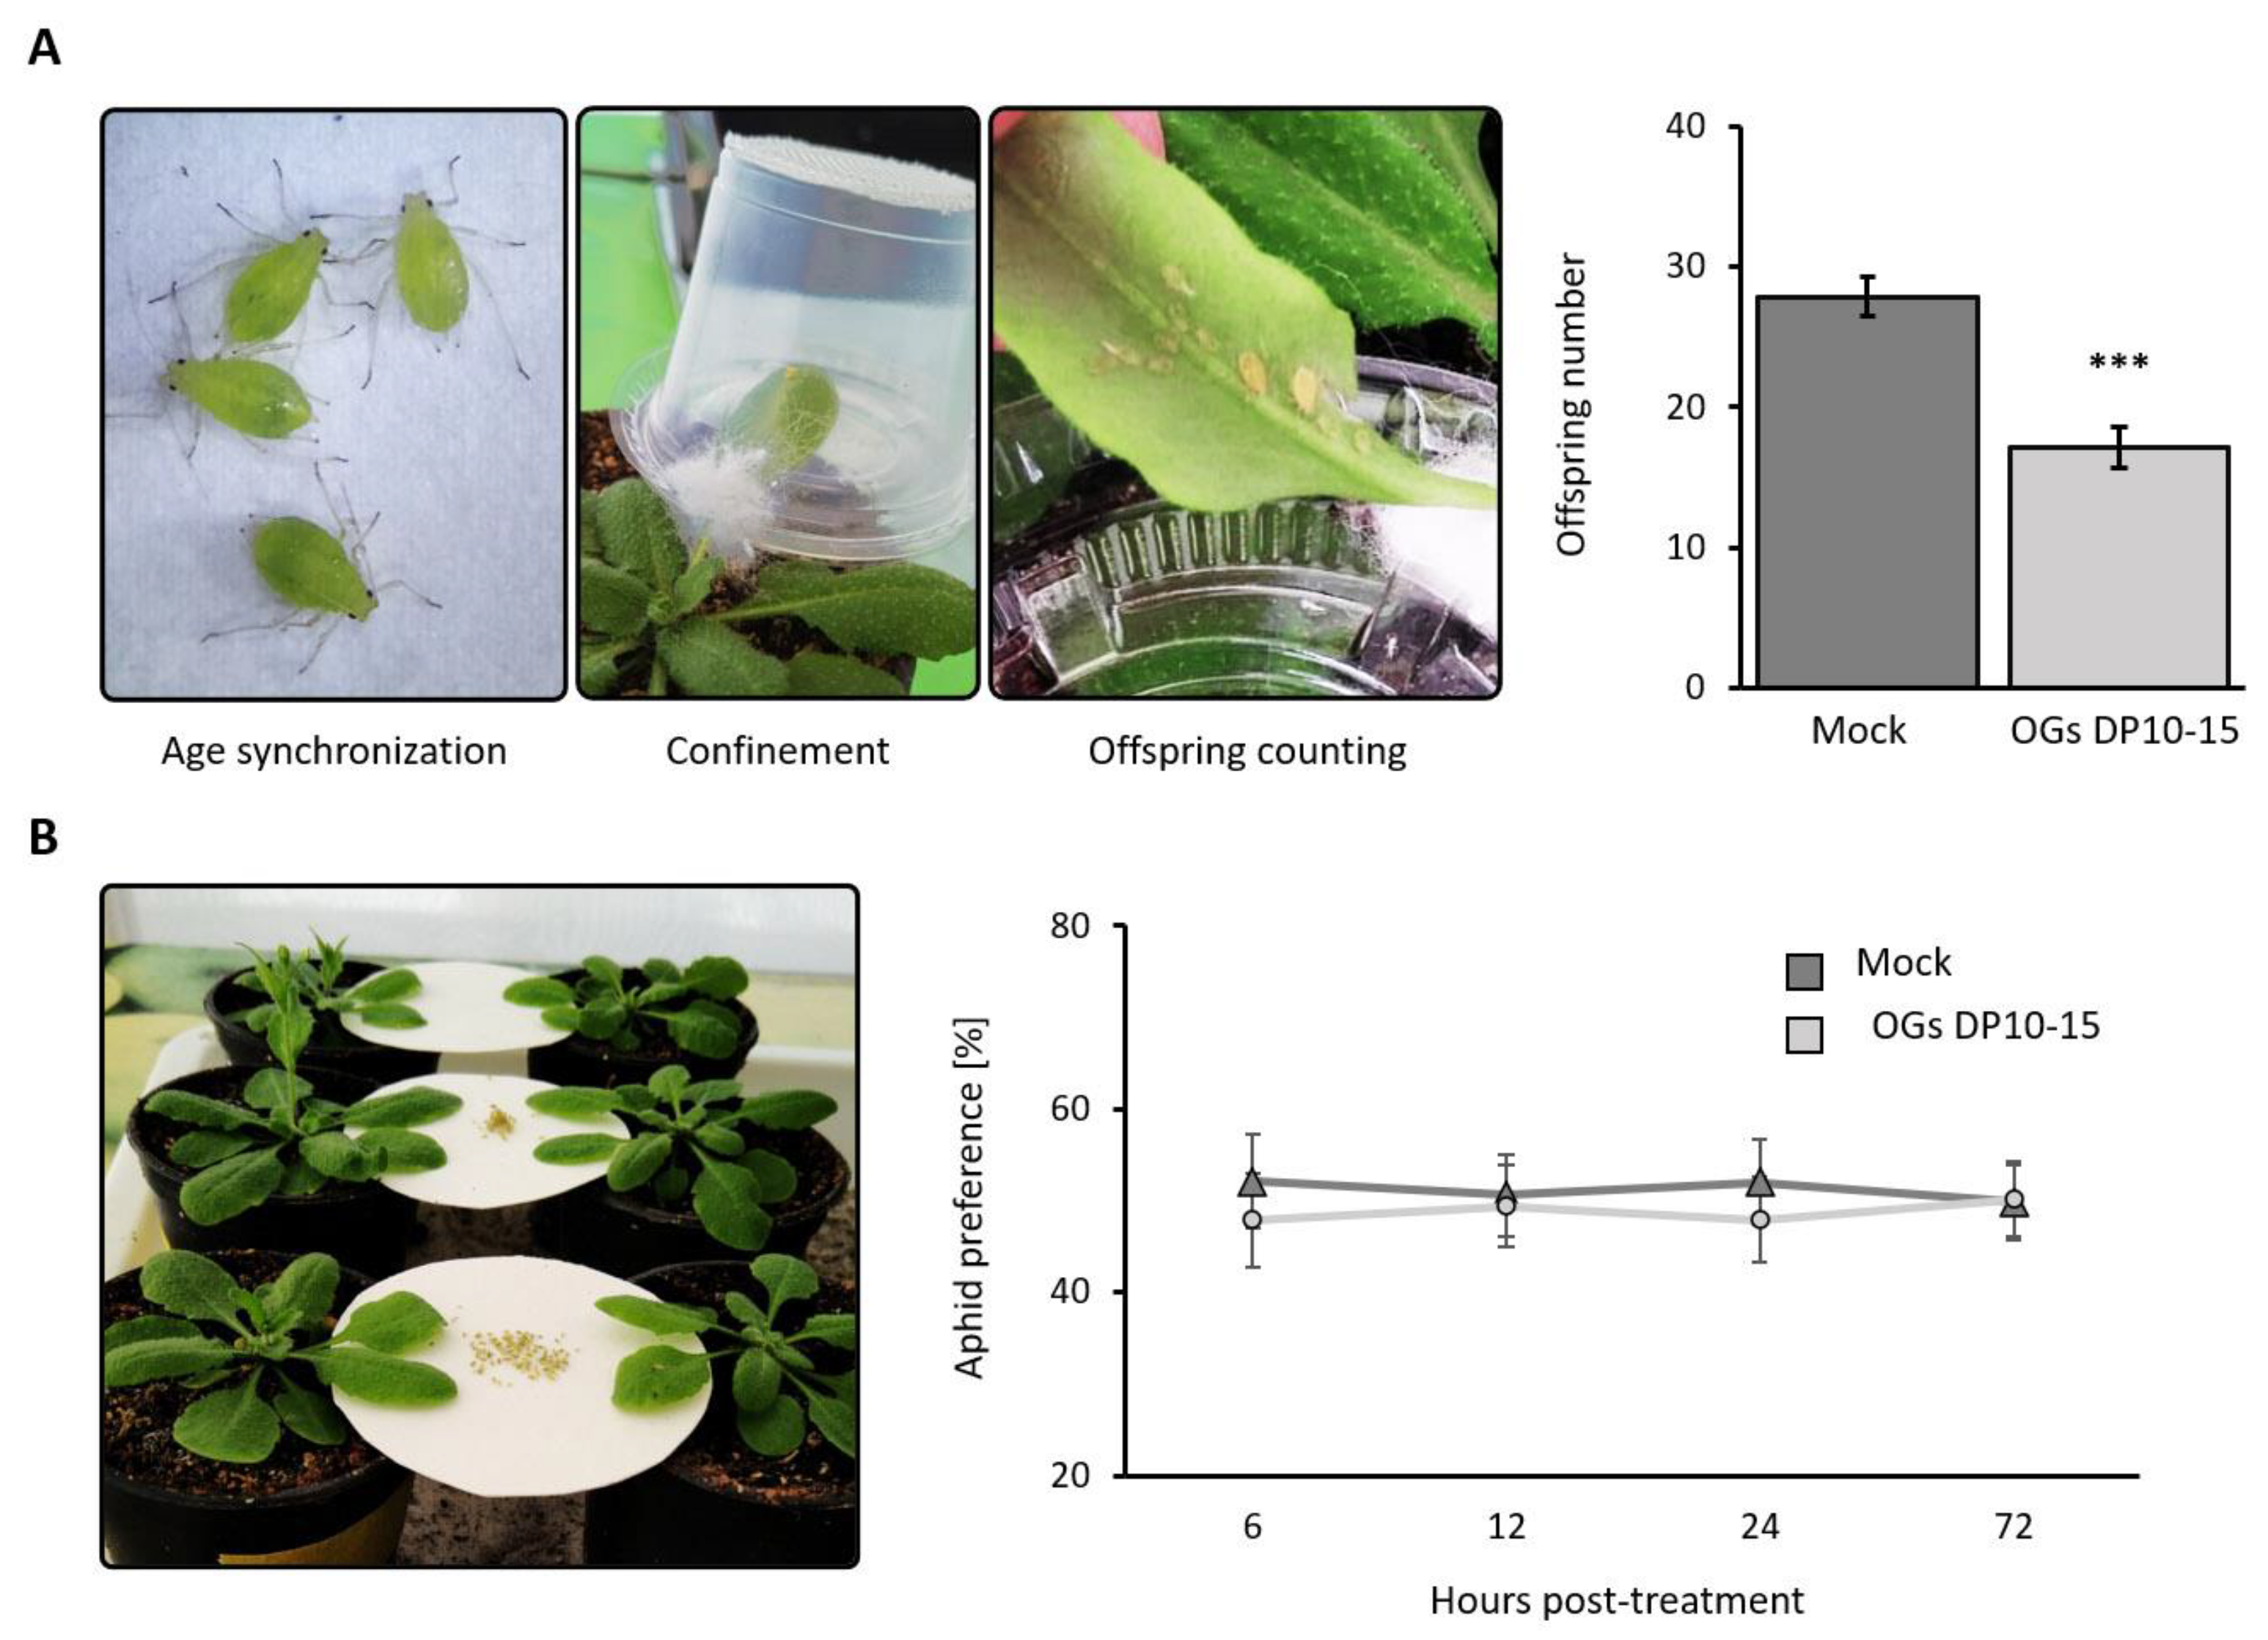
2.1. Treatment with OGs Decreases the Offspring Number of M. persicae

The primary goal of any pesticide is to eliminate or reduce the pest population in the crop. Thus, we first assessed the effect of OGs on the aphid population. The total offspring number significantly reduced by 38% when M. persicae aphids were allowed to obligately feed on OGs DP10–15-treated plants (no-choice assay) than on mock-treated plants (Figure 1A). In addition, we considered that OGs DP10–15-treated plants might be less preferred as hosts by aphids. To test this hypothesis, we performed a “free-choice” assay, wherein aphids could freely settle on their preferred host based on visual, olfactory, and gustatory evaluation. We found that both groups of plants were equally preferred by M. persicae (Figure 1B).

2.2. Aphids Experience Mechanical Difficulties in Probing and Extended Times of Phloem Salivation when Feeding on OG-Treated Plants

To determine the reasons underlying the reduced aphid population in OG (DP 10–15)-treated plants (Figure 1A), we analyzed their feeding behavior at 6, 12, 24, and 72 h post-treatment (hpt) using electrical penetration graph (EPG) assays. The feeding behavior of the aphids in the presence of the two groups of plants did not significantly change at 6 and 12 hpt (Table S1). However, at 24 hpt, aphids showed a significant 3-fold increase in the total time they underwent stylet derailment (i.e., mechanical difficulties to penetrate) in OG-treated plants compared to mock (Table S1). In addition, at 72 hpt, this effect strengthened to a 14-fold increase when feeding on OG-treated plants with respect to the control group (Figure 2).
Moreover, at 72 hpt, we found that the time spent by aphids injecting saliva into the phloem and the time they took for the initial probe significantly increased when they fed on OG-treated than on mock-treated plants (Figure 2).

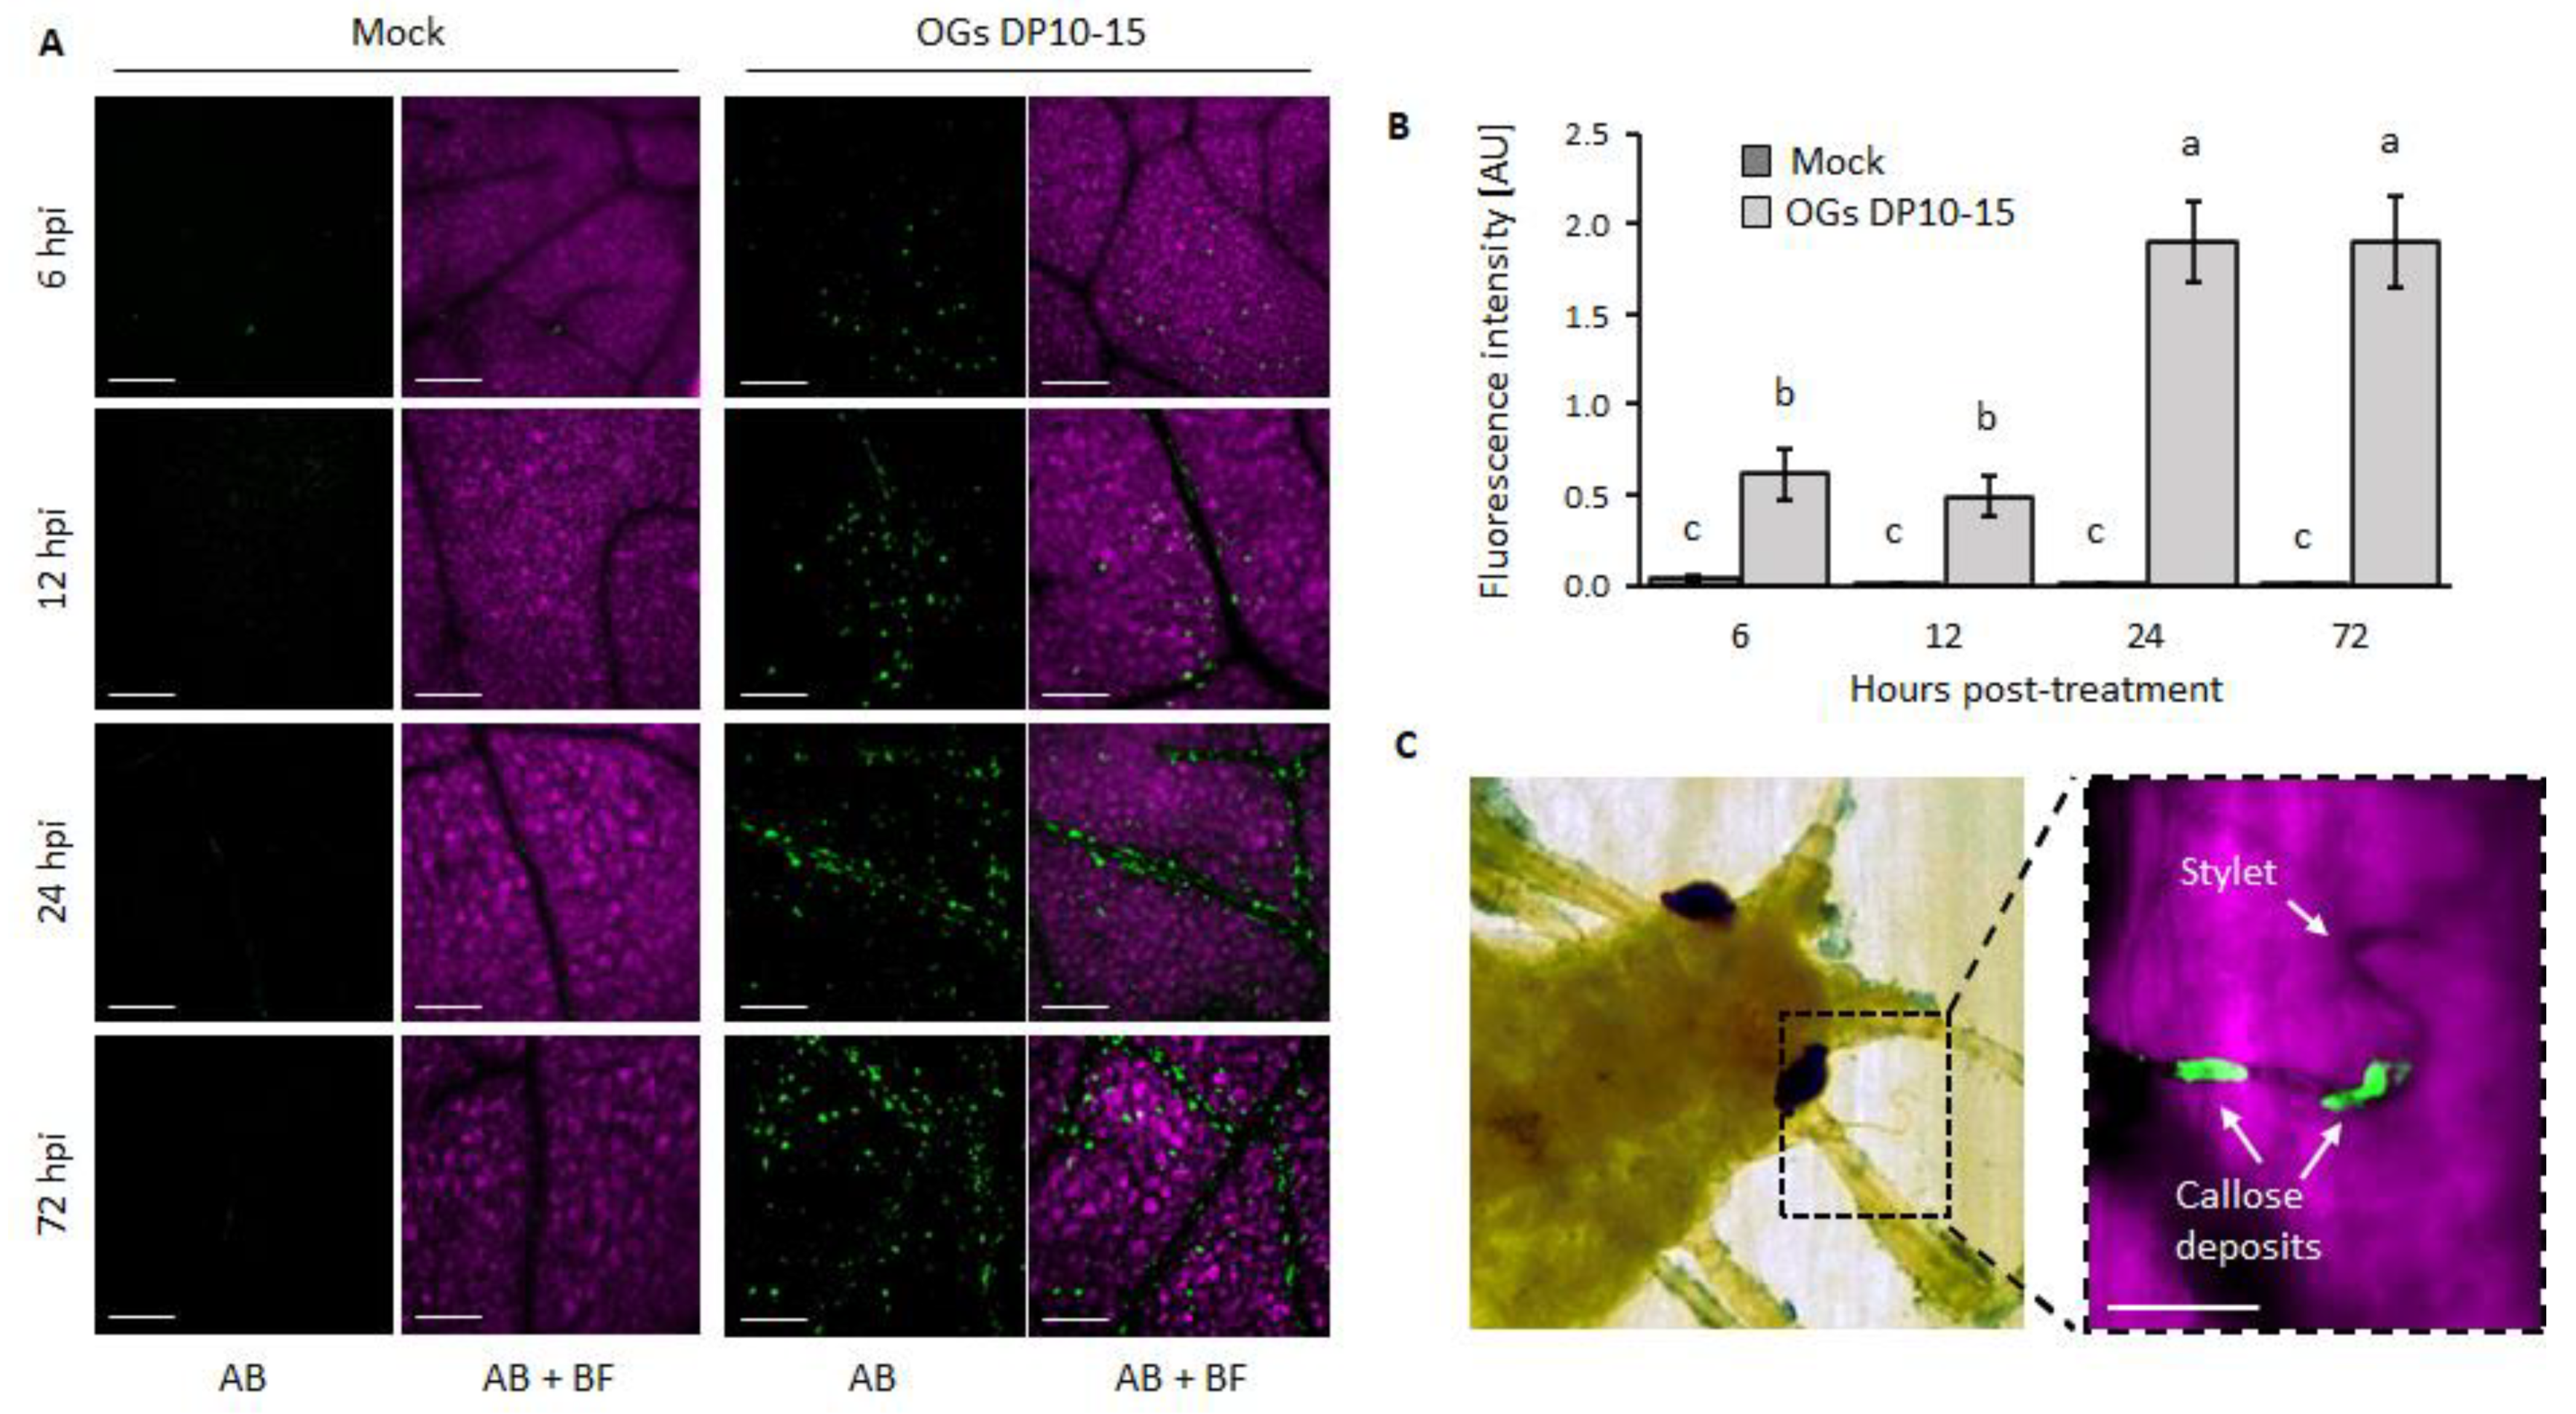
2.3. OGs Induce an Accumulation of Callose and ROS

Callose synthesis is a common plant defense mechanism against aphids [25,26]. Indeed, we consistently found callose deposition surrounding the stylets of M. persicae that infested Arabidopsis (Figure 3C and Figure S1). Considering that OGs elicit the deposition of callose [27], we hypothesized that this could contribute to the decreased feeding performance of aphids on OG-treated plants (Figure 1 and Figure 2). Thus, we evaluated the kinetics of callose deposition after OG treatment at the same temporalities at which EPGs were performed. OGs with DP 10–15 more efficiently elicited callose accumulation than those with DP 3 and DP 25–50 (Figure S2). They also significantly induced substantial amounts of callose deposition in Arabidopsis leaves compared with that observed in mock-treated plants at all timepoints (Figure 3A,B, Figures S3–S6). Callose accumulation was higher at the later timepoints (24 and 72 hpt) than at the earlier ones (6 and 12 hpt; Figure 3A,B).
The accumulation of ROS upon aphid infestation in plants has been previously reported [28,29], and in Arabidopsis, it can be elicited by OG treatment, where it peaks at early temporalities (6–8 hpt) [20,30]. In our study, intracellular ROS accumulated locally, close to the feeding site of M. persicae both in the vascular bundle and mesophyll, 6 h post-infestation (Figure 4A and Figure S7). The intracellular ROS at 6 hpt, induced by OG treatment, was not detected in mock-treated leaves (Figure 4B,C and Figure S8).

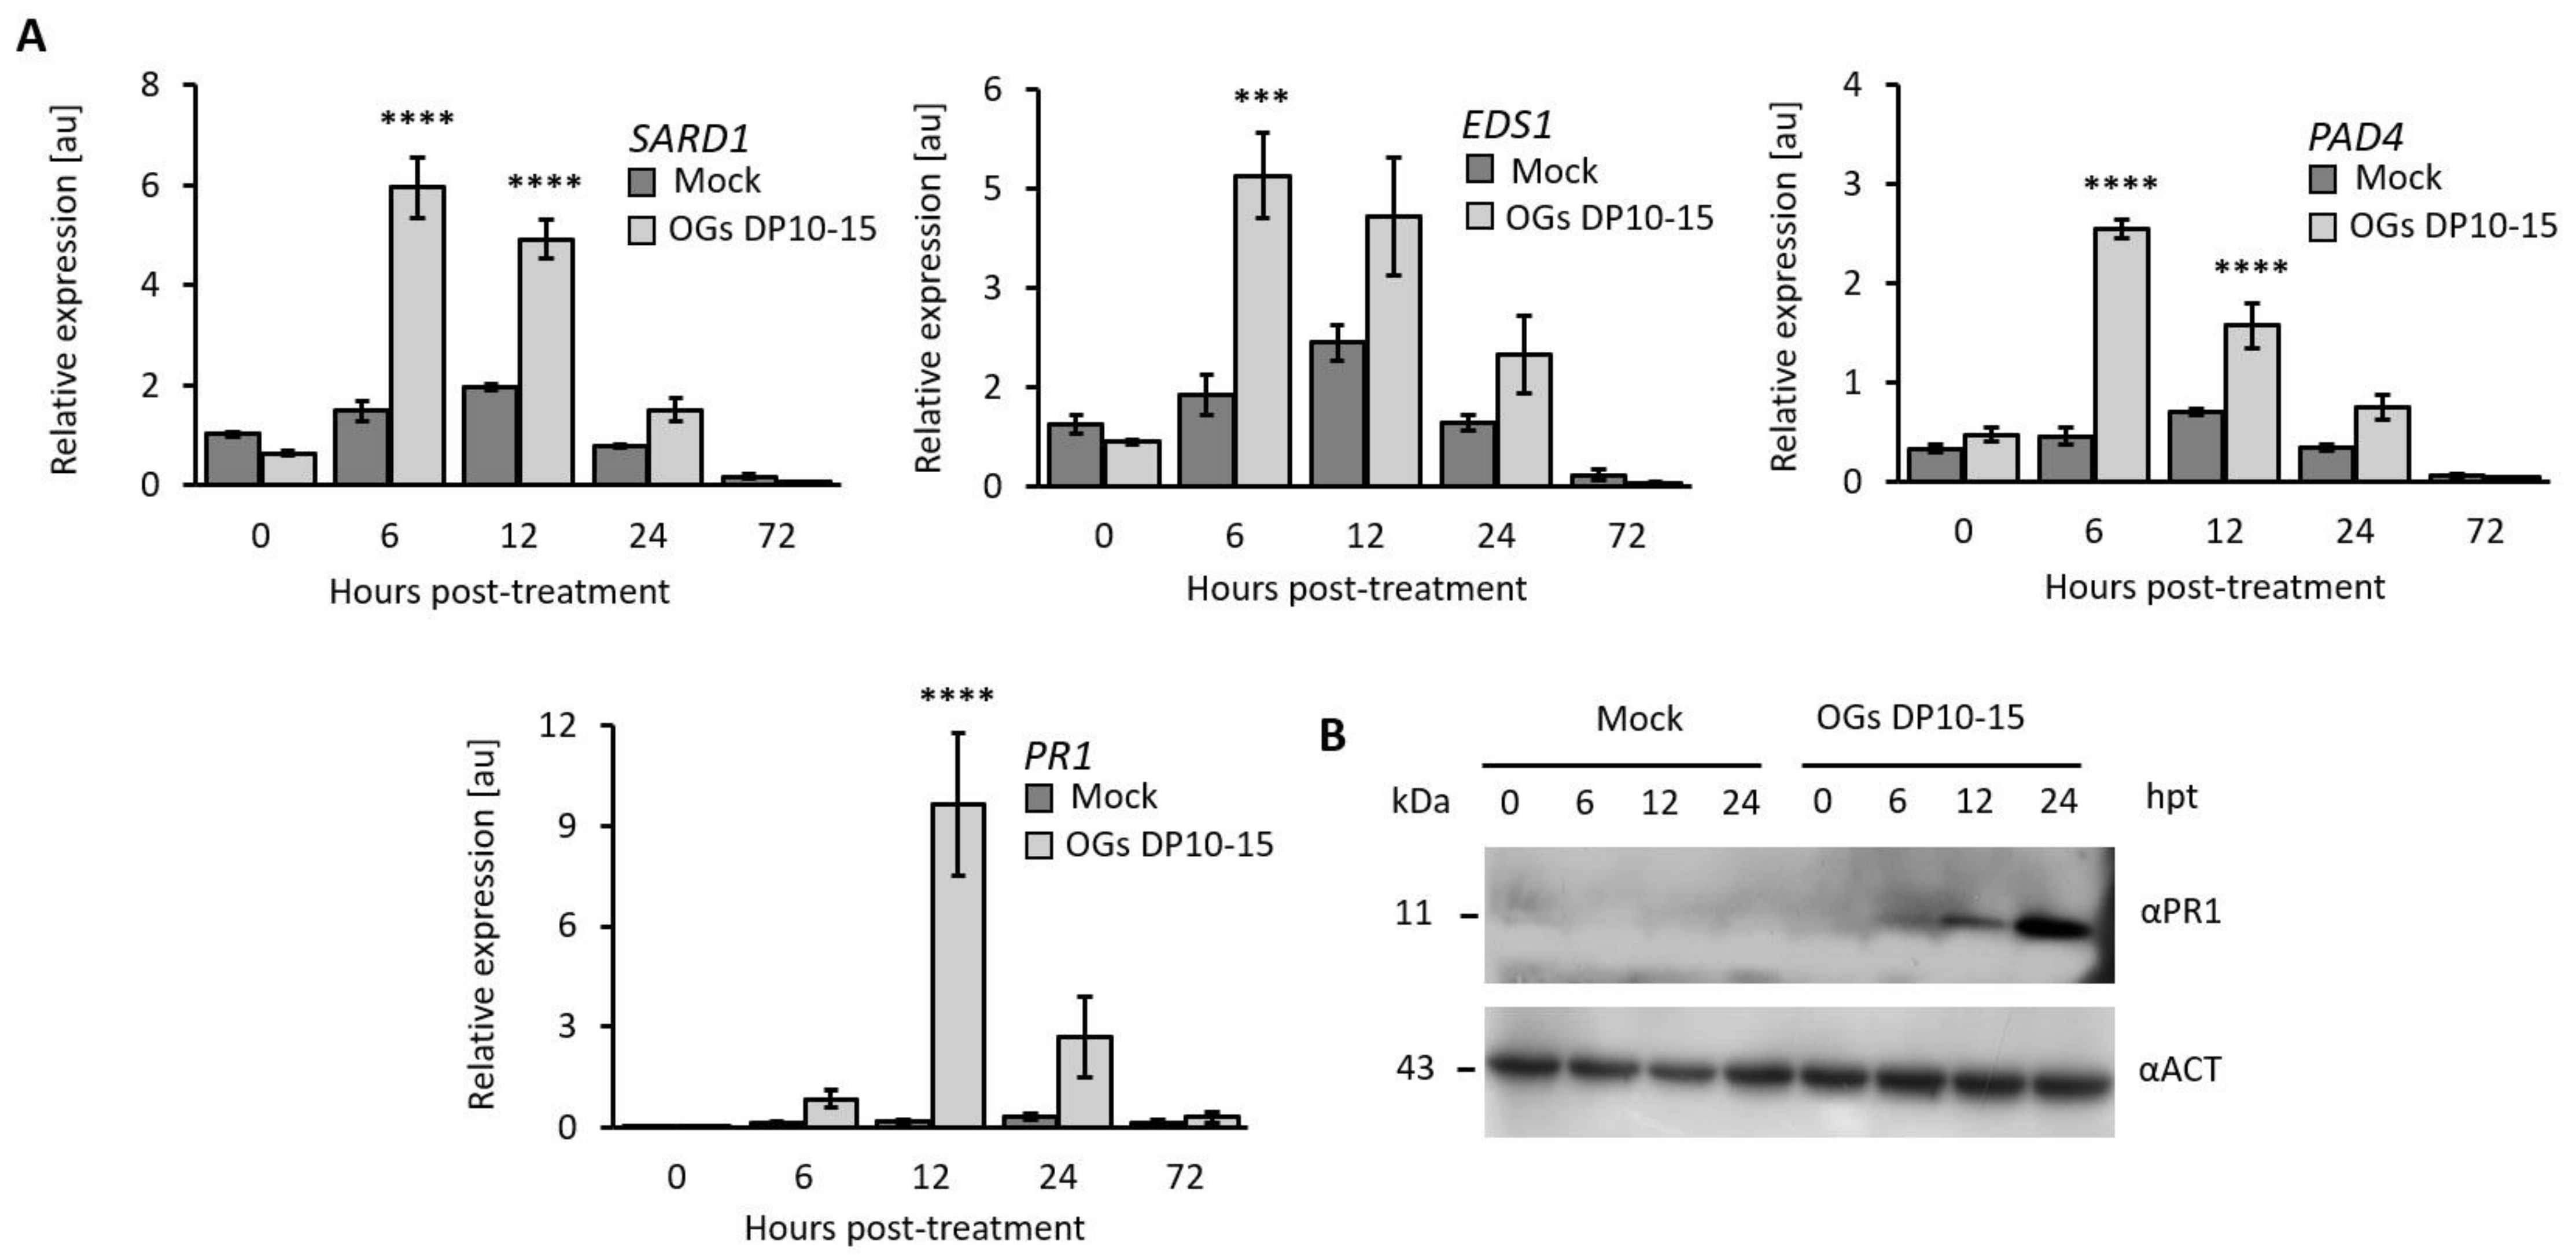
2.4. OGs Increase the Expression of Genes Related to the SA Signaling Pathway

The SA signaling pathway is a critical element of the plant defense response against biotic threats. Thus, to determine if it was involved in the OG-induced resistance to aphids, we evaluated the expression profiles of the SA marker genePR1 and of the genes participating in hormone biosynthesis and signaling, namely, SARD1, EDS1, and PAD4. OG (DP 10–15)-treated plants exhibited significantly increased transcript accumulation of the four evaluated SA marker genes compared with mock-treated plants at 6 and 12 hpt (Figure 5A). SARD1 transcripts significantly increased by 4.0-fold at 6 hpt, lasting until 24 hpt (Figure 5A). EDS1 and PAD4 transcripts significantly increased in number by 3.4- and 5.6-fold, respectively, at 6 hpt. PR1 showed the most drastic and significant increase of 57-fold in transcript levels at 12 hpt (Figure 5A). The PR1 protein also evidently accumulated at 12 and 24 hpt (Figure 5B).

2.5. OG-Mediated Resistance Requires SA Accumulation

Concomitant with the significant increase in SA signaling and SA biosynthesis gene expression, we found that the total hormone levels also increased by 2.4-fold and 3.2-fold at 12 and 24 hpt, respectively (Figure 6A), supporting the PR1 protein accumulation in OG-infiltrated plants at the same temporalities (Figure 5B). This result further confirms that OGs (DP 10–15) activate SA signaling.
To evaluate the biological importance of SA accumulation to the OG-mediated defense against aphids, we used Arabidopsis plants deficient in SA accumulation, NahG plants, expressing a salicylate hydroxylase enzyme, which converts SA to catechol [31], and a sid2 mutant plant deficient in SA biosynthesis [32]. These genotypes were first treated with OGs (DP 10–15) and then challenged with aphids in a no-choice assay to evaluate the number of offspring produced by the insect. We found that treating these plants with the OGs did not increase their resistance against M. persicae aphids, as no changes were observed in the total number of offspring (Figure 6B).

3. Discussion

The most common strategy to control aphid infestation is the use of pesticides. However, these agrochemicals pose risks to human health and the environment. Exposure to pesticides via water bodies, air, fruits, and vegetables, along with occupational exposure, has been associated with different types of cancers in adults and children [33,34,35,36,37]. The European Commission, through the “European Green Deal,” aims to reduce the use and risk of chemical pesticides by 50% by 2030 [38]. Therefore, greener pesticides and new pest management strategies are necessary for achieving sustainable and eco-friendly agricultural goals.
OGs, which are plant cell wall-derived oligomers specifically obtained from the homogalacturonan domain, are promising immune-stimulating molecules to fulfill this goal. They are extracted from fruit industry waste, such as apple byproducts and citrus peel [9,10,11]. These oligomers have been shown to participate in relevant plants mechanisms such as the trade-off between plant growth and defense. For instance, transgenic Arabidopsis plants with the capacity to accumulate high levels of endogenous OGs were more resistant to B. cinerea, P. carotovorum, and P. syringae than wild-type plants. However, they also exhibited reduced growth [39], suggesting that the constant activation of defense responses caused by the abnormally high levels of OGs consumes and diverts the resources allocated for growth. Indeed, the application of OGs downregulates the expression of auxin-related genes [40]. Thus, the strategy for using OGs as a pest control agent must be carefully developed to avoid biomass or yield reduction.
OGs have been shown to reduce disease symptoms caused by common crop pathogens, such as B. cinerea, in grapevines, strawberries, Arabidopsis, and tomatoes [12,13,41,42]. However, their protective effects against phytophagous insects such as aphids are unknown. Our study indicates that OGs (DP 10–15) effectively reduced the colonization of M. persicae on Arabidopsis leaves because they deposited significantly less offspring and encountered more difficulties feeding on OG-treated plants than on mock-treated plants (Figure 1A and Figure 2). Despite the known involvement of OGs in the defense–growth trade-off, no differences were found in the size of OG-treated plants compared with mock-treated ones (Supplementary Figure S9), probably because all experiments involved treatment of mature, fully expanded leaves. Thus, the possibility that OGs affected growth responses in these leaves was reduced, and their effect was limited to their defense-eliciting activity. Intriguingly, despite decreased aphid performance, treatment with OGs (DP 10–15) did not dissuade aphids from settling (Figure 1B), suggesting that aphids cannot discriminate between OG-treated and mock-treated plants in the first stages of host finding and settling. This exciting feature of OGs could be further studied and developed to improve the efficiency of trap cropping in integrated pest management strategies. The treated trap plants could silently reduce the aphid population without compromising their attractiveness to the insects.
Further, we identified the plant defense responses triggered by OGs that could be responsible for the reduced performance of aphids. We found that callose deposition substantially accumulates after OGs DP10–15 treatments, peaking at 24 and 72 hpt (Figure 3, Supplementary Figures S3–S6), which correlates with the increase in feeding difficulties experienced by aphids at these timepoints (Figure 2, Supplementary Table S1). The substantial deposition of callose could hinder the movement of the stylets through the intercellular polymer matrix, as the aphids fed on OG-treated plants. This hypothesis is supported by the fact that increased callose synthesis has been considered a trait of resistance against aphids in some varieties of wheat, barley, and pepper [25,26,43]. Moreover, the ROS accumulation triggered by OGs (Figure 4) could also contribute to the penetration difficulties in aphids, as ROS produced during OG oxidation in the apoplast has been shown to promote cell wall fortification through lignin polymerization and indole-3-acetic acid oxidation [44].
We also observed that treatment with OGs increased the time spent by aphids on phloem salivation (Figure 2). This feeding activity had been related to the injection of salivary elements of aphids (e.g., effector proteins) that point to suppress defense mechanisms of plants [45,46]. For example, the M. persicae salivary protein Mp55 suppresses PTI responses in Arabidopsis because its expression in the plant significantly reduced callose and ROS accumulation upon aphid infestation compared with wild-type plants [47]. Thus, the longer times spent in phloem salivation while feeding on OG-treated plants could be a strategy by which aphids try to suppress OG-elicited callose deposition (Figure 3), ROS accumulation (Figure 4), and activation of the SA signaling pathway (Figure 5).
Our study highlighted that SA is a critical component driving the OG-elicited defense response against aphids. Treatment with OGs (DP 10–15) activated SA signaling and accumulation (Figure 5 and Figure 6), consistent with a previous study showing that the downstream signaling after OGs bind to the pectin receptors (WAKs) depends on PAD4 and EDS1 [48], which are critical genes participating in the SA-mediated immune response in Arabidopsis [49]. In addition, the increase in ROS and SA levels (Figure 4 and Figure 6A) is consistent with the described cross-relationship between these molecules, wherein SA accumulation is preceded by a ROS burst that activates a PTI or an effector-triggered immune response [50,51], conferring increased resistance against bacterial pathogens and, as we have demonstrated in this report, against aphids. Our results are also consistent with those of a previous study wherein treatment with OGs led to the increased transcription of SA-related genes in Arabidopsis, resulting in enhanced resistance against P. syringae [15].
To further understand the role of SA in OG-induced resistance against aphids, we treated two SA-deficient Arabidopsis genotypes (NahG and sid2) [31,32] with OGs and challenged them with M. persicae aphids. The results revealed that the resistance conferred by OGs in wild-type plants was abolished in NahG and sid2 plants as treating them with OGs did not decrease the number of aphid offspring (Figure 6, highlighting that SA is essential for OG-induced resistance against aphids. Altogether, this study shows that treatment with OGs with a DP of 10–15 enhances the resistance of Arabidopsis against aphids (Figure 1 and Figure 2) by inducing PTI responses (callose and ROS accumulation; Figure 3 and Figure 4) and activating the SA signaling pathway (Figure 5 and Figure 6).

4. Materials and Methods

4.1. Maintenance of Plants and Insects

All experiments were conducted under the following controlled environmental conditions: 21–26 °C, 12 h/12 h dark/light cycle, 35–50% relative humidity, and light intensity of 120 μmol m−2 s−1. Arabidopsis seeds were sown in pots filled with a 2:1 substrate mixture of peat–vermiculite soil. For all assays, 4-week-old plants were used. Parthenogenetic colonies of the green peach aphid M. persicae were maintained on Brassica oleracea plants grown in peat–vermiculite soil. Insect growth chambers were set to conditions of 25 °C, 12 h/12 h dark/light cycle, and 35–50% relative humidity. B. oleracea plants were changed regularly to encourage aphid growth.

4.2. Genotypes

The Arabidopsis genotypes used in this study correspond to wild-type Col-0, an NahG transgenic line expressing a salicylate hydroxylase from Pseudomonas putida that metabolizes SA to catechol [31], and a sid2 mutant carrying a mutation in the isochorismate synthase 1 gene (ICS1), which is involved in SA biosynthesis [32].

4.3. Bioassays

For all bioassays, fully expanded leaves of 4-week-old Arabidopsis plants (wild-type Col-0) were infiltrated using a tipless syringe with 200 µg mL1 of OGs, with a DP ranging from 10–15 (Elicityl OligoTech, Crolles, France), dissolved in ultrapure water. As the control (mock), ultrapure water was used. The infiltration method was used to ensure that the oligomers entered homogeneously into the leaves’ apoplast. These molecules have a large negative charge, and if sprayed, can make diffusion and entry into plant tissue difficult [52].
No-choice assays were used to evaluate the total number of offspring produced by aphids under the different conditions studied. For this, two 1-day-old nymphs of M. persicae aphids were placed on the treated leaves using a paintbrush and confined in transparent plastic cages with a transparent mesh on top to allow for gas exchange (Figure 1A). The total number of offspring was recorded 12 days after confinement. The results are expressed as the total number of offspring.
Free-choice assays were performed to evaluate the settling preference of aphids. First, plant-attached leaves, OG-treated or mock-treated, were placed on the choice arena as indicated in Figure 1B. Thirty wingless M. persicae adults were placed in the center of the choice arena and were allowed to freely choose their preferred host. After 6, 12, 24, and 72 hpt, the number of aphids on each leaf was registered. Host preferences of aphids were expressed as percentages.
Probing behavior on host plants was monitored using EPG. Briefly, aphids and plants were made parts of an electrical circuit, which is completed when the aphid inserts its stylet into the plant. Adult wingless M. persicae aphids were immobilized on a pipette tip coupled to a vacuum pump; then, a 12 mm diameter gold wire was attached to the insect dorsum using water-based silver glue (EPG Systems, Wageningen, the Netherlands). The other end of the gold wire was attached to the EPG probe provided with the Giga-8 device. The EPG circuit was completed by inserting a copper electrode into the plant soil (ground). Wired aphids were placed on treated leaves, and the feeding behavior was monitored for 8 h. The number of replications for each condition (mock or OGs) was at least 15. EPG waveforms were recorded using a Giga-8 DC-EPG device (EPG Systems, Wageningen, the Netherlands) and manually analyzed using Stylet1 (EPG System, Wageningen, the Netherlands. The parameters derived from EPGs were expressed as the total duration in minutes.

4.4. Callose and ROS Visualization

For callose imaging, the collected leaves were fixed in a solution of acetic acid and ethanol (1:3) for 1 week. They were washed twice with a solution of 0.15 M dipotassium hydrogen phosphate (K2HPO4) for 15 min and stained with an aniline blue solution for 2 h, prepared by dissolving 1 µg mL−1 of aniline blue dye in 100 mL of 0.15 M K2HPO4. The stained leaves were mounted on glass slides with glycerol and visualized using confocal microscopy (TCS LSI confocal microscope, Leica). The fluorescence signal intensity was used as a semi-quantitative parameter to plot the differences in callose deposition between OG- and mock-treated plants using the ImageJ software.
Intracellular ROS were visualized using the dichlorofluorescein diacetate (DCF-DA) method. The collected leaves were submerged in a solution of 0.4 mM DCFH-DA (Sigma-Aldrich, Saint Louis, MO, USA) in phosphate buffer (20 mM, pH 7.2) and 0.02 % Tween 20 (Biotium, Fremont, CA, USA) for 15 min, briefly washed with phosphate buffer (20 mM, pH 7.2), and mounted on glass slides with glycerol. Samples were visualized using confocal microscopy (TCS LSI confocal microscope, Leica Microsystems, Wetzlar, Germany).

4.5. Gene Expression Analysis Using RT-qPCR

Total RNA was extracted from frozen mock-treated or OG-treated Arabidopsis leaves using TRIzol® (Invitrogen) according to the manufacturer’s instructions. The quality of RNA was evaluated using denaturing gel electrophoresis, and the RNA was quantified by measuring the absorbance at 260 and 280 nm in a spectrophotometer (EPOCH). cDNA was synthesized from 1 µg of total RNA using the All-In-One 5X RT MasterMix kit (abm, Vancouver, Canada). Then, qPCR was performed using the Brilliant III Ultra-Fast SYBR® Green QPCR Master mix reagent (Agilent, Santa Clara, CA, USA, #600882) on an AriaMx real-time PCR system. The expression levels of target genes were calculated relative to the yellow leaf specific 8 gene (YLS8) as a reference.

4.6. Western Blot Analysis

To evaluate PR1 protein levels in OG-treated Arabidopsis leaves, total proteins were extracted, 45 µg were loaded onto 12% denaturing polyacrylamide gel, electrophoresed, and transferred to polyvinylidene difluoride membranes. Membrane blocking was performed at room temperature for 1 h using a phosphate-buffered saline–Tween 20 solution with 5% skim milk. The PR1 protein was detected using a polyclonal anti-PR1 antibody (1:1000 dilution, Agrisera, Umea, Sweden #AS10 687). ACTIN was detected using an anti-ACT primary antibody (1:5000 dilution, Agrisera, Umea, Sewden, #AS13 2640). Anti-rabbit (Thermofisher, Waltham, MA, USA, #31460) antibody was used as the secondary antibody (1:10,000 dilution). The membrane was visualized using the Pierce® ECL Western Blotting Substrate (Thermofisher, Waltham, MA, USA, #32109) according to the manufacturer’s instructions.

4.7. SA Extraction and Quantitation Using High-Performance Liquid Chromatography (HPLC)

SA extracted from leaf tissues was quantified through HPLC using a C8 column and a fluorescence detector, as described previously [53]. Each sample consisted of 0.3–0.5 g of fresh tissue collected from a pool of mature leaves from six plants grown in soil treated as described above. Untreated plants were used as control.

4.8. Statistical Analysis

For all assays, a completely randomized design was used to assign individual plants to the experimental treatments. Data distributions were tested using the Shapiro–Wilk test and Levene’s test for homogeneity of variance. Normally distributed data were analyzed using the Student’s t-test, whereas non-normally distributed data were analyzed using the non-parametric Mann–Whitney U test. Prior to analysis, percentage data obtained from free-choice assays were transformed using ArcSin (√x). Signal intensity data from callose imaging were analyzed using two-way analysis of variance using the general linear model procedure to determine the effects of treatment (OGs), time (hours post-treatment), and their interaction. Mean separation was calculated using Fisher′s least significant difference test. EPG parameters describing probing behavior were calculated manually and the mean and standard error were subsequently calculated using Excel. The relative gene expression presented in the results corresponds to the ΔCT value, calculated as the difference between the expression of the target gene and reference gene (YLS8). For each gene, the relative expressions determined in the mock- and OG-treated samples were compared using the Student’s t-test. Statistical data were analyzed using R version 4.2.0 (R Core Team, 2022) and GraphPad Prism 8 software.

Supplementary Materials

The following supporting information can be downloaded at: https://www.mdpi.com/article/10.3390/ijms23179753/s1.

Author Contributions

Conceptualization and methodology, C.S.-S. and F.B.-H.; Bioassays, callose and ROS imaging, and statistical analysis, C.S.-S.; Gene expression analysis, Western blot, and statistical analysis, D.Z.; Bioassays and statistical analysis, F.M.; Salicylic acid quantification, A.H.-V.; Writing, C.S.-S., with inputs from D.Z., F.M., F.B.-H. and A.H.-V. All authors have read and agreed to the published version of the manuscript.

Funding

This work was supported by Fondo Nacional de Desarrollo Científico y Tecnológico (ANID-FONDECYT 3200902 and 1210320)—Programa Iniciativa Científica Milenio NCN2021_010, and ANID PIA/BASAL FB0002 to F.B.-H., ANID-FONDECYT Iniciación 11200944 to A.H.-V.

Institutional Review Board Statement

Not applicable.

Informed Consent Statement

Not applicable.

Data Availability Statement

The data presented in this study are available in supplementary material.

Conflicts of Interest

The authors declare no conflict of interest. The funders had no role in the design of the study; in the collection, analyses, or interpretation of data; in the writing of the manuscript; or in the decision to publish the results.

References

  1. McKirdy, S.J.; Jones, R.A.C.; Nutter, F.W., Jr. Quantification of yield losses caused by barley yellow dwarf virus in wheat and oats. Plant Dis. 2002, 86, 769–773. [Google Scholar] [CrossRef] [PubMed]
  2. Hooks, C.R.; Fereres, A. Protecting crops from non-persistently aphid-transmitted viruses: A review on the use of barrier plants as a management tool. Virus Res. 2006, 120, 1–16. [Google Scholar] [CrossRef] [PubMed]
  3. Valenzuela, I.; Hoffmann, A.A. Effects of aphid feeding and associated virus injury on grain crops in Australia. Austral. Entomol. 2015, 54, 292–305. [Google Scholar] [CrossRef]
  4. Bass, C.; Puinean, A.M.; Zimmer, C.T.; Denholm, I.; Field, L.M.; Foster, S.P.; Gutbrod, O.; Nauen, R.; Slater, R.; Williamson, M.S. The evolution of insecticide resistance in the peach potato aphid, Myzus persicae. Insect Biochem. Mol. Biol. 2014, 51, 41–51. [Google Scholar] [CrossRef]
  5. Margaritopoulos, J.T.; Kati, A.N.; Voudouris, C.C.; Skouras, P.J.; Tsitsipis, J.A. Long-term studies on the evolution of resistance of Myzus persicae (Hemiptera: Aphididae) to insecticides in Greece. Bull. Entomol. Res. 2021, 111, 1–16. [Google Scholar] [CrossRef]
  6. Murray, D.A.; Clarke, M.B.; Ronning, D.A. Estimating invertebrate pest losses in six major Australian grain crops. Aust. J. Entomol. 2013, 52, 227–241. [Google Scholar] [CrossRef]
  7. Asghar, U.; Malik, M.F.; Javed, A. Pesticide exposure and human health: A review. J. Ecosyst. Ecogr. 2016, 5, 2. [Google Scholar]
  8. Tudi, M.; Daniel Ruan, H.; Wang, L.; Lyu, J.; Sadler, R.; Connell, D.; Chu, C.; Phung, D.T. Agriculture development, pesticide application and its impact on the environment. Int. J. Environ. Res. Public Health 2021, 18, 1112. [Google Scholar] [CrossRef]
  9. Pourbafrani, M.; Forgács, G.; Horváth, I.S.; Niklasson, C.; Taherzadeh, M.J. Production of biofuels, limonene and pectin from citrus wastes. Bioresour. Technol. 2020, 101, 4246–4250. [Google Scholar] [CrossRef]
  10. Yang, G.; Tan, H.; Li, S.; Zhang, M.; Che, J.; Li, K.; Chen, W.; Yin, H. Application of engineered yeast strain fermentation for oligogalacturonides production from pectin-rich waste biomass. Bioresour. Technol. 2020, 300, 122645. [Google Scholar] [CrossRef]
  11. Cano, M.E.; Garcia-Martin, A.; Ladero, M.; Lesur, D.; Pilard, S.; Kovensky, J. A simple procedure to obtain a medium-size oligogalacturonic acids fraction from orange peel and apple pomace wastes. Food Chem. 2021, 346, 128909. [Google Scholar] [CrossRef] [PubMed]
  12. Aziz, A.; Heyraud, A.; Lambert, B. Oligogalacturonide signal transduction, induction of defense-related responses and protection of grapevine against Botrytis cinerea. Planta 2004, 218, 767–774. [Google Scholar] [CrossRef] [PubMed]
  13. Rasul, S.; Dubreuil-Maurizi, C.; Lamotte, O.; Koen, E.; Poinssot, B.; Alcaraz, G.; Wendehenne, D.; Jeandroz, S. Nitric oxide production mediates oligogalacturonide-triggered immunity and resistance to Botrytis cinerea in Arabidopsis thaliana. Plant Cell Environ. 2012, 35, 1483–1499. [Google Scholar] [CrossRef]
  14. Davidsson, P.; Broberg, M.; Kariola, T.; Sipari, N.; Pirhonen, M.; Palva, E.T. Short oligogalacturonides induce pathogen resistance-associated gene expression in Arabidopsis thaliana. BMC Plant Biol. 2017, 17, 19. [Google Scholar] [CrossRef] [PubMed]
  15. Howlader, P.; Bose, S.K.; Jia, X.; Zhang, C.; Wang, W.; Yin, H. Oligogalacturonides induce resistance in Arabidopsis thaliana by triggering salicylic acid and jasmonic acid pathways against Pst DC3000. Int. J. Biol. Macromol. 2020, 164, 4054–4064. [Google Scholar] [CrossRef] [PubMed]
  16. Decreux, A.; Thomas, A.; Spies, B.; Brasseur, R.; Van Cutsem, P.; Messiaen, J. In vitro characterization of the homogalacturonan-binding domain of the wall-associated kinase WAK1 using site-directed mutagenesis. Phytochemistry 2006, 67, 1068–1079. [Google Scholar] [CrossRef] [PubMed]
  17. De Lorenzo, G.; Brutus, A.; Savatin, D.V.; Sicilia, F.; Cervone, F. Engineering plant resistance by constructing chimeric receptors that recognize damage-associated molecular patterns (DAMPs). FEBS Lett 2011, 585, 1521–1528. [Google Scholar] [CrossRef]
  18. Kohorn, B.D.; Hoon, D.; Minkoff, B.B.; Sussman, M.R.; Kohorn, S.L. Rapid oligo-galacturonide induced changes in protein phosphorylation in Arabidopsis. Mol. Cell. Proteom. 2016, 15, 1351–1359. [Google Scholar] [CrossRef]
  19. Bacete, L.; Melida, H.; Miedes, E.; Molina, A. Plant cell wall-mediated immunity: Cell wall changes trigger disease resistance responses. Plant J. 2018, 93, 614–636. [Google Scholar] [CrossRef]
  20. Galletti, R.; Denoux, C.; Gambetta, S.; Dewdney, J.; Ausubel, F.M.; De Lorenzo, G.; Ferrari, S. The AtrbohD-mediated oxidative burst elicited by oligogalacturonides in Arabidopsis is dispensable for the activation of defense responses effective against Botrytis cinerea. Plant Physiol. 2008, 148, 1695–1706. [Google Scholar] [CrossRef]
  21. Gravino, M.; Locci, F.; Tundo, S.; Cervone, F.; Savatin, D.V.; De Lorenzo, G. Immune responses induced by oligogalacturonides are differentially affected by AvrPto and loss of BAK1/BKK1 and PEPR1/PEPR2. Mol. Plant Pathol. 2017, 18, 582–595. [Google Scholar] [CrossRef] [PubMed]
  22. Lu, L.; Yang, Y.; Zhang, H.; Sun, D.; Li, Z.; Guo, Q.; Wang, C.; Qiao, L. Oligogalacturonide-accelerated healing of mechanical wounding in tomato fruit requires calcium-dependent systemic acquired resistance. Food Chem. 2021, 337, 127992. [Google Scholar] [CrossRef]
  23. Ferrari, S.; Galletti, R.; Denoux, C.; De Lorenzo, G.; Ausubel, F.M.; Dewdney, J. Resistance to Botrytis cinerea induced in Arabidopsis by elicitors is independent of salicylic acid, ethylene, or jasmonate signaling but requires PHYTOALEXIN DEFICIENT3. Plant Physiol. 2007, 144, 367–379. [Google Scholar] [PubMed]
  24. Gravino, M.; Savatin, D.V.; Macone, A.; De Lorenzo, G. Ethylene production in Botrytis cinerea-and oligogalacturonide-induced immunity requires calcium-dependent protein kinases. Plant J. 2015, 84, 1073–1086. [Google Scholar] [CrossRef] [PubMed]
  25. Botha, C.E.; Matsiliza, B. Reduction in transport in wheat (Triticum aestivum) is caused by sustained phloem feeding by the Russian wheat aphid (Diuraphis noxia). S. Afr. J. Bot. 2004, 70, 249–254. [Google Scholar] [CrossRef]
  26. Mehrabi, S.; Åhman, I.; Jonsson, L. The constitutive expression and induction of three β-1, 3-glucanases by bird cherry-oat aphid in relation to aphid resistance in 15 barley breeding lines. Arthropod Plant Interact. 2016, 10, 101–111. [Google Scholar] [CrossRef]
  27. Denoux, C.; Galletti, R.; Mammarella, N.; Gopalan, S.; Werck, D.; De Lorenzo, G.; Ferrari, S.; Ausubel, F.M.; Dewdney, J. Activation of defense response pathways by OGs and Flg22 elicitors in Arabidopsis seedlings. Mol. Plant 2008, 1, 423–445. [Google Scholar] [CrossRef]
  28. Kuśnierczyk, A.; Winge, P.E.R.; Jørstad, T.S.; Troczyńska, J.; Rossiter, J.T.; Bones, A.M. Towards global understanding of plant defence against aphids–timing and dynamics of early Arabidopsis defence responses to cabbage aphid (Brevicoryne brassicae) attack. Plant Cell Environ. 2008, 31, 1097–1115. [Google Scholar] [CrossRef]
  29. Sun, M.; Voorrips, R.E.; van Kaauwen, M.; Visser, R.G.; Vosman, B. The ability to manipulate ROS metabolism in pepper may affect aphid virulence. Hortic. Res. 2020, 7, 6. [Google Scholar] [CrossRef]
  30. Bellincampi, D.; Dipierro, N.; Salvi, G.; Cervone, F.; De Lorenzo, G. Extracellular H2O2 induced by oligogalacturonides is not involved in the inhibition of the auxin-regulated rolB gene expression in tobacco leaf explants. Plant Physiol. 2000, 122, 1379–1386. [Google Scholar] [CrossRef]
  31. Delaney, T.P.; Uknes, S.; Vernooij, B.; Friedrich, L.; Weymann, K.; Negrotto, D.; Gaffney, T.; Gut-Rella, M.; Kessmann, H.; Ward, E.; et al. A central role of salicylic acid in plant disease resistance. Science 1994, 266, 1247–1250. [Google Scholar] [CrossRef] [PubMed] [Green Version]
  32. Wildermuth, M.C.; Dewdney, J.; Wu, G.; Ausubel, F.M. Isochorismate synthase is required to synthesize salicylic acid for plant defence. Nature 2001, 414, 562–565. [Google Scholar] [CrossRef] [PubMed]
  33. Infante-Rivard, C.; Labuda, D.; Krajinovic, M.; Sinnett, D. Risk of childhood leukemia associated with exposure to pesticides and with gene polymorphisms. Epidemiology 1999, 10, 481–487. [Google Scholar] [CrossRef] [PubMed]
  34. Ji, B.T.; Silverman, D.T.; Stewart, P.A.; Blair, A.; Swanson, G.M.; Baris, D.; Greenberg, R.S.; Hayes, R.B.; Brown, L.M.; Lillemoe, K.D.; et al. Occupational exposure to pesticides and pancreatic cancer. Am. J. Ind. Med. 2001, 39, 92–99. [Google Scholar] [CrossRef]
  35. Parrón, T.; Requena, M.; Hernández, A.F.; Alarcón, R. Environmental exposure to pesticides and cancer risk in multiple human organ systems. Toxicol. Lett. 2014, 230, 157–165. [Google Scholar] [CrossRef]
  36. Sabarwal, A.; Kumar, K.; Singh, R.P. Hazardous effects of chemical pesticides on human health–Cancer and other associated disorders. Environ. Toxicol. Pharmacol. 2018, 63, 103–114. [Google Scholar] [CrossRef]
  37. Tang, F.H.; Lenzen, M.; McBratney, A.; Maggi, F. Risk of pesticide pollution at the global scale. Nat. Geosci. 2021, 14, 206–210. [Google Scholar] [CrossRef]
  38. Wesseler, J. The EU’s farm-to-fork strategy: An assessment from the perspective of agricultural economics. Appl. Econ. Perspect. Policy 2022. early view. [Google Scholar] [CrossRef]
  39. Benedetti, M.; Pontiggia, D.; Raggi, S.; Cheng, Z.; Scaloni, F.; Ferrari, S.; Ausubel, F.M.; Cervone, F.; De Lorenzo, G. Plant immunity triggered by engineered in vivo release of oligogalacturonides, damage-associated molecular patterns. Proc. Natl. Acad. Sci. USA 2015, 112, 5533–5538. [Google Scholar] [CrossRef]
  40. Pontiggia, D.; Benedetti, M.; Costantini, S.; De Lorenzo, G.; Cervone, F. Dampening the DAMPs: How plants maintain the homeostasis of cell wall molecular patterns and avoid hyper-immunity. Front. Plant Sci. 2020, 11, 613259. [Google Scholar] [CrossRef]
  41. Osorio, S.; Castillejo, C.; Quesada, M.A.; Medina-Escobar, N.; Brownsey, G.J.; Suau, R.; Heredia, A.; Botella, M.A.; Valpuesta, V. Partial demethylation of oligogalacturonides by pectin methyl esterase 1 is required for eliciting defence responses in wild strawberry (Fragaria vesca). Plant J. 2008, 54, 43–55. [Google Scholar] [CrossRef] [PubMed]
  42. Gamir, J.; Minchev, Z.; Berrio, E.; García, J.M.; De Lorenzo, G.; Pozo, M.J. Roots drive oligogalacturonide-induced systemic immunity in tomato. Plant Cell Environ. 2021, 44, 275–289. [Google Scholar] [CrossRef] [PubMed]
  43. Sun, M.; Voorrips, R.E.; Steenhuis-Broers, G.; van’t Westende, W.; Vosman, B. Reduced phloem uptake of Myzus persicae on an aphid resistant pepper accession. BMC Plant Biol. 2018, 18, 138. [Google Scholar] [CrossRef] [PubMed]
  44. Scortica, A.; Giovannoni, M.; Scafati, V.; Angelucci, F.; Cervone, F.; De Lorenzo, G.; Benedetti, M.; Mattei, B. Berberine bridge enzyme-like oligosaccharide oxidases act as enzymatic transducers between microbial glycoside hydrolases and plant peroxidases. Mol. Plant Microbe Interact. 2022. online ahead of print. [Google Scholar] [CrossRef]
  45. Mondal, H.A. Aphid saliva: A powerful recipe for modulating host resistance towards aphid clonal propagation. Arthropod Plant Interact. 2020, 14, 547–558. [Google Scholar] [CrossRef]
  46. Yates, A.D.; Michel, A. Mechanisms of aphid adaptation to host plant resistance. Curr. Opin. Insect Sci. 2018, 26, 41–49. [Google Scholar] [CrossRef] [PubMed]
  47. Elzinga, D.A.; De Vos, M.; Jander, G. Suppression of plant defenses by a Myzus persicae (green peach aphid) salivary effector protein. Mol. Plant Microbe Interact. 2014, 27, 747–756. [Google Scholar] [CrossRef] [PubMed]
  48. Kohorn, B.D.; Kohorn, S.L.; Saba, N.J.; Martinez, V.M. Requirement for pectin methyl esterase and preference for fragmented over native pectins for wall-associated kinase-activated, EDS1/PAD4-dependent stress response in Arabidopsis. J. Biol. Chem. 2014, 289, 18978–18986. [Google Scholar] [CrossRef]
  49. Cui, H.; Gobbato, E.; Kracher, B.; Qiu, J.; Bautor, J.; Parker, J.E. A core function of EDS1 with PAD4 is to protect the salicylic acid defense sector in Arabidopsis immunity. New Phytol. 2017, 213, 1802–1817. [Google Scholar] [CrossRef]
  50. Herrera-Vásquez, A.; Salinas, P.; Holuigue, L. Salicylic acid and reactive oxygen species interplay in the transcriptional control of defense genes expression. Front. Plant Sci. 2015, 6, 171. [Google Scholar] [CrossRef]
  51. Saleem, M.; Fariduddin, Q.; Castroverde, C.D.M. Salicylic acid: A key regulator of redox signalling and plant immunity. Plant Physiol. Biochem. 2021, 168, 381–397. [Google Scholar] [CrossRef] [PubMed]
  52. Bisceglia, N.G.; Gravino, M.; Savatin, D.V. Luminol-based assay for detection of immunity elicitor-induced hydrogen peroxide production in Arabidopsis thaliana leaves. Bio Protocol 2015, 5, e1685. [Google Scholar] [CrossRef]
  53. Verberne, M.C.; Brouwer, N.; Delbianco, F.; Linthorst, H.J.; Bol, J.F.; Verpoorte, R. Method for the extraction of the volatile compound salicylic acid from tobacco leaf material. Phytochem. Anal. 2002, 13, 45–50. [Google Scholar] [CrossRef] [PubMed]
Figure 1. Treatment with OGs decreases the number of aphid offspring. (A) A no-choice assay was performed to determine the effect of OG treatment on the number of offspring deposited by Myzus persicae aphids. Fully expanded leaves of 4-week-old Arabidopsis plants were infiltrated with OGs having a degree of polymerization of 10–15 (DP 10–15) (200 µg mL−1) or ultrapure water (mock). One-day-old nymphs were confined to the treated leaves, and 12 days after treatment, the offspring were counted. Error bars correspond to standard error. Asterisks represent significant differences determined using Student’s t-test (***, p < 0.001; n = 6). (B) A free-choice assay was executed to determine the settling preference of M. persicae. Fully expanded leaves of 4-week-old Arabidopsis plants were infiltrated with OGs (DP 10–15; 200 µg mL−1) or ultrapure water (mock). Subsequently, 30 adult wingless aphids were placed between the treated leaves to freely choose their preferred host at different post-treatment temporalities. The Student’s t-test was used for comparing means. The error bars correspond to standard error. No significant differences were found at any of the temporalities assayed (p > 0.05; n = 10).
Ijms 23 09753 g001
Figure 2. Treatment with OGs negatively alters the feeding performance of aphids. The feeding profiles of M. persicae aphids, on either OG- or mock-treated plants, were analyzed using electrical penetration graph (EPG) assays. Fully expanded leaves of 4-week-old Arabidopsis plants were infiltrated with OGs (DP 10–15; 200 µg mL−1) or ultrapure water (mock). One adult wingless aphid was placed over the treated leaves, and its feeding profile was recorded using EPG for 8 h. Only data from the 72 hpt timepoint are shown, as the main differences were found at this temporality. The results obtained at 6, 12, and 24 hpt are presented in Supplementary Table S1. Significant differences, indicated by asterisks, were determined using the Student’s t-test or the Mann–Whitney U test, depending on the data distribution of each feeding parameter (i.e., Gaussian or non-Gaussian, determined using the Shapiro–Wilk test). The error bars correspond to standard error. At least 15 independent replicates were assayed for each condition (*, p < 0.05; **, p < 0.005; ***, p < 0.001).
Ijms 23 09753 g002
Figure 3. OGs induce the deposition of callose. (A) Representative images of callose deposits in mock- and OG-treated Arabidopsis plants. Fully expanded leaves of 4-week-old Arabidopsis plants were infiltrated with OGs (DP 10–15; 200 µg mL−1) or ultrapure water (mock) (n = 8); scalebar = 200 µm. More replicates are shown in Supplementary Figures S3–S6. (B) Plots show the fluorescence intensities measured from the figures in panel A using the ImageJ software. The fluorescent signal corresponds to callose deposits detected via aniline blue (AB) staining. The error bars correspond to standard error. Means followed by the same letter were not significantly different at p ≤ 0.05 by Fisher’s least significant difference test. (C) Callose deposits consistently formed at penetration sites surrounding the stylets of M. persicae after 6 h of feeding on an Arabidopsis leaf; scalebar = 50 µm. AB = aniline blue signal, BF = brightfield. More replicates are shown in Supplementary Figure S1.
Ijms 23 09753 g003
Figure 4. OGs induce the accumulation of intracellular reactive oxygen species (ROS). Intracellular ROS were detected using the dichlorofluorescein diacetate (DCF-DA) method. (A) Intracellular ROS accumulated after M. persicae infested Arabidopsis leaves. The upper image shows ROS in cells of the main vascular bundle at the feeding site of an aphid. The lower image shows ROS in mesophyll cells surrounding the feeding site of an aphid; scalebar = 300 µm. More replicates are shown in Supplementary Figure S7. (B) Representative images of intracellular ROS accumulation in mock- and OG-treated Arabidopsis leaves at 6 hpt (n = 10); scalebar = 50 µm. More replicates are shown in Supplementary Figure S8. (C) The plot illustrates the fluorescence intensities measured from figures in panel B calculated using the ImageJ software. The fluorescent signal corresponds to intercellular ROS detected using the DCF-DA method in mock- and OG-treated plants. Asterisks represent significant differences determined using the Student’s t-test (****, p < 0.0001).
Ijms 23 09753 g004
Figure 5. Treatment with OGs increases the expression of salicylic acid (SA)-related genes. (A) The transcriptional profile of SA-related genes in fully expanded leaves of 4-week-old Arabidopsis plants, treated with OGs (DP 10–15; 200 µg mL−1), at different post-treatment temporalities. Results are expressed as the relative expression in arbitrary units (au). The error bars represent standard error. Asterisks represent significant differences between mock- and OG-treated samples at the same temporalities as determined using the Student’s t-test (***, p < 0.001; ****, p < 0.0001; n = 4). (B) PR1 protein levels in mock- and OG-treated Arabidopsis leaves at different post-treatment temporalities analyzed using Western blot.
Ijms 23 09753 g005
Figure 6. OG-induced resistance against aphids requires SA accumulation. (A) SA content measured in Arabidopsis leaves treated with OGs (DP 10–15) at 0, 12, and 24 hpt (n = 3). Asterisk represents significant differences found using Student’s t-tests (*, p < 0.05). (B) No-choice assay performed with NahG and sid2 Arabidopsis genotypes deficient in SA accumulation. Fully expanded leaves of 4-week-old Arabidopsis plants were infiltrated with OGs (DP 10–15; 200 µg mL−1) or ultrapure water (mock). One-day-old nymphs were confined to treated leaves of both NahG and sid2 plants, and 12 days after treatment, the number of offspring was counted. Using Student’s t-test, no significant differences were found between the number of offspring deposited by aphids on mock- and OG-treated NahG and sid2 plants. At least six replicates were assayed for each condition.
Ijms 23 09753 g006
Publisher’s Note: MDPI stays neutral with regard to jurisdictional claims in published maps and institutional affiliations.

