Article

PPARGC1A Is a Moderator of Skeletal Muscle Development Regulated by miR-193b-3p

1
State Key Laboratory for Conservation and Utilization of Subtropical Agro-Bioresources, Lingnan Guangdong Laboratory of Agriculture, College of Animal Science, South China Agricultural University, Guangzhou 510642, China
2
Guangdong Provincial Key Lab of Agro-Animal Genomics and Molecular Breeding, and Key Laboratory of Chicken Genetics, Breeding and Reproduction, Ministry of Agriculture, Guangzhou 510642, China
*
Author to whom correspondence should be addressed.
Int. J. Mol. Sci. 2022, 23(17), 9575; https://doi.org/10.3390/ijms23179575
Submission received: 5 August 2022 / Revised: 19 August 2022 / Accepted: 21 August 2022 / Published: 24 August 2022
(This article belongs to the Special Issue Myoblast and Muscle Cell Genesis and Regeneration)

Abstract

:
Meat production performance is one of the most important factors in determining the economic value of poultry. Myofiber is the basic unit of skeletal muscle, and its physical and chemical properties determine the meat quality of livestock and poultry to a certain extent. Peroxisome proliferator-activated receptor gamma coactivator 1-alpha (PPARGC1A) as a transcriptional coactivator has been found to be widely involved in a series of biological processes. However, PPARGC1A is still poorly understood in chickens. In this manuscript, we reported that PPARGC1A was highly expressed in slow-twitch myofibers. PPARGC1A facilitated mitochondrial biogenesis and regulated skeletal muscle metabolism by mediating the flux of glycolysis and the TCA cycle. Gain- and loss-of-function analyses revealed that PPARGC1A promoted intramuscular fatty acid oxidation, drove the transformation of fast-twitch to slow-twitch myofibers, and increased chicken skeletal muscle mass. Mechanistically, the expression level of PPARGC1A is regulated by miR-193b-3p. Our findings help to understand the genetic regulation of skeletal muscle development and provide a molecular basis for further research on the antagonism of skeletal muscle development and fat deposition in chickens.

1. Introduction

In vertebrates, skeletal muscle is made up of myofiber and is the largest tissue in the body. The transformation of myofiber type and changes to the myofiber cross-sectional area are the main modes of skeletal muscle development after birth. Numerous processes have been reported to regulate skeletal muscle development, including genetics, environment, and nutrition, but genetics play the least understood of these critical roles [1].
Peroxisome proliferator-activated receptor gamma coactivator 1-alpha (PPARGC1A) is a member of the peroxisome proliferator-activated receptor gamma coactivator 1 family and was originally identified as a transcriptional coactivator whose expression closely correlated with adaptive thermogenesis following exposure to cold temperatures [2]. In animals, PPARGC1A is widely distributed in various organs and tissues and can interact with a diverse array of transcription factors to regulate numerous aspects of cell physiology [3].
Previous studies have found that PPARGC1A helps to regulate cell processes important for adaptive thermogenesis and energy metabolism, including the related functions of glucose uptake, gluconeogenesis, insulin secretion, and mitochondrial biogenesis [4]. As an important regulator of energy metabolism and mitochondrial biosynthesis [5], PPARGC1A can participate in skeletal muscle development and fatty acid oxidation by regulating the number and respiration of mitochondria [6,7,8,9]. In mice, the skeletal muscle-specific overexpression of PPARGC1A promoted mitochondrial biogenesis and induced the transformation of fast-twitch fibers to slow-twitch fibers [10]. Using PCR-SSCP and DNA sequencing, a single nucleotide polymorphism located in exon 5 of chicken PPARGC1A was found to be associated with skeletal muscle fiber types [11]. However, the exact biological function and regulatory mechanism of PPARGC1A in chicken skeletal muscle development is still poorly understood.
MicroRNAs (miRNAs) are endogenous noncoding single-stranded RNA molecules that can degrade or inhibit target mRNAs by perfect or imperfect pairing with the 3′ untranslated region (3′ UTR) of their target mRNA and play a critical role in the regulation of gene expression at post-transcriptional levels [12,13]. Despite the fact that recent studies have found that miRNAs are widely involved in the regulation of muscle developmental processes [14,15,16], little is known about the function of miRNAs for the transformation of myofiber types in chickens.
In livestock and poultry, skeletal muscles are the main resources of animal protein, and the growth and development of skeletal muscle directly influences animal meat quantity and quality [17]. Skeletal muscle is composed of different types of myofibers. Different types of myofibers are different in function, biochemical characteristics, and morphological characteristics [18,19,20]. Under certain conditions, different types of myofibers can be transformed. Recently, it is becoming increasingly clear that the composition of myofiber types has an important relationship with muscle quality [21,22]. In our previous RNA-seq study, we found that PPARGC1A was differentially expressed between the pectoralis major (PEM; which is mainly composed of fast-twitch fibers) and the soleus (SOL; which has a higher proportion of slow muscle fibers). Here, using lentivirus-mediated PPARGC1A overexpression and interference chicken models, we analyzed the biological functions of PPARGC1A in muscle oxidative metabolism, intramuscular fat breakdown, the transformation of fast-twitch fibers to slow-twitch fibers, and muscle hypertrophy. Moreover, miR-193b-3p, which is highly expressed in fast-twitch fibers, was found to inhibit the expression of PPARGC1A by directly binding to the 3′ UTR of PPARGC1A. Our study helps to understand the genetic regulation of skeletal muscle development and provides a molecular basis for further research on the antagonism of skeletal muscle development and fat deposition in chickens.

2. Results

2.1. Identification of Chicken PPARGC1A

Our previous RNA-seq study found that PPARGC1A was highly expressed in the SOL (which is an important part of the leg muscles, with a high proportion of slow-twitch fibers) (Figure 1A,B), implying that PPARGC1A is probably associated with skeletal muscle development. We examined the tissue expression profile of PPARGC1A and also found high expression in liver, lung, breast, and leg muscles (Figure 1C). In order to further analyze the protein structure of PPARGC1A, we used SOPMA software to predict its secondary structure. The results showed that the alpha helix, beta turn, extended strand, and random coil accounted for 24.91%, 2.77%, 8.93%, and 63.40% of the PPARGC1A protein, respectively (Figure 1D). Furthermore, subcellular location annotation demonstrated that PPARGC1A protein exists in the nucleus (Figure 1E), which provides a basis for its interaction with transcription factors. In addition, molecular phylogenetic analysis revealed the chicken PPARGC1A protein has a large genetic distance from mammals, whereas it is commonly observed in Aves (such as Coturnix japonica and Meleagris gallopavo) (Figure 1F).

2.2. PPARGC1A Facilitates Mitochondrial Biogenesis and Regulates Skeletal Muscle Metabolism

A PPARGC1A overexpression vector was constructed and specific small interfering RNAs (siRNAs) against PPARGC1A were synthesized to prepare efficient PPARGC1A overexpression and under–expression lentiviruses. The qPCR results showed that these vectors and RNA oligonucleotides could significantly overexpress or inhibit the expression of PPARGC1A in chicken primary myoblasts (CPMs) (Figure S1A,B). To investigate the biological functions of PPARGC1A in the development of chicken skeletal muscle, the gastrocnemius of chicks was injected with a construct mediating lentiviral-mediated PPARGC1A overexpression (Lv–PPARGC1A) or lentiviral-mediated PPARGC1A under–expression (Lv–shPPARGC1A) at three time points (Figure 2A). Lentiviral-mediated PPARGC1A overexpression increased the mRNA and protein levels of PPARGC1A in vivo, while PPARGC1A mRNA and protein were downregulated after being injected with the PPARGC1A under–expression lentivirus (Figure 2B,C).
To investigate the role of PPARGC1A in mitochondrial function, we measured the mtDNA content and mitochondrial membrane potential in gastrocnemius injected with the lentivirus. The overexpression of PPARGC1A in gastrocnemius increased mitochondrial content as well as mitochondrial membrane potential (Figure 2D,E). By contrast, the mitochondrial content and mitochondrial membrane potential were reduced with PPARGC1A under–expression in gastrocnemius (Figure 2D,E).
Given that PPARGC1A functions in mitochondrial biogenesis, we performed a comparative metabolome analysis with PPARGC1A under–expression in gastrocnemius to further study the regulation of PPARGC1A on skeletal muscle metabolism. Hierarchical clustering analysis (HCA) based on metabolite levels showed that PPARGC1A under–expression reduced the intermediate products of glycolysis, but facilitated the accumulation of pyruvic acid (which is the end product of glycolysis) (Figure 2F,G; Table S3). Meanwhile, several tricarboxylic acid cycle (TCA cycle) metabolites and adenosine triphosphate (ATP) were actually reduced in PPARGC1A under–expression gastrocnemius (Figure 2F,G; Table S3), suggesting that PPARGC1A may participate in skeletal muscle development by mediating its metabolism.

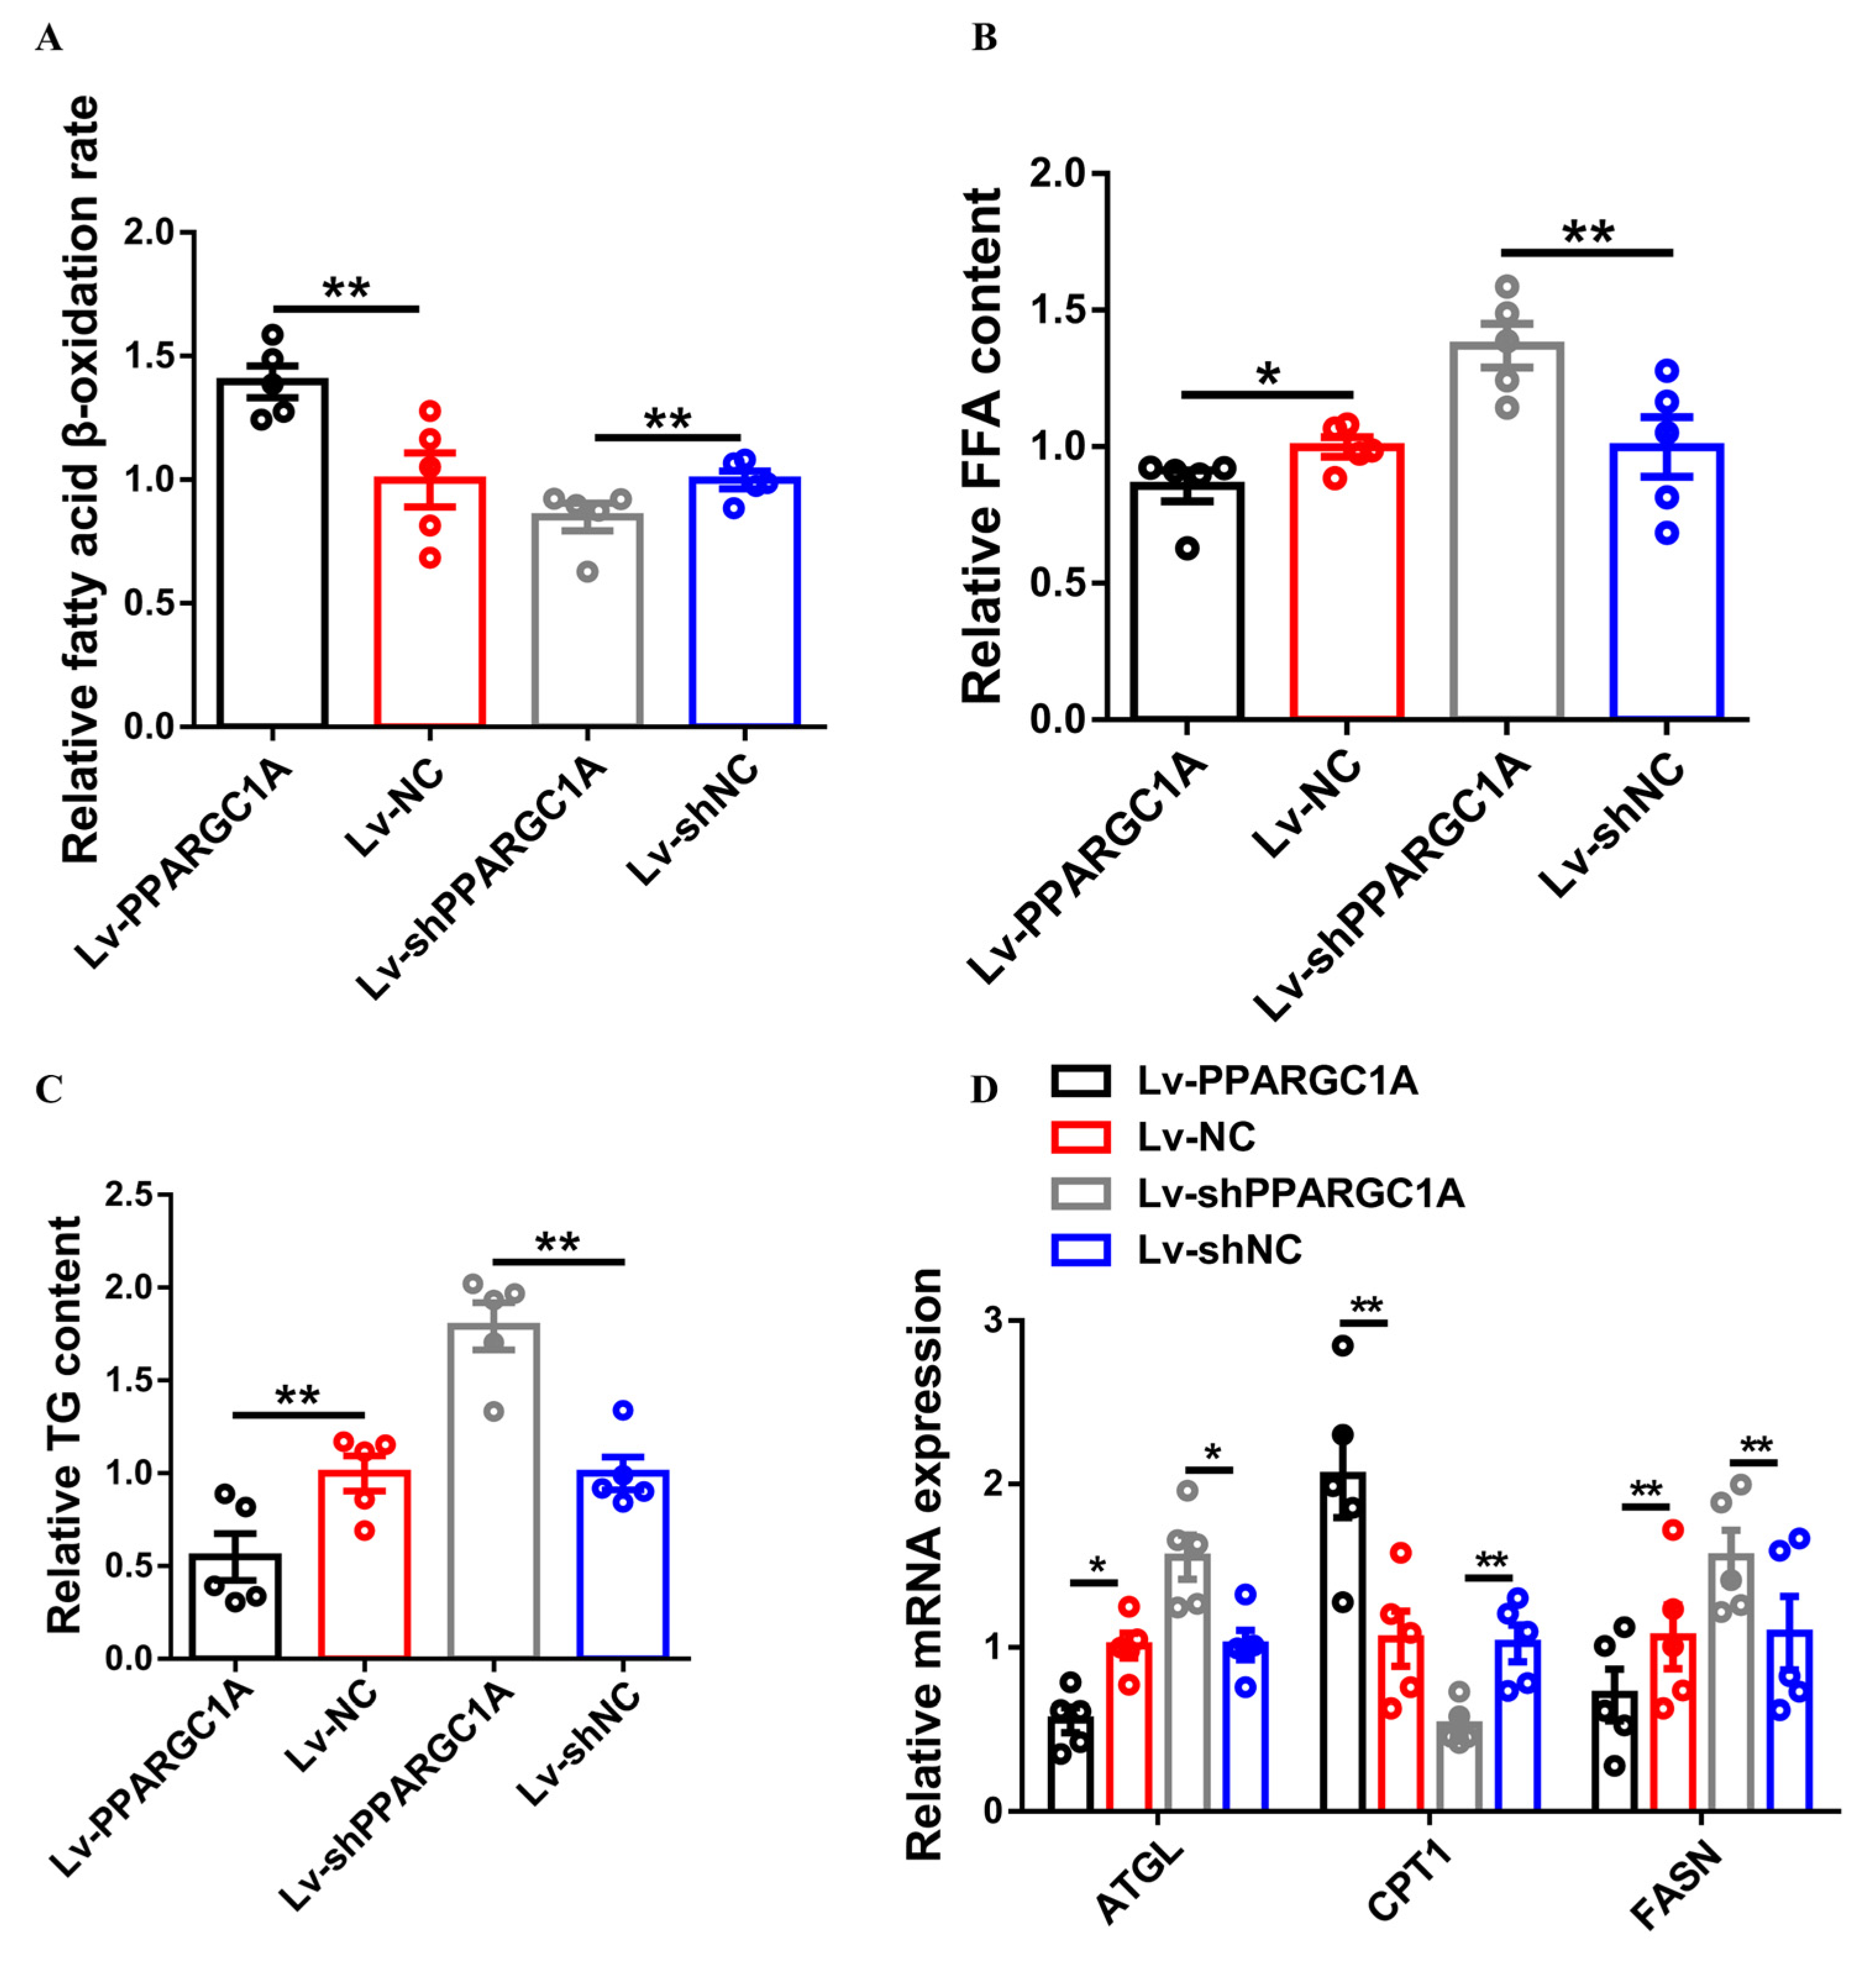
2.3. PPARGC1A Promotes Intramuscular Fatty Acid Oxidation

We further measured the fatty acid β–oxidation rate to evaluate the role of PPARGC1A in intramuscular fat metabolism. PPARGC1A overexpression accelerated fatty acid β–oxidation, whereas the fatty acid β–oxidation rate was repressed with PPARGC1A under–expression in gastrocnemius (Figure 3A). Furthermore, the FFA and TG content was reduced after the overexpression of PPARGC1A, while these metabolites were accumulated in PPARGC1A under–expression gastrocnemius (Figure 3B,C). The overexpression of PPARGC1A upregulated the expression of FAO-related genes, such as CPT1, but downregulated key genes involved in fatty acid synthesis in gastrocnemius, such as ATGL and FASN (Figure 3D). Moreover, the opposite result was observed in PPARGC1A under–expression gastrocnemius (Figure 3D), indicating that PPARGC1A can promote intramuscular fatty acid oxidation.

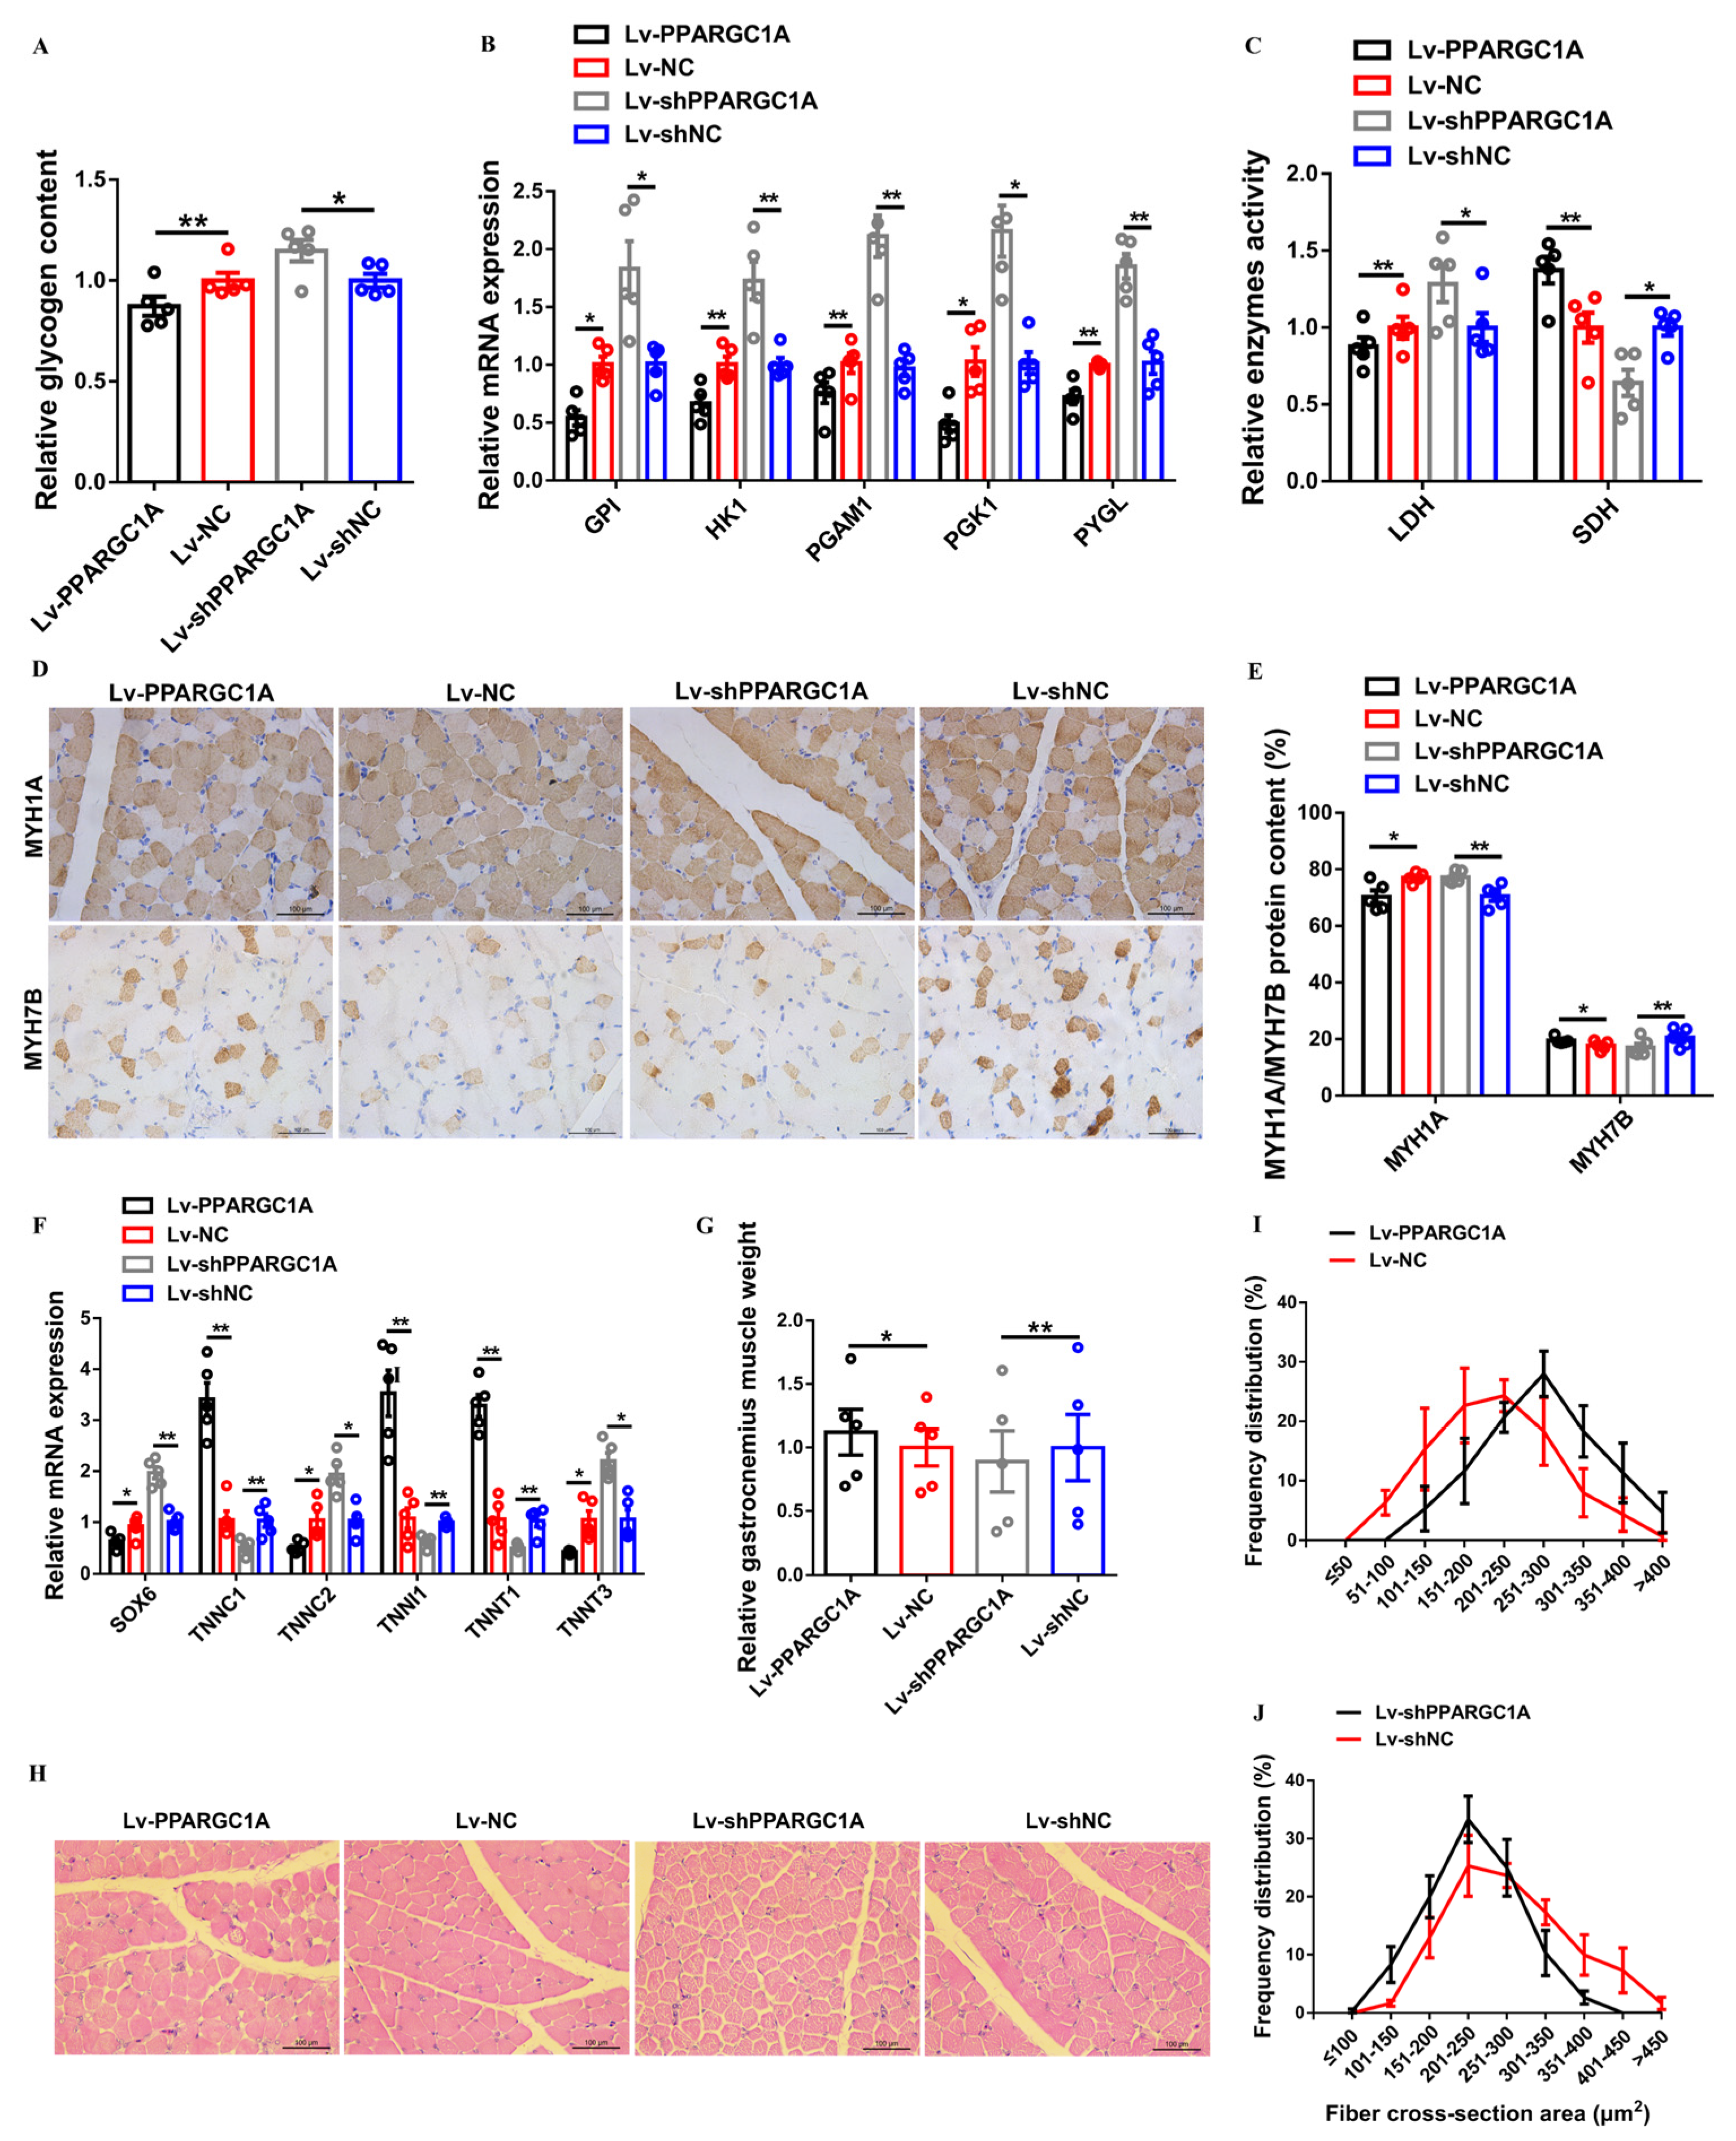
2.4. PPARGC1A Activates Slow-Twitch Muscle Phenotype and Induces Muscle Hypertrophy

Given that PPARGC1A overexpression in gastrocnemius increased mitochondrial content and the under–expression of PPARGC1A in gastrocnemius repressed the accumulation of TCA cycle metabolites and suppressed oxidative metabolism, we speculated that PPARGC1A may modulate muscle metabolism to be involved in the regulation of the transformation of the myofiber type. As expected, PPARGC1A overexpression in gastrocnemius decreased glycogen content and repressed the expression of glycogenolytic and glycolytic genes (Figure 4A,B). Conversely, the under–expression of PPARGC1A in gastrocnemius facilitated the accumulation of glycogen, as well as upregulating the expression of glycogenolytic and glycolytic genes (Figure 4A,B). The overexpression of PPARGC1A suppressed the activity of LDH and enhanced the activity of SDH in gastrocnemius, whereas PPARGC1A under–expression in gastrocnemius elevated glycolytic capacity and decreased the oxidative capacity of skeletal muscle (Figure 4C). More importantly, immunohistochemical results showed that the overexpression of PPARGC1A in gastrocnemius suppressed the MYH1A/fast–twitch protein level and promoted the expression level of MYH7B/slow–twitch protein (Figure 4D,E). The expressions of multiple slow-twitch myofiber genes, such as TNNC1, TNNI1, and TNNT1, were significantly upregulated, while fast-twitch myofiber genes, such as SOX6, TNNC2, and TNNT3, were suppressed with PPARGC1A overexpression in gastrocnemius (Figure 4F). On the contrary, the under–expression of PPARGC1A in gastrocnemius upregulated the fast–twitch protein level and the expression of fast-twitch myofiber genes, and this drove the transformation of slow-twitch to fast-twitch myofibers (Figure 4D–F).
Muscle remodeling can also affect muscle mass; this is regulated by anabolic and catabolic signaling pathways, which induce muscle hypertrophy and muscle atrophy, respectively [23]. Here, PPARGC1A overexpression increased muscle mass and elevated the proportion of large myofibers (>250 μm2) in gastrocnemius (Figure 4G–I). Inversely, gastrocnemius mass was reduced and the proportion of small myofibers (≤300 μm2) was increased with PPARGC1A under–expression in gastrocnemius (Figure 4G,H,J), suggesting PPARGC1A is involved in muscle hypertrophy.

2.5. PPARGC1A Is Directly Targeted by miR-193b-3p

MiRNAs have been well known to regulate gene expression at post-transcriptional levels. To investigate miRNAs that may target PPARGC1A, we analyzed our small RNA sequencing data, which were performed by using the PEM and SOL of a 7-week-old Xinghua chicken. Both in the PEM and SOL, the length of small RNA sequences was mainly concentrated at 21–23 nt, and a length of 22 nt was the maximum size (Figure 5A). Over 85% of the small RNA sequences were identified as miRNAs (Figure 5B). In total, 2156 miRNAs were detected, of which 1313 are known, and 244 are novel. Among them, a total of 179 miRNAs (144 up-regulated in the PEM and 35 in the SOL) were identified as being differentially expressed (DE) between the PEM and the SOL in a 7-week-old Xinghua chicken (|fold change| ≥ 2; p value < 0.05) (Figure 5C,D; Table S4). Given that approximately one third of all mammalian genes are thought to be targeted by miRNAs [24], we further predicted the target genes of differentially expressed miRNAs by using RNAhybrid, Miranda, and TargetScan software. A Gene Ontology (GO) analysis found that the target genes of differentially expressed miRNAs were mainly enriched in biological processes such as the cellular process, metabolic process, and biological regulation (Figure 5E). Moreover, a Kyoto Encyclopedia of Genes and Genomes (KEGG) enrichment analysis showed that these target genes participated in the MAPK signaling pathway, RnRH signaling pathway, and calcium signaling pathway (Figure 5F), suggesting that they may play important roles in skeletal muscle development.
MiR-193b-3p is highly expressed in fast-twitch myofibers (Figure 6A) and was found to contain potential binding sites for the 3′ UTR of PPARGC1A (Figure 6B,C), suggesting that miR-193b-3p could be a potential regulatory factor of PPARGC1A. To confirm whether miR-193b-3p directly targets the 3′ UTR of PPARGC1A, a dual-luciferase reporter assay was performed. The results showed that miR-193b-3p could perfectly bind with, target, and interact with PPARGC1A (Figure 6D). More importantly, miR-193b-3p overexpression significantly decreased the mRNA and protein expression level of PPARGC1A, whereas the expression of PPARGC1A was upregulated with the inhibition of miR-193b-3p (Figure 6E,G). In addition, the overexpression of miR-193b-3p repressed the expression of FAO-related genes, but upregulated key genes involved in fatty acid synthesis, as well as promoting the expression of glycogenolytic and glycolytic genes and multiple fast-twitch myofiber genes (Figure S2A–C). As expected, the opposite results were observed after miR-193b-3p inhibition, which increased PPARGC1A expression (Figure S2A–C). Taken together, these results demonstrated that PPARGC1A was a direct target of miR-193b-3p.
To study whether miR-193b-3p plays a similar role in mammalians, we further analyzed the sequence properties of hsa-, mmu-, and gga-miR-193b-3p, and found that they share the same seed sequence (Figure S3A). The interaction between miR-193b-3p and PPARGC1A in mammalians was also analyzed by the TargetScan software. High binding of miR-193b-3p seed sequences to 3′ UTR of PPARGC1A was observed (Figure S3B,C), suggesting miR-193b-3p is likely to target PPARGC1A in mammalians.

3. Discussion

As the largest tissue in the body, skeletal muscle is important for broiler production. At the same time, the analysis of the antagonistic effect between muscle development and fat deposition is also a current research hotspot. It is of great significance for poultry production to excavate the genetic regulatory factors involved in skeletal muscle development and clarify their molecular regulatory mechanisms.
Mitochondrial biogenesis is defined as the growth and division of pre-existing mitochondria, thereby increasing the number, size, and mass of mitochondrial population and enhancing mitochondrial function [25]. As the center of the oxidative metabolism, mitochondria have been reported to regulate the metabolic properties of skeletal muscle [26,27]. PPARδ is a transcription factor that participates in controlling fatty acid oxidation and energy metabolism [28]. Previous studies have found that PPARδ and PPARGC1A play important roles in mitochondrial biogenesis [3,29]. PPARGC1A could increase the expression of transcription factor A mitochondrial (TFAM) to regulate mtDNA transcription and replication by stimulating a series of nuclear transcription factors, such as nuclear respiratory factor 1 (NRF1) and nuclear respiratory factor 2 (NRF2) [30,31,32]. Moreover, as a transcriptional coactivator, PPARGC1A has been found to be widely involved in a series of biological processes by regulating mitochondrial biogenesis and energy metabolism [3,33,34,35]. In this study, we found PPARGC1A increased mtDNA content and mitochondrial membrane potential to facilitate mitochondrial biogenesis. Meanwhile, PPARGC1A regulated skeletal muscle metabolism by mediating the flux of glycolysis and the TCA cycle.
Excessive intramuscular lipid storage can induce lipotoxic events to affect animal health, as well as cause a decline in meat quality [36,37]. Numerous studies have reported that PPARGC1A regulates lipid metabolism and long-chain fatty acid oxidation by upregulating the expression of several genes of the tricarboxylic acid cycle and the mitochondrial fatty acid oxidation pathway [38,39,40]. Here, PPARGC1A promoted intramuscular fatty acid oxidation and suppressed fatty acid synthesis, which was potentially attributed to the regulation of PPARGC1A in mitochondrial biogenesis and skeletal muscle metabolism.
Myofiber is the basic unit of skeletal muscle; different myofibers have different physicochemical and metabolic characteristics, and their physical and chemical properties determine the meat quality of livestock and poultry to a certain extent [41]. Compared with fast-twitch myofibers, slow-twitch myofibers are rich in hemoglobin and myoglobin, and have higher tenderness, flavor, and juiciness [21,42,43,44]. On the contrary, due to their higher glycogen content and ATPase activity, after slaughter, fast-twitch fibers can cause the pH of muscles to drop rapidly and even produce pale soft exudative (PSE) meat [45,46]. In this study, we found PPARGC1A drove the transformation of fast-twitch to slow-twitch myofibers, suggesting that PPARGC1A may be a potential target for improving chicken quality.
Skeletal muscle mass is finely regulated by protein synthesis and catabolism [47]. Remarkably, the transformation of myofiber types has been also reported to affect muscle metabolism to regulate muscle mass by changing the metabolic characteristics of myofibers [23]. Here, PPARGC1A increased chicken skeletal muscle mass and induced muscle hypertrophy. These results are probably due to changes in skeletal muscle metabolic flux, which lead to an increase in ATP and induce protein synthesis.
It is worth noting that miRNAs have also been demonstrated to play important roles in the development of skeletal muscle by regulating its target genes [14,15,16]. In the current study, we found a total of 179 miRNAs were differentially expressed between the PEM and SOL in a 7-week-old Xinghua chicken, suggesting that these miRNAs may function in the regulation of the transformation of myofibers. Among them, miR-193b-3p, which is highly expressed in fast-twitch myofibers, was found to interact with PPARGC1A. MiR-193b-3p suppressed intramuscular fatty acid oxidation and induced the fast-twitch muscle phenotype, which is partly attributed to its epigenetic regulation of PPARGC1A. Interestingly, hsa-, mmu-, and gga-miR-193b-3p share the same seed sequence and potentially the interaction between miR-193b-3p and PPARGC1A was found in humans and mice, suggesting miR-193b-3p is likely to target PPARGC1A in mammalians.

4. Materials and Methods

4.1. Ethics Statement

The Institutional Animal Care and Use Committee at South China Agricultural University approved all animal experimental protocols in this study (approval ID: 2021-C018).

4.2. Animals and Cells

One-day-old chicks used in the living experiment were obtained from Kaiping Xufeng Agriculture and Animal Husbandry Co., Ltd. (Kaiping, China).
CPMs were isolated from the leg muscle of 11-day-old chicken embryos as previously described [16]. CPMs were cultured in Roswell Park Memorial Institute (RPMI) 1640 medium (Gibco, Bethesda, MD, USA) with 20% fetal bovine serum (FBS) (Gibco, Bethesda, MD, USA), at 37 °C in a 5% CO2 humidified atmosphere.

4.3. RNA Extraction, cDNA Synthesis, and Quantitative Real-Time PCR

RNA extraction and cDNA synthesis were performed using Trizol reagent (TaKaRa, Otsu, Japan) and the PrimeScript RT Reagent Kit with gDNA Eraser (Perfect Real Time) (TaKaRa, Otsu, Japan). Quantitative real-time PCR assay was performed as previously described [48]. Primers used for quantitative real-time PCR are listed in Table S1.

4.4. Plasmid Construction and RNA Oligonucleotides

For PPARGC1A overexpression vector construction, the coding sequence of PPARGC1A was amplified and cloned into pcDNA-3.1 (Promega, Madison, WI, USA) between the HindIII and XhoI sites. Specific siRNA against PPARGC1A and non-specific siRNA negative control (NC) were designed and synthesized by Guangzhou RiboBio (Guangzhou, China).
For overexpression lentiviral vectors constructed, PPARGC1A coding sequence was amplified and then cloned into the pLVX-mCMV-ZsGreen-IRES-Puro vector (Addgene, Cambridge, MA, USA) between the SpeI and NotI sites. Short hairpin RNAs (shRNAs) against PPARGC1A were designed and then subcloned into the pLVX-shRNA2-Puro vector (Addgene, Cambridge, MA, USA) between the BamHI and EcoRI sites.
For pmirGLO dual-luciferase miRNA target reporter vectors constructed, the segment sequence of the PPARGC1A 3′ UTR that contained the putative miR-193b-3p binding sequence was amplified and then cloned into the pmirGLO dual-luciferase reporter vector (Promega, Madison, WI, USA) between the NheI and XhoI sites. Mutant plasmids were generated by changing the binding site of miR-193b-3p from GGCCAGT to TTAAGAC.
MiR-193b-3p mimic, mimic NC, miR-193b-3p inhibitor, and inhibitor NC were designed and synthesized by Guangzhou RiboBio (Guangzhou, China).
The primers and oligonucleotide sequences used in this study are listed in Tables S1 and S2.

4.5. Cell Transfection

All transient transfections used Lipofectamine 3000 reagent (Invitrogen, Carlsbad, CA, USA) following the manufacturer’s protocol.

4.6. Lentivirus Production and Transduction

Lentivirus production was performed as described before [48]. Thirty 1-day-old chicks were randomly divided into two groups (n = 15): (1) Lv-PPARGC1A and Lv-NC, (2) Lv-shPPARGC1A and Lv-shNC. Chicks received three intramuscular doses (at days 1, 7, and 14) of lentivirus (106 titers) in the lateral head of gastrocnemius muscle. Twenty-one days after the initial injection, chickens were euthanized. Subsequently, gastrocnemius muscles were collected after rapid dissection, then immediately frozen in liquid nitrogen and stored at −80 °C.

4.7. Immunoblotting

Western blot analysis was performed as previously described [14]. The primary antibodies used were anti-PPARGC1A (66369-1-Ig; Proteintech, Rosemont, IL, USA; 1:5000), and anti-β-Tubulin (A01030; Abbkine, Waltham, MA, USA; 1:10,000). Goat Anti-Mouse IgG-horseradish peroxidase (HRP) (A21010; Abbkine, Waltham, MA, USA; 10,000) was used as a secondary antibody.

4.8. Mitochondrial DNA (mtDNA) Content Assay

A tissue DNA Kit (D3396, Omega, GA, USA) was used to extract total DNA. The amount of mitochondrial DNA was assessed as previously described [16]. Primers used for mtDNA content assay were listed in Table S1.

4.9. Mitochondrial Membrane Potential and Fatty Acid Oxidation (FAO) Rate Assay

The mitochondria of gastrocnemius were isolated using the Tissue Mitochondria Isolation Kit (C3606, Beyotime, Beijing, China). After measuring the mitochondrial protein concentration, freshly isolated mitochondria were subjected to mitochondrial membrane potential and FAO rate assay with the mitochondrial membrane potential assay kit with JC-1 (C2006, Beyotime, Beijing, China) and Colorimetric Fatty Acid Oxidation Rate Assay Kit (HL50679, Haling, Shanghai, China), according to the manufacturer’s protocol. The fluorescence and absorbance were determined using a Synergy Neo2 Multi-Mode Microplate Reader (BioTek, Winooski, VT, USA).

4.10. Central Carbon Metabolic Profiling

PPARGC1A under–expression gastrocnemius samples (n = 4) were used for metabolite extraction, and then performed in HPIC-MS/MS analysis. The high-performance ion exchange liquid chromatography (HPIC) separation was carried out using a Thermo Scientific Dionex ICS-6000 HPIC System (Thermo Fisher Scientific, Waltham, MA, USA). An AB SCIEX 6500 QTRAP+ triple quadrupole mass spectrometer (AB Sciex, Framigham, MA, USA) equipped with an electrospray ionization (ESI) interface was applied for assay development. Metabolic hierarchical clustering analysis (HCA) was performed using Cluster 3.0 software.

4.11. Metabolite and Enzyme Activities Assays

Content of free fatty acid (FFA), glycogen and triglyceride (TG), as well as enzyme activity of lactic dehydrogenase (LDH) and succinate dehydrogenase (SDH) in gastrocnemius were measured using commercially available kits (BC0595, BC0345, BC0625, BC0685, and BC0955, Solarbio, Beijing, China) following the manufacturer’s instructions.

4.12. Immunohistochemistry and Hematoxylin and Eosin (HE) Staining

An SP-POD kit (SP0041, Solarbio, Beijing, China) was used for immunohistochemistry as recommended by the supplier. The primary antibodies included anti-MYH1A (GTX17485; GeneTex, Irvine, CA, USA; 1:400) and anti-MYH7B (S58; DHSB, Iowa City, IA, USA; 1:100) and were used for labeling the signals.
For HE staining, gastrocnemius muscle tissues were immersed in 4% paraformaldehyde and were then embedded in paraffin and cut into 4 mm-thick transverse sections. Subsequently, the sections were stained using the Hematoxylin and Eosin Staining Kit (C0105S, Beyotime, Beijing, China) according to the manufacturer’s instructions.

4.13. Small RNA Sequencing

The PEM and SOL of 7-week-old Xinghua chicken were used for small RNA sequencing. After total RNA was extracted with a TRIzol reagent kit (Invitrogen, Carlsbad, CA, USA), the RNA molecules in a size range of 18–30 nt were enriched by polyacrylamide gel electrophoresis (PAGE). Then, the 3′ adapters were added and the 36–44 nt RNAs were enriched. The 5′ adapters were then ligated to the RNAs as well. The ligation products were reverse transcribed by PCR amplification and the 140–160 bp size PCR products were enriched to generate a cDNA library and sequenced using Illumina HiSeqTM 2500 by Gene Denovo Biotechnology Co. (Guangzhou, China). The raw data of small RNA sequencing were released to the National Center for Biotechnology Information (NCBI) Sequence Read Archive (SRA) database under accession number PRJNA751251.

4.14. Dual-Luciferase Reporter Assay

Dual-luciferase reporter assay was performed using a Dual-GLO Luciferase Assay System Kit (Promega, Madison, WI, USA) as previously described [14]. The luminescent signal was quantified using a fluorescence/multi-detection microplate reader (BioTek, Winooski, VT, USA), and firefly luciferase activities were normalized to Renilla luminescence in each well.

4.15. Statistical Analysis

Each experiment was repeated at least three times, and all data are expressed as means ± SEM. Where applicable, the statistical significance of the data was tested using independent or paired t-tests. The types of tests and the p values, when applicable, are indicated in the figure legends.

5. Conclusions

In conclusion, we demonstrated that PPARGC1A, which is regulated by miR-193b-3p, mediates skeletal muscle metabolism to impede intramuscular fat deposition, as well as activating the slow-twitch muscle phenotype and inducing muscle hypertrophy. Our findings help to understand the genetic regulation of skeletal muscle development and provide a molecular basis for further research on the antagonism of skeletal muscle development and fat deposition in chickens.

Supplementary Materials

The following supporting information can be downloaded at: https://www.mdpi.com/article/10.3390/ijms23179575/s1.

Author Contributions

Conceptualization, M.M. and B.C.; data curation, M.M. and B.C.; formal analysis, M.M. and B.C.; funding acquisition, Q.N. and B.C.; investigation, M.M., S.K. and Z.Z.; methodology, M.M., B.C. and J.Z.; project administration, M.M., B.C. and Q.N.; resources, X.Z. and Q.N.; software, M.M., B.C. and Z.Z.; supervision, Q.N.; validation, M.M., B.C. and Q.N.; visualization, M.M.; writing—original draft, M.M. and B.C.; writing—review and editing, M.M., B.C. and Q.N. All authors have read and agreed to the published version of the manuscript.

Funding

This work was supported by the Local Innovative and Research Teams Project of Guangdong Province (2019BT02N630), the Natural Scientific Foundation of China (U1901206 and 31761143014), Guangzhou Science and Technology Key Project (202103000084), China Agriculture Research System (CARS-41-G03), and China Postdoctoral Science Foundation (2022M710052).

Institutional Review Board Statement

The animal study protocol was approved by the Institutional Review Board (or Ethics Committee) of South China Agricultural University (protocol code SCAU#2021C018).

Informed Consent Statement

Not applicable.

Data Availability Statement

The data presented in this study are available on request from the corresponding author.

Conflicts of Interest

The authors declare that they have no conflict of interest.

References

  1. Scanes, C.G.; Harvey, S.; Marsh, J.A.; King, D.B. Hormones and growth in poultry. Poult. Sci. 1984, 63, 2062–2074. [Google Scholar] [CrossRef] [PubMed]
  2. Puigserver, P.; Wu, Z.; Park, C.W.; Graves, R.; Wright, M.; Spiegelman, B.M. A cold-inducible coactivator of nuclear receptors linked to adaptive thermogenesis. Cell 1998, 92, 829–839. [Google Scholar] [CrossRef] [Green Version]
  3. Liang, H.; Ward, W.F. PGC-1alpha: A key regulator of energy metabolism. Adv. Physiol. Educ. 2006, 30, 145–151. [Google Scholar] [CrossRef] [PubMed]
  4. Finck, B.N.; Kelly, D.P. PGC-1 coactivators: Inducible regulators of energy metabolism in health and disease. J. Clin. Investig. 2006, 116, 615–622. [Google Scholar] [CrossRef] [PubMed]
  5. Hood, D.A.; Irrcher, I.; Ljubicic, V.; Joseph, A.M. Coordination of metabolic plasticity in skeletal muscle. J. Exp. Biol. 2006, 209, 2265–2275. [Google Scholar] [CrossRef] [Green Version]
  6. Lehman, J.J.; Boudina, S.; Banke, N.H.; Sambandam, N.; Han, X.; Young, D.M.; Leone, T.C.; Gross, R.W.; Lewandowski, E.D.; Abel, E.D.; et al. The transcriptional coactivator PGC-1alpha is essential for maximal and efficient cardiac mitochondrial fatty acid oxidation and lipid homeostasis. Am. J. Physiol. Heart Circ. Physiol. 2008, 295, H185–H196. [Google Scholar] [CrossRef] [Green Version]
  7. Russell, L.K.; Mansfield, C.M.; Lehman, J.J.; Kovacs, A.; Courtois, M.; Saffitz, J.E.; Medeiros, D.M.; Valencik, M.L.; McDonald, J.A.; Kelly, D.P. Cardiac-specific induction of the transcriptional coactivator peroxisome proliferator-activated receptor gamma coactivator-1alpha promotes mitochondrial biogenesis and reversible cardiomyopathy in a developmental stage-dependent manner. Circ. Res. 2004, 94, 525–533. [Google Scholar] [CrossRef] [Green Version]
  8. Fujimoto, E.; Yamaguchi, W.; Terada, S.; Higuchi, M.; Tabata, I. Change in PGC-1alpha expression in rat skeletal muscle after low-intensity prolonged swimming exercise. J. Physiol. Anthropol. 2011, 30, 23–27. [Google Scholar] [CrossRef] [Green Version]
  9. Wu, Z.; Puigserver, P.; Andersson, U.; Zhang, C.; Adelmant, G.; Mootha, V.; Troy, A.; Cinti, S.; Lowell, B.; Scarpulla, R.C.; et al. Mechanisms controlling mitochondrial biogenesis and respiration through the thermogenic coactivator PGC-1. Cell 1999, 98, 115–124. [Google Scholar] [CrossRef] [Green Version]
  10. Lin, J.; Wu, H.; Tarr, P.T.; Zhang, C.Y.; Wu, Z.; Boss, O.; Michael, L.F.; Puigserver, P.; Isotani, E.; Olson, E.N.; et al. Transcriptional co-activator PGC-1 alpha drives the formation of slow-twitch muscle fibres. Nature 2002, 418, 797–801. [Google Scholar] [CrossRef]
  11. Shu, J.T.; Xu, W.J.; Zhang, M.; Song, W.T.; Shan, Y.J.; Song, C.; Zhu, W.Q.; Zhang, X.Y.; Li, H.F. Transcriptional co-activator PGC-1alpha gene is associated with chicken skeletal muscle fiber types. Genet. Mol. Res. 2014, 13, 895–905. [Google Scholar] [CrossRef] [PubMed]
  12. Bartel, D.P. MicroRNAs: Genomics, biogenesis, mechanism, and function. Cell 2004, 116, 281–297. [Google Scholar] [CrossRef] [Green Version]
  13. Wahid, F.; Shehzad, A.; Khan, T.; Kim, Y.Y. MicroRNAs: Synthesis, mechanism, function, and recent clinical trials. Biochim. Biophys. Acta 2010, 1803, 1231–1243. [Google Scholar] [CrossRef] [PubMed] [Green Version]
  14. Cai, B.; Ma, M.; Chen, B.; Li, Z.; Abdalla, B.A.; Nie, Q.; Zhang, X. MiR-16-5p targets SESN1 to regulate the p53 signaling pathway, affecting myoblast proliferation and apoptosis, and is involved in myoblast differentiation. Cell Death Dis. 2018, 9, 367. [Google Scholar] [CrossRef] [PubMed] [Green Version]
  15. Ma, M.; Cai, B.; Jiang, L.; Abdalla, B.A.; Li, Z.; Nie, Q.; Zhang, X. lncRNA-Six1 Is a Target of miR-1611 that Functions as a ceRNA to Regulate Six1 Protein Expression and Fiber Type Switching in Chicken Myogenesis. Cells 2018, 7, 243. [Google Scholar] [CrossRef] [PubMed] [Green Version]
  16. Cai, B.; Ma, M.; Zhou, Z.; Kong, S.; Zhang, J.; Zhang, X.; Nie, Q. circPTPN4 regulates myogenesis via the miR-499-3p/NAMPT axis. J. Anim. Sci. Biotechnol. 2022, 13, 2. [Google Scholar] [CrossRef]
  17. Wang, S.; Jin, J.; Xu, Z.; Zuo, B. Functions and Regulatory Mechanisms of lncRNAs in Skeletal Myogenesis, Muscle Disease and Meat Production. Cells 2019, 8, 1107. [Google Scholar] [CrossRef] [Green Version]
  18. Belichenko, V.M.; Korostyshevskaia, I.M.; Maksimov, V.F.; Shoshenko, K.A. Development of the mitochondrial apparatus and blood supply of skeletal muscle fibers during ontogenesis of domestic fowl. Ontogenez 2005, 36, 135–144. [Google Scholar] [CrossRef]
  19. Meissner, J.D.; Chang, K.C.; Kubis, H.P.; Nebreda, A.R.; Gros, G.; Scheibe, R.J. The p38alpha/beta mitogen-activated protein kinases mediate recruitment of CREB-binding protein to preserve fast myosin heavy chain IId/x gene activity in myotubes. J. Biol. Chem. 2007, 282, 7265–7275. [Google Scholar] [CrossRef] [Green Version]
  20. Koutakis, P.; Weiss, D.J.; Miserlis, D.; Shostrom, V.K.; Papoutsi, E.; Ha, D.M.; Carpenter, L.A.; McComb, R.D.; Casale, G.P.; Pipinos, I.I. Oxidative damage in the gastrocnemius of patients with peripheral artery disease is myofiber type selective. Redox Biol. 2014, 2, 921–928. [Google Scholar] [CrossRef] [Green Version]
  21. Lee, S.H.; Joo, S.T.; Ryu, Y.C. Skeletal muscle fiber type and myofibrillar proteins in relation to meat quality. Meat Sci. 2010, 86, 166–170. [Google Scholar] [CrossRef] [PubMed]
  22. Joo, S.T.; Kim, G.D.; Hwang, Y.H.; Ryu, Y.C. Control of fresh meat quality through manipulation of muscle fiber characteristics. Meat Sci. 2013, 95, 828–836. [Google Scholar] [CrossRef] [PubMed]
  23. Braun, T.; Gautel, M. Transcriptional mechanisms regulating skeletal muscle differentiation, growth and homeostasis. Nat. Rev. Mol. Cell Biol. 2011, 12, 349–361. [Google Scholar] [CrossRef] [PubMed]
  24. Lewis, B.P.; Burge, C.B.; Bartel, D.P. Conserved seed pairing, often flanked by adenosines, indicates that thousands of human genes are microRNA targets. Cell 2005, 120, 15–20. [Google Scholar] [CrossRef] [Green Version]
  25. Jornayvaz, F.R.; Shulman, G.I. Regulation of mitochondrial biogenesis. Essays Biochem. 2010, 47, 69–84. [Google Scholar] [CrossRef] [PubMed] [Green Version]
  26. Boengler, K.; Kosiol, M.; Mayr, M.; Schulz, R.; Rohrbach, S. Mitochondria and ageing: Role in heart, skeletal muscle and adipose tissue. J. Cachexia Sarcopenia Muscle 2017, 8, 349–369. [Google Scholar] [CrossRef] [Green Version]
  27. Boncompagni, S.; Pozzer, D.; Viscomi, C.; Ferreiro, A.; Zito, E. Physical and Functional Cross Talk between Endo-Sarcoplasmic Reticulum and Mitochondria in Skeletal Muscle. Antioxid. Redox Signal. 2020, 32, 873–883. [Google Scholar] [CrossRef]
  28. Wang, Y.X.; Lee, C.H.; Tiep, S.; Yu, R.T.; Ham, J.; Kang, H.; Evans, R.M. Peroxisome-proliferator-activated receptor delta activates fat metabolism to prevent obesity. Cell 2003, 113, 159–170. [Google Scholar] [CrossRef] [Green Version]
  29. Wang, Y.X.; Zhang, C.L.; Yu, R.T.; Cho, H.K.; Nelson, M.C.; Bayuga-Ocampo, C.R.; Ham, J.; Kang, H.; Evans, R.M. Regulation of muscle fiber type and running endurance by PPARdelta. PLoS Biol. 2004, 2, e294. [Google Scholar] [CrossRef] [Green Version]
  30. Lin, J.; Handschin, C.; Spiegelman, B.M. Metabolic control through the PGC-1 family of transcription coactivators. Cell Metab. 2005, 1, 361–370. [Google Scholar] [CrossRef] [Green Version]
  31. Ventura-Clapier, R.; Garnier, A.; Veksler, V. Transcriptional control of mitochondrial biogenesis: The central role of PGC-1alpha. Cardiovasc. Res. 2008, 79, 208–217. [Google Scholar] [CrossRef] [PubMed] [Green Version]
  32. Dominy, J.E.; Puigserver, P. Mitochondrial biogenesis through activation of nuclear signaling proteins. Cold Spring Harb. Perspect. Biol. 2013, 5, a015008. [Google Scholar] [CrossRef] [PubMed]
  33. Zhang, G.M.; Guo, Y.X.; Deng, M.T.; Wan, Y.J.; Deng, K.P.; Xiao, S.H.; Meng, F.X.; Wang, F.; Lei, Z.H. Effect of PPARGC1A on the development and metabolism of early rabbit embryos in vitro. Mol. Reprod. Dev. 2019, 86, 1758–1770. [Google Scholar] [CrossRef]
  34. Qian, X.; Li, X.; Shi, Z.; Bai, X.; Xia, Y.; Zheng, Y.; Xu, D.; Chen, F.; You, Y.; Fang, J.; et al. KDM3A Senses Oxygen Availability to Regulate PGC-1alpha-Mediated Mitochondrial Biogenesis. Mol. Cell 2019, 76, 885–895. [Google Scholar] [CrossRef] [PubMed]
  35. Koh, J.H.; Kim, J.Y. Role of PGC-1alpha in the Mitochondrial NAD+ Pool in Metabolic Diseases. Int. J. Mol. Sci. 2021, 22, 4558. [Google Scholar] [CrossRef]
  36. Bosma, M.; Hesselink, M.K.; Sparks, L.M.; Timmers, S.; Ferraz, M.J.; Mattijssen, F.; van Beurden, D.; Schaart, G.; de Baets, M.H.; Verheyen, F.K.; et al. Perilipin 2 improves insulin sensitivity in skeletal muscle despite elevated intramuscular lipid levels. Diabetes 2012, 61, 2679–2690. [Google Scholar] [CrossRef] [Green Version]
  37. Kewalramani, G.; Bilan, P.J.; Klip, A. Muscle insulin resistance: Assault by lipids, cytokines and local macrophages. Curr. Opin. Clin. Nutr. Metab. Care 2010, 13, 382–390. [Google Scholar] [CrossRef] [PubMed]
  38. Cheng, C.F.; Ku, H.C.; Lin, H. PGC-1alpha as a Pivotal Factor in Lipid and Metabolic Regulation. Int. J. Mol. Sci. 2018, 19, 3447. [Google Scholar] [CrossRef] [PubMed] [Green Version]
  39. Handschin, C.; Spiegelman, B.M. Peroxisome proliferator-activated receptor gamma coactivator 1 coactivators, energy homeostasis, and metabolism. Endocr. Rev. 2006, 27, 728–735. [Google Scholar] [CrossRef]
  40. He, F.; Jin, J.Q.; Qin, Q.Q.; Zheng, Y.Q.; Li, T.T.; Zhang, Y.; He, J.D. Resistin Regulates Fatty Acid Beta Oxidation by Suppressing Expression of Peroxisome Proliferator Activator Receptor Gamma-Coactivator 1alpha (PGC-1alpha). Cell. Physiol. Biochem. 2018, 46, 2165–2172. [Google Scholar] [CrossRef]
  41. Bassel-Duby, R.; Olson, E.N. Signaling pathways in skeletal muscle remodeling. Annu. Rev. Biochem. 2006, 75, 19–37. [Google Scholar] [CrossRef] [PubMed] [Green Version]
  42. Sinclair, K.D.; Cuthbertson, A.; Rutter, A.; Franklin, M.F. The effects of age at slaughter, genotype and finishing system on the biochemical properties, muscle fibre type characteristics and eating quality of bull beef from suckled calves. Anim. Sci. 1998, 66, 329–340. [Google Scholar] [CrossRef]
  43. Park, B.Y.; Kim, N.K.; Lee, C.S.; Hwang, I.H. Effect of fiber type on postmortem proteolysis in longissimus muscle of Landrace and Korean native black pigs. Meat Sci. 2007, 77, 482–491. [Google Scholar] [CrossRef] [PubMed]
  44. Hu, H.; Wang, J.; Zhu, R.; Guo, J.; Wu, Y. Effect of myosin heavy chain composition of muscles on meat quality in Laiwu pigs and Duroc. Sci. China C Life Sci. 2008, 51, 127–132. [Google Scholar] [CrossRef]
  45. Immonen, K.; Ruusunen, M.; Hissa, K.; Puolanne, E. Bovine muscle glycogen concentration in relation to finishing diet, slaughter and ultimate pH. Meat Sci. 2000, 55, 25–31. [Google Scholar] [CrossRef]
  46. Ryu, Y.C.; Kim, B.C. Comparison of histochemical characteristics in various pork groups categorized by postmortem metabolic rate and pork quality. J. Anim. Sci. 2006, 84, 894–901. [Google Scholar] [CrossRef]
  47. Sartorelli, V.; Fulco, M. Molecular and cellular determinants of skeletal muscle atrophy and hypertrophy. Sci. STKE 2004, 2004, e11. [Google Scholar] [CrossRef]
  48. Cai, B.; Li, Z.; Ma, M.; Zhang, J.; Kong, S.; Abdalla, B.A.; Xu, H.; Jebessa, E.; Zhang, X.; Lawal, R.A.; et al. Long noncoding RNA SMUL suppresses SMURF2 production-mediated muscle atrophy via nonsense-mediated mRNA decay. Mol. Ther. Nucleic Acids 2021, 23, 512–526. [Google Scholar] [CrossRef]
Figure 1. Identification of chicken PPARGC1A. (A,B), relative PPARGC1A expression in pectoralis major (PEM) and soleus (SOL) of 7-week-old Xinghua chicken detected by RNA-seq (A) and qPCR (B). (C), tissue expression profiles of PPARGC1A. The horizontal axis and vertical axis indicate different tissues and their relative expression values, respectively. (D), secondary structure of PPARGC1A protein predicted by SOPMA software (https://npsa-prabi.ibcp.fr/cgi-bin/npsa_automat.pl?page=npsa_sopma.html, accessed on 1 February 2022). (E), subcellular location of PPARGC1A protein annotated by UniProt Knowledgebase (https://www.uniprot.org/, accessed on 1 February 2022). (F), phylogenetic tree of chicken PPARGC1A aligned amino acid sequences. Results are presented as mean ± SEM. In panels (A,B), statistical significance of differences between means was assessed using paired t-tests. (* p < 0.05; ** p < 0.01).
Ijms 23 09575 g001
Figure 2. PPARGC1A promotes mitochondrial biogenesis and regulates skeletal muscle metabolism. (A), construction of lentivirus-mediated PPARGC1A overexpression and under–expression chick model. (B,C), relative PPARGC1A mRNA (B) and protein (C) expression in gastrocnemius muscle with infection of PPARGC1A–expressing lentivirus (Lv–PPARGC1A or Lv–shPPARGC1A) or negative control (Lv–NC or Lv–shNC). (D,E), relative mitochondrial DNA (mtDNA) content (D) and mitochondrial membrane potential (E) in PPARGC1A overexpression or under–expression gastrocnemius. (F), hierarchical clustering analysis (HCA) of gastrocnemius metabolites following Lv–shPPARGC1A or Lv–shNC infection. Relative metabolite levels in PPARGC1A under–expression or control group indicated by color. (G), relative metabolite content of glycolysis and tricarboxylic acid (TCA) cycle in gastrocnemius following Lv–shPPARGC1A infection. In panels (C), ImageJ was used to measure band intensities. The fold change relative to the control is shown below the bands. In panels (B,D,E,G), results are shown as mean ± SEM; statistical significance of differences between means was assessed using paired t–tests. (* p < 0.05; ** p < 0.01).
Ijms 23 09575 g002
Figure 3. PPARGC1A accelerates intramuscular fatty acid oxidation. (A) to (D), relative fatty acid β–oxidation rate (A), relative free fatty acid (FFA) content (B), relative triglyceride (TG) content (C), and relative mRNA expression levels of fatty acid oxidation or synthesis–related genes (D) in gastrocnemius with PPARGC1A overexpression or under–expression. Results are presented as mean ± SEM. In all panels, statistical significance of differences between means was assessed using paired t–tests. (* p < 0.05; ** p < 0.01).
Ijms 23 09575 g003
Figure 4. PPARGC1A activates slow–twitch muscle phenotype and induces muscle hypertrophy. (AJ), relative glycogen content (A), relative mRNA expression levels of glycogenolytic and glycolytic genes (B), relative enzyme activity of lactic dehydrogenase (LDH) and succinate dehydrogenase (SDH) (C), immunohistochemistry analysis of MYH1A/MYH7B (D), MYH1A/MYH7B protein content (E), relative mRNA expression levels of several fast–/slow–twitch myofiber genes (F), relative gastrocnemius muscle weight (G), H&E staining (H), and frequency distribution of fiber cross-sectional area (CSA) (I,J) in gastrocnemius with PPARGC1A overexpression or under–expression. In panels (AC,EG), results are shown as mean ± SEM, statistical significance of differences between means was assessed using paired t–tests. (* p < 0.05; ** p < 0.01).
Ijms 23 09575 g004
Figure 5. Small RNAs in pectoralis major and soleus of 7-week-old Xinghua chicken. (A), length, distribution, and abundance of small RNA sequences in pectoralis major (PEM) and soleus (SOL) of 7-week-old Xinghua chicken. (B), distribution frequency of small RNA sequences in different RNA categories. (C,D), statistics (C) and heatmap (D) of differentially expressed miRNA between PEM and SOL in 7-week-old Xinghua chicken. (E,F), GO functions (E) and KEGG pathways (F) analysis of the target genes of differentially expressed miRNAs.
Ijms 23 09575 g005
Figure 6. Identification of PPARGC1A as a direct target of miR-193b-3p. (A), relative miR-193b-3p expression in pectoralis major (PEM) and soleus (SOL) of 7-week-old Xinghua chicken detected by RNA-seq. (B), the potential binding site of miR-193b-3p in PPARGC1A 3′ untranslated region (UTR). The mutant sequence in miR-193b-3p binding site is highlighted in red. (C), the potential interaction model between miR-193b-3p and PPARGC1A from RNAhybrid. (D), luciferase assay was conducted by co-transfecting wild-type or mutant PPARGC1A 3′ UTR with miR-193b-3p mimic or mimic-negative control (NC). (E), relative miR-193b-3p and PPARGC1A expression after miR-193b-3p overexpression. (F), relative PPARGC1A expression after miR-193b-3p inhibition. (G), the protein expression level of PPARGC1A with miR-193b-3p overexpression or inhibition. In panel (G), ImageJ was used to measure band intensities. The fold change relative to the control is shown below the bands. In panels (A,DF), results are presented as mean ± SEM, and paired t–tests were used to assess the statistical significance of differences between means. (** p < 0.01).
Ijms 23 09575 g006
Publisher’s Note: MDPI stays neutral with regard to jurisdictional claims in published maps and institutional affiliations.

