Abstract
Angelman syndrome (AS) is a neurodevelopmental disorder caused by the loss of function of the E3-ligase UBE3A. Despite multiple studies, AS pathophysiology is still obscure and has mostly been explored in rodent models of the disease. In recent years, a growing body of studies has utilized omics datasets in the attempt to focus research regarding the pathophysiology of AS. Here, for the first time, we utilized a multi-omics approach at the epigenomic level and the transcriptome level, for human-derived neurons. Using publicly available datasets for DNA methylation and gene expression, we found genome regions in proximity to gene promoters and intersecting with gene-body regions that were differentially methylated and differentially expressed in AS. We found that overall, the genome in AS postmortem brain tissue was hypo-methylated compared to healthy controls. We also found more upregulated genes than downregulated genes in AS. Many of these dysregulated genes in neurons obtained from AS patients are known to be critical for neuronal development and synaptic functioning. Taken together, our results suggest a list of dysregulated genes that may be involved in AS development and its pathological features. Moreover, these genes might also have a role in neurodevelopmental disorders similar to AS.
1. Introduction
Angelman syndrome (AS) is a human neuropsychiatric disorder associated with autism, intellectual disability, ataxia, sleep disturbances, lack of speech, and epilepsy [1,2]. In most cases, AS is caused by deletion of a small region of DNA on maternal chr15q11.2-q13 that includes the UBE3A gene [3,4,5,6]. Interestingly, the opposite molecular condition, Dup15q, where the UBE3A gene is duplicated on the maternal chr15q11.2-q13, is also characterized by autism, intellectual disability, hypotonia, language developmental delay and language deficits, and epilepsy [7,8]. In addition, the UBE3A gene has been shown to be associated with autism and schizophrenia [9,10].
The UBE3A gene encodes for the ubiquitin ligase E3A, also termed E6-associated protein (E6-AP). This protein is a HECT domain E3-ligase, a family of enzymes that covalently attaches ubiquitin chains to proteins, signaling them for degradation by 26S proteasome. In addition to the ligase activity of UBE3A, it has been shown that this protein has other functions that are not fully understood. There is evidence that UBE3A affects progesterone-receptor- and estrogen-receptor-dependent transcriptional activity [11,12,13,14]. Furthermore, it has been shown that loss of function of UBE3A leads to general genomic hypo-methylation [15,16]. However, our current understanding of molecular players and pathways affected by UBE3A expression fails to explain the full range of its interactions.
Multi-omics analysis is becoming increasingly popular in biomedical research. The unsupervised multi-layered molecular data allow researchers to infer significant molecular interactions and cascades associated with particular phenotypes with higher validity [17,18].
While multiple datasets have been derived from various models of AS, starting from fruit flies up to rodent models of mice and rats, only a few datasets have been obtained from neurons derived from human AS patients [19,20,21,22,23,24]. To date, no study has tried to associate different human-derived neuronal datasets using a multi-omics approach. In the current study, we transect publicly available human-derived neuronal transcriptome and DNA methylation datasets for multi-omics analyses and elucidation of the molecular mechanisms involved in AS.
2. Results
To elucidate the molecular mechanisms associated in AS with loss of function of the UBE3A protein, we analyzed the publicly available RNA sequencing (RNA-seq) and DNA methylation (bisulfite-seq) data of Angelman syndrome patients. The RNA-seq dataset was taken from the NCBI archive under the accession number PRJNA255989 [20]. The bisulfite-seq data were taken from the Gene Expression Omnibus dataset under accession number GSE8154157 [15]. The raw sequencing data were analyzed for enrichment of known molecular pathways differentially expressed and differentially methylated in AS patients compared to healthy controls.
RNA sequencing raw reads were preprocessed to eliminate low-quality reads. The remaining reads were aligned to the assembled human genome (GRCh38.p12), and gene expression profiles were calculated. Principal component analysis (PCA) showed a clear separation between healthy controls and AS-derived iPSCs (Figure 1A). We found 209 upregulated genes in AS samples (Supplementary Materials, Table S1). Of these, 12 genes were highly expressed in AS samples and not expressed at all in control samples: COL22A1, EIF3CL, ERP27, EVA1A, FAM135B, GPR1, KIAA0040, KRT80, LYNX1, OLFML1, POTEI, and ZNF558. We also identified 31 downregulated genes in AS (Supplementary Materials, Table S2). Interestingly, 5 of these genes are associated with synaptic transmission: GABRA2, GAD1, SLC18A2, SST, and WNT7A.
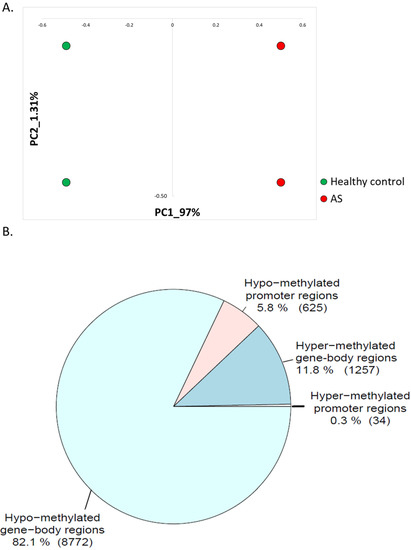
Figure 1.
(A) Principal component analysis (PCA) of gene expression iPSC-derived neurons (PRJNA255989). (B) Pie chart showing the number of hyper-methylated regions near promoters (±1000 bp) (34 regions); hyper-methylated regions inside the gene bodies (1257 regions); hypo-methylated regions near promoters (±1000 bp) (625 regions); and hypo-methylated regions inside gene-bodies (8772 regions).
The analysis of DNA methylation included per-position methylation calling based on Poisson distribution statistics (see Methods section). For a per-position contrast between scores in AS and healthy controls, the whole-genome profiles were segmented using the BinS algorithm [25,26], resulting in significantly differentiated hyper- and hypo- methylated regions in AS. The positions of the differentially methylated fragments of the genome were aligned with the positions of known promoter regulatory elements and with annotated genes.
We observed a high bias toward hypo-methylation of genome regions in AS. In addition, from a total of 10,688 differentially methylated regions aligned with promoter regions or gene bodies, 9397 (88%) were hypo-methylated in AS (Figure 1B).
We found 34 hyper-methylated regions of the genome that were located in proximity (±1000 bp) to gene promoter regions (Supplementary Materials, Table S3). Five of the hyper-methylated genes are known to regulate apoptosis: FANK1, NLRC4, ALDH1A2, LPAR1, and USP17L13. Two more genes (the KCNN2 gene that codes for the SK2 channel and LPAR1) are known to regulate neuronal spine development and are directly involved in learning, memory, and behavior regulation [27,28,29,30,31,32].
Hyper-methylation of promoter regions has been associated with downregulation of gene expression [33]. We investigated whether the genes associated with hyper-methylated promoters were differentially expressed in AS-patient-derived iPSCs. However, we did not find any downregulated genes associated with the hyper-methylated promoters (Figure 2A).
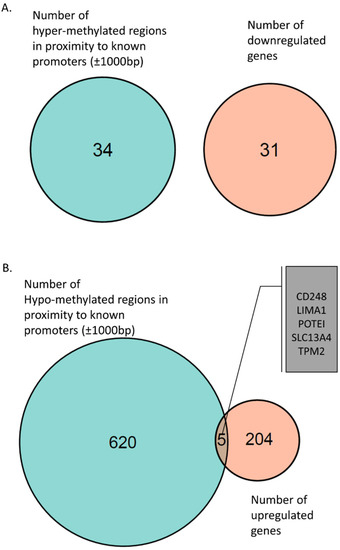
Figure 2.
(A) Venn diagram of hyper-methylated regions near promoters (±1000 bp) and downregulated genes associated with these promoter regions. (B) Venn diagram of hypo-methylated regions near promoters (±1000 bp) and upregulated genes associated with these promoter regions. Five genes were found to be hypo-methylated and upregulated: CD248, LIMA1, POTEI, SLC13A4, and TPM2.
Next, we identified 625 hypo-methylated regions in proximity to known gene promoters (±1000 bp) (Supplementary Materials, Table S4). Hypo-methylated promoter regions are known to be “open” for transcription and thus are expected to be associated with upregulated expression of the genes [33]. We found five of these genes upregulated in iPSC-derived neurons from AS patients: POTEI, CD248, TPM2, LIMA1, and SLC13A4 (Figure 2B and Supplementary Materials, Table S5). Interestingly, the POTEI gene was found to have a hypo-methylated promoter region and was also expressed only in AS samples.
It has been shown that in addition to methylation of promoters, methylation of gene-body regions also has a regulatory effect on the expression of genes [34,35]. Nonetheless, it is still unclear whether methylation of the gene body represses or enhances expression [36,37,38]. Furthermore, we found that many of the genes contained both hyper- and hypo- methylated regions in their gene bodies (Figure 3). This confounding effect can be explained by the heterogeneity of the cells constituting the studied tissue. It is known that DNA methylation is cell-type specific, and thus different regulations can be present in different cells [39]. To avoid further perplexity, we investigated genes which had unique epigenetic signals in their gene body, i.e., either a hyper-methylated region or a hypo-methylated region.
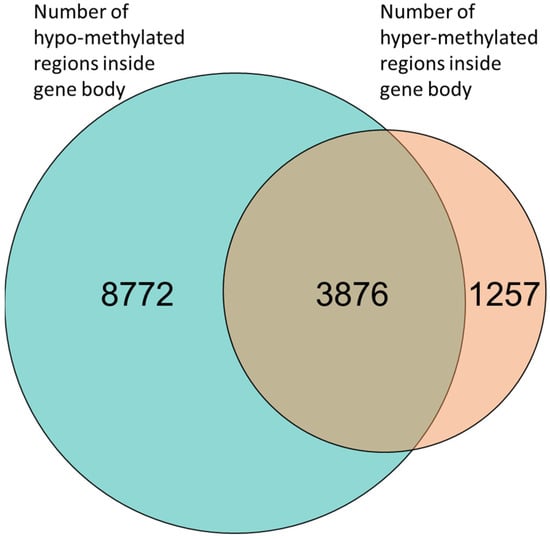
Figure 3.
Venn diagram of gene-body methylation. Many genes (3876) had both hyper-methylated and hypo-methylated regions. However, 8772 genes had only hypo-methylation regions and 1257 genes had only hyper-methylated regions.
We found 1257 genes that had unique hyper-methylated regions in their gene body (Figure 3 and Supplementary Materials, Table S6). Further investigation of the expression of these genes showed that the GSX2 gene was downregulated in AS (Figure 4A). GSX2 is a transcription factor required for neuronal development [40,41,42,43]. In addition, we found 7 genes that were hyper-methylated in the gene-body regions, and their expression was upregulated in AS (Figure 4B and Supplementary Materials, Table S7).
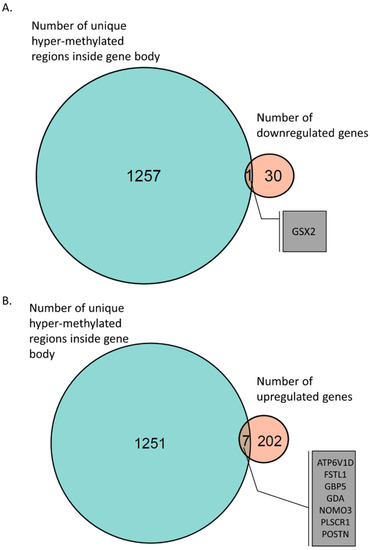
Figure 4.
Venn diagram of gene-body hyper-methylation and gene expression. (A) GSX2 gene, which had a hyper-methylated region inside its gene body and was found to be downregulated in AS-derived iPSC neurons. (B) Seven genes were identified with hyper-methylated regions inside their gene bodies and were found to be upregulated in AS iPSC-derived neurons.
We found 8772 genes that had a unique hypo-methylated region in their gene body (Figure 3 and Supplementary Materials, Table S8). This extraordinary high number of hypo-methylated genes (almost seven times as many genes had hypo-methylated regions than had hyper-methylated regions) suggests that overall, the genome in AS is hypo-methylated. This observation is in line with previous reports of overall DNA hypo-methylation in UBE3A knockdown cell lines [16]. Global hypo-methylation of DNA has been observed in many disorders and has been suggested to cause the genomic instability observed in many types of cancers [44,45] and in neuropsychiatric disorders [46,47].
We next investigated genes that were hypo-methylated in their gene-body regions and upregulated in iPSCs derived from AS patients. We found 73 such hypo-methylated and upregulated genes (Figure 5A and Supplementary Materials, Table S9). Of particular interest, were genes associated with synapse and neuronal activity, such as GPR176, RAB29, C1QL1, EXT1, GLRB, HRH1, HAPLN1, THBS2, and GPNMB. Furthermore, we identified 12 genes with hypo-methylated loci in their gene bodies that were downregulated in AS (Figure 5B and Supplementary Materials, Table S10).
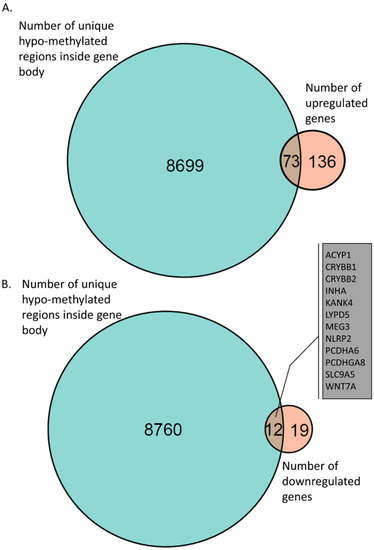
Figure 5.
Venn diagram of gene-body hypo-methylation and gene expression. (A) A total of 73 genes were identified with a hypo-methylated region inside the gene body that were found in AS-derived iPSC neurons. (B) A total of 12 genes were identified with hypo-methylated regions inside their gene bodies that were found to be downregulated in AS-derived iPSC neurons.
Combining all aberrantly DNA-methylated and mRNA-dysregulated genes in AS, we found that they form several important functional clusters related to cell–cell adhesion (Figure 6A,B). These functional clusters included “extracellular matrix”, “ECM-receptor interaction pathway”, “secreted”, “heparin binding”, “collagen fibril organization”, “N-terminal cadherin”, and “glycosaminoglycan binding”. These pathways included 20 genes that were differentially methylated and expressed in AS samples compared to healthy controls (BGN, CCDC80, COL1A1, COL4A1, COL5A1, COMP, ENG, EXT1, FSTL1, GPNMB, ITGA11, ITGB4, LOXL2, PCDHA10, PCDHA6, PCDHGA8, PCDHGB6, POSTN, SULF1, and THBS2). We identified several transcription factors regulating the genes found as dysregulated in AS by utilizing the TRRUST database [48]: SP1, LMX1B, MYBL2, ZEB1, SNAI2, SF1 (Supplementary Materials, Table S11). Remarkably, the SP1 transcription factor, which is known to regulate 12 of the identified dysregulated genes (Supplementary Materials, Table S11), has been shown to be activated by UBE3A [12,49], and thus the downstream effect of dysregulation of SP1 may be observed in AS samples.
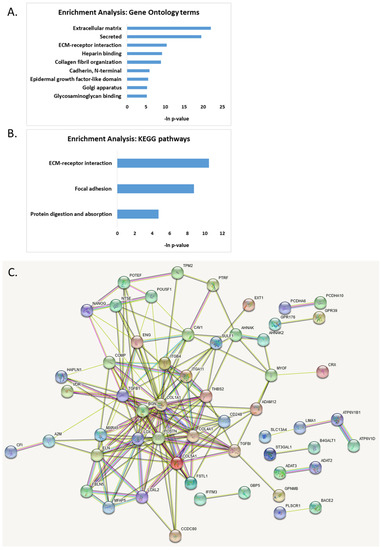
Figure 6.
Functional enrichment analysis of genes found to be dysregulated both on DNA methylation level and on gene expression level. (A) Gene ontology enrichment analysis; (B) KEGG pathways enrichment analysis; (C) protein–protein interaction map generated with STRING tool.
The protein–protein interaction analysis using STRING [50,51] revealed several hub proteins with more than 10 edges: COL1A1, POSTN, TGFB1, COL5A1, BGN, LOX, COL4A1, ELN, THBS2, CAV1, and TGFBI (Figure 6C).
3. Discussion
Multiple studies have used omics technologies in various biological models for Angelman syndrome [7,15,20,22,52,53,54,55,56,57], yielding multiple genes of interest. Herein, we attempt to associate two datasets obtained from neurons that were derived from human AS patients and healthy controls. The DNA methylation data were generated from postmortem brains of AS patients and healthy controls [15]. The mRNA sequencing data were generated from iPSC-derived neurons from AS patients and healthy controls [20]. We explored the interaction between the epigenetic level and the transcriptome level of cellular mechanisms, believing that the two datasets strengthen each other and that differentially expressed genes that are also found to have aberrant DNA methylation signals are strong candidates for the phenomenology of AS.
DNA methylation in the promoter region of genes is known to attenuate gene expression. However, the effect of DNA methylation inside the gene body on the expression is not clear. We identified hyper- and hypo-methylated regions by comparing methylation frequencies in two pairs of AS and control samples. If the methylation frequency was statistically higher in the AS samples than in the control samples, this region of the genome was called “hyper-methylated” in AS. When the methylation signal in control samples was higher than in AS, we called these regions “hypo-methylated” in AS. These found methylated regions were compared with genome annotation to identify the type of regulatory region, either a region close to the promoter (±1000 bp) or a differentially methylated region inside the gene body. Next, we identified differentially expressed genes in AS iPSCs-derived neurons. Finally, we could reveal which differentially expressed genes were also aberrantly methylated in AS. It is important to note that both DNA methylation and gene expression status show great variation among different cell types [58,59,60,61], and therefore, cell-type-specific or single-cell epigenetic analyses will also be important in the future.
Before implementing the crossing between the DNA methylation and mRNA expression we explored the gene expression data. Principal component analysis (PCA) showed that healthy control samples were clearly separated from AS samples (Figure 1A). We found 31 genes that were downregulated in AS and 209 (87%) genes that were upregulated in AS. Of most interest were genes with striking differences in their mRNA expression. We found 12 genes (COL22A1, EIF3CL, ERP27, EVA1A, FAM135B, GPR1, KIAA0040, KRT80, LYNX1, OLFML1, POTEI, and ZNF558) that were highly expressed in AS iPSCs and not expressed at all in control iPSC neurons (Supplementary Materials, Table S1). One of these genes was LYNX1, which is known to bind the extracellular face of the nicotinic receptors of the cholinergic system. LYNX1 is a critical modulator of memory, learning, and plasticity. It has been shown that the removal of LYNX1 in animal models leads to memory and plasticity enhancements [62]. Another gene that we found to be highly expressed in AS neurons and not expressed at all in control neurons, EVA1A1, is a key player in autophagy regulation [63]. EVA1A is essential for neuronal differentiation and neurogenesis [64,65]. Another upregulated gene was ERP27, which binds unfolded proteins. This could explain its role in AS, where the UBE3A gene is lacking. UBE3A, as an E3-ligase, is predicted to induce degradation of proteins by tagging them with ubiquitin chains. Some of the proteins that are marked for degradation are damaged, such as unfolded proteins. Hence, the lack of UBE3A in AS presumably causes a rise in the expression of unfolded proteins. Therefore, the upregulation of ERP27, which binds unfolded proteins, is reasonable. In addition, we found high expression of the GPR1 gene in AS and no detectable expression in control iPSCs. GPR1 shares sequence similarity (43%) with opioid neurotransmitters [66,67] and is known to regulate non-genomic estrogen effects [67].
Of the 31 downregulated genes, 4 were not expressed at all in AS iPSC samples (CRYBA4, FAM167B, GABRA2, and POU3F4) (Supplementary Materials, Table S2). Of these, the GABRA2 gene coding for the alpha-2 subunit of the GABAA receptor is of most interest. GABA is involved in balancing excitatory and inhibitory responses and is critical to proper brain functioning [68]. It has been shown that the expression of the GABRA2 gene is dysregulated in several neuropsychological conditions such as autism spectrum disorder [69], schizophrenia [70], depression [71], and impulsive behavior [72].
DNA methylation is a critical regulatory mechanism implicated in brain development, learning, memory, and disease in the human brain [73,74,75]. In contrast to gene expression, few if any DNA methylation differences among phenotypically normal human brain regions have been reported [76,77,78]. However, DNA methylation is known to be altered in patients with neuropsychiatric diseases, including schizophrenia [79], Alzheimer’s [80], and major depressive disorder [81].
Overall, we observed hypo-methylation of the AS genome (Figure 1B). We found that 9397 (88%) of the differentially methylated regions (both in proximity to promoters and inside gene bodies) were hypo-methylated in AS. Interestingly, overall hypo-methylation of the genome has been observed in many diseases, especially in different cancers [82,83].
Thirty-four (34) genes were found to be hyper-methylated in proximity (±1000 bp) to their promoter (Supplementary Materials, Table S3). Some of these hyper-methylated genes in AS are known to regulate apoptosis (FANK1, NLRC4, ALDH1A2, LPAR1, and USP17L13), which coincides with our previous finding that apoptosis is dysregulated in AS [53]. Two more genes (KCNN2 and LPAR1) regulate neuronal spine development, which is known to be dysregulated in AS. While the KCNN2 gene that codes for the SK2 channel is known to be dysregulated in AS [32,84,85], LPAR1 is known to be dysregulated in the AS-like Pitt–Hopkins syndrome [86]. Another important gene with a hyper-methylated promoter was PRKACG, which is known to repress pain sensation by regulating the transcription of the DREAM protein, coinciding with our previous observation that AS mice have disrupted pain perception [54]. In addition, the GIT2 gene promoter was found to be hyper-methylated in AS. GIT2 is known to be the main coordinator of aging processes, including obesity, which is one of the phenotypes of AS [87].
Hyper-methylation of the promoter region is known to repress gene expression; thus, we checked whether any of the 31 downregulated genes were among the genes with hyper-methylated promoters. We did not find any intersecting genes (Figure 2A).
We found 625 genes with a hypo-methylated region in proximity to their promoter (Supplementary Materials, Table S4). Hypo-methylated promoter regions are known to enhance gene expression; thus, we identified 5 genes that were upregulated in AS iPSCs (Figure 2B and Supplementary Materials, Table S5). One of these hypo-methylated and upregulated genes was the POTEI gene. The POTE (prostate-, ovary-, testis-, and placenta-expressed) family of genes has been shown to have low expression in normal somatic tissues but is highly expressed in various cancers [88,89]. Interestingly, the expression of the POTE family of genes has been associated with DNA hypo-methylation and activation of LINE1 elements. In fact, POTE genes themselves harbor LINE1 elements [90]. Activation of LINE1 in cancer leads to genomic instability and mutagenesis and has been shown to drive cancer progression. In addition, it has been suggested that activation of LINE1 elements is involved in autism and other neurodevelopmental disorders [91,92]. Another gene amongst those that were hypo-methylated near their promoter region and highly expressed in AS was the SLC13A4 gene. SLC13A4 encodes for a sulfate transporter. Dysregulated SLC13A4 expression has been observed in several neurological and neurodevelopmental disorders and during seizures [93,94], which display shared phenotypes with AS patients.
In addition to methylation of promoter regions, it has been shown that methylation of the gene body has a regulatory effect on the expression of genes [35,45]. Nonetheless, this effect on the expression of genes is still not well understood; it is not clear whether gene-body methylation blocks or enhances gene transcription [36,37,38]. Hence, we divided our analyses of gene-body methylation into four associations with gene expression data. First, we considered genes hyper-methylated in their gene body and downregulated in AS samples. In the next association, we crossed the genes with hyper-methylated gene bodies with upregulated genes. Next, the same two types of associations were performed for hypo-methylated genes, i.e., genes that were hypo-methylated in their gene body and upregulated and hypo-methylated gene-body genes that were downregulated in AS samples.
Inside gene bodies, we found 5133 regions that were hyper-methylated in AS and 12,648 hypo-methylated regions. However, 3876 genes had both hyper- and hypo-methylated regions in AS (Figure 3). Thus, we further investigated only genes that had unique methylation status in AS, i.e., either hyper-methylated (1257, Supplementary Materials, Table S6) or hypo-methylated (8772, Supplementary Materials, Table S8).
The only gene with hyper-methylation of the gene-body region in AS and downregulated mRNA expression was the GSX2 gene (Figure 4A). GSX2 is a transcription factor required for neuronal development [40,41,42,43], and thus its hyper-methylation and downregulation is of high importance. In addition, we found seven hyper-methylated and overexpressed genes (Supplementary Materials, Table S7 and Figure 4B). One of these hyper-methylated and overexpressed genes was GDA, which codes for the protein Cypin. Cypin is important for neuronal development and is a regulator of PSD-95 postsynaptic signaling. It has been shown that overexpression of Cypin in cultured hippocampal neurons disrupts the synaptic clustering of PSD-95 and SAP-102 synaptic proteins.
We identified 8772 genes that had only a hypo-methylated signal in AS inside their gene bodies (Supplementary Materials, Table S8). Crossing these genes with upregulated genes in AS, we found 73 genes (Supplementary Materials, Table S9 and Figure 5A). Of special interest were genes associated with synapse and neuronal activity, such as GPR176, RAB29, C1QL1, EXT1, GLRB, HRH1, HAPLN1, THBS2, and GPNMB. Previously, it has been noted that synaptic functioning is dysregulated in AS [95,96,97,98,99]. Another interesting cluster of genes were the 17 genes known to be involved in cell adhesion: ADAM12, AJAP1, B4GALT1, COMP, COL1A1, COL5A1, ENG, GPNMB, HAPLN1, ITGA11, ITGB4, IL32, LOXL2, PCDHA10, PCDHGB6, THBS2, and TGFBI. Crossing the hypo-methylated regions with the downregulated genes we found 12 genes (Supplementary Materials, Table S10 and Figure 5B). The most significantly downregulated gene was MEG3, which is a long non-coding RNA previously implicated in Alzheimer’s pathology and in several cancers. MEG3 has been shown to be a powerful cell growth suppressor regulating the PI3K/Akt signaling pathway [100,101]. In addition, we found hypo-methylation and downregulation of two crystalline genes, CRYBB1 and CRYBB2, which were previously found to be associated with schizophrenia and autism-like behavior [102,103].
Finally, combining all of the above genes dysregulated on both methylation and expression levels in AS, we found several functional clusters dysregulated in AS (Figure 6A,B). Extracellular matrix (ECM) receptor interaction was one of the most significantly dysregulated pathways in AS. ECM receptors and their ligands play key roles in neuronal differentiation, communication, and synapse connection. They regulate synaptic activity and neuronal structure and function, and thereby affect animal behavior [104,105]. Recently, dysregulation of cell adhesion molecules in UBE3A-silenced cells revealed that these cells have impaired morphological development and pathway activation, leading to a delayed adhesion and defective contact guidance in response to stimuli [104].
Fascinatingly, the transcription factors that control the expression of the dysregulated genes in AS on both the DNA methylation level and on the mRNA expression level (Supplementary Materials, Table S11) included SP1 transcription factor. SP1 has been shown to be activated by UBE3A [12,49], and thus the downstream effect of dysregulation of SP1 may be observed in AS samples.
We also found that two of the genes found to be differentially expressed and differentially methylated, MEG3 and NLRP2, are maternally imprinted genes.
The protein–protein interaction analysis revealed 11 hub proteins with more than 10 edges: COL1A1, POSTN, TGFB1, COL5A1, BGN, LOX, COL4A1, ELN, THBS2, CAV1, and TGFBI (Figure 6C).
It is important to note that the results presented in our study should be considered with caution due to the small sample size both in the transcriptome dataset and the DNA methylation dataset. In effect, our study emphasizes the need for producing additional datasets to elucidate the molecular effect of UBE3A deletion in different cells and tissues.
To conclude, in this study, we observed that while the amount of correspondence between the epigenomic level of DNA methylation and the level of mRNA expression is not high, still there is some congruity between these two levels, which yields a list of genes that are significant for brain development. This list can serve future studies as a basis for further exploration of target genes that are involved in the pathophysiology of Angelman syndrome and other similar neurodevelopmental disorders.
4. Materials and Methods
4.1. RNA Sequencing Analysis
Raw RNA sequencing data were downloaded from the NCBI database (SRP04474952) [20]. For our analysis we used four samples from this project: two biological replicates of AS patient (del 1-0) iPSC-derived neurons (SRR1523347, SRR1523349) and two healthy control samples from Nml (1-0) iPSC-derived neurons (SRR1523352, SRR1523353). The AS patient iPSC-derived neurons were originally reported by Chamberlain et al. [105] and were generated from fibroblasts of patient with 15q11-q13 deletion. Raw sequencing reads were cleaned from adapter sequences using the Trimmomatic algorithm [106] and aligned to the human reference genome (GRCh38.p12) using TopHat2 [107]. Differentially expressed genes were identified with EdgeR [108]. We considered genes to be differentially expressed and upregulated in AS if they had a p-value < 0.005 and a fold change > 1.5. We considered genes to be differentially expressed and downregulated in AS if they had a p-value < 0.005 and a fold change < 0.6.
4.2. DNA Methylation Analysis
Whole-genome DNA methylation bisulfite sequencing data were downloaded from the NCBI database (GSE8154157) [15]. The dataset used for the analysis includes four samples: two AS patient samples, male and female (GSM2156992 and GSM2156993), and two healthy control samples, male and female (GSM2156974 and GSM2156973) of a relatively similar age (AS male age 23, AS female age 43, healthy control female age 42, and healthy control male age 42). All AS patients had maternal deletion of 15q11.2–q13.3 [15]. Raw reads were aligned to the human reference genome (GRCh38.p12) using the segemehl alignment algorithm with the [−F, −bisulfite 1] option [109]. Per-nucleotide methylation levels and differentially methylated regions were determined similarly to the procedure for identifying mutational frequencies in Li et al. [110].
Briefly, the frequency of each of the methylated cytosines across the genome in each sample was determined by the number of reads with C > T variant alignment on the positive strand and A > G variant alignment on the negative strand divided by the overall coverage of the genome at the given position. The accuracy of estimation of variant frequency can be influenced by the coverage of this position. Thus, to estimate the significance of the frequency of each variant we calculated the 95% confidence interval for the frequency of every variant at the given position from Wilks’ theorem for binomial distributions. Each frequency, with its confidence interval margins, was transformed to values of the quasi-normally distributed variable using the Fisher transformation:
The standard deviation (SD) of the variant frequency was evaluated as 1/6 of the confidence interval length after transformation of its margins.
After calculating the frequencies and the 95% confidence intervals of the methylated variant in each sample, we calculated the significance of the slope (b1 coefficient) of the linear regression between two pairs of frequencies in each methylated position (control male sample against AS male sample and control female sample against AS female sample):
where b = (b0, b1) is a vector column of parameters.
Vector Y consists of sub-columns (Y1, Y2) of the Gaussianized frequency observations in two samples (control and AS). Matrix X consists of two columns: a column of intercepts and a column consisting of −1 and +1 sub-columns matching the Y1 and Y2 sub-columns. The least squares estimation of vector b of parameters b0 and b1 is:
This linear estimation gives a standard deviation for both parameter estimations, particularly SD(b1) for the b1 estimation that is a function of the SDs of Y(i) in the two groups, i.e., b1 is a linear combination of Y1(i) and Y2(j) stochastic variables. Therefore, assuming the independence of all Y(i) variables, SD(b1) is calculated via SD(Y(i)).
Based on SD (b1), the significance of b1 is calculated as the z-score of the fitness parameter b1:
where Y (normalized frequency of methylation) is observed in two groups of samples with standard deviations SD1 and SD2 for Y1 and Y2 observations. The maximum likelihood (least squares) estimation of b1 gives the “slope” of the methylation—hyper-methylation (positive slope between control and AS groups) or hypo-methylation (negative slope between control and AS groups). The b1 estimation is also a normally distributed stochastic variable with its own SD that defines the significance (z-score) of the methylation b1.
Y = b0 + b1 × Group Difference
Using the BinS algorithm [26] for genome segmentation, we found regions of the genome enriched by differential methylation signals in two pairs of samples (control male versus AS male and control female versus AS female). These segments were aligned to the known regulatory regions of the genome (promoter regions ± 1000 bp and gene bodies). If some regulatory region was found to be hypo- or hyper-methylated in both male and female pairs of samples, it was considered to be differentially methylated.
4.3. Enrichment Analysis
Gene enrichment analysis was performed using the DAVID [111,112,113] and Enrichr [114,115] web servers. The protein–protein interaction analysis was performed using STRING [50].
Supplementary Materials
The following are available online at https://www.mdpi.com/article/10.3390/ijms23169139/s1.
Author Contributions
Conceptualization, H.K. and J.P.; methodology, H.K. and J.P.; formal analysis, J.P.; investigation, H.K. and J.P.; resources, H.K.; data curation, J.P.; writing—original draft preparation, J.P.; writing—review and editing, H.K. and J.P.; visualization, J.P.; supervision, H.K. All authors have read and agreed to the published version of the manuscript.
Funding
This research was funded by the Israel Science Foundation, under grant number ISF 248/20 (H.K.).
Institutional Review Board Statement
Not applicable.
Informed Consent Statement
Not applicable.
Data Availability Statement
The RNA-seq dataset was taken from the NCBI archive under the accession number PRJNA255989. The bisulfite-seq data were taken from the Gene Expression Omnibus dataset under accession number GSE8154157.
Conflicts of Interest
The authors declare no conflict of interest.
Acronyms and Abbreviations
| AS | Angelman syndrome |
| PCA | principal component analysis |
| ALDH1A2 | aldehyde dehydrogenase 1 family member A2 |
| BGN | biglycan |
| C1QL1 | complement C1q like 1 |
| CAV1 | caveolin 1 |
| CCDC80 | coiled-coil domain containing 80 |
| CD248 | CD248 molecule |
| COL1A1 | collagen type I alpha 1 chain |
| COL22A1 | collagen type XXII alpha 1 chain |
| COL4A1 | collagen type IV alpha 1 chain |
| COL5A1 | collagen type V alpha 1 chain |
| COMP | cartilage oligomeric matrix protein |
| EIF3CL | eukaryotic translation initiation factor 3 subunit C like |
| ELN | elastin |
| ENG | endoglin |
| ERP27 | endoplasmic reticulum protein 27 |
| EVA1A | eva-1 homolog A, regulator of programmed cell death |
| EXT1 | exostosin glycosyltransferase 1 |
| FAM135B | family with sequence similarity 135 member B |
| FANK1 | fibronectin type III and ankyrin repeat domains 1 |
| FSTL1 | follistatin like 1 |
| GABRA2 | gamma-aminobutyric acid type A receptor subunit alpha2 |
| GAD1 | glutamate decarboxylase 1 |
| GLRB | glycine receptor beta |
| GPNMB | glycoprotein nmb |
| GPNMP | glycoprotein nonmetastatic melanoma protein B |
| GPR1 | chemerin chemokine-like receptor 2 |
| GPR176 | G protein-coupled receptor 176 |
| GSX2 | GS homeobox 2 |
| HAPLN1 | hyaluronan and proteoglycan link protein 1 |
| HRH1 | histamine receptor H1 |
| ITGA11 | integrin subunit alpha 11 |
| ITGB4 | integrin subunit beta 4 |
| KCNN2 | potassium calcium-activated channel subfamily N member 2 |
| KRT80 | keratin 80 |
| LIMA1 | LIM domain and actin binding 1 |
| LMX1B | LIM homeobox transcription factor 1 beta |
| LOX | lysyl oxidase |
| LOXL2 | lysyl oxidase like 2 |
| LPAR1 | lysophosphatidic acid receptor 1 |
| LYNX1 | Ly6/neurotoxin 1 |
| MYBL2 | MYB proto-oncogene like 2 |
| NLRC4 | NLR family CARD domain containing 4 |
| OLFML1 | olfactomedin like 1 |
| PCDHA10 | protocadherin alpha 10 |
| PCDHA6 | protocadherin alpha 6 |
| PCDHGA8 | protocadherin gamma subfamily A, 8 |
| PCDHGB6 | protocadherin gamma subfamily B, 6 |
| POSTN | periostin |
| POTEI | POTE ankyrin domain family member I |
| RAB29 | RAB29, member RAS oncogene family |
| SF1 | splicing factor 1 |
| SLC13A4 | solute carrier family 13 member 4 |
| SLC18A2 | solute carrier family 18 member A2 |
| SNAI2 | snail family transcriptional repressor 2 |
| SP1 | Sp1 transcription factor |
| SST | somatostatin |
| SULF1 | sulfatase 1 |
| TGFB1 | transforming growth factor beta 1 |
| TGFBI | transforming growth factor beta induced |
| THBS2 | thrombospondin 2 |
| TPM2 | tropomyosin 2 |
| UBE3A | ubiquitin protein ligase E3A |
| USP17L13 | ubiquitin specific peptidase 17 like family member 13 |
| WNT7A | Wnt family member 7A |
| ZEB1 | zinc finger E-box binding homeobox 1 |
| ZNF558 | zinc finger protein 558 |
References
- Lossie, A.C.; Whitney, M.M.; Amidon, D.; Dong, H.J.; Chen, P.; Theriaque, D.; Hutson, A.; Nicholls, R.D.; Zori, R.T.; Williams, C.A.; et al. Distinct phenotypes distinguish the molecular classes of Angelman syndrome. J. Med. Genet. 2001, 38, 834–845. [Google Scholar] [CrossRef]
- Williams, C.A. Neurological aspects of the Angelman syndrome. Brain Dev. 2005, 27, 88–94. [Google Scholar] [CrossRef]
- Kishino, T.; Lalande, M.; Wagstaff, J. UBE3A/E6-AP mutations cause Angelman syndrome. Nat. Genet. 1997, 15, 70–73. [Google Scholar] [CrossRef] [PubMed]
- Knoll, J.H.M.; Nicholls, R.D.; Magenis, R.E.; Graham, J.M.; Lalande, M.; Latt, S.A.; Opitz, J.M.; Reynolds, J.F.; Graham, J.M., Jr.; Lalande, M.; et al. Angelman and Prader-Willi syndromes share a common chromosome 15 deletion but differ in parental origin of the deletion. Am. J. Med. Genet. 1989, 32, 285–290. [Google Scholar] [CrossRef] [PubMed]
- Matsuura, T.; Sutcliffe, J.S.; Fang, P.; Galjaard, R.J.; Jiang, Y.H.; Benton, C.S.; Rommens, J.M.; Beaudet, A.L. De novo truncating mutations in E6-Ap ubiquitin-protein ligase gene (UBE3A) in Angelman syndrome. Nat. Genet. 1997, 15, 74–77. [Google Scholar] [CrossRef]
- Sutcliffe, J.S.; Jiang, Y.H.; Galjaard, R.J.; Matsuura, T.; Fang, P.; Kubota, T.; Christian, S.L.; Bressler, J.; Cattanach, B.; Ledbetter, D.H.; et al. The E6-AP ubiquitin protein ligase (UBE3A) gene is localized within a narrowed Angelman syndrome critical region. Genome Res. 1997, 7, 368–377. [Google Scholar] [CrossRef] [PubMed]
- Urraca, N.; Cleary, J.; Brewer, V.; Pivnick, E.K.; McVicar, K.; Thibert, R.L.; Schanen, N.C.; Esmer, C.; Lamport, D.; Reiter, L.T. The Interstitial Duplication 15q11. 2-q13 Syndrome Includes Autism, Mild Facial Anomalies and a Characteristic EEG Signature. Autism Res. 2013, 6, 268–279. [Google Scholar] [CrossRef]
- Battaglia, A. The inv dup(15) or idic(15) syndrome: A clinically recognisable neurogenetic disorder. In Brain and Development; Elsevier: Amsterdam, The Netherlands, 2005; Volume 27, pp. 365–369. [Google Scholar]
- Iossifov, I.; Zheng, T.; Baron, M.; Gilliam, T.C.; Rzhetsky, A. Genetic-linkage mapping of complex hereditary disorders to a whole-genome molecular-interaction network. Genome Res. 2008, 18, 1150–1162. [Google Scholar] [CrossRef]
- Vatsa, N.; Jana, N.R. UBE3A and its link with autism. Front. Mol. Neurosci. 2018, 11, 448. [Google Scholar] [CrossRef]
- Catoe, H.W.; Nawaz, Z. E6-AP facilitates efficient transcription at estrogen responsive promoters through recruitment of chromatin modifiers. Steroids 2011, 76, 897–902. [Google Scholar] [CrossRef] [PubMed]
- Nawaz, Z.; Lonard, D.M.; Smith, C.L.; Lev-Lehman, E.; Tsai, S.Y.; Tsai, M.J.; O’Malley, B.W. The Angelman syndrome-associated protein, E6-AP, is a coactivator for the nuclear hormone receptor superfamily. Mol. Cell. Biol. 1999, 19, 1182–1189. [Google Scholar] [CrossRef] [PubMed]
- Kühnle, S.; Mothes, B.; Matentzoglu, K.; Scheffner, M. Role of the ubiquitin ligase E6AP/UBE3A in controlling levels of the synaptic protein Arc. Proc. Natl. Acad. Sci. USA 2013, 110, 8888–8893. [Google Scholar] [CrossRef] [PubMed]
- El Hokayem, J.; Weeber, E.; Nawaz, Z. Loss of Angelman Syndrome Protein E6AP Disrupts a Novel Antagonistic Estrogen-Retinoic Acid Transcriptional Crosstalk in Neurons. Mol. Neurobiol. 2018, 55, 7187–7200. [Google Scholar] [CrossRef] [PubMed]
- Dunaway, K.W.; Islam, M.S.; Coulson, R.L.; Lopez, S.J.; Vogel Ciernia, A.; Chu, R.G.; Yasui, D.H.; Pessah, I.N.; Lott, P.; Mordaunt, C.; et al. Cumulative Impact of Polychlorinated Biphenyl and Large Chromosomal Duplications on DNA Methylation, Chromatin, and Expression of Autism Candidate Genes. Cell Rep. 2016, 17, 3035–3048. [Google Scholar] [CrossRef]
- Lopez, S.J.; Dunaway, K.; Islam, M.S.; Mordaunt, C.; Vogel Ciernia, A.; Meguro-Horike, M.; Horike, S.i.; Segal, D.J.; LaSalle, J.M. UBE3A-mediated regulation of imprinted genes and epigenome-wide marks in human neurons. Epigenetics 2017, 12, 982–990. [Google Scholar] [CrossRef]
- Kohl, M.; Megger, D.A.; Trippler, M.; Meckel, H.; Ahrens, M.; Bracht, T.; Weber, F.; Hoffmann, A.C.; Baba, H.A.; Sitek, B.; et al. A practical data processing workflow for multi-OMICS projects. Biochim. Biophys. Acta Proteins Proteom. 2014, 1844, 52–62. [Google Scholar] [CrossRef]
- Subramanian, I.; Verma, S.; Kumar, S.; Jere, A.; Anamika, K. Multi-omics Data Integration, Interpretation, and Its Application. Bioinform. Biol. Insights 2020, 14, 117793221989905. [Google Scholar] [CrossRef]
- King, I.F.; Yandava, C.N.; Mabb, A.M.; Hsiao, J.S.; Huang, H.S.; Pearson, B.L.; Calabrese, J.M.; Starmer, J.; Parker, J.S.; Magnuson, T.; et al. Topoisomerases facilitate transcription of long genes linked to autism. Nature 2013, 501, 58–62. [Google Scholar] [CrossRef]
- Germain, N.D.; Chen, P.F.; Plocik, A.M.; Glatt-Deeley, H.; Brown, J.; Fink, J.J.; Bolduc, K.A.; Robinson, T.M.; Levine, E.S.; Reiter, L.T.; et al. Gene expression analysis of human induced pluripotent stem cell-derived neurons carrying copy number variants of chromosome 15q11-q13.1. Mol. Autism 2014, 5, 44. [Google Scholar] [CrossRef]
- Fink, J.J.; Robinson, T.M.; Germain, N.D.; Sirois, C.L.; Bolduc, K.A.; Ward, A.J.; Rigo, F.; Chamberlain, S.J.; Levine, E.S. Disrupted neuronal maturation in Angelman syndrome-derived induced pluripotent stem cells. Nat. Commun. 2017, 8, 15038. [Google Scholar] [CrossRef]
- Sun, A.X.; Yuan, Q.; Fukuda, M.; Yu, W.; Yan, H.; Lim, G.G.Y.; Nai, M.H.; D’Agostino, G.A.; Tran, H.D.; Itahana, Y.; et al. Potassium channel dysfunction in human neuronal models of Angelman syndrome. Science 2019, 366, 1486–1492. [Google Scholar] [CrossRef] [PubMed]
- Urraca, N.; Hope, K.; Victor, A.K.; Belgard, T.G.; Memon, R.; Goorha, S.; Valdez, C.; Tran, Q.T.; Sanchez, S.; Ramirez, J.; et al. Significant transcriptional changes in 15q duplication but not Angelman syndrome deletion stem cell-derived neurons. Mol. Autism 2018, 9, 6. [Google Scholar] [CrossRef]
- Hsiao, J.S.; Germain, N.D.; Wilderman, A.; Stoddard, C.; Wojenski, L.A.; Villafano, G.J.; Core, L.; Cotney, J.; Chamberlain, S.J. A bipartite boundary element restricts UBE3A imprinting to mature neurons. Proc. Natl. Acad. Sci. USA 2019, 116, 2181–2186. [Google Scholar] [CrossRef]
- Bolen, C.R.; Robek, M.D.; Brodsky, L.; Schulz, V.; Lim, J.K.; Taylor, M.W.; Kleinstein, S.H. The blood transcriptional signature of chronic hepatitis C virus is consistent with an ongoing interferon-mediated antiviral response. J. Interf. Cytokine Res. 2013, 33, 15–23. [Google Scholar] [CrossRef] [PubMed]
- Brodsky, L.; Kogan, S.; BenJacob, E.; Nevo, E. A binary search approach to whole-genome data analysis. Proc. Natl. Acad. Sci. USA 2010, 107, 16893–16898. [Google Scholar] [CrossRef]
- Hammond, R.S.; Bond, C.T.; Strassmaier, T.; Ngo-Anh, T.J.; Adelman, J.P.; Maylie, J.; Stackman, R.W. Small-conductance Ca2+-activated K+ channel type 2 (SK2) modulates hippocampal learning, memory, and synaptic plasticity. J. Neurosci. 2006, 26, 1844–1853. [Google Scholar] [CrossRef]
- Pilpel, Y.; Segal, M. The role of LPA1 in formation of synapses among cultured hippocampal neurons. J. Neurochem. 2006, 97, 1379–1392. [Google Scholar] [CrossRef]
- Murthy, S.R.K.; Sherrin, T.; Jansen, C.; Nijholt, I.; Robles, M.; Dolga, A.M.; Andreotti, N.; Sabatier, J.-M.; Knaus, H.-G.; Penner, R.; et al. Small-Conductance Ca2+-Activated Potassium Type 2 Channels Regulate the Formation of Contextual Fear Memory. PLoS ONE 2015, 10, e0127264. [Google Scholar] [CrossRef]
- Fink, K.L.; López-Giráldez, F.; Kim, I.J.; Strittmatter, S.M.; Cafferty, W.B.J. Identification of Intrinsic Axon Growth Modulators for Intact CNS Neurons after Injury. Cell Rep. 2017, 18, 2687–2701. [Google Scholar] [CrossRef]
- Shrestha, A.; Sultana, R.; Lee, C.C.; Ogundele, O.M. SK Channel Modulates Synaptic Plasticity by Tuning CaMKIIα/β Dynamics. Front. Synaptic Neurosci. 2019, 11, 18. [Google Scholar] [CrossRef]
- Sun, J.; Liu, Y.; Baudry, M.; Bi, X. SK2 channel regulation of neuronal excitability, synaptic transmission, and brain rhythmic activity in health and diseases. Biochim. Biophys. Acta Mol. Cell Res. 2020, 1867, 118834. [Google Scholar] [CrossRef] [PubMed]
- Weber, M.; Hellmann, I.; Stadler, M.B.; Ramos, L.; Pääbo, S.; Rebhan, M.; Schübeler, D. Distribution, silencing potential and evolutionary impact of promoter DNA methylation in the human genome. Nat. Genet. 2007, 39, 457–466. [Google Scholar] [CrossRef]
- Jones, P.A. Functions of DNA Methylation: Islands, Start Sites, Gene Bodies and Beyond. Nat. Rev. Genet. 2012, 13, 484–492. [Google Scholar] [CrossRef] [PubMed]
- Yang, X.; Han, H.; DeCarvalho, D.D.; Lay, F.D.; Jones, P.A.; Liang, G. Gene body methylation can alter gene expression and is a therapeutic target in cancer. Cancer Cell 2014, 26, 577–590. [Google Scholar] [CrossRef] [PubMed]
- Ball, M.P.; Li, J.B.; Gao, Y.; Lee, J.H.; Leproust, E.M.; Park, I.H.; Xie, B.; Daley, G.Q.; Church, G.M. Targeted and genome-scale strategies reveal gene-body methylation signatures in human cells. Nat. Biotechnol. 2009, 27, 361–368. [Google Scholar] [CrossRef]
- Wan, J.; Oliver, V.F.; Wang, G.; Zhu, H.; Zack, D.J.; Merbs, S.L.; Qian, J. Characterization of tissue-specific differential DNA methylation suggests distinct modes of positive and negative gene expression regulation. BMC Genom. 2015, 16, 49. [Google Scholar] [CrossRef]
- Rauluseviciute, I.; Drabløs, F.; Rye, M.B. DNA hypermethylation associated with upregulated gene expression in prostate cancer demonstrates the diversity of epigenetic regulation. BMC Med. Genom. 2020, 13, 6. [Google Scholar] [CrossRef]
- Ahn, J.; Heo, S.; Lee, J.; Bang, D. Introduction to Single-Cell DNA Methylation Profiling Methods. Biomolecules 2021, 11, 1013. [Google Scholar] [CrossRef]
- Corbin, J.G.; Gaiano, N.; Machold, R.P.; Langston, A.; Fishell, G. The Gsh2 homeodomain gene controls multiple aspects of telencephalic development. Development 2000, 127, 5007–5020. [Google Scholar] [CrossRef]
- Corbin, J.G.; Rutlin, M.; Gaiano, N.; Fishell, G. Combinatorial function of the homeodomain proteins Nkx2.1 and Gsh2 in ventral telencephalic patterning. Development 2003, 130, 4895–4906. [Google Scholar] [CrossRef]
- Itoh, T.; Takeuchi, M.; Sakagami, M.; Asakawa, K.; Sumiyama, K.; Kawakami, K.; Shimizu, T.; Hibi, M. Gsx2 is required for specification of neurons in the inferior olivary nuclei from Ptf1a-expressing neural progenitors in zebrafish. Development 2020, 147, dev190603. [Google Scholar] [CrossRef] [PubMed]
- Yang, J.; Yang, X.; Tang, K. Interneuron development and dysfunction. FEBS J. 2022, 289, 2318–2336. [Google Scholar] [CrossRef] [PubMed]
- Daniel, F.I.; Cherubini, K.; Yurgel, L.S.; de Figueiredo, M.A.Z.; Salum, F.G. The role of epigenetic transcription repression and DNA methyltransferases in cancer. Cancer 2011, 117, 677–687. [Google Scholar] [CrossRef] [PubMed]
- Jones, P.A.; Baylin, S.B. The fundamental role of epigenetic events in cancer. Nat. Rev. Genet. 2002, 3, 415–428. [Google Scholar] [CrossRef]
- Smith, R.A.J.; Murphy, M.P. Animal and human studies with the mitochondria-targeted antioxidant MitoQ. Ann. N. Y. Acad. Sci. 2010, 1201, 96–103. [Google Scholar] [CrossRef]
- Czarny, P.; Bialek, K.; Ziolkowska, S.; Strycharz, J.; Sliwinski, T. DNA damage and repair in neuropsychiatric disorders. What do we know and what are the future perspectives? Mutagenesis 2020, 35, 79–106. [Google Scholar] [CrossRef]
- Han, H.; Shim, H.; Shin, D.; Shim, J.E.; Ko, Y.; Shin, J.; Kim, H.; Cho, A.; Kim, E.; Lee, T.; et al. TRRUST: A reference database of human transcriptional regulatory interactions. Sci. Rep. 2015, 5, 11432. [Google Scholar] [CrossRef]
- Low, D.; Chen, K.-S. UBE3A regulates MC1R expression: A link to hypopigmentation in Angelman syndrome. Pigment Cell Melanoma Res. 2011, 24, 944–952. [Google Scholar] [CrossRef]
- Franceschini, A.; Szklarczyk, D.; Frankild, S.; Kuhn, M.; Simonovic, M.; Roth, A.; Lin, J.; Minguez, P.; Bork, P.; Von Mering, C.; et al. STRING v9.1: Protein-protein interaction networks, with increased coverage and integration. Nucleic Acids Res. 2013, 41, D808–D815. [Google Scholar] [CrossRef]
- Szklarczyk, D.; Morris, J.H.; Cook, H.; Kuhn, M.; Wyder, S.; Simonovic, M.; Santos, A.; Doncheva, N.T.; Roth, A.; Bork, P.; et al. The STRING database in 2017: Quality-controlled protein-protein association networks, made broadly accessible. Nucleic Acids Res. 2017, 45, D362–D368. [Google Scholar] [CrossRef]
- Sirois, C.L.; Bloom, J.E.; Fink, J.J.; Gorka, D.; Keller, S.; Germain, N.D.; Levine, E.S.; Chamberlain, S.J. Abundance and localization of human UBE3A protein isoforms. Hum. Mol. Genet. 2020, 29, 3021–3031. [Google Scholar] [CrossRef] [PubMed]
- Simchi, L.; Panov, J.; Morsy, O.; Feuermann, Y.; Kaphzan, H. Novel Insights into the Role of UBE3A in Regulating Apoptosis and Proliferation. J. Clin. Med. 2020, 9, 1573. [Google Scholar] [CrossRef] [PubMed]
- Koyavski, L.; Panov, J.; Simchi, L.; Rayi, P.R.; Sharvit, L.; Feuermann, Y.; Kaphzan, H. Sex-Dependent Sensory Phenotypes and Related Transcriptomic Expression Profiles Are Differentially Affected by Angelman Syndrome. Mol. Neurobiol. 2019, 56, 5998–6016. [Google Scholar] [CrossRef] [PubMed]
- Silva-Santos, S.; Van Woerden, G.M.; Bruinsma, C.F.; Mientjes, E.; Jolfaei, M.A.; Distel, B.; Kushner, S.A.; Elgersma, Y. Ube3a reinstatement identifies distinct developmental windows in a murine Angelman syndrome model. J. Clin. Investig. 2015, 125, 2069–2076. [Google Scholar] [CrossRef] [PubMed]
- Stanurova, J.; Neureiter, A.; Hiber, M.; De Oliveira Kessler, H.; Stolp, K.; Goetzke, R.; Klein, D.; Bankfalvi, A.; Klump, H.; Steenpass, L. Angelman syndrome-derived neurons display late onset of paternal UBE3A silencing. Sci. Rep. 2016, 6, 30792. [Google Scholar] [CrossRef]
- Panov, J.; Kaphzan, H. Bioinformatics analyses show dysregulation of calcium-related genes in Angelman syndrome mouse model. Neurobiol. Dis. 2021, 148, 105180. [Google Scholar] [CrossRef]
- Iwamoto, K.; Bundo, M.; Ueda, J.; Oldham, M.C.; Ukai, W.; Hashimoto, E.; Saito, T.; Geschwind, D.H.; Kato, T. Neurons show distinctive DNA methylation profile and higher interindividual variations compared with non-neurons. Genome Res. 2011, 21, 688–696. [Google Scholar] [CrossRef]
- Lister, R.; Mukamel, E.A.; Nery, J.R.; Urich, M.; Puddifoot, C.A.; Johnson, N.D.; Lucero, J.; Huang, Y.; Dwork, A.J.; Schultz, M.D.; et al. Global epigenomic reconfiguration during mammalian brain development. Science 2013, 341, 1237905. [Google Scholar] [CrossRef]
- Angermueller, C.; Clark, S.J.; Lee, H.J.; Macaulay, I.C.; Teng, M.J.; Hu, T.X.; Krueger, F.; Smallwood, S.A.; Ponting, C.P.; Voet, T.; et al. Parallel single-cell sequencing links transcriptional and epigenetic heterogeneity. Nat. Methods 2016, 13, 229–232. [Google Scholar] [CrossRef]
- He, S.; Wang, L.H.; Liu, Y.; Li, Y.Q.; Chen, H.T.; Xu, J.H.; Peng, W.; Lin, G.W.; Wei, P.P.; Li, B.; et al. Single-cell transcriptome profiling of an adult human cell atlas of 15 major organs. Genome Biol. 2020, 21, 294. [Google Scholar] [CrossRef]
- Miwa, J.M. Lynx1 prototoxins: Critical accessory proteins of neuronal nicotinic acetylcholine receptors. Curr. Opin. Pharmacol. 2021, 56, 46–51. [Google Scholar] [CrossRef] [PubMed]
- Zhao, S.; Wang, H. Eva1a plays an important role by regulating autophagy in physiological and pathological processes. Int. J. Mol. Sci. 2021, 22, 6181. [Google Scholar] [CrossRef] [PubMed]
- Zhong, L.; Zhou, J.; Chen, X.; Liu, J.; Liu, Z.; Chen, Y.; Bai, Y. Quantitative proteomics reveals EVA1A-related proteins involved in neuronal differentiation. Proteomics 2017, 17, 1600294. [Google Scholar] [CrossRef]
- Li, M.; Lu, G.; Hu, J.; Shen, X.; Ju, J.; Gao, Y.; Qu, L.; Xia, Y.; Chen, Y.; Bai, Y. EVA1A/TMEM166 Regulates Embryonic Neurogenesis by Autophagy. Stem Cell Rep. 2016, 6, 396–410. [Google Scholar] [CrossRef] [PubMed]
- Marchese, A.; Docherty, J.M.; Nguyen, T.; Heiber, M.; Cheng, R.; Heng, H.H.Q.; Tsui, L.C.; Shi, X.; George, S.R.; O’Dowd, B.F. Cloning of Human Genes Encoding Novel G Protein-Coupled Receptors. Genomics 1994, 23, 609–618. [Google Scholar] [CrossRef]
- Li, R.; Ma, C.; Xiong, Y.; Zhao, H.; Yang, Y.; Xue, L.; Wang, B.; Xiao, T.; Chen, J.; Lei, X.; et al. An antagonistic peptide of gpr1 ameliorates lps-induced depression through the hypothalamic-pituitary-ovarian axis. Biomolecules 2021, 11, 857. [Google Scholar] [CrossRef]
- Petroff, O.A.C. GABA and glutamate in the human brain. Neuroscientist 2002, 8, 562–573. [Google Scholar] [CrossRef]
- Fatemi, S.H.; Reutiman, T.J.; Folsom, T.D.; Thuras, P.D. GABAA receptor downregulation in brains of subjects with autism. J. Autism Dev. Disord. 2009, 39, 223–230. [Google Scholar] [CrossRef]
- Engin, E.; Liu, J.; Rudolph, U. α2-containing GABAA receptors: A target for the development of novel treatment strategies for CNS disorders. Pharmacol. Ther. 2012, 136, 142–152. [Google Scholar] [CrossRef]
- Galyamina, A.G.; Kovalenko, I.L.; Smagin, D.A.; Kudryavtseva, N.N. Changes in the Expression of Neurotransmitter System Genes in the Ventral Tegmental Area in Depressed Mice: RNA-SEQ Data. Neurosci. Behav. Physiol. 2018, 48, 591–602. [Google Scholar] [CrossRef]
- Agrawal, J.; Dwivedi, Y. GABAA Receptor Subunit Transcriptional Regulation, Expression Organization, and Mediated Calmodulin Signaling in Prefrontal Cortex of Rats Showing Testosterone-Mediated Impulsive Behavior. Front. Neurosci. 2020, 14, 600099. [Google Scholar] [CrossRef] [PubMed]
- Yu, N.K.; Baek, S.H.; Kaang, B.K. DNA methylation-mediated control of learning and memory. Mol. Brain 2011, 4, 5. [Google Scholar] [CrossRef] [PubMed]
- Day, J.J.; Sweatt, J.D. DNA methylation and memory formation. Nat. Neurosci. 2010, 13, 1319–1323. [Google Scholar] [CrossRef] [PubMed]
- Jeong, H.; Mendizabal, I.; Berto, S.; Chatterjee, P.; Layman, T.; Usui, N.; Toriumi, K.; Douglas, C.; Singh, D.; Huh, I.; et al. Evolution of DNA methylation in the human brain. Nat. Commun. 2021, 12, 2021. [Google Scholar] [CrossRef] [PubMed]
- Illingworth, R.S.; Gruenewald-Schneider, U.; De Sousa, D.; Webb, S.; Merusi, C.; Kerr, A.R.W.; James, K.D.; Smith, C.; Walker, R.; Andrews, R.; et al. Inter-individual variability contrasts with regional homogeneity in the human brain DNA methylome. Nucleic Acids Res. 2015, 43, 732–744. [Google Scholar] [CrossRef] [PubMed]
- Davies, M.N.; Volta, M.; Pidsley, R.; Lunnon, K.; Dixit, A.; Lovestone, S.; Coarfa, C.; Harris, R.A.; Milosavljevic, A.; Troakes, C.; et al. Functional annotation of the human brain methylome identifies tissue-specific epigenetic variation across brain and blood. Genome Biol. 2012, 13, R43. [Google Scholar] [CrossRef]
- Rizzardi, L.F.; Hickey, P.F.; Rodriguez DiBlasi, V.; Tryggvadóttir, R.; Callahan, C.M.; Idrizi, A.; Hansen, K.D.; Feinberg, A.P. Neuronal brain-region-specific DNA methylation and chromatin accessibility are associated with neuropsychiatric trait heritability. Nat. Neurosci. 2019, 22, 307–316. [Google Scholar] [CrossRef]
- Pries, L.K.; Gülöksüz, S.; Kenis, G. DNA methylation in schizophrenia. In Advances in Experimental Medicine and Biology; Springer New York LLC: New York, NY, USA, 2017; Volume 978, pp. 211–236. [Google Scholar]
- Wei, X.; Zhang, L.; Zeng, Y. DNA methylation in Alzheimer’s disease: In brain and peripheral blood. Mech. Ageing Dev. 2020, 191, 111319. [Google Scholar] [CrossRef] [PubMed]
- Li, M.; D’Arcy, C.; Li, X.; Zhang, T.; Joober, R.; Meng, X. What do DNA methylation studies tell us about depression? A systematic review. Transl. Psychiatry 2019, 9, 68. [Google Scholar] [CrossRef] [PubMed]
- Wilson, A.S.; Power, B.E.; Molloy, P.L. DNA hypomethylation and human diseases. Biochim. Biophys. Acta Rev. Cancer 2007, 1775, 138–162. [Google Scholar] [CrossRef]
- Pérez, R.F.; Tejedor, J.R.; Bayón, G.F.; Fernández, A.F.; Fraga, M.F. Distinct chromatin signatures of DNA hypomethylation in aging and cancer. Aging Cell 2018, 17, e12744. [Google Scholar] [CrossRef]
- Lizarraga, S.B.; Morrow, E.M. Uncovering a Role for SK2 in Angelman Syndrome. Cell Rep. 2015, 12, 359–360. [Google Scholar] [CrossRef] [PubMed]
- Sun, J.; Zhu, G.; Liu, Y.; Standley, S.; Ji, A.; Tunuguntla, R.; Wang, Y.; Claus, C.; Luo, Y.; Baudry, M.; et al. UBE3A Regulates Synaptic Plasticity and Learning and Memory by Controlling SK2 Channel Endocytosis. Cell Rep. 2015, 12, 449–461. [Google Scholar] [CrossRef]
- Kennedy, A.J.; Rahn, E.J.; Paulukaitis, B.S.; Savell, K.E.; Kordasiewicz, H.B.; Wang, J.; Lewis, J.W.; Posey, J.; Strange, S.K.; Guzman-Karlsson, M.C.; et al. Tcf4 Regulates Synaptic Plasticity, DNA Methylation, and Memory Function. Cell Rep. 2016, 16, 2666–2685. [Google Scholar] [CrossRef] [PubMed]
- van Gastel, J.; Boddaert, J.; Jushaj, A.; Premont, R.T.; Luttrell, L.M.; Janssens, J.; Martin, B.; Maudsley, S. GIT2—A keystone in ageing and age-related disease. Ageing Res. Rev. 2018, 43, 46–63. [Google Scholar] [CrossRef]
- Maggiolini, F.A.M.; Mercuri, L.; Antonacci, F.; Anaclerio, F.; Calabrese, F.M.; Lorusso, N.; L’Abbate, A.; Sorensen, M.; Giannuzzi, G.; Eichler, E.E.; et al. Evolutionary Dynamics of the POTE Gene Family in Human and Nonhuman Primates. Genes 2020, 11, 213. [Google Scholar] [CrossRef] [PubMed]
- Alette Bjørkum, A.; Carrasco Duran, A.; Frode, B.; Sinha Roy, D.; Rosendahl, K.; Birkeland, E.; Stuhr, L. Human blood serum proteome changes after 6 hours of sleep deprivation at night. Sleep Sci. Pract. 2021, 5, 14. [Google Scholar] [CrossRef]
- Sharma, A.; Albahrani, M.; Zhang, W.; Kufel, C.N.; James, S.R.; Odunsi, K.; Klinkebiel, D.; Karpf, A.R. Epigenetic activation of POTE genes in ovarian cancer. Epigenetics 2019, 14, 185–197. [Google Scholar] [CrossRef]
- Shpyleva, S.; Melnyk, S.; Pavliv, O.; Pogribny, I.; Jill James, S. Overexpression of LINE-1 Retrotransposons in Autism Brain. Mol. Neurobiol. 2018, 55, 1740–1749. [Google Scholar] [CrossRef] [PubMed]
- Suarez, N.A.; Macia, A.; Muotri, A.R. LINE-1 retrotransposons in healthy and diseased human brain. Dev. Neurobiol. 2018, 78, 434–455. [Google Scholar] [CrossRef] [PubMed]
- Díaz-Rodríguez, S.M.; López-López, D.; Herrero-Turrión, M.J.; Gómez-Nieto, R.; Canal-Alonso, A.; Lopéz, D.E. Inferior Colliculus Transcriptome After Status Epilepticus in the Genetically Audiogenic Seizure-Prone Hamster GASH/Sal. Front. Neurosci. 2020, 14, 508. [Google Scholar] [CrossRef] [PubMed]
- Zhang, Z.; Dawson, P.A.; Piper, M.; Simmons, D.G. Postnatal N-acetylcysteine administration rescues impaired social behaviors and neurogenesis in Slc13a4 haploinsufficient mice. EBioMedicine 2019, 43, 435–446. [Google Scholar] [CrossRef] [PubMed]
- Jiang, Y.h.; Armstrong, D.; Albrecht, U.; Atkins, C.M.; Noebels, J.L.; Eichele, G.; Sweatt, J.D.; Beaudet, A.L. Mutation of the Angelman ubiquitin ligase in mice causes increased cytoplasmic p53 and deficits of contextual learning and long-term potentiation. Neuron 1998, 21, 799–811. [Google Scholar] [CrossRef]
- Van Woerden, G.M.; Harris, K.D.; Hojjati, M.R.; Gustin, R.M.; Qiu, S.; De Avila Freire, R.; Jiang, Y.H.; Elgersma, Y.; Weeber, E.J.; Van Woerden, G.M.; et al. Rescue of neurological deficits in a mouse model for Angelman syndrome by reduction of αCaMKII inhibitory phosphorylation. Nat. Neurosci. 2007, 10, 280–282. [Google Scholar] [CrossRef] [PubMed]
- Kaphzan, H.; Hernandez, P.; Jung, J.I.; Cowansage, K.K.; Deinhardt, K.; Chao, M.V.; Abel, T.; Klann, E. Reversal of impaired hippocampal long-term potentiation and contextual fear memory deficits in angelman syndrome model mice by ErbB inhibitors. Biol. Psychiatry 2012, 72, 182–190. [Google Scholar] [CrossRef]
- Kaphzan, H.; Buffington, S.A.; Ramaraj, A.B.; Lingrel, J.B.; Rasband, M.N.; Santini, E.; Klann, E. Genetic reduction of the α1 Subunit of Na/K-ATPase corrects multiple hippocampal phenotypes in angelman syndrome. Cell Rep. 2013, 4, 405–412. [Google Scholar] [CrossRef] [PubMed]
- Rayi, P.R.; Koyavski, L.; Chakraborty, D.; Bagrov, A.; Kaphzan, H. α1-Na/K-ATPase inhibition rescues aberrant dendritic calcium dynamics and memory deficits in the hippocampus of an Angelman syndrome mouse model. Prog. Neurobiol. 2019, 182, 101676. [Google Scholar] [CrossRef] [PubMed]
- Zhao, J.; Dahle, D.; Zhou, Y.; Zhang, X.; Klibanski, A. Hypermethylation of the Promoter Region Is Associated with the Loss of MEG3 Gene Expression in Human Pituitary Tumors. J. Clin. Endocrinol. Metab. 2005, 90, 2179–2186. [Google Scholar] [CrossRef] [PubMed]
- Yi, J.; Chen, B.; Yao, X.; Lei, Y.; Ou, F.; Huang, F. Upregulation of the lncRNA MEG3 improves cognitive impairment, alleviates neuronal damage, and inhibits activation of astrocytes in hippocampus tissues in Alzheimer’s disease through inactivating the PI3K/Akt signaling pathway. J. Cell. Biochem. 2019, 120, 18053–18065. [Google Scholar] [CrossRef]
- Spadaro, P.A.; Flavell, C.R.; Widagdo, J.; Ratnu, V.S.; Troup, M.; Ragan, C.; Mattick, J.S.; Bredy, T.W. Long Noncoding RNA-Directed Epigenetic Regulation of Gene Expression Is Associated with Anxiety-like Behavior in Mice. Biol. Psychiatry 2015, 78, 848–859. [Google Scholar] [CrossRef] [PubMed]
- Graw, J. From eyeless to neurological diseases. Exp. Eye Res. 2015, 156, 5–9. [Google Scholar] [CrossRef][Green Version]
- Mezzena, R.; Masciullo, C.; Antonini, S.; Cremisi, F.; Scheffner, M.; Cecchini, M.; Tonazzini, I. Study of adhesion and migration dynamics in ubiquitin E3A ligase (UBE3A)-silenced SYSH5Y neuroblastoma cells by micro-structured surfaces. Nanotechnology 2021, 32, 025708. [Google Scholar] [CrossRef] [PubMed]
- Chamberlain, S.J.; Chen, P.F.; Ng, K.Y.; Bourgois-Rocha, F.; Lemtiri-Chlieh, F.; Levine, E.S.; Lalande, M. Induced pluripotent stem cell models of the genomic imprinting disorders Angelman and Prader-Willi syndromes. Proc. Natl. Acad. Sci. USA 2010, 107, 17668–17673. [Google Scholar] [CrossRef] [PubMed]
- Bolger, A.M.; Lohse, M.; Usadel, B. Trimmomatic: A flexible trimmer for Illumina sequence data. Bioinformatics 2014, 30, 2114–2120. [Google Scholar] [CrossRef] [PubMed]
- Kim, D.; Pertea, G.; Trapnell, C.; Pimentel, H.; Kelley, R.; Salzberg, S.L. TopHat2: Accurate alignment of transcriptomes in the presence of insertions, deletions and gene fusions. Genome Biol. 2013, 14, R36. [Google Scholar] [CrossRef] [PubMed]
- Robinson, M.D.; McCarthy, D.J.; Smyth, G.K. edgeR: A Bioconductor package for differential expression analysis of digital gene expression data. Bioinformatics 2010, 26, 139–140. [Google Scholar] [CrossRef]
- Otto, C.; Stadler, P.F.; Hoffmann, S. Fast and sensitive mapping of bisulfite-treated sequencing data. Bioinformatics 2012, 28, 1698–1704. [Google Scholar] [CrossRef] [PubMed]
- Li, K.; Zhang, S.; Song, X.; Weyrich, A.; Wang, Y.; Liu, X.; Wan, N.; Liu, J.; Lövy, M.; Cui, H.; et al. Genome evolution of blind subterranean mole rats: Adaptive peripatric versus sympatric speciation. Proc. Natl. Acad. Sci. USA 2020, 117, 32499–32508. [Google Scholar] [CrossRef]
- Ashburner, M.; Ball, C.A.; Blake, J.A.; Botstein, D.; Butler, H.; Cherry, J.M.; Davis, A.P.; Dolinski, K.; Dwight, S.S.; Eppig, J.T.; et al. Gene ontology: Tool for the unification of biology. Nat. Genet. 2000, 25, 25–29. [Google Scholar] [CrossRef]
- Huang, D.W.; Sherman, B.T.; Tan, Q.; Collins, J.R.; Alvord, W.G.; Roayaei, J.; Stephens, R.; Baseler, M.W.; Lane, H.C.; Lempicki, R.A. The DAVID Gene Functional Classification Tool: A novel biological module-centric algorithm to functionally analyze large gene lists. Genome Biol. 2007, 8, R183. [Google Scholar] [CrossRef]
- Sherman, B.T.; Hao, M.; Qiu, J.; Jiao, X.; Baseler, M.W.; Lane, H.C.; Imamichi, T.; Chang, W. DAVID: A web server for functional enrichment analysis and functional annotation of gene lists (2021 update). Nucleic Acids Res. 2022, 50, W216–W221. [Google Scholar] [CrossRef] [PubMed]
- Xie, Z.; Bailey, A.; Kuleshov, M.V.; Clarke, D.J.B.; Evangelista, J.E.; Jenkins, S.L.; Lachmann, A.; Wojciechowicz, M.L.; Kropiwnicki, E.; Jagodnik, K.M.; et al. Gene Set Knowledge Discovery with Enrichr. Curr. Protoc. 2021, 1, e90. [Google Scholar] [CrossRef] [PubMed]
- Kuleshov, M.V.; Jones, M.R.; Rouillard, A.D.; Fernandez, N.F.; DFuan, Q.; Wang, Z.; Koplev, S.; Jenkins, S.L.; Jagodnik, K.M.; Lachmann, A.; et al. Enrichr: A comprehensive gene set enrichment analysis web server 2016 update. Nucleic Acids Res. 2016, 44, W90–W97. [Google Scholar] [CrossRef] [PubMed]
Publisher’s Note: MDPI stays neutral with regard to jurisdictional claims in published maps and institutional affiliations. |
© 2022 by the authors. Licensee MDPI, Basel, Switzerland. This article is an open access article distributed under the terms and conditions of the Creative Commons Attribution (CC BY) license (https://creativecommons.org/licenses/by/4.0/).