
Contributions of Titin and Collagen to Passive Stress in Muscles from mdm Mice with a Small Deletion in Titin’s Molecular Spring

 ,
,  and
and 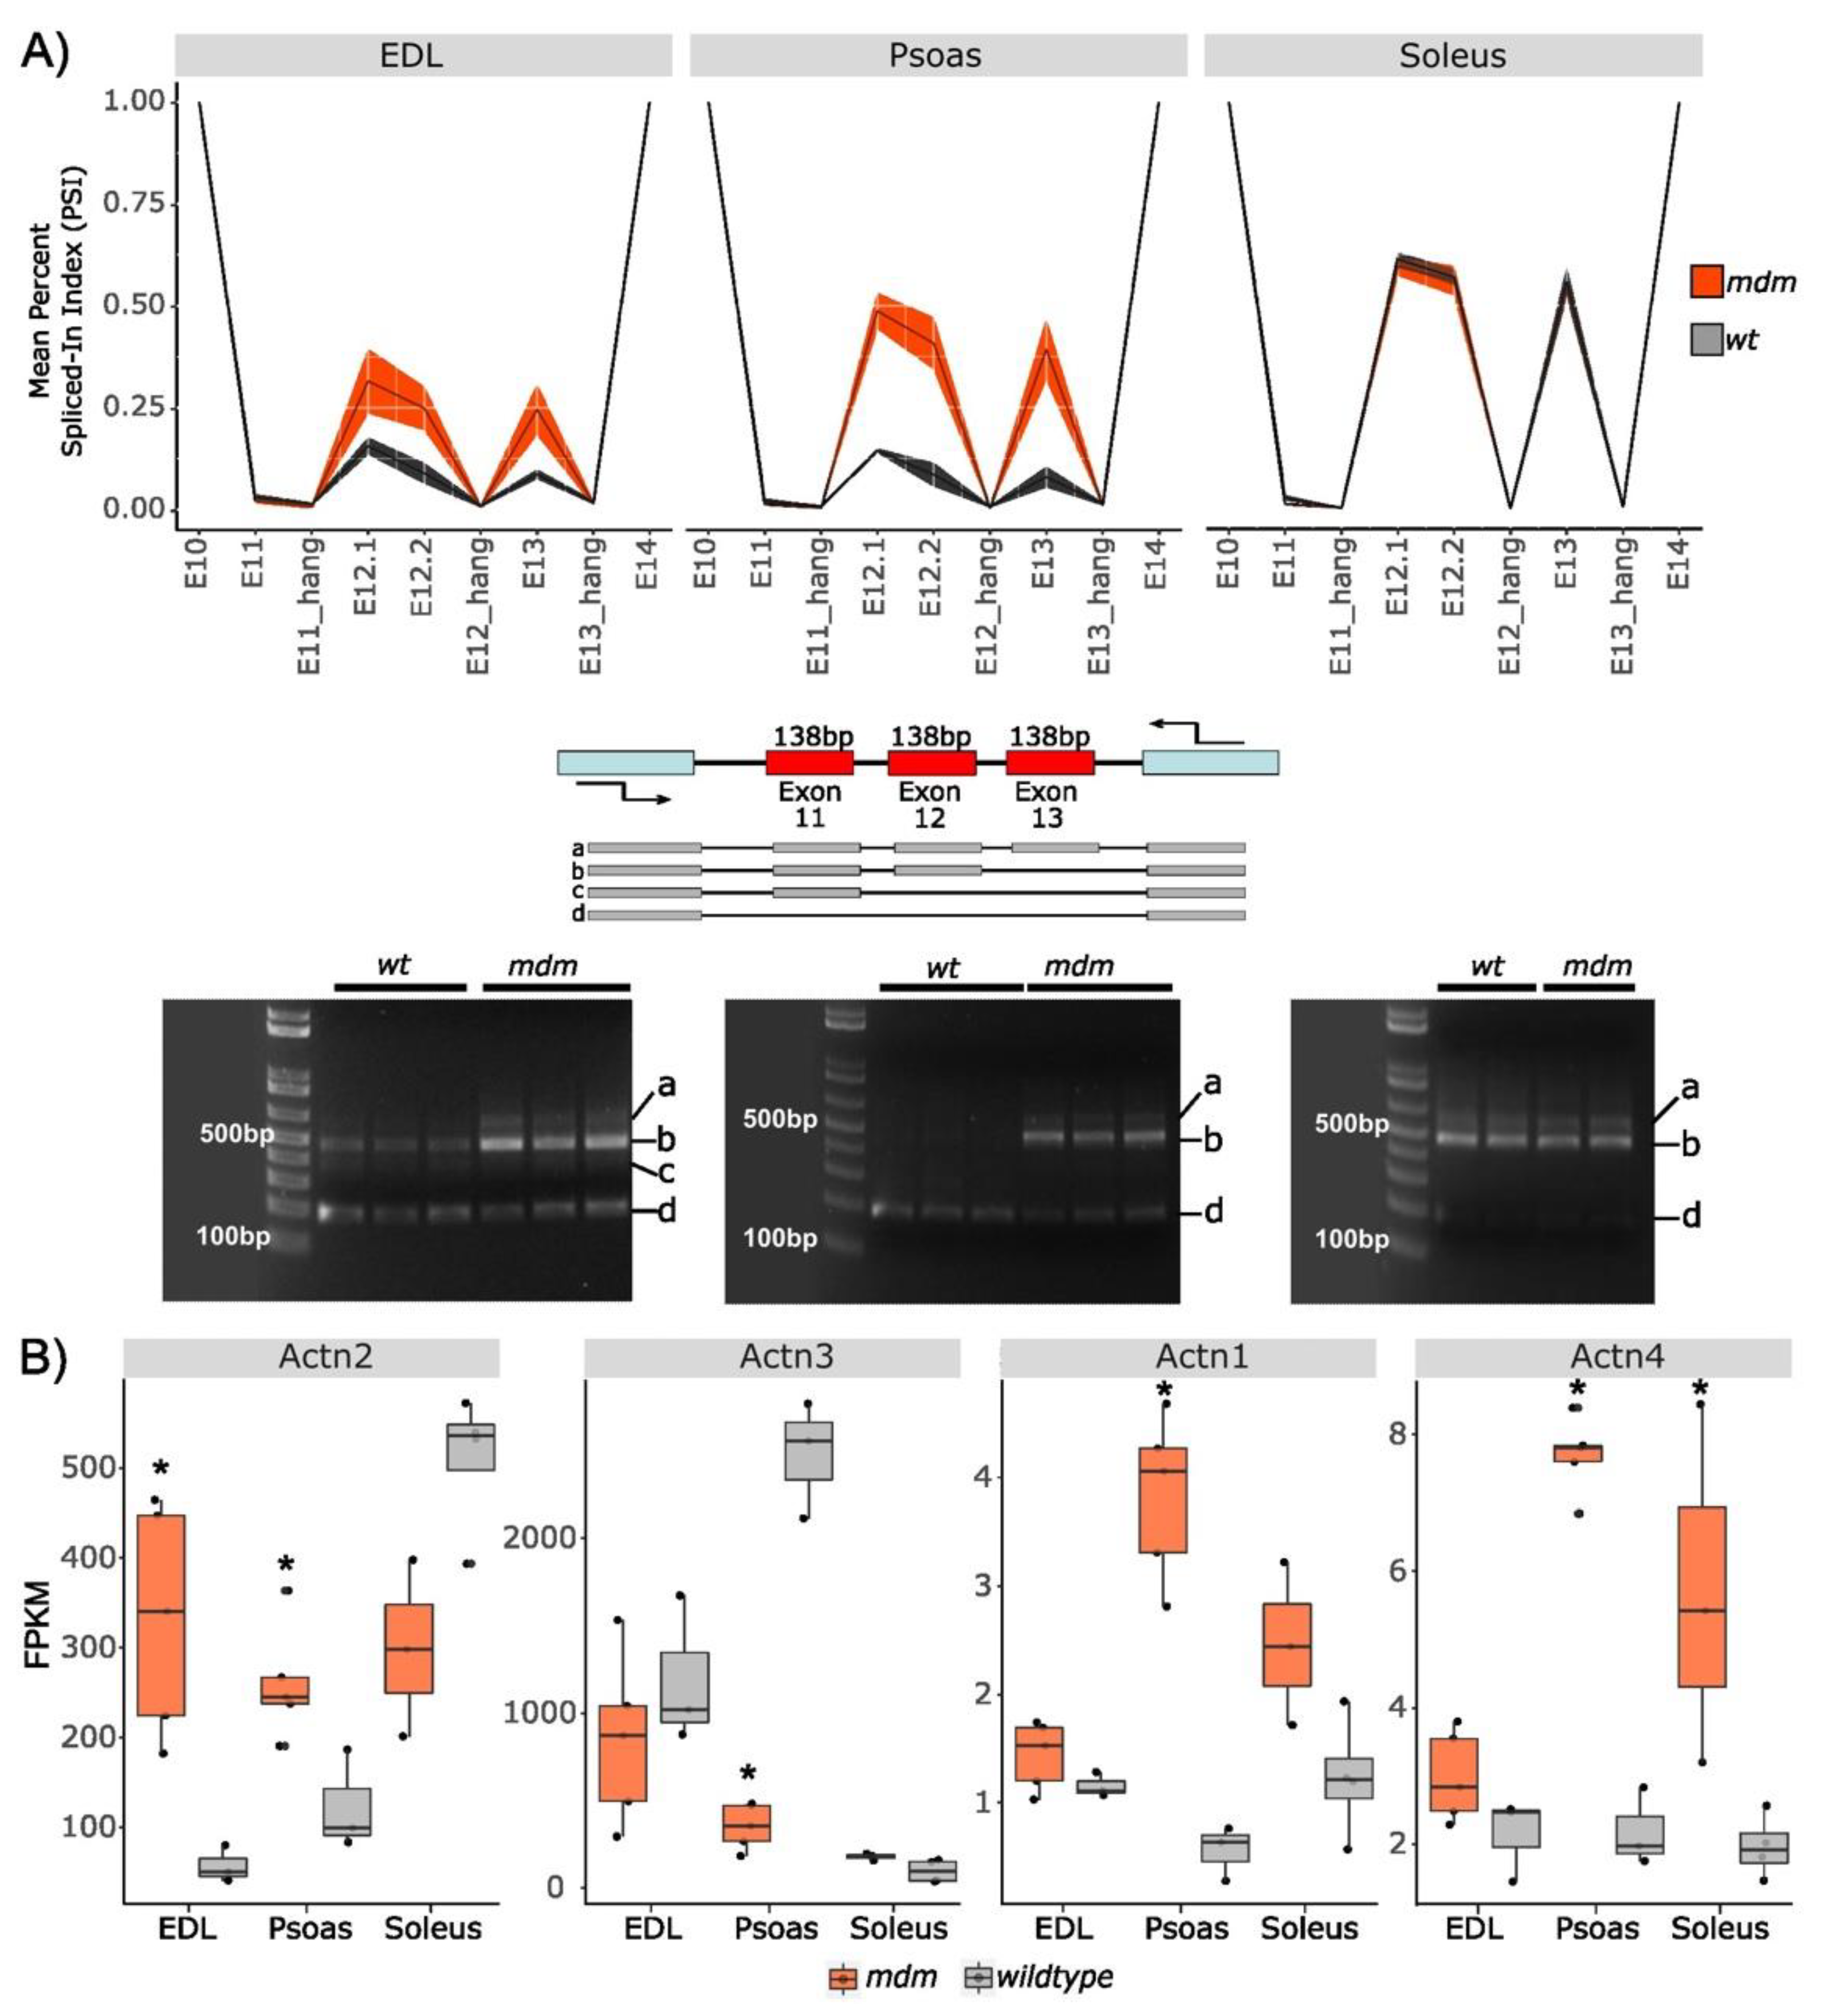
Abstract
1. Introduction
2. Results
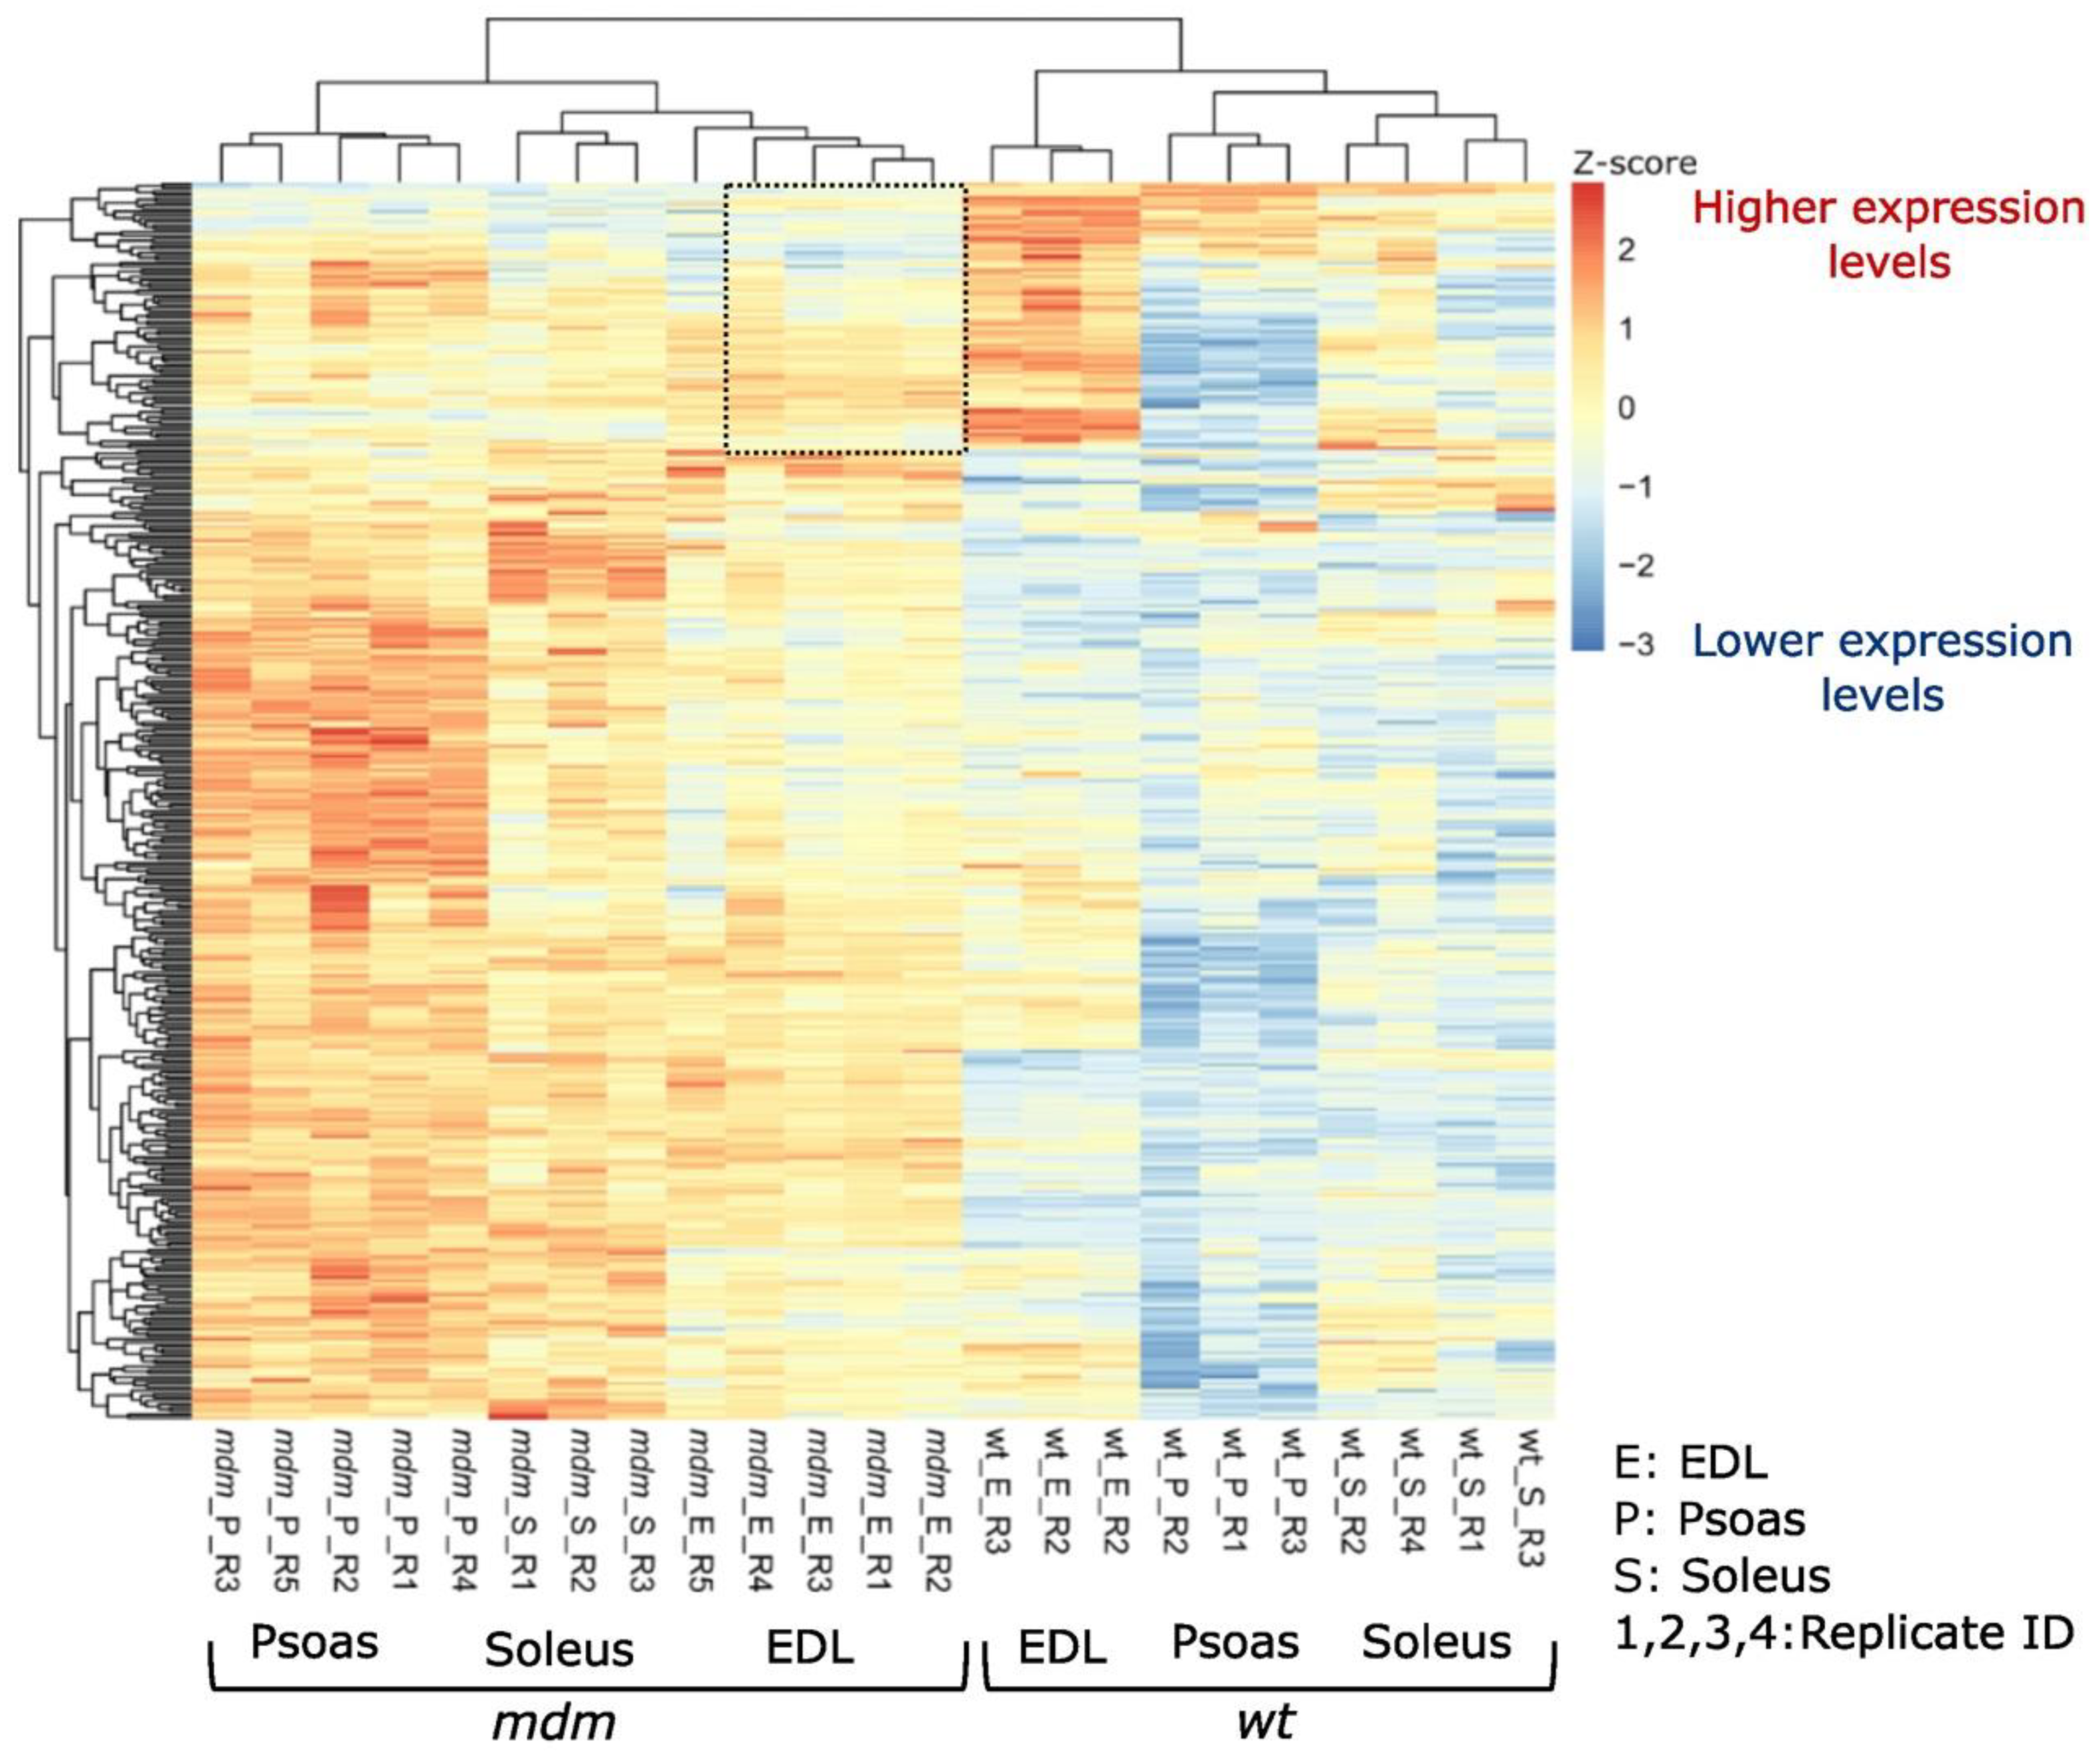
2.1. RNA Sequencing
2.1.1. Splicing in Z-Repeats
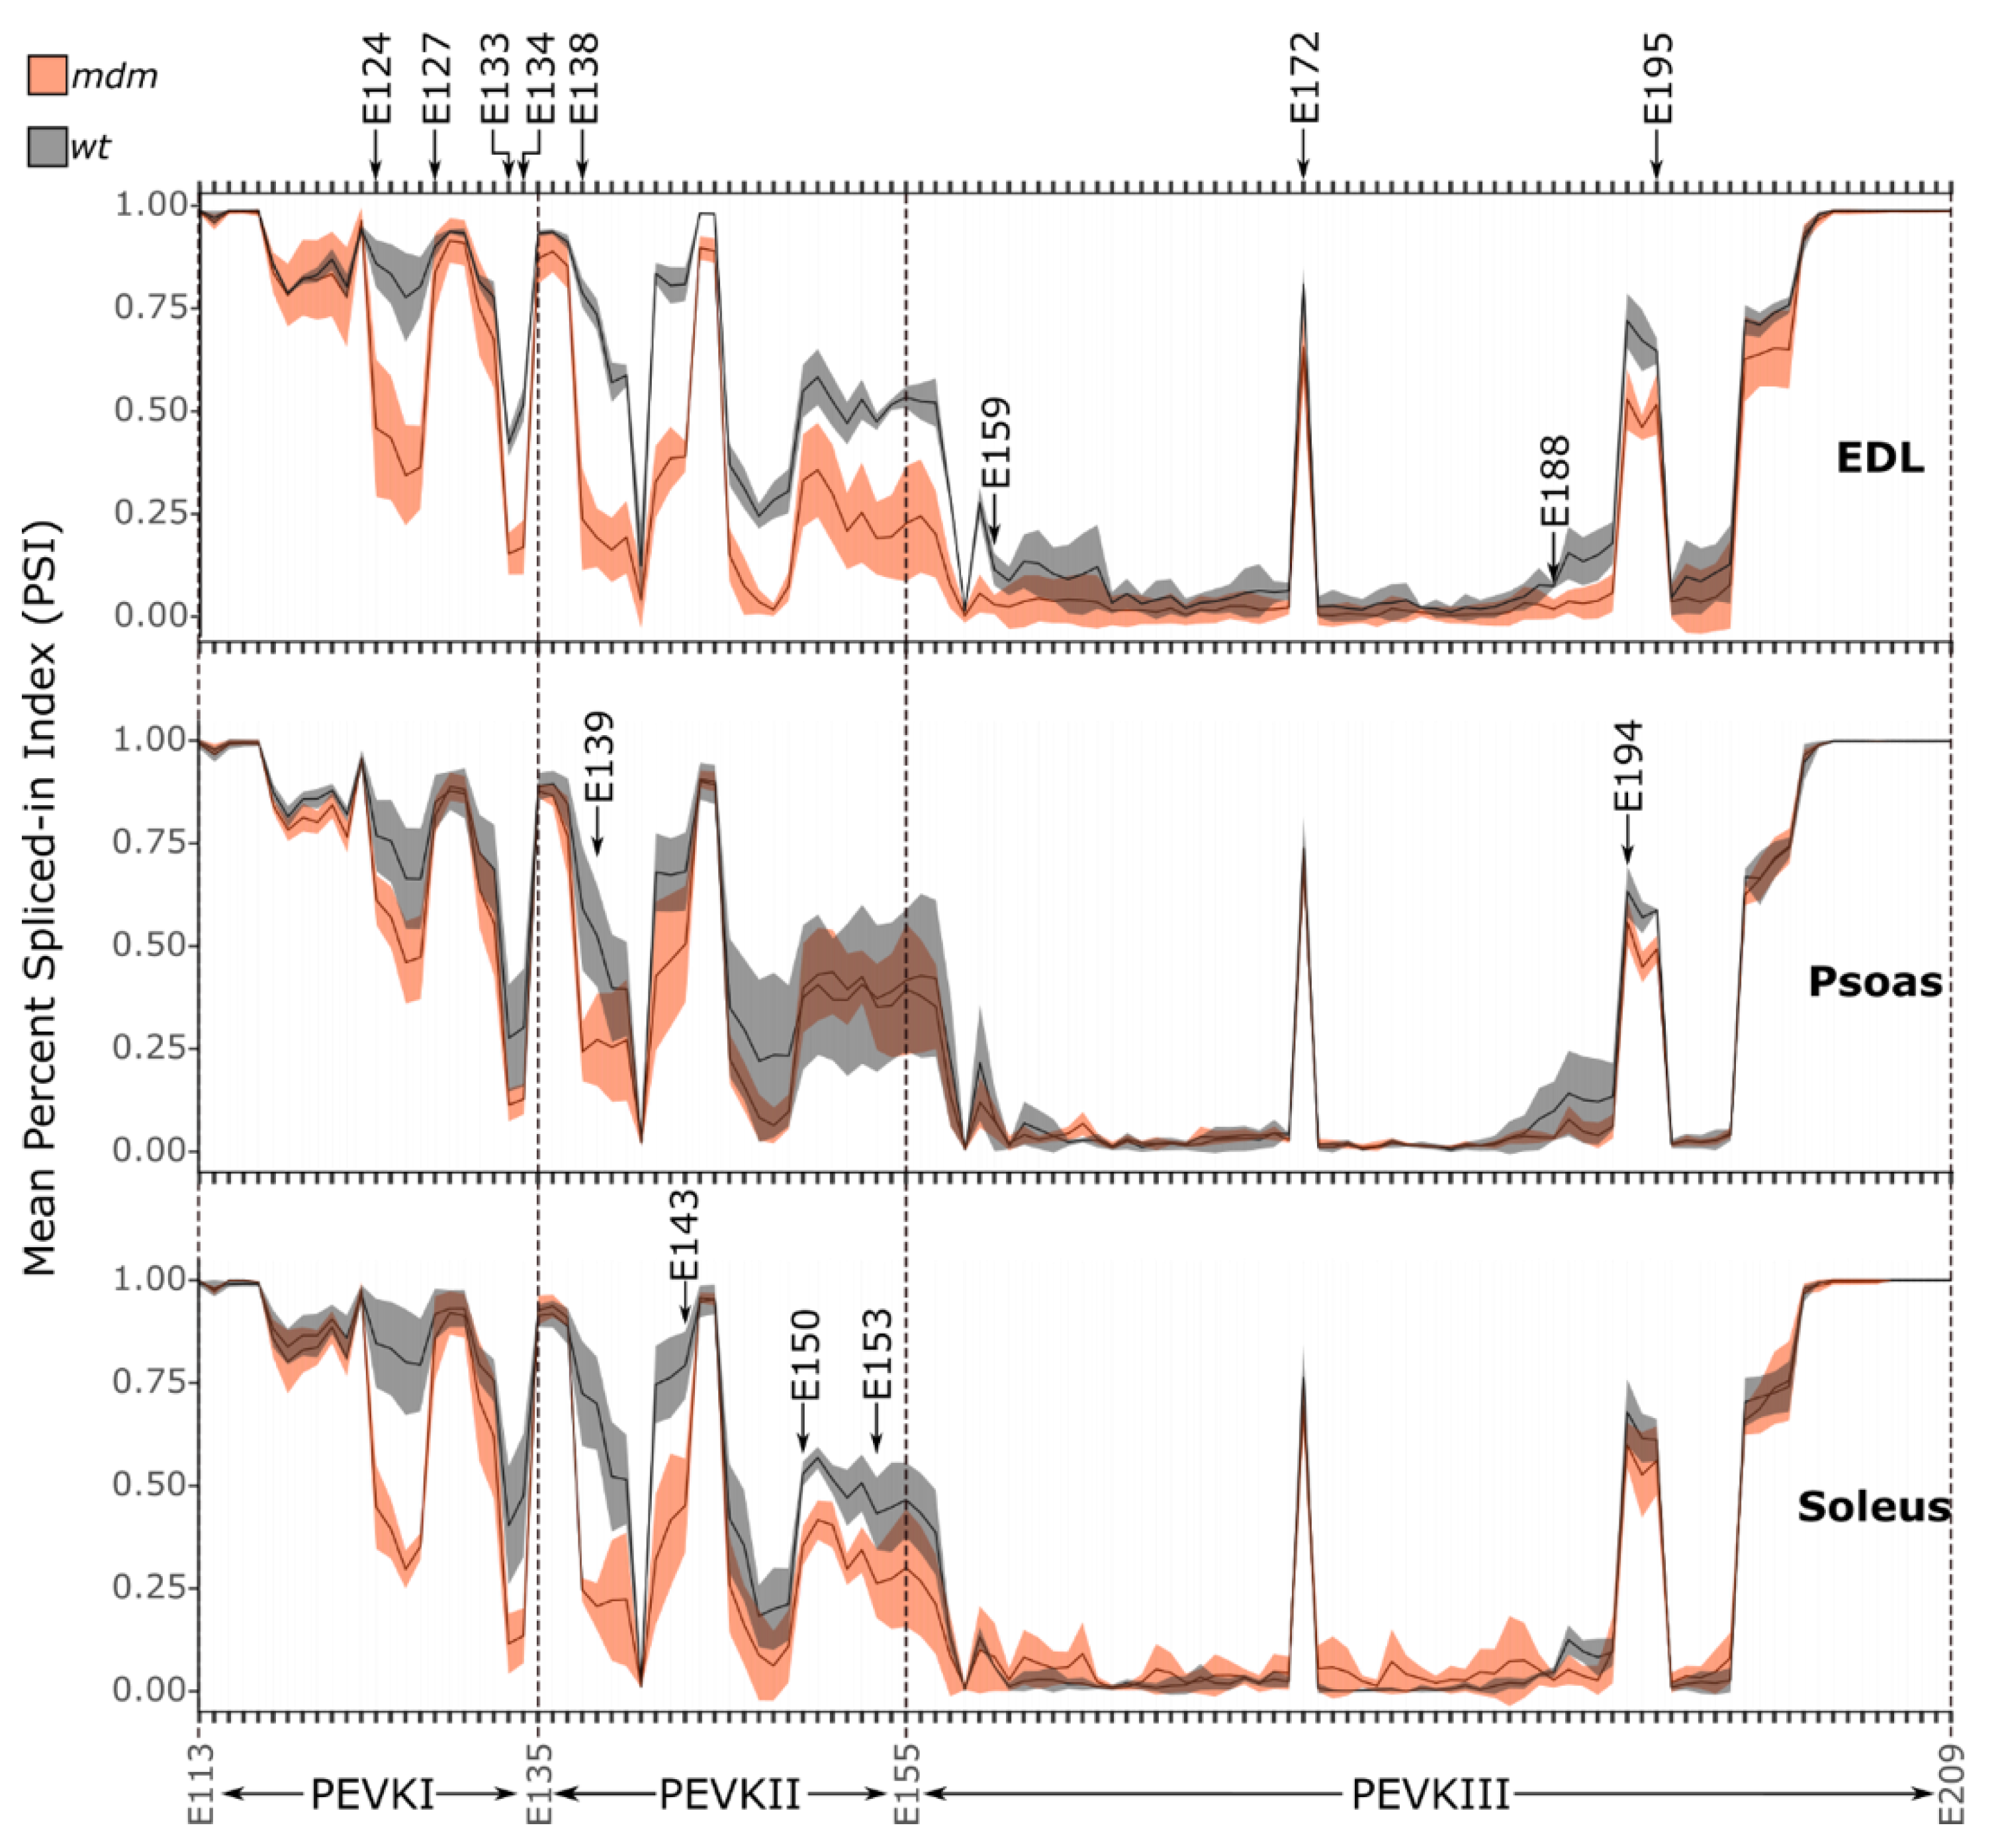
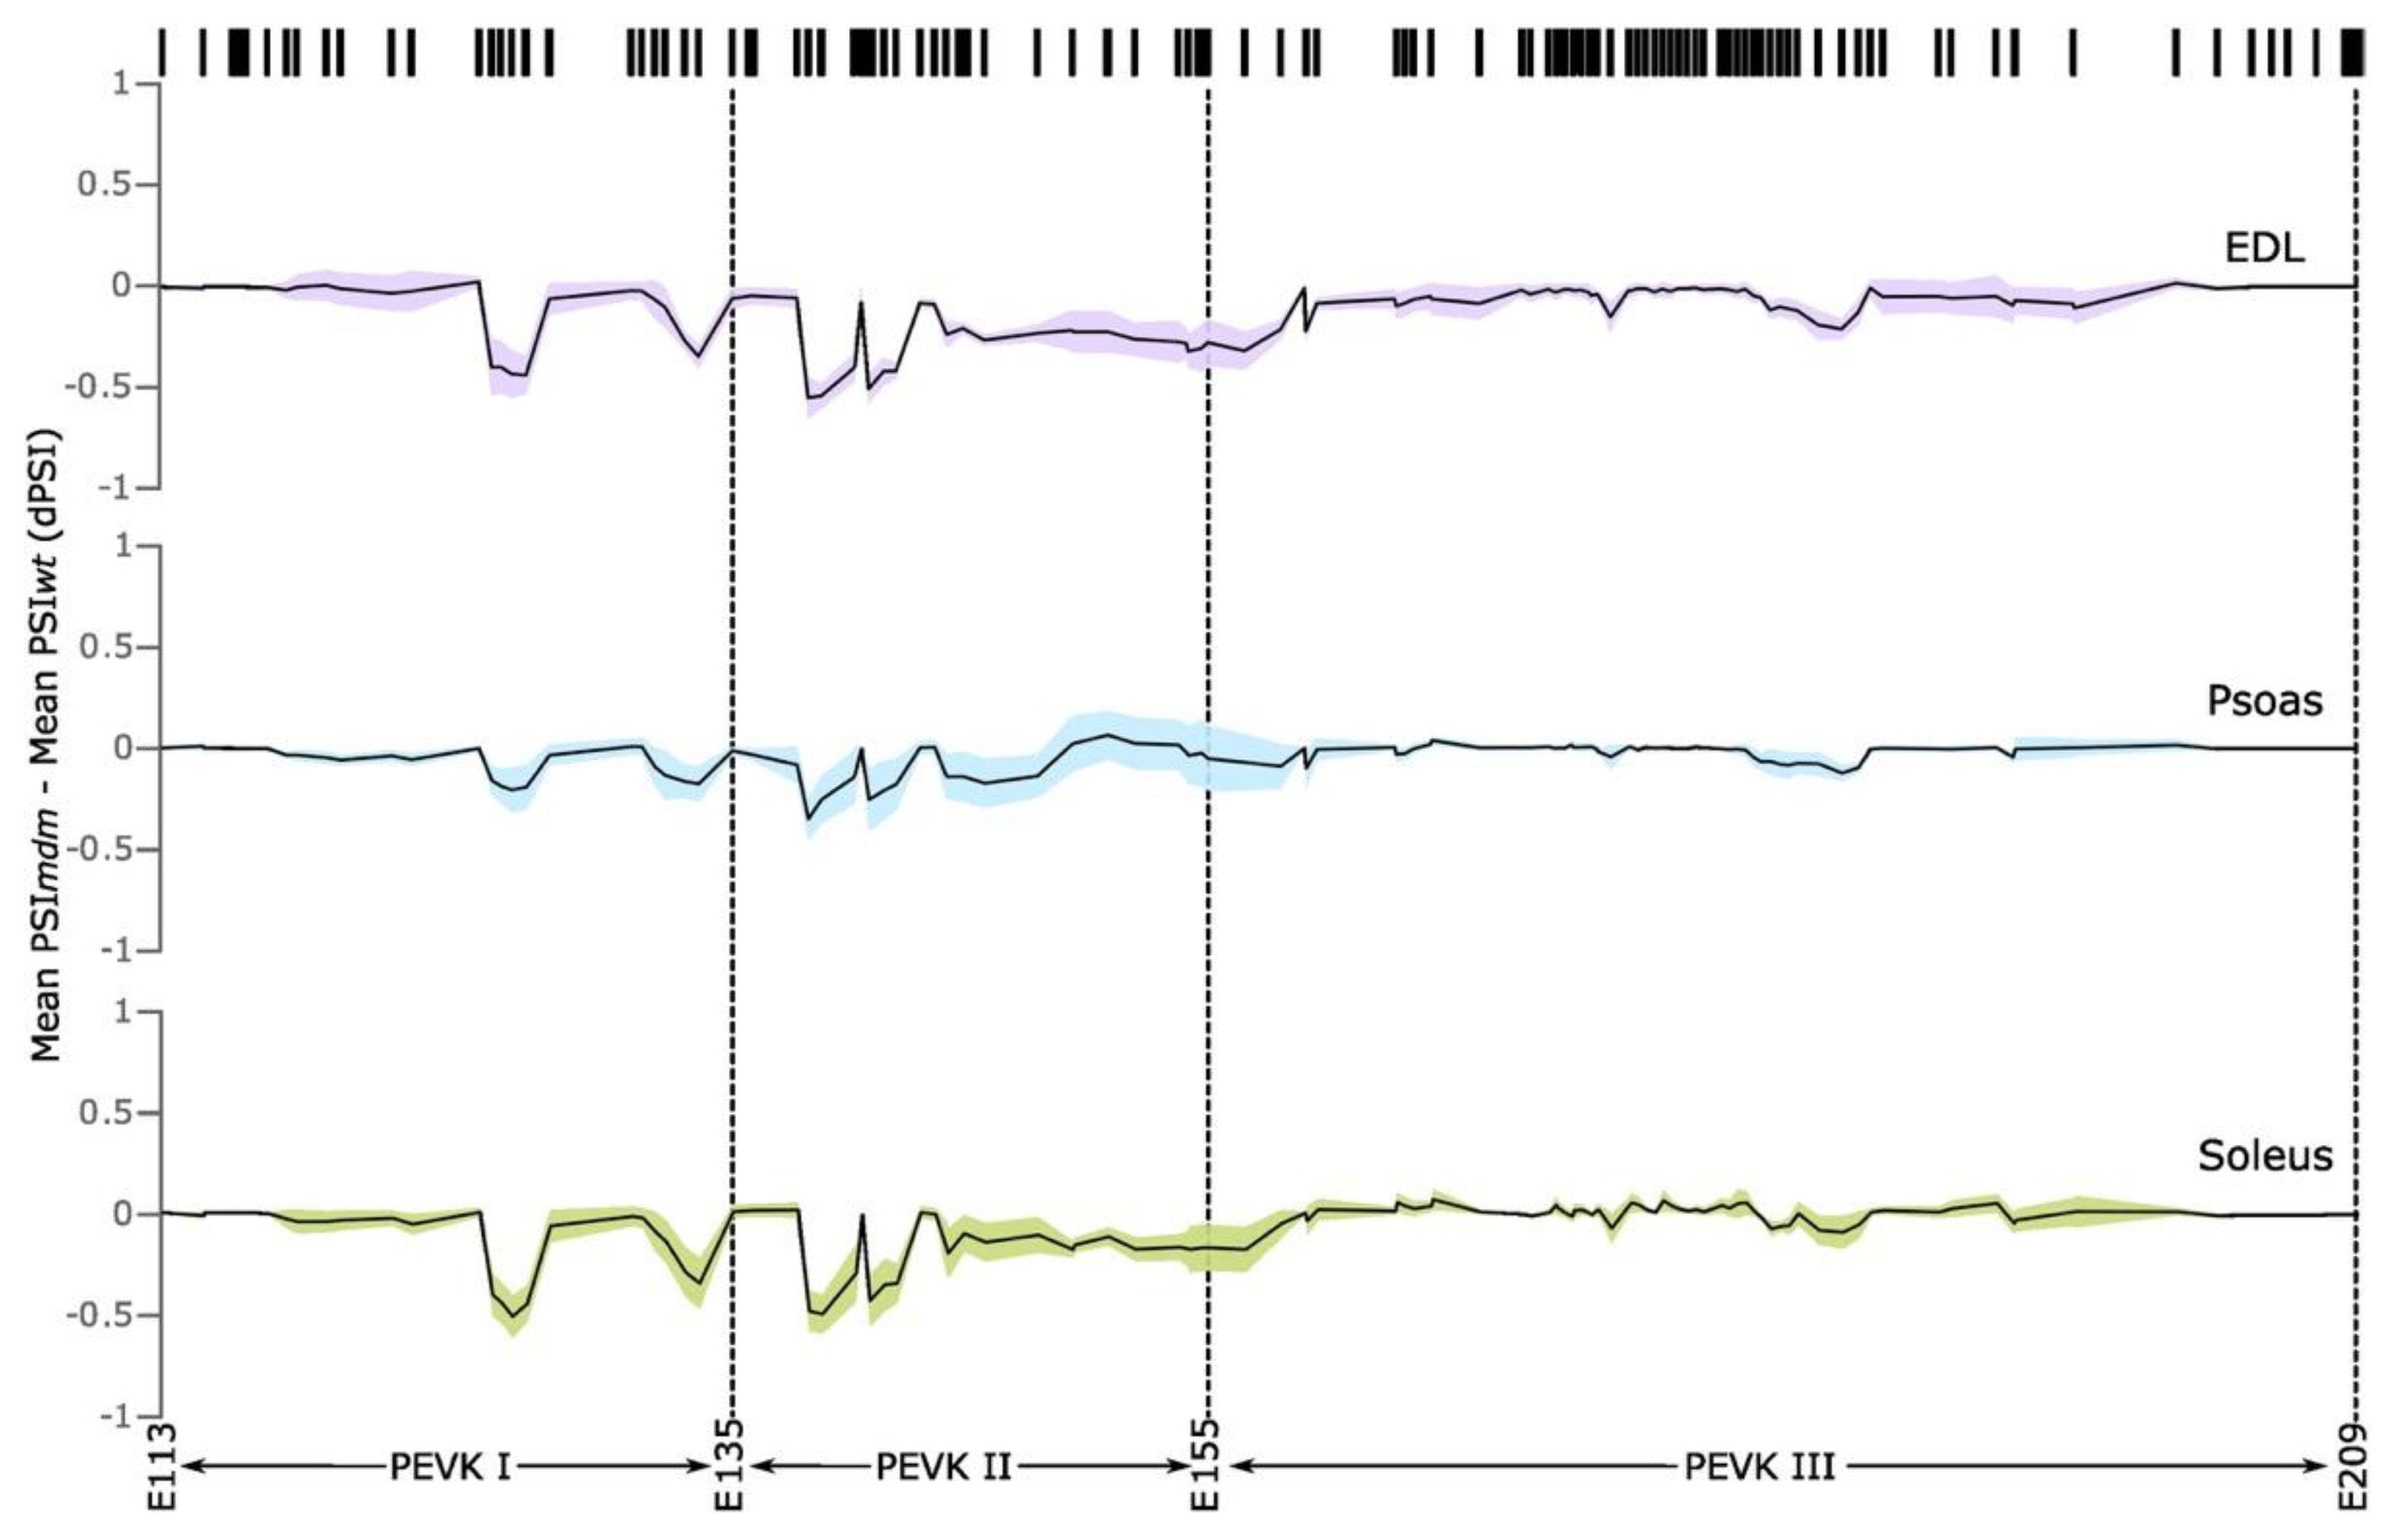
2.1.2. PEVK Splicing
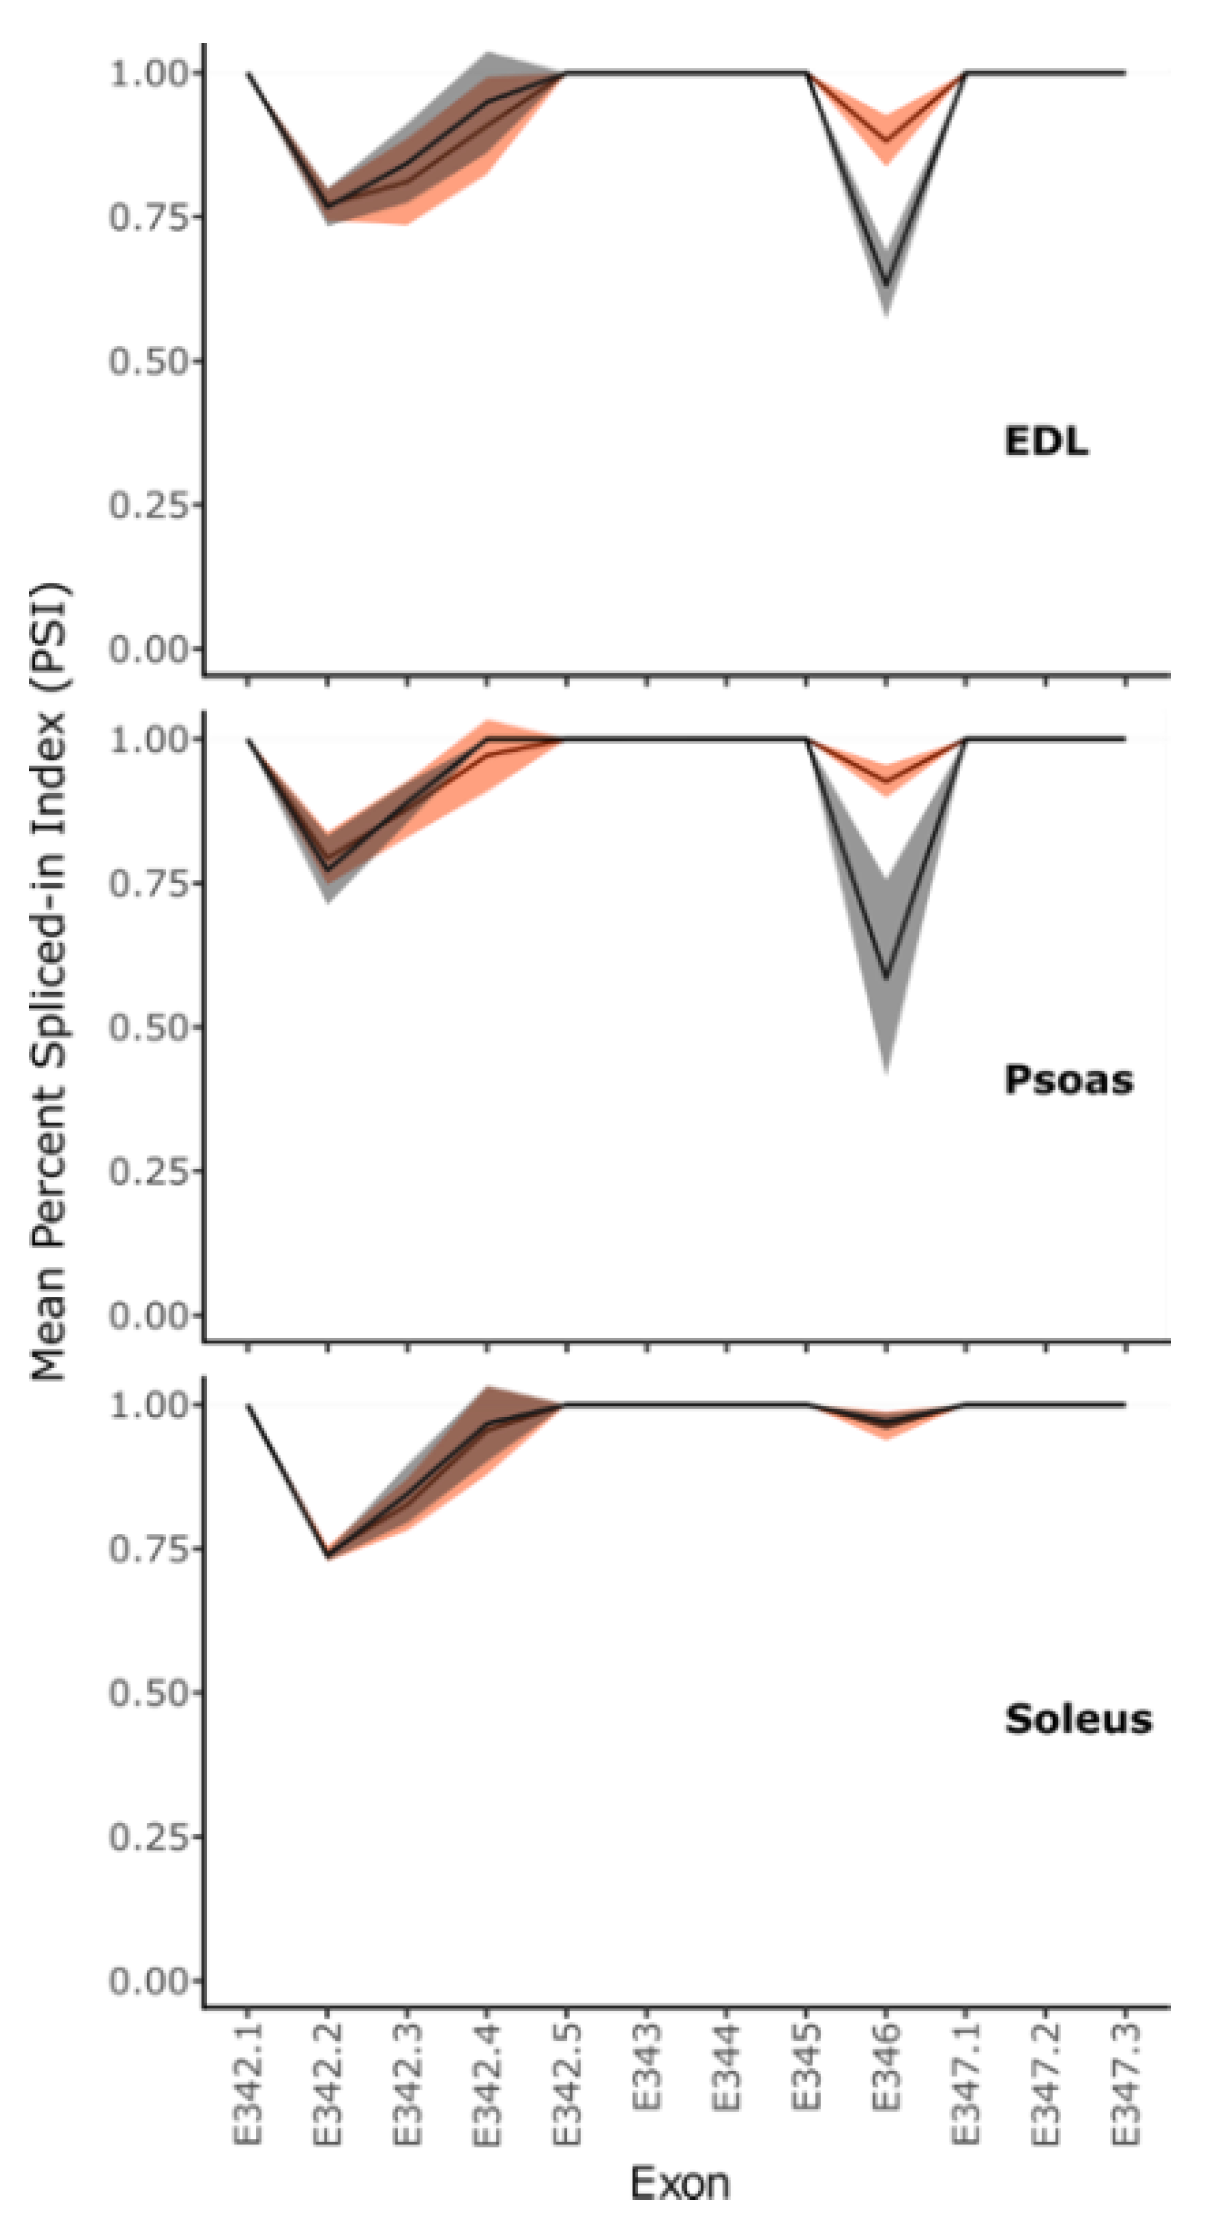
2.1.3. Titin C-Terminus Splicing
2.1.4. Extracellular Matrix/Collagen
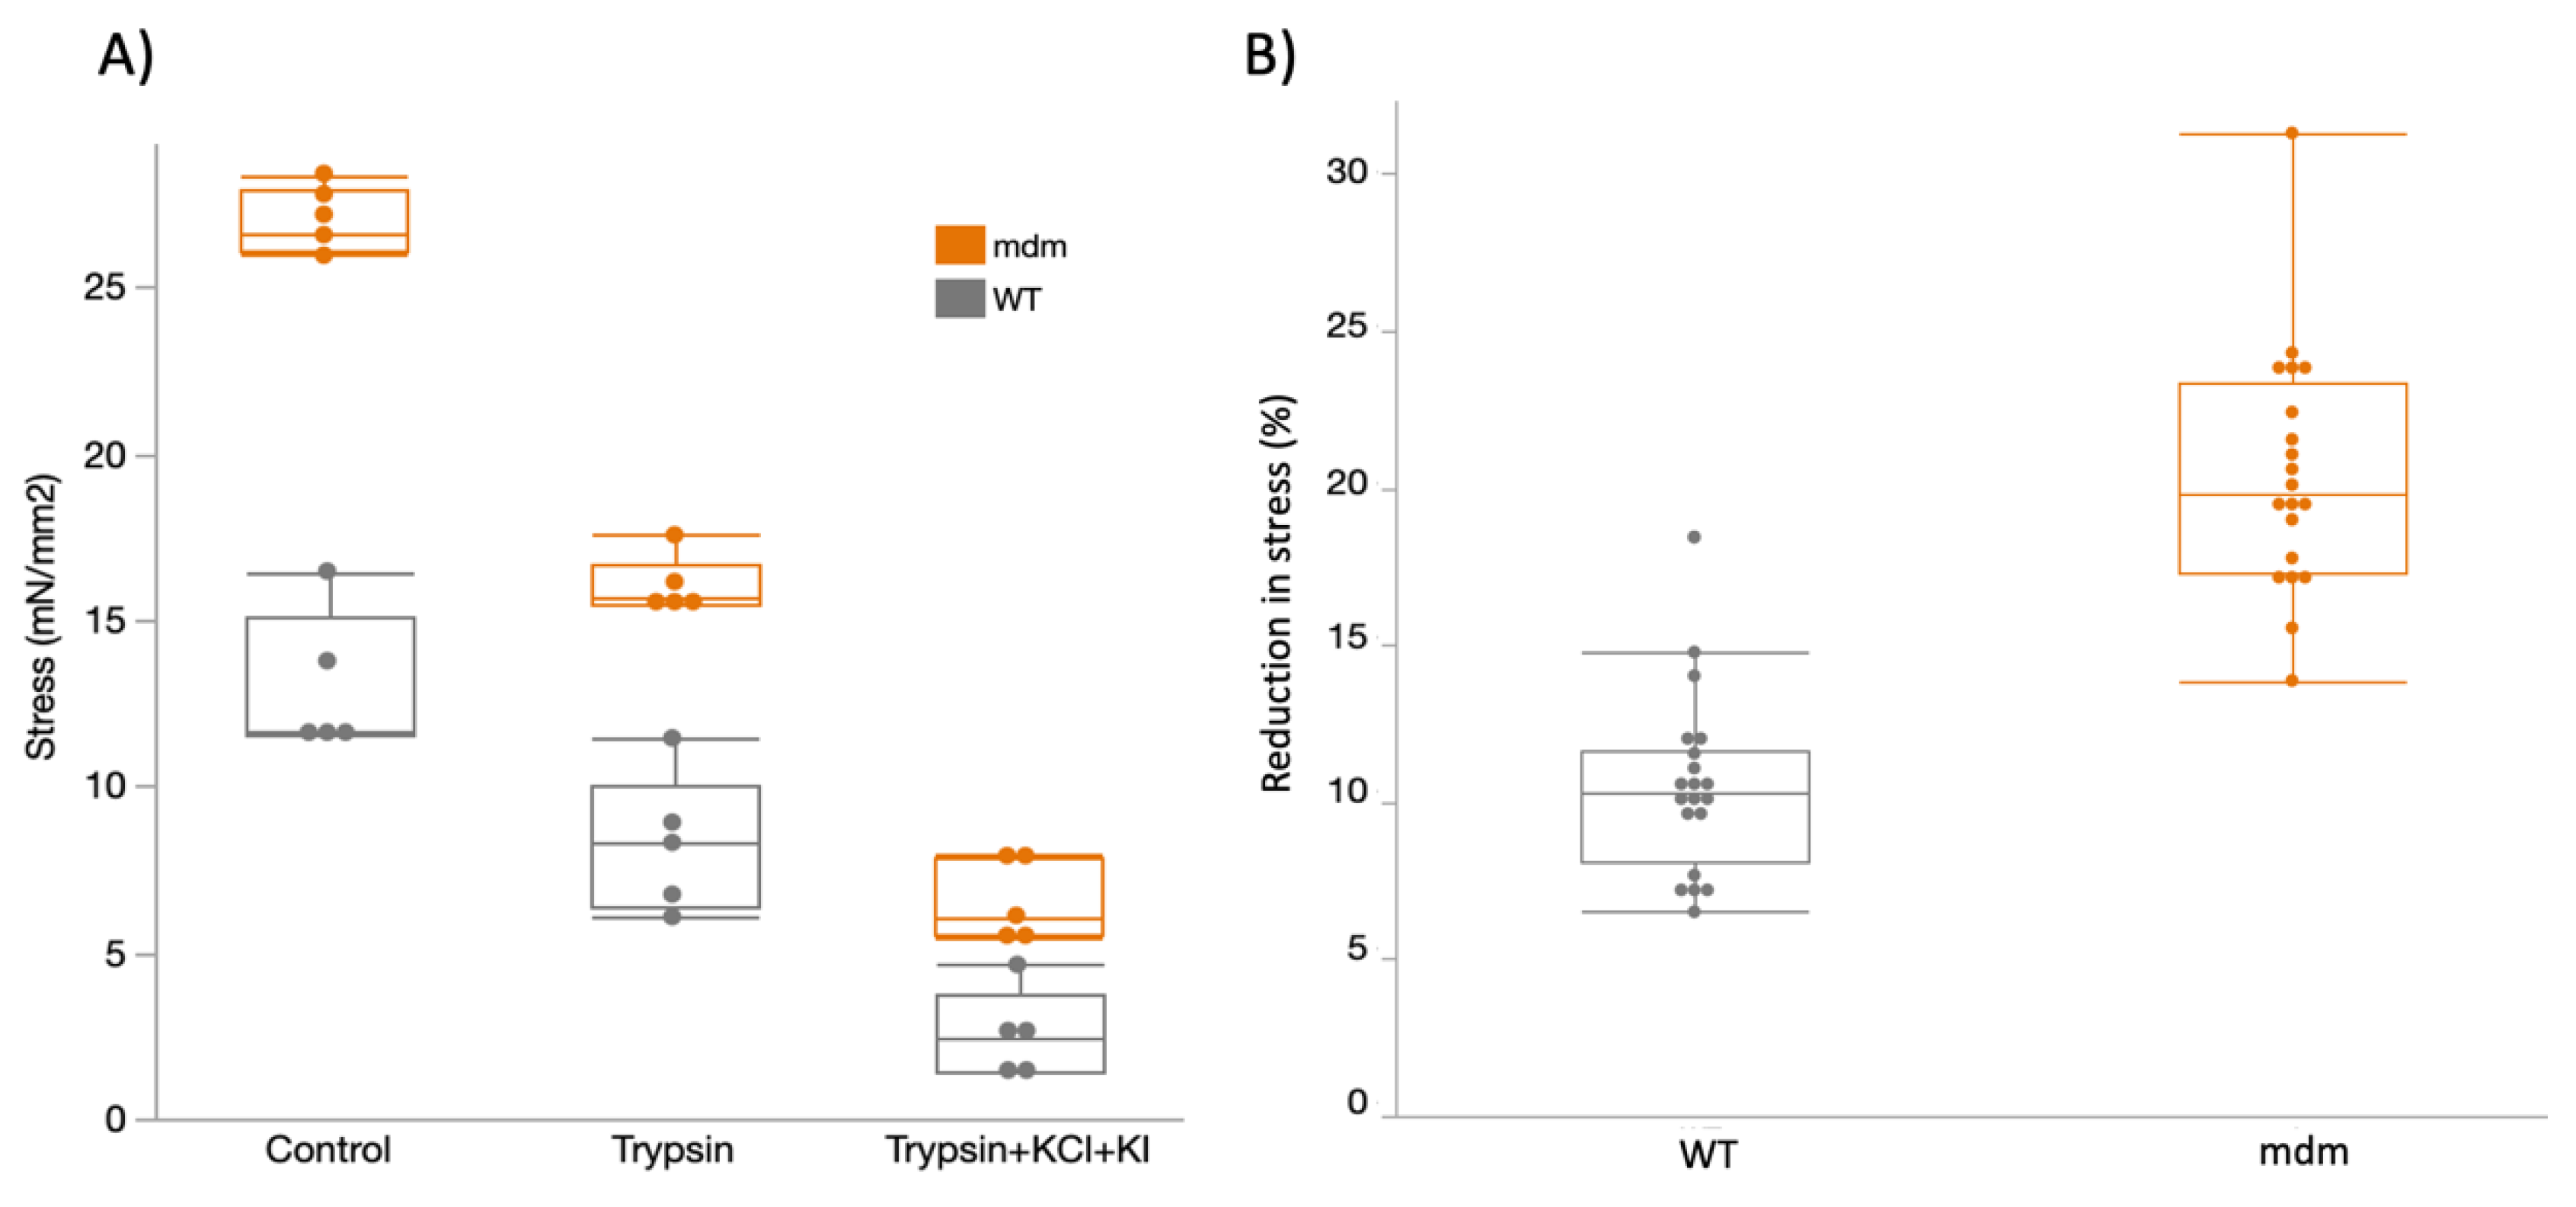
2.2. Mechanical Experiments
3. Discussion
4. Materials and Methods
4.1. RNA Sequencing
4.2. Mechanical Testing
Supplementary Materials
Author Contributions
Funding
Institutional Review Board Statement
Informed Consent Statement
Data Availability Statement
Acknowledgments
Conflicts of Interest
References
- Savarese, M.; Sarparanta, J.; Vihola, A.; Udd, B.; Hackman, P. Increasing Role of Titin Mutations in Neuromuscular Disorders. J. Neuromuscul. Dis. 2016, 3, 293–308. [Google Scholar] [CrossRef]
- Maruyama, K. Connectin, an elastic protein from myofibrils. J. Biochem. 1976, 80, 405–407. [Google Scholar] [CrossRef] [PubMed]
- Wang, K.; McClure, J.; Tu, A. Titin: Major myofibrillar components of striated muscle. Proc. Natl. Acad. Sci. USA 1979, 76, 3698–3702. [Google Scholar] [CrossRef] [PubMed]
- Labeit, S.; Barlow, D.P.; Gautel, M.; Gibson, T.; Holt, J.; Hsieh, C.L.; Francke, U.; Leonard, K.; Wardale, J.; Whiting, A.; et al. A regular pattern of two types of 100-residue motif in the sequence of titin. Nature 1990, 345, 273–276. [Google Scholar] [CrossRef] [PubMed]
- Guo, W.; Bharmal, S.J.; Esbona, K.; Greaser, M.L. Titin diversity—Alternative splicing gone wild. J. Biomed. Biotechnol. 2010, 2010, 753675. [Google Scholar] [CrossRef]
- Bang, M.L.; Centner, T.; Fornoff, F.; Geach, A.J.; Gotthardt, M.; McNabb, M.; Witt, C.C.; Labeit, D.; Gregorio, C.C.; Granzier, H.; et al. The complete gene sequence of titin, expression of an unusual approximately 700-kDa titin isoform, and its interaction with obscurin identify a novel Z-line to I-band linking system. Circ. Res. 2001, 89, 1065–1072. [Google Scholar] [CrossRef]
- Gautel, M.; Goulding, D. A molecular map of titin/connectin elasticity reveals two different mechanisms acting in series. Febs Lett. 1996, 385, 11–14. [Google Scholar] [CrossRef]
- Linke, W.A.; Ivemeyer, M.; Mundel, P.; Stockmeier, M.R.; Kolmerer, B. Nature of PEVK-titin elasticity in skeletal muscle. Proc. Natl. Acad. Sci. USA 1998, 95, 8052–8057. [Google Scholar] [CrossRef]
- Bartoo, M.L.; Linke, W.A.; Pollack, G.H. Basis of passive tension and stiffness in isolated rabbit myofibrils. Am. J. Physiol. 1997, 273, C266–C276. [Google Scholar] [CrossRef]
- Brynnel, A.; Hernandez, Y.; Kiss, B.; Lindqvist, J.; Adler, M.; Kolb, J.; Van der Pijl, R.; Gohlke, J.; Strom, J.; Smith, J.; et al. Downsizing the molecular spring of the giant protein titin reveals that skeletal muscle titin determines passive stiffness and drives longitudinal hypertrophy. Elife 2018, 7, e40532. [Google Scholar] [CrossRef]
- Granzier, H.L.; Labeit, S. The giant protein titin: A major player in myocardial mechanics, signaling, and disease. Circ. Res. 2004, 94, 284–295. [Google Scholar] [CrossRef] [PubMed]
- Wang, K.; McCarter, R.; Wright, J.; Beverly, J.; Ramirez-Mitchell, R. Viscoelasticity of the sarcomere matrix of skeletal muscles. The titin-myosin composite filament is a dual-stage molecular spring. Biophys. J. 1993, 64, 1161–1177. [Google Scholar] [CrossRef]
- Freiburg, A.; Trombitas, K.; Hell, W.; Cazorla, O.; Fougerousse, F.; Centner, T.; Kolmerer, B.; Witt, C.; Beckmann, J.S.; Gregorio, C.C.; et al. Series of exon-skipping events in the elastic spring region of titin as the structural basis for myofibrillar elastic diversity. Circ. Res. 2000, 86, 1114–1121. [Google Scholar] [CrossRef] [PubMed]
- Linke, W.A.; Ivemeyer, M.; Olivieri, N.; Kolmerer, B.; Rüegg, C.J.; Labeit, S. Towards a molecular understanding of the elasticity of titin. J. Mol. Biol. 1996, 261, 62–71. [Google Scholar] [CrossRef]
- Prado, L.G.; Makarenko, I.; Andresen, C.; Kruger, M.; Opitz, C.A.; Linke, W.A. Isoform diversity of giant proteins in relation to passive and active contractile properties of rabbit skeletal muscles. J. Gen. Physiol. 2005, 126, 461–480. [Google Scholar] [CrossRef]
- Neagoe, C.; Opitz, C.A.; Makarenko, I.; Linke, W.A. Gigantic variety: Expression patterns of titin isoforms in striated muscles and consequences for myofibrillar passive stiffness. J. Muscle Res. Cell Motil. 2003, 24, 175–189. [Google Scholar] [CrossRef]
- Buck, D.; Smith, J.E., III; Chung, C.S.; Ono, Y.; Sorimachi, H.; Labeit, S.; Granzier, H.L. Removal of immunoglobulin-like domains from titin’s spring segment alters titin splicing in mouse skeletal muscle and causes myopathy. J. Gen. Physiol. 2014, 143, 215–230. [Google Scholar] [CrossRef]
- Garvey, S.M.; Rajan, C.; Lerner, A.P.; Frankel, W.N.; Cox, G.A. The muscular dystrophy with myositis (mdm) mouse mutation disrupts a skeletal muscle-specific domain of titin. Genomics 2002, 79, 146–149. [Google Scholar] [CrossRef]
- Nishikawa, K.; Lindstedt, S.L.; Hessel, A.; Mishra, D. N2A Titin: Signaling Hub and Mechanical Switch in Skeletal Muscle. Int. J. Mol. Sci. 2020, 21, 3974. [Google Scholar] [CrossRef]
- Lopez, M.A.; Pardo, P.S.; Cox, G.A.; Boriek, A.M. Early mechanical dysfunction of the diaphragm in the muscular dystrophy with myositis (Ttnmdm) model. Am. J. Physiol. Cell Physiol. 2008, 295, C1092–C1102. [Google Scholar] [CrossRef]
- Powers, K.; Joumaa, V.; Jinha, A.; Moo, E.K.; Smith, I.C.; Nishikawa, K.; Herzog, W. Titin force enhancement following active stretch of skinned skeletal muscle fibres. J. Exp. Biol. 2017, 220, 3110–3118. [Google Scholar] [CrossRef] [PubMed]
- Powers, K.; Nishikawa, K.; Joumaa, V.; Herzog, W. Decreased force enhancement in skeletal muscle sarcomeres with a deletion in titin. J. Exp. Biol. 2016, 219, 1311–1316. [Google Scholar] [CrossRef] [PubMed]
- Hessel, A.L.; Joumaa, V.; Eck, S.; Herzog, W.; Nishikawa, K. Optimal length, calcium sensitivity and twitch characteristics of skeletal muscles from mdm mice with a deletion in N2A titin. J. Exp. Biol. 2019, 222, jeb200840. [Google Scholar] [CrossRef] [PubMed]
- Hessel, A.L.; Nishikawa, K.C. Effects of a titin mutation on negative work during stretch-shortening cycles in skeletal muscles. J. Exp. Biol. 2017, 220, 4177–4185. [Google Scholar] [CrossRef]
- Tahir, U.; Monroy, J.A.; Rice, N.A.; Nishikawa, K.C. Effects of a titin mutation on force enhancement and force depression in mouse soleus muscles. J. Exp. Biol. 2020, 223, jeb197038. [Google Scholar] [CrossRef]
- Huebsch, K.A.; Kudryashova, E.; Wooley, C.M.; Sher, R.B.; Seburn, K.L.; Spencer, M.J.; Cox, G.A. Mdm muscular dystrophy: Interactions with calpain 3 and a novel functional role for titin’s N2A domain. Hum. Mol. Genet. 2005, 14, 2801–2811. [Google Scholar] [CrossRef][Green Version]
- Pace, C.M.; Mortimer, S.; Monroy, J.A.; Nishikawa, K.C. The effects of a skeletal muscle titin mutation on walking in mice. J. Comp. Physiol. A Neuroethol. Sens. Neural. Behav. Physiol. 2017, 203, 67–76. [Google Scholar] [CrossRef]
- Taylor-Burt, K.R.; Monroy, J.; Pace, C.; Lindstedt, S.; Nishikawa, K.C. Shiver me titin! Elucidating titin’s role in shivering thermogenesis. J. Exp. Biol. 2015, 218, 694–702. [Google Scholar] [CrossRef][Green Version]
- Miyano, C.A.; Orezzoli, S.F.; Buck, C.L.; Nishikawa, K.C. Severe thermoregulatory deficiencies in mice with a deletion in the titin gene TTN. J. Exp. Biol. 2019, 222, jeb198564. [Google Scholar] [CrossRef]
- Monroy, J.A.; Powers, K.L.; Pace, C.M.; Uyeno, T.; Nishikawa, K.C. Effects of activation on the elastic properties of intact soleus muscles with a deletion in titin. J. Exp. Biol. 2017, 220, 828–836. [Google Scholar] [CrossRef]
- Powers, K.; Schappacher-Tilp, G.; Jinha, A.; Leonard, T.; Nishikawa, K.; Herzog, W. Titin force is enhanced in actively stretched skeletal muscle. J. Exp. Biol. 2014, 217, 3629–3636. [Google Scholar] [CrossRef] [PubMed]
- Wu, Y.; Cazorla, O.; Labeit, D.; Labeit, S.; Granzier, H. Changes in titin and collagen underlie diastolic stiffness diversity of cardiac muscle. J. Mol. Cell Cardiol. 2000, 32, 2151–2162. [Google Scholar] [CrossRef] [PubMed]
- Labeit, S.; Kolmerer, B. Titins: Giant proteins in charge of muscle ultrastructure and elasticity. Science 1995, 270, 293–296. [Google Scholar] [CrossRef] [PubMed]
- Luther, P.K. The vertebrate muscle Z-disc: Sarcomere anchor for structure and signalling. J. Muscle Res. Cell Motil. 2009, 30, 171–185. [Google Scholar] [CrossRef] [PubMed]
- Mills, M.; Yang, N.; Weinberger, R.; Vander Woude, D.L.; Beggs, A.H.; Easteal, S.; North, K. Differential expression of the actin-binding proteins, alpha-actinin-2 and-3, in different species: Implications for the evolution of functional redundancy. Hum. Mol. Genet. 2001, 10, 1335–1346. [Google Scholar] [CrossRef] [PubMed]
- Edlund, M.; Lotano, M.A.; Otey, C.A. Dynamics of alpha-actinin in focal adhesions and stress fibers visualized with alpha-actinin-green fluorescent protein. Cell Motil. Cytoskelet. 2001, 48, 190–200. [Google Scholar] [CrossRef]
- Fyrberg, E.; Kelly, M.; Ball, E.; Fyrberg, C.; Reedy, M.C. Molecular genetics of Drosophila alpha-actinin: Mutant alleles disrupt Z disc integrity and muscle insertions. J. Cell Biol. 1990, 110, 1999–2011. [Google Scholar] [CrossRef]
- Otey, C.A.; Carpen, O. Alpha-actinin revisited: A fresh look at an old player. Cell Motil. Cytoskelet. 2004, 58, 104–111. [Google Scholar] [CrossRef]
- Pavalko, F.M.; Burridge, K. Disruption of the actin cytoskeleton after microinjection of proteolytic fragments of alpha-actinin. J. Cell Biol. 1991, 114, 481–491. [Google Scholar] [CrossRef]
- Honda, K.; Yamada, T.; Endo, R.; Ino, Y.; Gotoh, M.; Tsuda, H.; Chiba, H.; Hirohashi, S. Actinin-4, a novel actin-bundling protein associated with cell motility and cancer invasion. J. Cell Biol. 1998, 140, 1383–1393. [Google Scholar] [CrossRef]
- Youssoufian, H.; McAfee, M.; Kwiatkowski, D.J. Cloning and chromosomal localization of the human cytoskeletal alpha-actinin gene reveals linkage to the beta-spectrin gene. Am. J. Hum. Genet. 1990, 47, 62–72. [Google Scholar]
- Araki, N.; Hatae, T.; Yamada, T.; Hirohashi, S. Actinin-4 is preferentially involved in circular ruffling and macropinocytosis in mouse macrophages: Analysis by fluorescence ratio imaging. J. Cell Sci. 2000, 113, 3329–3340. [Google Scholar] [CrossRef]
- Nikolopoulos, S.N.; Spengler, B.A.; Kisselbach, K.; Evans, A.E.; Biedler, J.L.; Ross, R.A. The human non-muscle alpha-actinin protein encoded by the ACTN4 gene suppresses tumorigenicity of human neuroblastoma cells. Oncogene 2000, 19, 380–386. [Google Scholar] [CrossRef] [PubMed]
- Hettige, P.; Tahir, U.; Nishikawa, K.C.; Gage, M.J. Comparative analysis of the transcriptomes of EDL, psoas, and soleus muscles from mice. BMC Genom. 2020, 21, 808. [Google Scholar] [CrossRef] [PubMed]
- Nagy, A.; Grama, L.; Huber, T.; Bianco, P.; Trombitas, K.; Granzier, H.L.; Kellermayer, M.S.Z. Hierarchical extensibility in the PEVK domain of skeletal-muscle titin. Biophys. J. 2005, 89, 329–336. [Google Scholar] [CrossRef]
- Hettige, P.; Tahir, U.; Nishikawa, K.; Gage, M. Transcriptomic profile of muscular dystrophy with myositis in extensor digitorum longus, psoas, and soleus muscles from mice. BMC Genom. 2022; in revision. [Google Scholar]
- Sorimachi, H.; Freiburg, A.; Kolmerer, B.; Ishiura, S.; Stier, G.; Gregorio, C.C.; Labeit, D.; ALinke, W.; Suzuki, K.; Labeit, S. Tissue-specific expression and alpha-actinin binding properties of the Z-disc titin: Implications for the nature of vertebrate Z-discs. J. Mol. Biol. 1997, 270, 688–695. [Google Scholar] [CrossRef]
- Joseph, C.; Stier, G.; O’brien, R.; Politou, A.S.; Atkinson, R.A.; Bianco, A.; Ladbury, J.E.; Martin, S.R.; Pastore, A. A structural characterization of the interactions between titin Z-repeats and the alpha-actinin C-terminal domain. Biochemistry 2001, 40, 4957–4965. [Google Scholar] [CrossRef]
- Grison, M.; Merkel, U.; Kostan, J.; Djinović-Carugo, K.; Rief, M. α-Actinin/titin interaction: A dynamic and mechanically stable cluster of bonds in the muscle Z-disk. Proc. Natl. Acad. Sci. USA 2017, 114, 1015–1020. [Google Scholar] [CrossRef] [PubMed]
- Luther, P.K.; Squire, J.M. Muscle Z-band ultrastructure: Titin Z-repeats and Z-band periodicities do not match. J. Mol. Biol. 2002, 319, 1157–1164. [Google Scholar] [CrossRef]
- Kruger, M.; Linke, W.A. Titin-based mechanical signalling in normal and failing myocardium. J. Mol. Cell Cardiol. 2009, 46, 490–498. [Google Scholar] [CrossRef]
- Nagy, A.; Cacciafesta, P.; Grama, L.; Kengyel, A.; Málnási-Csizmadia, A.; Kellermayer, M.S. Differential actin binding along the PEVK domain of skeletal muscle titin. J. Cell Sci. 2004, 117, 5781–5789. [Google Scholar] [CrossRef] [PubMed]
- Oikonomou, K.G.; Zachou, K.; Dalekos, G.N. Alpha-actinin: A multidisciplinary protein with important role in B-cell driven autoimmunity. Autoimmun. Rev. 2011, 10, 389–396. [Google Scholar] [CrossRef] [PubMed]
- Seto, J.T.; Lek, M.; Quinlan, K.G.; Houweling, P.J.; Zheng, X.F.; Garton, F.; MacArthur, D.G.; Raftery, J.M.; Garvey, S.M.; Hauser, M.A.; et al. Deficiency of alpha-actinin-3 is associated with increased susceptibility to contraction-induced damage and skeletal muscle remodeling. Hum. Mol. Genet. 2011, 20, 2914–2927. [Google Scholar] [CrossRef] [PubMed]
- Chen, Z.; Maimaiti, R.; Zhu, C.; Cai, H.; Stern, A.; Mozdziak, P.; Ge, Y.; Ford, S.P.; Nathanielsz, P.W.; Guo, W. Z-band and M-band titin splicing and regulation by RNA binding motif 20 in striated muscles. J. Cell Biochem. 2018, 119, 9986–9996. [Google Scholar] [CrossRef] [PubMed]
- Kolmerer, B.; Olivieri, N.; Witt, C.C.; Herrmann, B.G.; Labeit, S. Genomic organization of M line titin and its tissue-specific expression in two distinct isoforms. J. Mol. Biol. 1996, 256, 556–563. [Google Scholar] [CrossRef]
- Afgan, E.; Baker, D.; Van den Beek, M.; Blankenberg, D.; Bouvier, D.; Čech, M.; Chilton, J.; Clements, D.; Coraor, N.; Eberhard, C.; et al. The Galaxy platform for accessible, reproducible and collaborative biomedical analyses: 2016 update. Nucleic. Acids. Res. 2016, 44, W3–W10. [Google Scholar] [CrossRef]
- Labeit, D.; Watanabe, K.; Witt, C.; Fujita, H.; Wu, Y.; Lahmers, S.; Funck, T.; Labeit, S.; Granzier, H. Calcium-dependent molecular spring elements in the giant protein titin. Proc. Natl. Acad. Sci. USA 2003, 100, 13716–13721. [Google Scholar] [CrossRef]
- Mishra, D.; Nishikawa, K.C. Residual force enhancement is reduced in permeabilized fiber bundles from mdm muscles. J. Exp. Biol. 2022, 225, jeb243732. [Google Scholar] [CrossRef]
- Heimann, P.; Menke, A.; Rothkegel, B.; Jockusch, H. Overshooting production of satellite cells in murine skeletal muscle affected by the mutation ″muscular dystrophy with myositis″ (mdm, Chr 2). Cell Tissue Res. 1996, 283, 435–441. [Google Scholar] [CrossRef]
- Bolger, A.M.; Lohse, M.; Usadel, B. Trimmomatic: A flexible trimmer for Illumina sequence data. Bioinformatics 2014, 30, 2114–2120. [Google Scholar] [CrossRef]
- Kim, D.; Pertea, G.; Trapnell, C.; Pimentel, H.; Kelley, R.; Salzberg, S.L. TopHat2: Accurate alignment of transcriptomes in the presence of insertions, deletions and gene fusions. Genome. Biol. 2013, 14, R36. [Google Scholar] [CrossRef] [PubMed]
- Schafer, S.; Miao, K.; Benson, C.C.; Heinig, M.; Cook, S.A.; Hubner, N. Alternative Splicing Signatures in RNA-seq Data: Percent Spliced in (PSI). Curr. Protoc. Hum. Genet. 2015, 87, 11–16. [Google Scholar] [CrossRef] [PubMed]
- Hakim, C.H.; Wasala, N.B.; Duan, D. Evaluation of muscle function of the extensor digitorum longus muscle ex vivo and tibialis anterior muscle in situ in mice. J. Vis. Exp. 2013, 72, e50183. [Google Scholar] [CrossRef] [PubMed]
- Joumaa, V.; Herzog, W. Calcium sensitivity of residual force enhancement in rabbit skinned fibers. Am. J. Physiol. Cell Physiol. 2014, 307, C395–C401. [Google Scholar] [CrossRef] [PubMed]
- Joumaa, V.; Rassier, D.E.; Leonard, T.R.; Herzog, W. Passive force enhancement in single myofibrils. Pflug. Arch. 2007, 455, 367–371. [Google Scholar] [CrossRef]


Publisher’s Note: MDPI stays neutral with regard to jurisdictional claims in published maps and institutional affiliations. |
© 2022 by the authors. Licensee MDPI, Basel, Switzerland. This article is an open access article distributed under the terms and conditions of the Creative Commons Attribution (CC BY) license (https://creativecommons.org/licenses/by/4.0/).
Share and Cite
Hettige, P.; Mishra, D.; Granzier, H.; Nishikawa, K.; Gage, M.J. Contributions of Titin and Collagen to Passive Stress in Muscles from mdm Mice with a Small Deletion in Titin’s Molecular Spring. Int. J. Mol. Sci. 2022, 23, 8858. https://doi.org/10.3390/ijms23168858
Hettige P, Mishra D, Granzier H, Nishikawa K, Gage MJ. Contributions of Titin and Collagen to Passive Stress in Muscles from mdm Mice with a Small Deletion in Titin’s Molecular Spring. International Journal of Molecular Sciences. 2022; 23(16):8858. https://doi.org/10.3390/ijms23168858
Chicago/Turabian StyleHettige, Pabodha, Dhruv Mishra, Henk Granzier, Kiisa Nishikawa, and Matthew J. Gage. 2022. "Contributions of Titin and Collagen to Passive Stress in Muscles from mdm Mice with a Small Deletion in Titin’s Molecular Spring" International Journal of Molecular Sciences 23, no. 16: 8858. https://doi.org/10.3390/ijms23168858
APA StyleHettige, P., Mishra, D., Granzier, H., Nishikawa, K., & Gage, M. J. (2022). Contributions of Titin and Collagen to Passive Stress in Muscles from mdm Mice with a Small Deletion in Titin’s Molecular Spring. International Journal of Molecular Sciences, 23(16), 8858. https://doi.org/10.3390/ijms23168858