Article

Insights into the Genomic Regions and Candidate Genes of Senescence-Related Traits in Upland Cotton via GWAS

College of Advanced Agriculture Sciences, Zhejiang A&F University, Hangzhou 311300, China
*
Authors to whom correspondence should be addressed.
These authors contributed equally to this work.
Int. J. Mol. Sci. 2022, 23(15), 8584; https://doi.org/10.3390/ijms23158584
Submission received: 4 July 2022 / Revised: 29 July 2022 / Accepted: 29 July 2022 / Published: 2 August 2022
(This article belongs to the Special Issue Research on Plant Genomics and Breeding)

Abstract

:
Senescence is the last stage of plant development and is controlled by both internal and external factors. Premature senescence significantly affects the yield and quality of cotton. However, the genetic architecture underlying cotton senescence remains unclear. In this study, genome-wide association studies (GWAS) were performed based on 3,015,002 high-quality SNP markers from the resequencing data of 355 upland cotton accessions to detect genomic regions for cotton senescence. A total of 977 candidate genes within 55 senescence-related genomic regions (SGRs), SGR1–SGR55, were predicted. Gene ontology (GO) analysis of candidate genes revealed that a set of biological processes was enriched, such as salt stress, ethylene processes, and leaf senescence. Furthermore, in the leaf senescence GO term, one candidate gene was focused on: Gohir.A12G270900 (GhMKK9), located in SGR36, which encodes a protein of the MAP kinase kinase family. Quantitative real-time PCR (qRT-PCR) analysis showed that GhMKK9 was up-regulated in old cotton leaves. Overexpression of GhMKK9 in Arabidopsis accelerated natural leaf senescence. Virus-induced gene silencing (VIGS) of GhMKK9 in cotton increased drought tolerance. These results suggest that GhMKK9 is a positive regulator and might be involved in drought-induced senescence in cotton. The results provide new insights into the genetic basis of cotton senescence and will be useful for improving cotton breeding in the future.

1. Introduction

Cotton (Gossypium spp.) is an important industrial crop worldwide that offers renewable natural fibers, oil, and animal feed [1]. The genomes of the genus Gossypium are extraordinarily diverse, including approximately 45 diploid species (2n = 2x = 26) and seven tetraploid (2n = 4x = 52) species [2,3]. Gossypium hirsutum L. (also known as upland cotton), one of the seven tetraploid cotton species, is the most widely cultivated species worldwide because of its adaptability, high yield, and moderate fiber quality [4,5]. Although upland cotton makes a significant contribution to revenue in several countries [4], cotton yield is reduced due to senescence when it is induced prematurely under adverse environmental stresses [6].
Senescence is the last stage of plant development and is accompanied by a transition from nutrient assimilation to nutrient remobilization [7,8]. During plant senescence, many major macromolecules are degraded, including proteins, lipids, and nucleic acids, but the most visible symptom is leaf yellowing owing to the catabolism of chlorophyll [9,10]. The onset and progression of senescence are regulated by both internal and external factors. Internal factors include various phytohormones [7,11] that play diverse roles in leaf development. For example, ethylene, abscisic acid (ABA), and salicylic acids (SA) are acknowledged as senescence-promoting hormones [12,13,14,15,16]. Additionally, multiple external environmental factors, including abiotic and biotic stresses, can trigger changes of hormones, which form a complex regulatory network of senescence [8]. Interestingly, the mitogen-activated protein kinase (MAPK) cascades play an important role in conveying endogenous and exogenous signals [17].
Senescence is a complex, quantitative trait, and many studies have reported the genetic basis of leaf senescence in plants. Under various stress conditions, several quantitative trait loci (QTL) associated with senescence were discovered using linkage mapping in crop plants, such as rice [18,19], wheat [20,21,22,23], barley [24], maize [25], sorghum [26,27,28,29], and potato [30]. Although these studies are helpful for understanding the genetic architecture of senescence, it is difficult to identify the underlying genes owing to a lack of resolution. In the past decade, genome-wide association studies (GWAS) have become a powerful method for detecting quantitative trait loci and candidate genes at the genome-wide level [31,32,33,34]. In a recent study, 25 candidate genes for chlorophyll content (CC) and stay-green (SG) traits were identified using a diverse population of 368 rice accessions via GWAS [35]. OsSG1 is considered a pleiotropic gene regulating CC, SG, and chlorophyll accumulation [35]. In another GWAS study, 64 candidate genes associated with maize senescence were identified using the maize diversity panel, of which 14 genes were involved in senescence-related processes, such as proteolysis and sink activity, and eight candidate genes were supported by a regulatory network [36]. Furthermore, our previous study revealed 50 genomic regions associated with cotton senescence via a multi-locus GWAS based on 185 upland cotton accessions and SLAF-seq data [37]. The candidate gene, GhCDF1, was identified as a negative regulator of cotton senescence. However, further studies are needed to understand the mechanisms underlying cotton senescence.
Here, a genome-wide association study was conducted to dissect the genetic basis of senescence in cotton. The association panel consisted of 355 upland cotton accessions planted in multiple environments, and chlorophyll content indices were measured as indicators of senescence. Using resequencing data, 55 senescence-related genomic regions (SGRs) were discovered based on GWAS, and 977 potential candidate genes associated with cotton senescence were identified. The function of candidate gene GhMKK9 was then analyzed, and it was found that GhMKK9 silencing improves the drought resistance of cotton, whereas GhMKK9 overexpression accelerates senescence in Arabidopsis. These results provide a foundation for the breeding and the genetic improvement of cotton.

2. Results

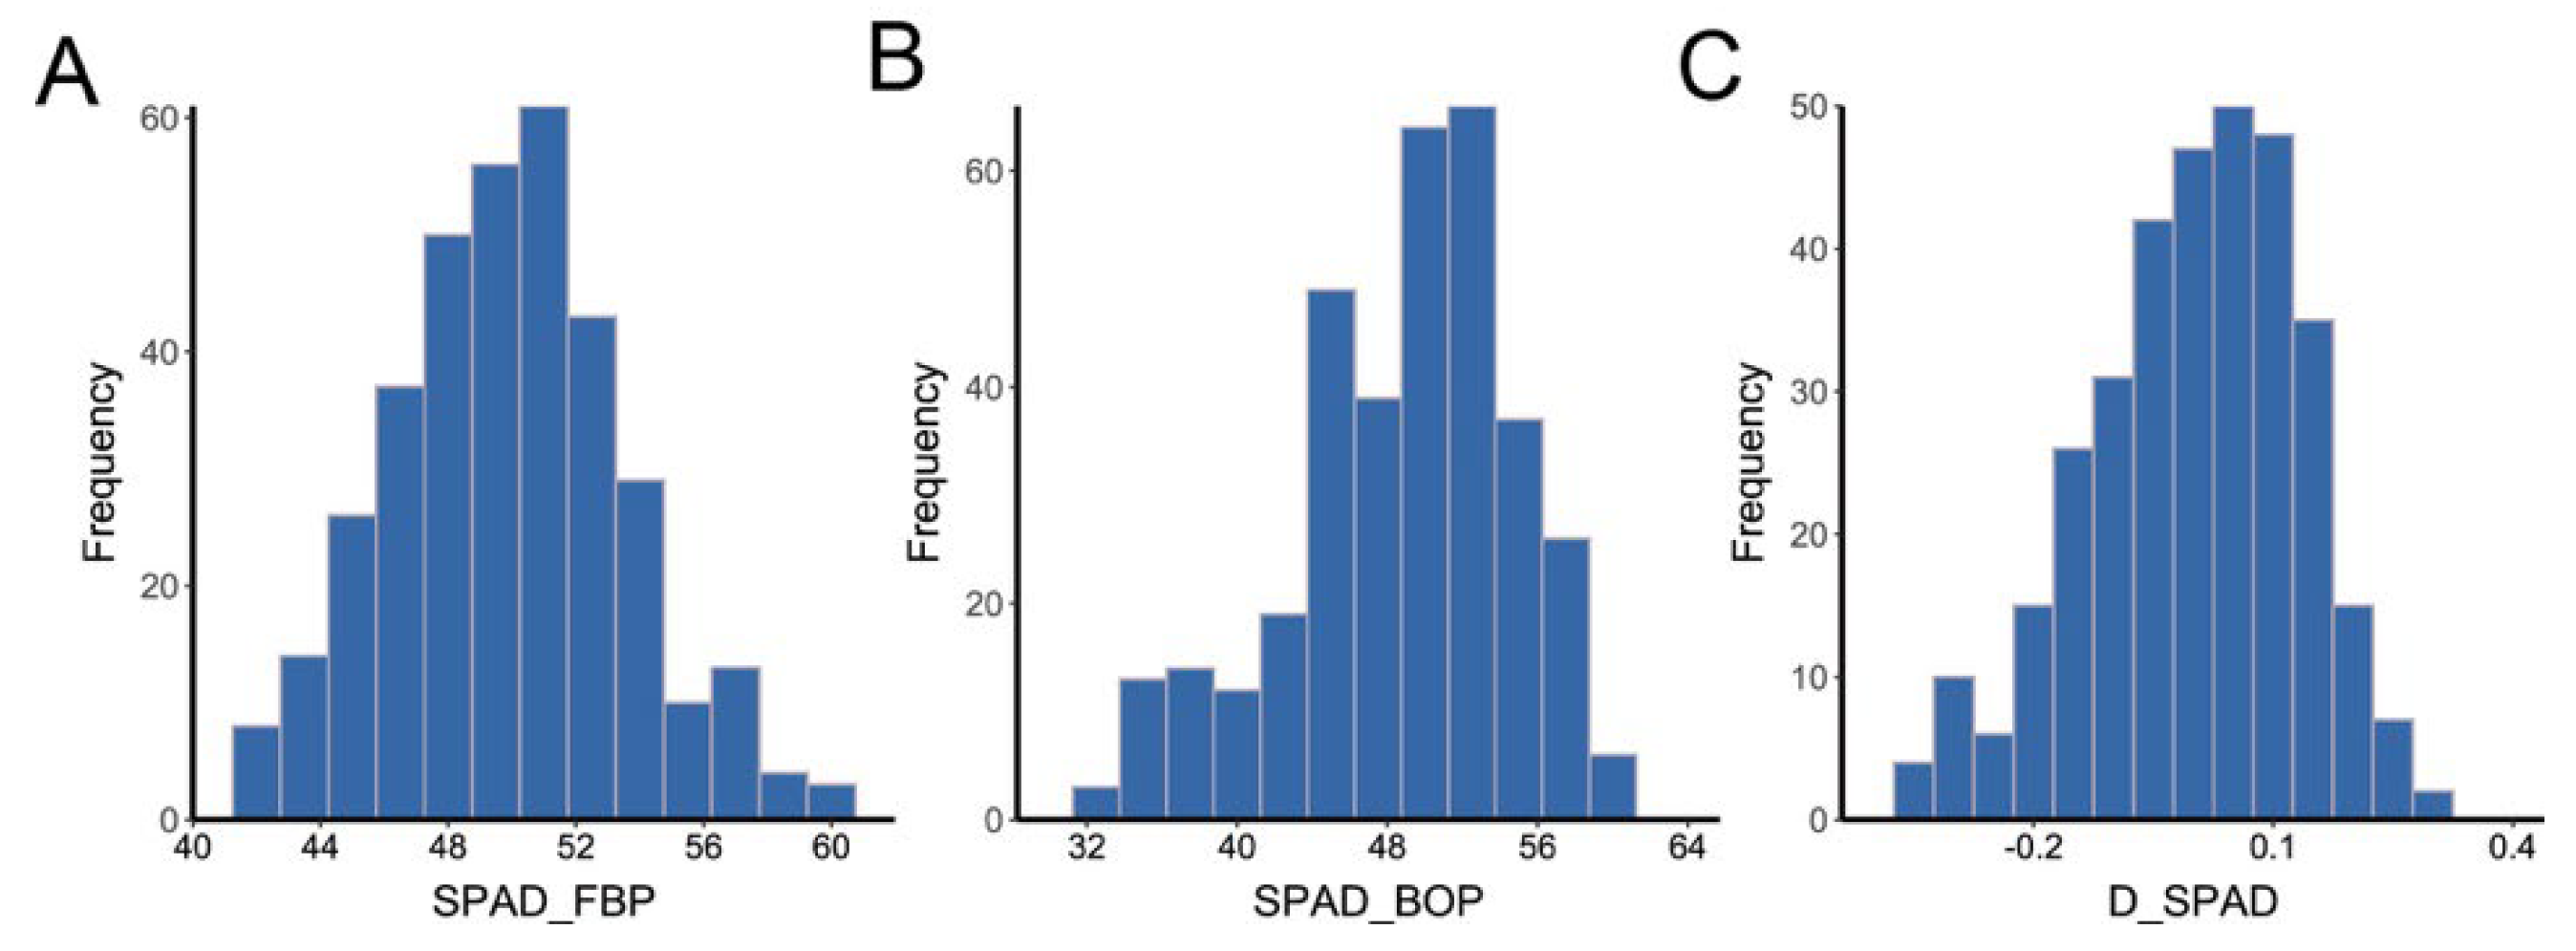
2.1. Analysis of Phenotypic Variations

To evaluate the variability of senescence in the GWAS panel, the relative chlorophyll levels of 355 upland cottons were investigated with the SPAD-502 m during two periods, the flowering and boll-setting period (FBP) and the boll-opening period (BOP), in multiple environments, including Anyang (AY) and Huanggang (HG) in 2016 and 2017, designated as SPAD_FBP_AY16, SPAD_FBP_AY17, SPAD_FBP_HG16, SPAD_FBP_HG17, SPAD_BOP_AY16, SPAD_BOP_AY17, SPAD_BOP_HG16, and SPAD_BOP_HG17. To assess the rate of leaf senescence, the diurnal variation of SPAD was calculated, including D_SPAD_AY1, D_SPAD_AY17, D_SPAD_HG16, and D_SPAD_HG17. Additionally, the absolute chlorophyll concentrations and diurnal variation were determined at AY in 2017 (see the Methods section).
The investigated traits followed approximately normal distributions (Figure 1 and Figure S1–S3) and exhibited wide variation among different years and locations (Supplementary Table S1). In the FBP period, the average SPAD values in AY and HG in 2016 were 49.12 and 46.27, respectively, compared to 55.10 and 48.87 in 2017. In the BOP period, the average SPAD in AY in 2016 was higher than that in 2017, at 52.01 and 48.77, respectively, whereas the average SPAD in HG in 2016 was 42.52, lower than that in 2017 (50.19). The standard deviation of SPAD values in the FBP period was distributed from 2.25 to 3.66, compared with the range of 3.54–12.84 in the BOP period. In addition, the average variations of the index D_SPAD ranged from −0.19 to 0.19. Furthermore, the ANOVA result indicated that genotype, environment, and the genotype-by-environment interaction had significant effects on SPAD (p < 0.01), while heritability of SPAD in the FBP period was higher than that in the BOP period (0.65 and 0.41, respectively) (Supplementary Table S2). These results indicate that cotton senescence is significantly influenced by environmental factors, particularly in the BOP period.
Pearson’s product–moment correlation coefficients and test statistics were used to evaluate traits. Although there were significant positive correlations (p < 0.001) among chlorophyll contents, the diurnal variations of chlorophyll content were more related to the BOP period (|r| = 0.00–0.35) than the FBP period (|r| = 0.01–0.93) (Supplementary Figure S4).

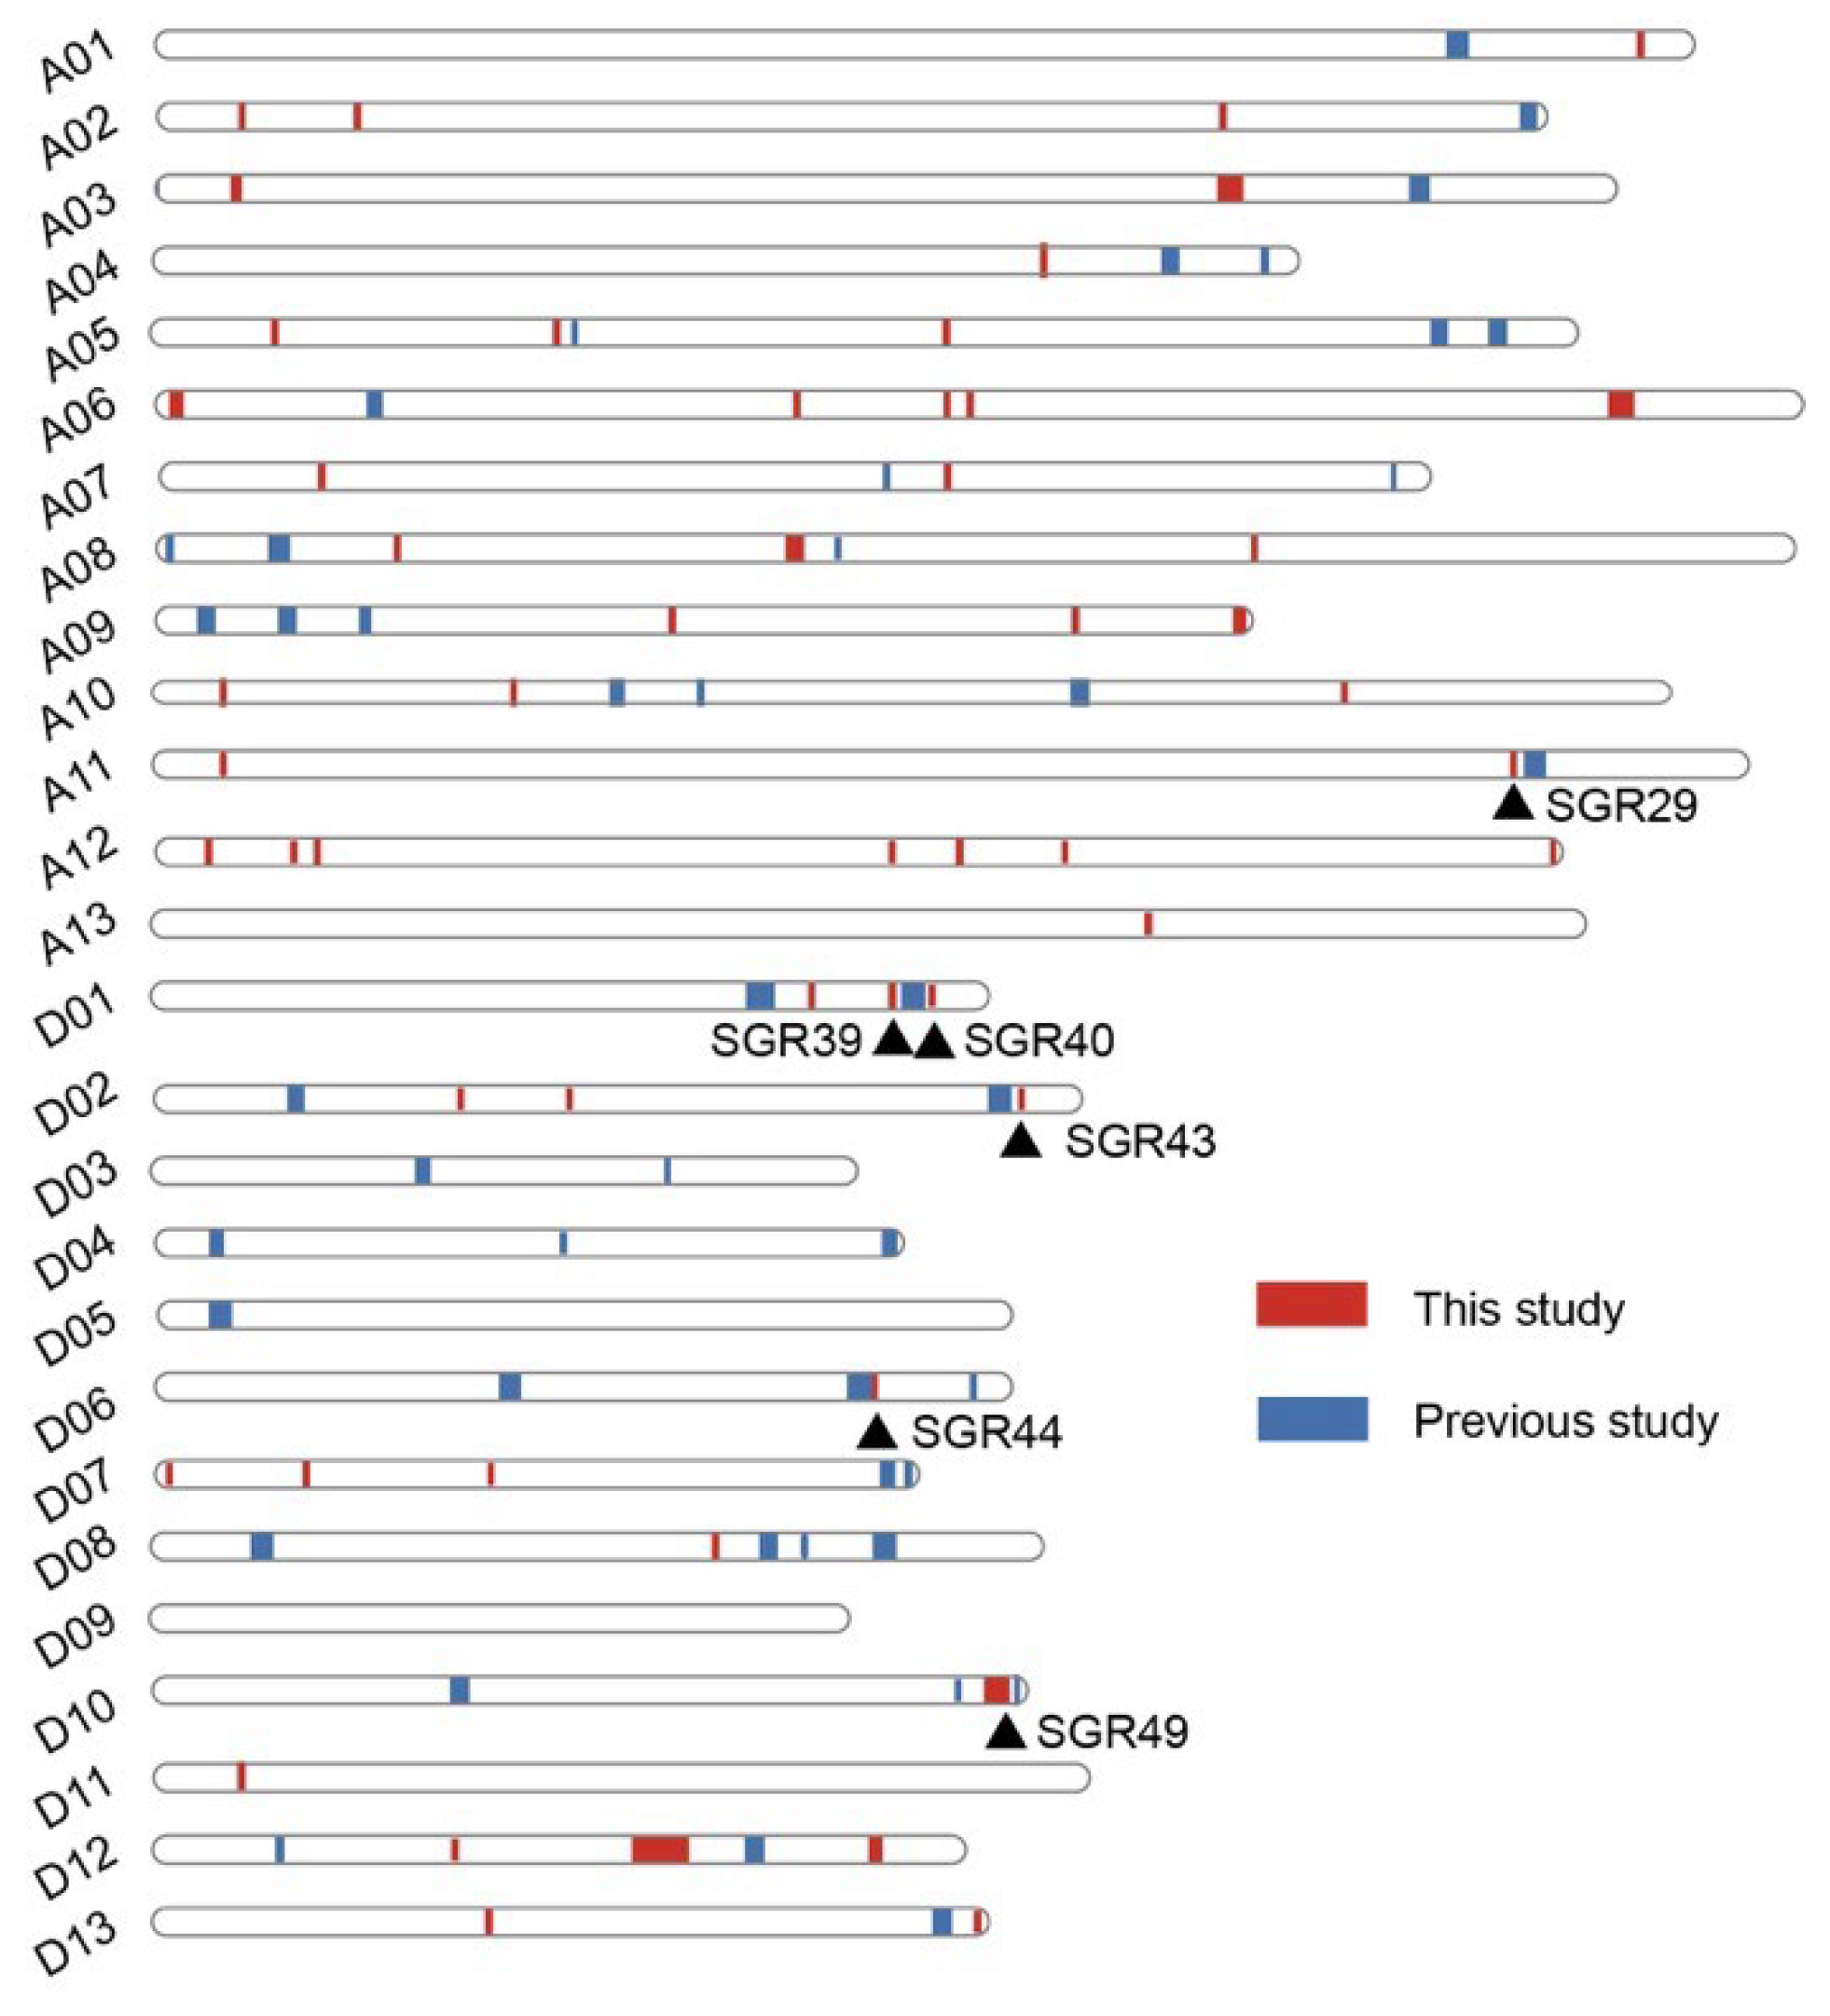
2.2. GWAS for Cotton Senescence and Identified Genomic Regions

A total of 3,015,002 high-quality single-nucleotide polymorphisms (SNPs) were identified after a strict filtering pipeline. GWAS was then performed for both single traits across different environments and the best linear unbiased prediction (BLUP) values across all environments using a linear mixed model by EMMAX [38] (Supplementary Figure S5–S7). Given the significant thresholds (p < 10−6 or p < 10−5 in at least two environments), 380 significant signals were identified (Supplementary Table S3).
Because the majority of GWAS signals are usually located in noncoding or intergenic regions, functional variations are rarely identified by association tests from SNPs [39]. Therefore, significant signals were integrated, and 55 senescence-related genomic regions (SGRs) obtained, namely, SGR1–SGR55. (Table 1). The total span of SGRs was approximately 18.09 megabases (Mb), of which 27 were over 1 kb in length. In the A subgenome, 37 SGRs were distributed across all 13 chromosomes (A01–A13) with a total length of 9.49 Mb, while 18 SGRs were distributed across only nine chromosomes of the D subgenome, with a total length of 8.60 Mb. Interestingly, there was an extremely long genomic region on the D12 chromosome, SGR52, which spanned 4.33 Mb and accounted for half of the total length of SGRs in the D subgenome. In addition, forty-three SGRs (78.18%) were detected at least twice, indicating that the results were stable and reliable.

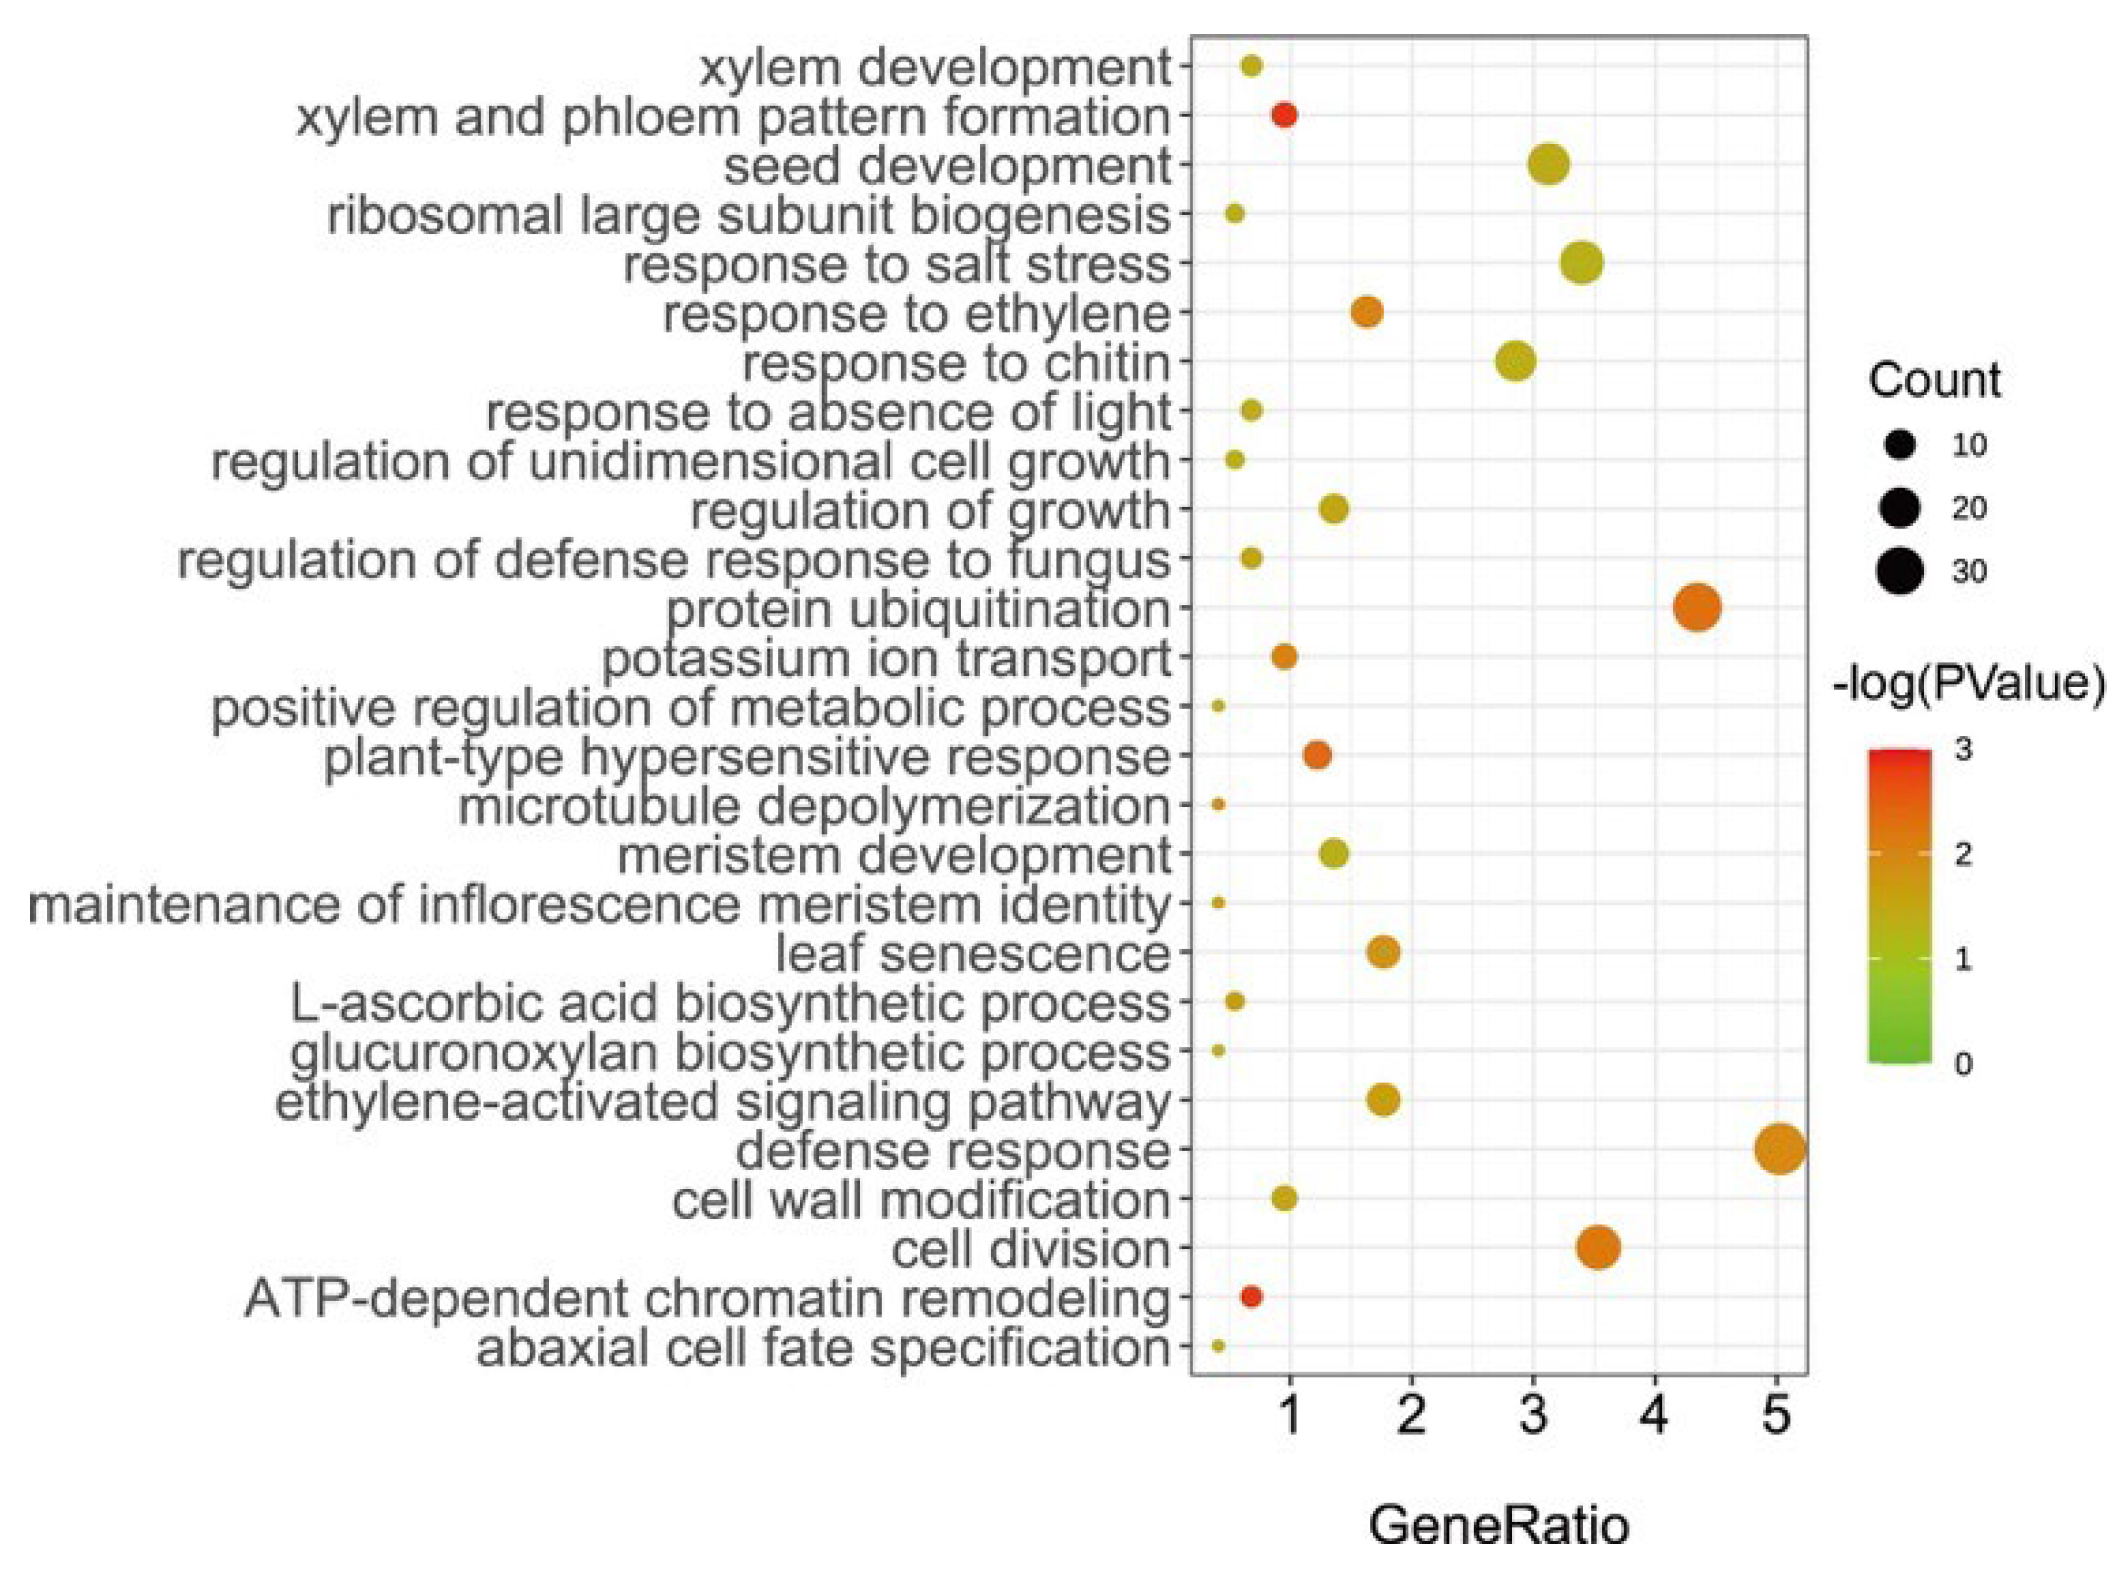
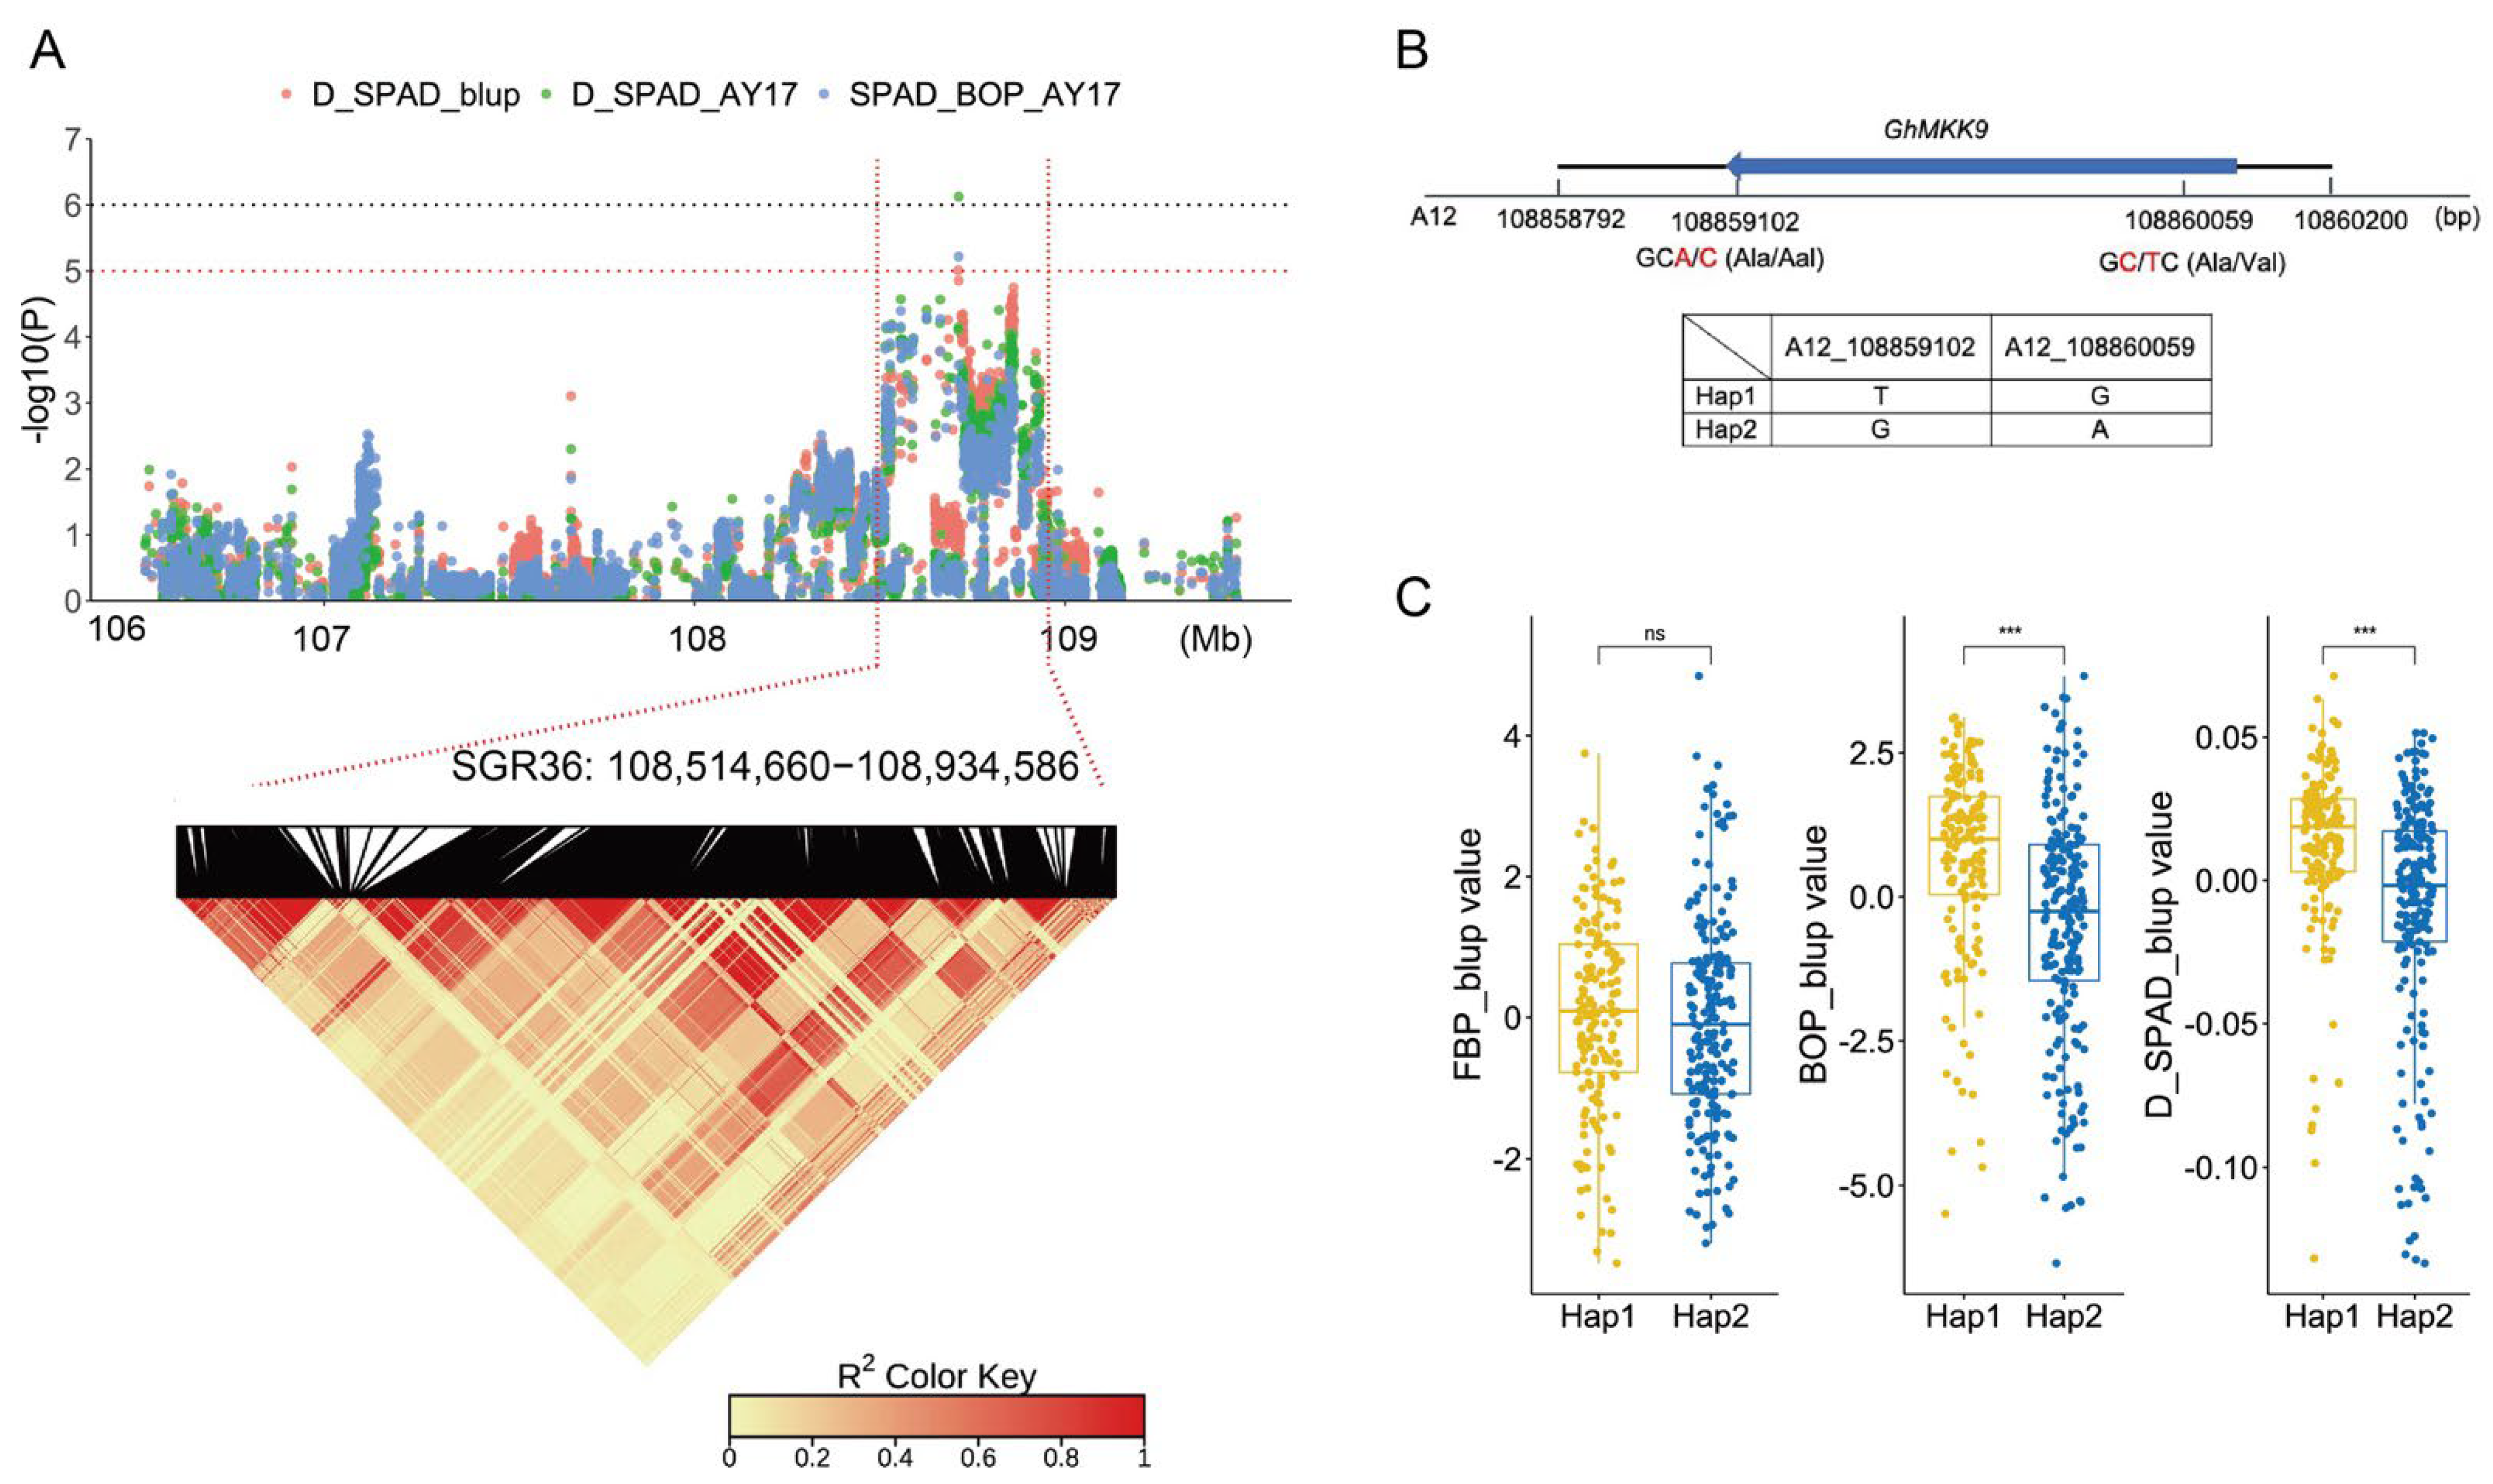
2.3. Prediction of Candidate Genes

In this study, all the genes located in the 55 SGRs were identified as candidate senescence-related genes. Subsequently, 977 candidate genes were identified (Supplementary Table S4). Of these, 853 candidate genes were annotated as orthologs in Arabidopsis. Notably, 156 genes were recorded in the leaf senescence database LSD 3.0, such as EIN3 (Gohir.A03G034800/Gohir.A03G034800), WRKY6 (Gohir.D07G088100), and PPH (Gohir.D12G102900) (Supplementary Table S5). This result suggests that our approach to dissecting the genetic basis of cotton senescence was effective. Furthermore, enrichment analysis of gene ontology (GO) biological processes (BPs) showed that the significant enrichments (p < 0.05) of these genes were associated with plant senescence-related processes, such as response to salt stress, ethylene processes, and leaf senescence (Figure 2). For example, Gohir.D12G208700 (GhRCD1) is a homolog of AT1G32230 in Arabidopsis, encoding a protein belonging to the (ADP-ribosyl) transferase domain-containing subfamily of the WWE protein–protein interaction domain protein family, and RCD1 was reported to be involved in superoxide-induced cell death [40,41]. Gohir.A12G270200 (GhJAZ3) encodes jasmonate zim-domain protein 3, which negatively regulates AtMYC2, a key transcriptional activator of JA responses [42]. Most strikingly, we focused on the candidate gene Gohir.A12G270900 (GhMKK9), which is a homolog of AT1G73500 (AtMKK9), a member of the MAP kinase kinase family that was reported to play a positive role in leaf senescence of Arabidopsis [43].
GhMKK9 is located in SGR36, which spans approximately 420 kb and is associated with three phenotypic values, D_SPAD_AY17, SPAD_BOP_AY17, and D_SPAD_blup (Figure 3A). In the genomic region, we discovered a non-synonymous SNP (A12_108859102) within the CDS region of GhMKK9, which causes a change in the base from C to T, as well as a change in amino acid from alanine (GCC) to valine (GTC) (Figure 3B). This SNP and another synonymous SNP (A12_108860059), also located in the CDS region, form two haplotypes, TG (Hap1) and GA (Hap2). In the associated panel, 158 cotton accessions carried Hap1, and 197 accessions carried Hap2. Although the SPAD values (FBP_blup) of Hap1 and Hap2 were not significantly different in the FBP period, the BOP_blup and D_SPAD_blup values of Hap1 were significantly higher than those of Hap2 (Figure 3C), indicating that Hap1 is a favorable haplotype for delaying cotton senescence.

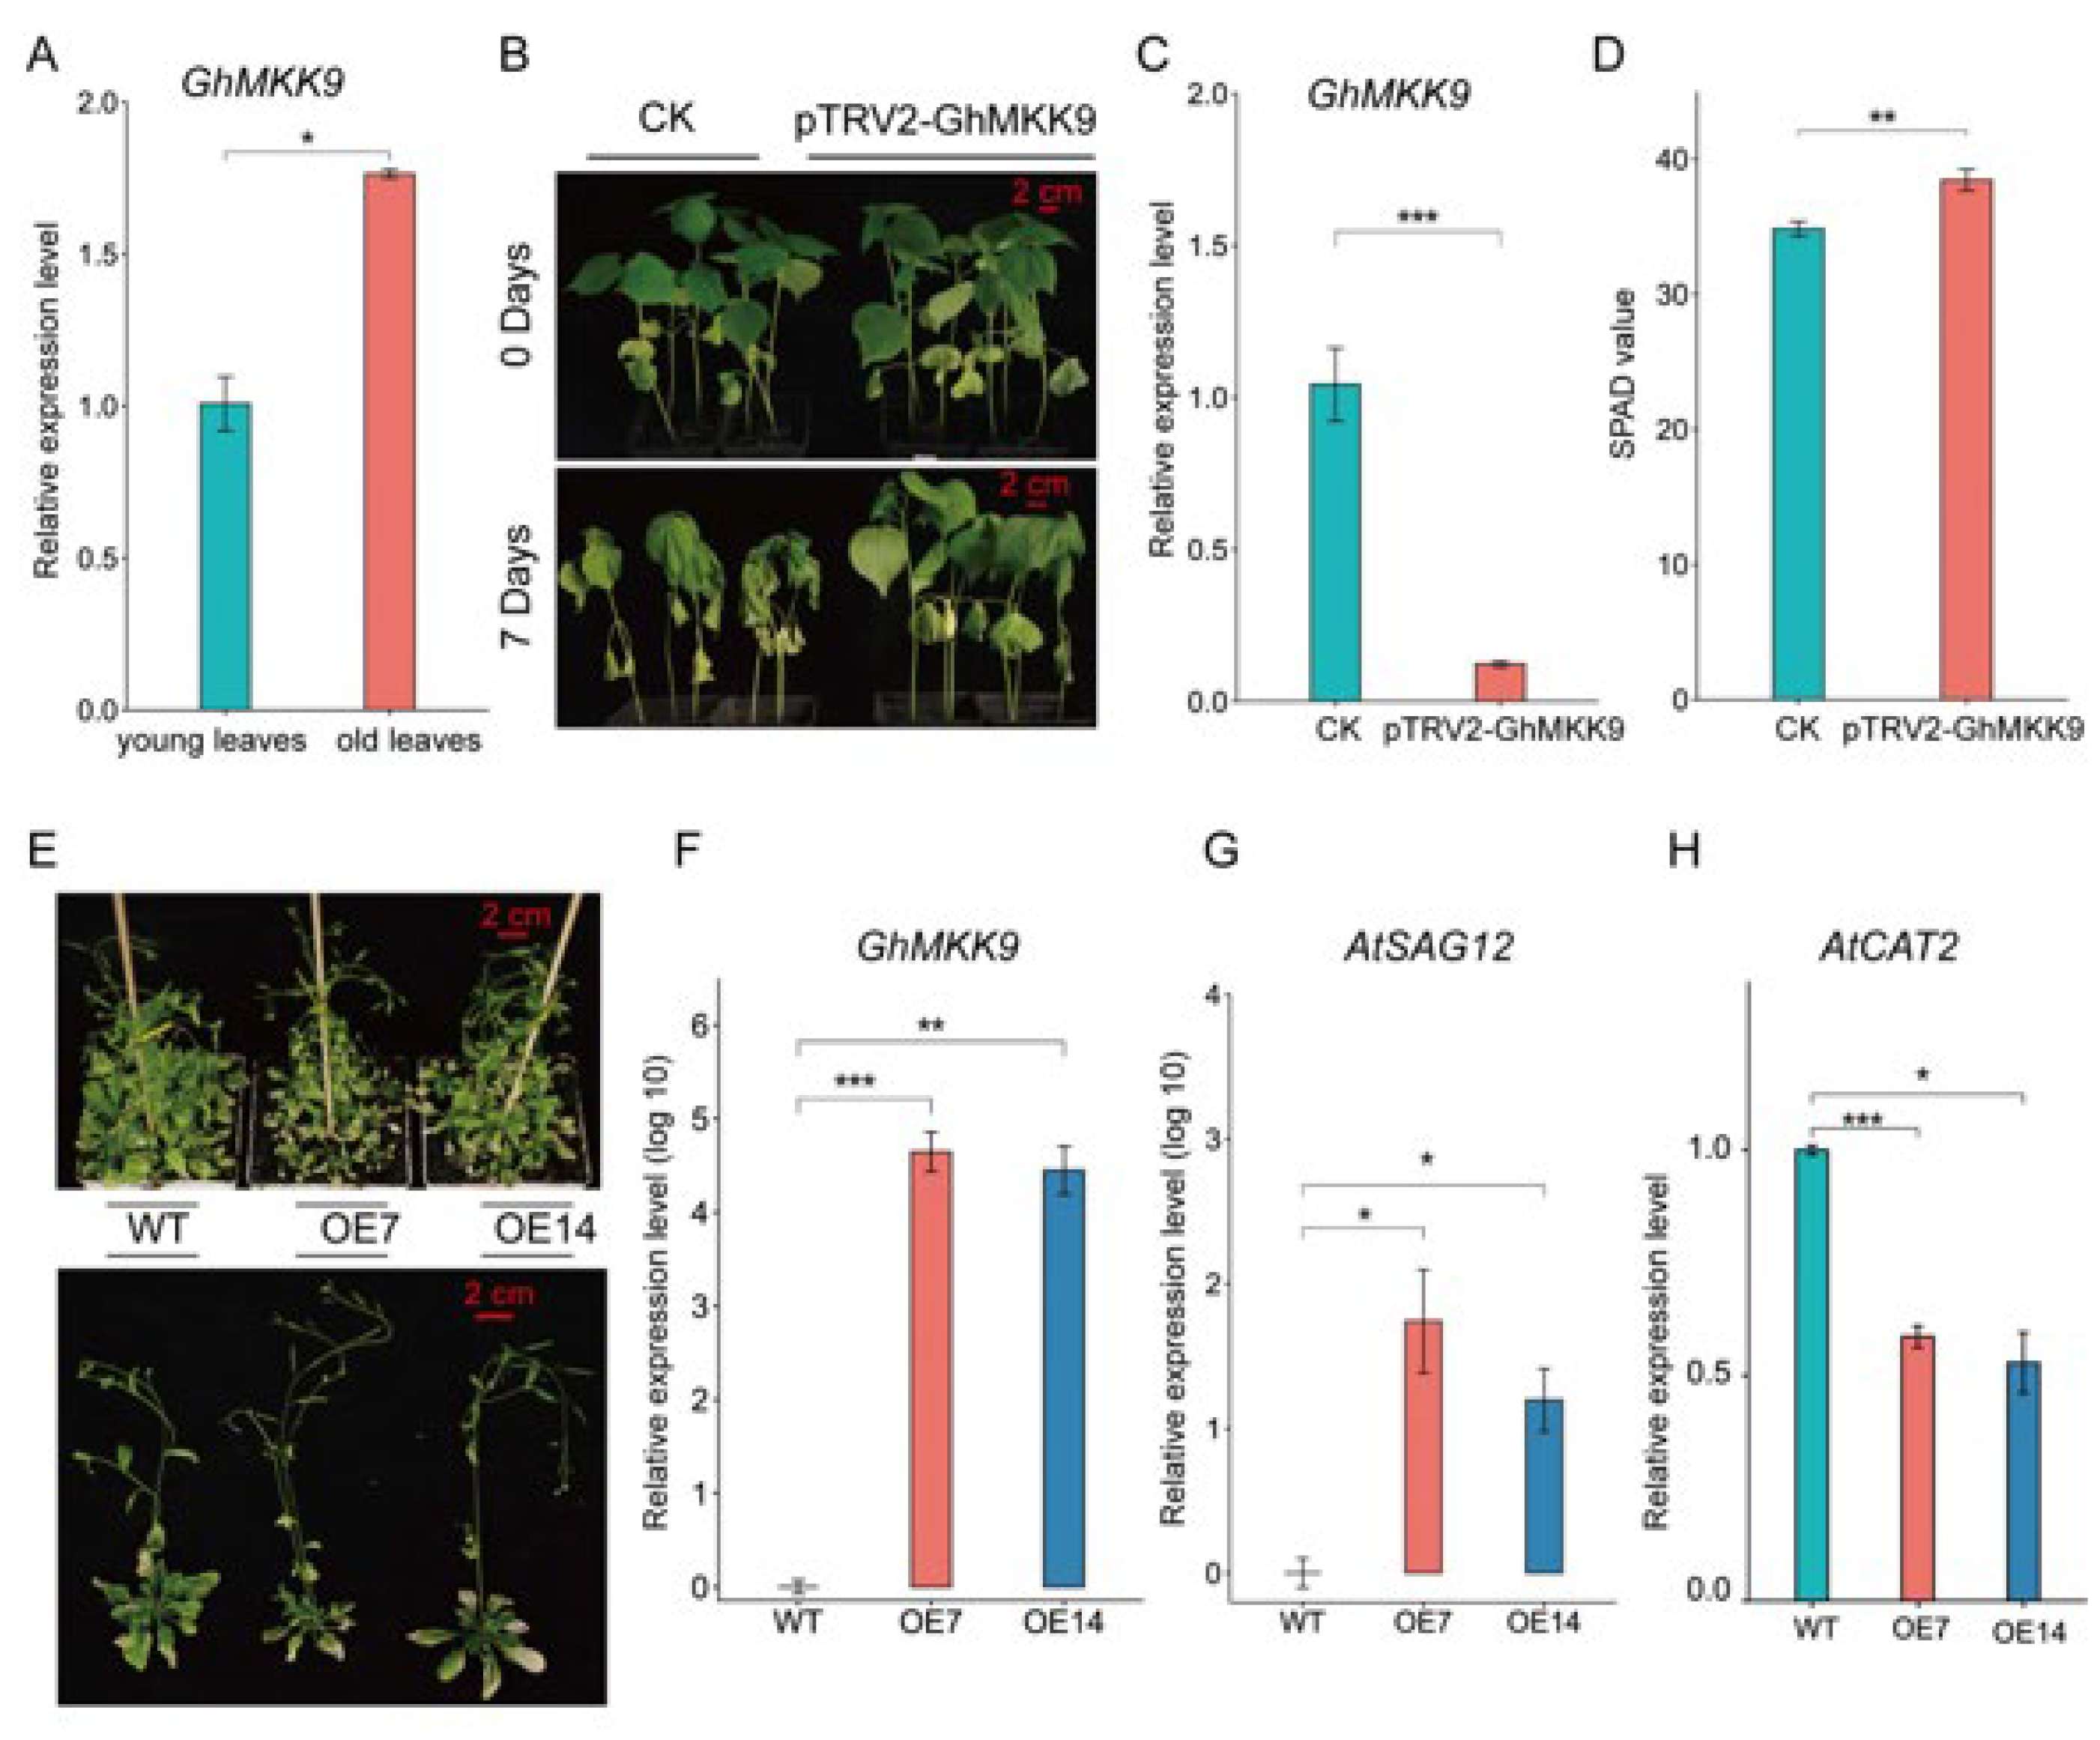
2.4. GhMKK9, A Positive Regulator of Cotton Senescence

Quantitative real-time PCR (qRT-PCR) analysis showed that the expression level of GhMKK9 in old cotton leaves was significantly higher than that in young cotton leaves (Figure 4A). Furthermore, we silenced the expression of GhMKK9 in cotton using virus-induced gene silencing (VIGS) (Figure 4C). After one week of drought treatment, the CK group showed an obvious leaf wilting phenotype, whereas the VIGS-silenced plants (pTRV2-GhMKK9) only showed a barely visible wilting phenotype (Figure 4B). The SPAD value of cotton leaves in the CK group after drought treatment was also significantly lower than that of the VIGS-silenced plants (Figure 4D). Moreover, to further examine the function of GhMKK9, we overexpressed GhMKK9 under the control of the 35S promoter (35S::GhMKK9) in Arabidopsis and obtained two transgenic lines (OE7 and OE14), which were confirmed by qRT-PCR (Figure 4F). After six weeks of culture under normal conditions, the overexpressing Arabidopsis lines OE7 and OE14 exhibited more severe senescence phenotypes than wild-type Arabidopsis, such as rosette leaf wilting and a higher degree of yellowing (Figure 4E). In addition, we determined the transcript levels of two senescence-marked genes, AtSAG12 (up-regulated during senescence) [44,45] and AtCAT2 (down-regulated during senescence) [46,47]. The transcript level of AtSAG12 in the transgenic plants was significantly higher than that in the WT plants (Figure 4G), whereas the transcript level of AtCAT2 in the transgenic plants was significantly lower than that in the WT plants (Figure 4H). Taken together, these results suggest that GhMKK9 is a positive regulator of leaf senescence and may also be involved in drought-stress-induced senescence.

3. Discussion

The senescence process of plant leaves is a very complex biological regulation process which first depends on age and is also affected by external environmental signal stimuli [11]. Therefore, internal genetic and external environmental factors together determine the onset and rate of senescence. The senescence process in plants involves the remobilization and reutilization of nutrients from senescing parts as sinks [7,48], which is particularly important for crop plant products. Cotton fiber is one of the most important industrial textile fibers worldwide. Senescence has an important impact on the quality and yield of cotton fiber [6]. Compared with other crops, such as rice, wheat, and corn, cotton has the habit of indeterminate growth, which blurs the lines between growth, maturation, and senescence. Nevertheless, the flowering and boll period (FBP) is considered to be an important developmental stage of cotton because the plant undergoes a transition from vegetative to reproductive growth in which the level of plant endogenous hormones reaches a peak, photosynthesis is enhanced, and the activity of the “sink” is also enhanced. Then, in the boll-opening period (BOP), cotton senescence, such as chlorosis, is visible. Therefore, these two periods were chosen to study the regulation of senescence in cotton. Although senescence has received increasing attention in cotton breeding, research on the genetic basis of cotton senescence remains limited. In this study, chlorophyll content indices were selected as indicators to evaluate the senescence performance of the upland cotton population. Due to the combined action of genetic and environmental factors, the chlorophyll content varied widely across different planting locations and years. The SPAD value in the BOP period had a larger range of variation than that in the FBP period. Moreover, the SPAD value in the FBP period showed higher heritability than that in the BOP period (0.65 and 0.41, respectively), which is similar to the results of the previous study [37]. These results indicate that environmental factors have a more significant impact on later cotton development.
A GWAS was performed based on 3,015,002 high-quality SNP markers from the resequencing data of 355 accessions to detect the genetic structure of cotton senescence. A total of 380 significant signals were identified. Given that functional variations are usually rare in GWAS [49], significant SNPs were integrated into genomic regions (GWAS loci). In the previous study, 50 genomic regions associated with cotton senescence were revealed based on SLAF-seq data of 185 accessions, which spanned a total of 51.50 Mb [37]. In the present study, 55 senescence-related genomic regions (SGRs) spanning approximately 18.09 Mb were identified. Compared with SLAF-seq-based GWAS, the resequencing data greatly increased the fine-mapping resolution. Six SGRs (SGR29, SGR39, SGR40, SGR43, SGR44, and SGR49) were located within ~1 Mb of the genomic regions reported in the previous study. (Figure 5). Interestingly, these SGRs were located in the D subgenome (except for SGR29) and were associated with the chlorophyll content in the BOP period and/or the diurnal variation of chlorophyll content (excepted for SGR39). These results suggest that the D subgenome plays an important role in the regulation of senescence in cotton. A range of abiotic and biotic stressors, such as drought, salt, and pathogen infection, can accelerate the onset and/or progression of plant senescence [7,8,50], and the D subgenome was reported to make an important contribution to stress tolerance in allotetraploid cotton [51]. This provides a possible explanation for the results.
Of the 55 SGRs, a total of 977 candidate genes were annotated. Among them, 156 genes were also recorded in the leaf senescence database LSD 3.0, and GO analysis revealed a set of biological processes, such as salt stress, ethylene processes, and leaf senescence. This suggests that the theory used in this study was effective. Interestingly, focus was given to a candidate gene, Gohir.A12G270900, which is homologous to AT1G73500 and encodes an MKK9 protein in Arabidopsis. AtMKK9 plays an important role in the regulation of Arabidopsis senescence [43]. There are many signaling pathways in plants that involve responses to external stimuli, and one of the most common is the MAPK signaling pathway. In eukaryotes, the MAPs cascade signaling pathway is a highly conserved signaling module [52,53]. Each MAPKs cascade signaling module is composed of three protein kinases that act in sequence: MPK, MKK, and MKKK. In Arabidopsis, there are 20 MPK genes, 10 MKK genes, and 69 MKKK genes [54]. In upland cotton, there may be 52 GhMKs, 23 GhMKKs, and 166 GhMKKKs genes [55]. The candidate gene Gohir.A12G270900 (GhMKK9) is a member of the GhMKK family. GhMKK9 is located in SGR36, which is associated with multiple senescence phenotypes, indicating high repeatability and reliability. Interestingly, a non-synonymous SNP (A12_108859102) and synonymous SNP (A12_108860059) were observed in the exon region of GhMKK9. The SNP A12_108859102 changed the amino acid from alanine (GCC) to valine (GTC), which may affect the function of the GhMKK9 protein. In addition, these two SNPs formed two haplotypes, Hap1 and Hap2 (Figure 3C). The BOP_blup and D_SPAD_blup values of the Hap1 are significantly higher than those of the Hap2. These results suggest that Hap1 is a favorable haplotype for delaying senescence and that the GhMKK9 gene may play an important role in the regulation of cotton senescence.
The function of the GhMKK9 gene was further verified. By qRT-PCR analysis, it was found that the expression level of GhMKK9 was significantly higher in old cotton leaves than that in young cotton leaves, and overexpression of GhMKK9 gene in Arabidopsis thaliana promoted the senescence process of Arabidopsis leaves, indicating that GhMKK9 is a positive regulator of plant senescence, which is consistent with the results of a previous study [43,56]. In Rosa hybrida, RhMKK9 silencing significantly delayed petal senescence in flowers [57]. The MKK9–MPK6 module was reported to play an important role in the regulation of the senescence process [43], in which MPK3/MPK6 could be activated by MKK9 to induce ethylene biosynthesis [56,57,58]. Furthermore, the endogenous GhMKK9 gene in cotton was silenced using VIGS. GhMKK9 gene-silenced plants were found to have enhanced drought tolerance compared with the control plants (CK), indicating that GhMKK9 may be involved in drought-stress-induced senescence in cotton. MKK9 is widely involved in the transmission of environmental signals, but its effects on plant stress tolerance remain controversial. For example, Yoo et al. [59] and Shen et al. [60] showed that AtMKK9 is a positive regulator of salt tolerance in Arabidopsis, which is contrary to the results reported by Alzwiy and Morris [61] and Xu et al. [56]. Similarly, although there is no obvious difference between WT and mkk9 mutant Arabidopsis plants under drought stress [61], this study shows that the silencing of GhMKK9 enhances drought tolerance in cotton. These discrepant results may be attributed to different experimental methods and functionally redundant genes [60].

4. Materials and Methods

4.1. Plant Materials

The association mapping panels consisted of 355 upland cotton accessions (Supplementary Table S6), and the germplasm resources were obtained from the Institute of Cotton Research of Chinese Academy of Agricultural Sciences (ICR-CAAS). These materials are geographically widespread across China, including in the Yellow River Region (YRR), the Yangtze River Region (YZRR), the Northwest Inland Region (NIR), and the Northern Specific Early-Maturity Region (NSER), and a few were from abroad (e.g., the United States) [62]. In 2016 and 2017, 355 upland cotton accessions were planted in Anyang (AY), Henan (36°08′ N, 114°48′ E), and Huanggang (HG), Hubei (31°14′ N, 114°78′ E), respectively. Three replicates were planted in each environment, except Anyang in 2017, where two replicates were used.

4.2. Phenotyping and Data Analysis

The relative chlorophyll level (SPAD) of association panels was measured with the chlorophyll meter SPAD-502 (Konica Minolta, Japan) in four environments in the flowering and boll-setting period (FBP) and boll-opening period (BOP). The third parietal leaf from the top was selected after topping to measure the chlorophyll level, and the average SPAD of at least three individuals for each accession was recorded. The absolute chlorophyll concentration of the materials planted in Anyang in 2017 was also measured. Three discs of 0.6 cm diameter were cut by punch from the third parietal leaf, and these leaf discs were mixed from at least three individuals for each accession. Chlorophyll concentration was estimated using the method described by Arnon [63]. Four chlorophyll concentration indices were obtained: chlorophyll a (Chla), chlorophyll b (Chlb), total chlorophyll (Total_ab), and chlorophyll a/b (Ratio_ab). In addition, the diurnal variation of chlorophyll content was calculated using the following formulae: D (%) = (chlorophyll content of BOP − chlorophyll content of FBP)/(chlorophyll content of BOP × days between FBP and BOP) × 100%, which included D_SPAD, D_chla, D_chlb, D_total_ab, and D_ratio_ab.
The best linear unbiased predictions (BLUPs) and broad-sense heritability (H2) of SPAD values in the four environments were calculated using the R package sommer [64]. Broad-sense heritability was defined as H2 = σg2/(σg2 + σgl2/l + σgy2/y + σe2/rly), where σg2 is the genotypic variance; σgl2 is the interactions of genotype with location; σgy2 is the interactions of genotype with year; σe2 is the error variance; and l, y, and r are the number of locations, years, and replications, respectively. Statistical and correlation analyses were performed using the R package Hmisc [65] and visualized using the package corrplot [66].

4.3. SNP Genotyping

The resequencing data of 355 upland cotton accessions were reported in a previous study [62]. The quality of paired-end reads from 355 accessions was evaluated using FastQC v.0.11.9 [67] and was controlled using Trimmomatic v.0.39 [68]. All high-quality clean reads were mapped to the Gossypium hirsutum v1.1 reference genome [69] with BWA mem v.0.7.17 [70]. The mapping results were sorted and converted to the BAM format using Picard tools (http://broadinstitute.github.io/picard). GATK v.4.1.8 [71] was used to detect variants following the best-practice workflows. High-quality SNPs were filtered with: “QD < 2.0 QUAL < 30.0 FS > 60.0 MQ < 40.0 MQRankSum < −12.5 ReadPosRankSum < −8.0”, missing rate < 50%, and MAF > 0.05.

4.4. GWAS and Identification of Genomic Regions

A linear mixed model was used to perform GWAS on 355 upland cotton accessions, implemented in the EMMAX software [38]. Before conducting the GWAS, the SNPs were imputed using Beagle v.5.1 [72]. Both trial values of the single environment and BLUPs were used for the GWAS. Because a high correlation between SNPs always leads to information redundancy, PLINK was used to detect the number of genome-wide, effective SNPs. The parameters for pruning were as follows: within a 500 bp sliding window, r2 ≥ 0.2, and a step of 100 bp. After pruning, 925,819 SNPs were obtained, and the genome-wide significance cutoff for GWAS was selected as p = 1 × 10⁻⁶ (1/925819). Significant SNPs were then determined using the following criteria: (1) p < 10−6 or (2) p < 10−5 in at least two environmental trail values owing to the stability. To identify senescence-related genomic regions (SGRs), we selected independent, significant SNPs (r2 < 0.6). If r2 > 0.1, the SNP with p < 10−3 and independent significant SNP were merged into the same genomic region. In addition, if the distance between two genomic regions was less than 900 kb, they were merged into one genomic region. The R packages CMplot [73], LDheatmap [74], and ggplot2 [75] were used to visualize the GWAS results.

4.5. Prediction of Candidate Genes

All genes located in SGRs were selected as putative candidate genes based on the Gossypium hirsutum v1.1 reference genome [69]. Homologs of these genes in Arabidopsis thaliana were determined using BLAST [76], and GO enrichment was performed on the database for annotation, visualization, and integrated discovery (DAVID) to identify enriched biological themes [77,78].

4.6. RNA Extraction and qRT-PCR

To determine the expression level of GhMKK9, the cotton accession “CRI 10” was planted in a greenhouse, and two-week-old (young) and eight-week-old (old) leaves were sampled from eight individuals with three biological replicates in each group. Total RNA was extracted using an RNA Purification Kit (Tiangen, Beijing, China), and the RNA was reverse transcribed using the PrimeScript RT Reagent Kit (TAKARA, Dalian, China) following the manufacturer’s instructions. Quantitative real-time PCR (qRT-PCR) was performed on a Roche Applied Science LightCycler 480 using the NovoStart® SYBR qPCR SuperMix Plus (Novoprotein, Shanghai, China). The qRT-PCR was conducted as follows: pre-denaturation at 95 °C for 60 s; 40 cycles of 95 °C for 20 s and 60 °C for 60 s. Three technical replicates were performed for each sample, and the relative expression of genes was calculated using the 2−ΔΔCt method [79]. The primers are listed in Supplementary Table S7.

4.7. VIGS

For the VIGS assays, one fragment of GhMKK9 amplified from the cDNA of “CRI 10” was integrated into the pTRV2 vector (pTRV2-GhMKK9) using the nimble cloning method [80] and then the recombinant vector was introduced into Agrobacterium tumefaciens GV3101. Agrobacterium strains harboring the pTRV2-GhMKK9 and pTRV2 (negative control) vectors combined with strains harboring the pTRV1 vector were co-transferred into the cotyledons of 2-week-old cotton plants following previously described methods [81]. The injected plants were kept in darkness for 24 h and transferred to a greenhouse at 25 °C with 16 h light/8 h dark cycle. Four weeks after injection, plants injected with pTRV2 and pTRV2-GhMKK9 were subjected to drought treatment, and SPAD values were determined. The primers used for the construction of the VIGS vector and qRT-PCR are listed in Supplementary Table S7.

4.8. Genetic Transformation of Arabidopsis Thaliana

The ORF of GhMKK9 was inserted into the binary expression vector pNC-Cam2304 to generate the 35S::GhMKK9 construct using the nimble cloning method [80]. The 35::GhMKK9 construct was introduced into Agrobacterium tumefaciens GV3101 and then transformed into Arabidopsis ecotype Columbia using the floral dip method [82]. The positive plants were screened out using 1/2 MS medium containing kanamycin (100 mg/L) and confirmed via qRT-PCR. The T3 homozygous generation plants were used for phenotypic observation of senescence. To observe the performance of transgenic plants under normal conditions, seeds of WT and two independent 35S::GhMKK9 lines (OE7 and OE14) were germinated on 1/2 MS agar medium. After two weeks, the seedlings were transplanted into the soil. Phenotypic characteristics were observed, and the rosette leaves at position six from six-week-old plants were sampled for qRT-PCR. Primers used for the construction of 35::GhMKK9 and qRT-PCR are listed in Supplementary Table S7. The primer specificity of GhMKK9 were confirmed (Supplementary Figure S8).

Supplementary Materials

The following supporting information can be downloaded at: https://www.mdpi.com/article/10.3390/ijms23158584/s1.

Author Contributions

Conceptualization, Q.L., Z.F. and S.Y.; methodology, Q.L. and L.L.; software, Q.L.; validation, Q.L., C.H. and J.W.; formal analysis, Q.L.; investigation, Q.L. and L.L.; resources, S.Y.; data curation, Q.L.; writing—original draft preparation, Q.L. and Z.F.; writing—review and editing, L.L.; visualization, Q.L.; supervision, Z.F.; project administration, Z.F.; funding acquisition, S.Y. All authors have read and agreed to the published version of the manuscript.

Funding

This research was sponsored by the Program for Research and Development of Zhejiang A&F University (2021LFR005).

Institutional Review Board Statement

Not applicable.

Informed Consent Statement

Not applicable.

Data Availability Statement

The datasets presented in this study can be found in online repositories. The names of the repository/repositories and accession number(s) can be found in the Supplementary Materials.

Acknowledgments

We would like to thank Pu Yan (Institute of Tropical Bioscience and Biotechnology, Chinese Academy of Tropical Agricultural Sciences) for providing the vectors.

Conflicts of Interest

The authors declare no conflict of interest.

References

  1. Shahrajabian, M.H.; Sun, W.; Cheng, Q. Considering White Gold, Cotton, for its Fiber, Seed Oil, Traditional and Modern Health Benefits. J. Biol. Environ. Sci. 2020, 14, 25–39. [Google Scholar]
  2. Gallagher, J.P.; Grover, C.E.; Rex, K.; Moran, M.; Wendel, J.F. A New Species of Cotton from Wake Atoll, Gossypium Stephensii (Malvaceae). Syst. Bot. 2017, 42, 115–123. [Google Scholar] [CrossRef] [Green Version]
  3. Grover, C.; Zhu, X.; Grupp, K.; Jareczek, J.; Gallagher, J.; Szadkowski, E.; Seijo, J.G.; Wendel, J. Molecular Confirmation of Species Status for the Allopolyploid Cotton Species, Gossypium Ekmanianum Wittmack. Genet. Resour. Crop Evol. 2015, 62, 103–114. [Google Scholar] [CrossRef] [Green Version]
  4. Fang, D.D.; Jenkins, J.N.; Deng, D.D.; McCarty, J.C.; Li, P.; Wu, J. Quantitative Trait Loci Analysis of Fiber Quality Traits Using a Random-Mated Recombinant Inbred Population in Upland Cotton (Gossypium hirsutum, L.). BMC Genom. 2014, 15, 397. [Google Scholar] [CrossRef] [Green Version]
  5. Hulse-Kemp, A.M.; Lemm, J.; Plieske, J.; Ashrafi, H.; Buyyarapu, R.; Fang, D.D.; Frelichowski, J.; Giband, M.; Hague, S.; Hinze, L.L.; et al. Development of a 63K SNP Array for Cotton and High-Density Mapping of Intraspecific and Interspecific Populations of Gossypium spp. G3 Genes Genomes Genet. 2015, 5, 1187–1209. [Google Scholar] [CrossRef] [Green Version]
  6. Chen, Y.; Dong, H. Mechanisms and Regulation of Senescence and Maturity Performance in Cotton. Field Crops Res. 2016, 189, 1–9. [Google Scholar] [CrossRef]
  7. Lim, P.O.; Kim, H.J.; Nam, H.G. Leaf Senescence. Annu. Rev. Plant Biol. 2007, 58, 115–136. [Google Scholar] [CrossRef] [Green Version]
  8. Guo, Y.; Ren, G.; Zhang, K.; Li, Z.; Miao, Y.; Guo, H. Leaf Senescence: Progression, Regulation, and Application. Mol. Hortic. 2021, 1, 1–25. [Google Scholar] [CrossRef]
  9. Diaz, C.; Saliba-Colombani, V.; Loudet, O.; Belluomo, P.; Moreau, L.; Daniel-Vedele, F.; Morot-Gaudry, J.F.; Masclaux-Daubresse, C. Leaf Yellowing and Anthocyanin Accumulation are Two Genetically Independent Strategies in Response to Nitrogen Limitation in Arabidopsis Thaliana. Plant Cell Physiol. 2006, 47, 74–83. [Google Scholar] [CrossRef] [Green Version]
  10. Woo, H.R.; Kim, H.J.; Lim, P.O.; Nam, H.G. Leaf Senescence: Systems and Dynamics Aspects. Annu. Rev. Plant Biol. 2019, 70, 347–376. [Google Scholar] [CrossRef] [Green Version]
  11. Woo, H.R.; Kim, H.J.; Nam, H.G.; Lim, P.O. Plant Leaf Senescence and Death—Regulation by Multiple Layers of Control and Implications for Aging in General. J. Cell Sci. 2013, 126, 4823–4833. [Google Scholar] [CrossRef] [Green Version]
  12. Jing, H.-C.; Schippers, J.H.; Hille, J.; Dijkwel, P.P. Ethylene-Induced Leaf Senescence Depends on Age-Related Changes and OLD Genes in Arabidopsis. J. Exp. Bot. 2005, 56, 2915–2923. [Google Scholar] [CrossRef]
  13. Zhang, K.; Xia, X.; Zhang, Y.; Gan, S.-S. An ABA-Regulated and Golgi-Localized Protein Phosphatase Controls Water Loss during Leaf Senescence in Arabidopsis. Plant J. 2012, 69, 667–678. [Google Scholar] [CrossRef]
  14. Piao, W.; Kim, S.-H.; Lee, B.-D.; An, G.; Sakuraba, Y.; Paek, N.-C. Rice Transcription Factor OsMYB102 Delays Leaf Senescence by Down-Regulating Abscisic Acid Accumulation and Signaling. J. Exp. Bot. 2019, 70, 2699–2715. [Google Scholar] [CrossRef]
  15. Zhang, Y.; Wang, Y.; Wei, H.; Li, N.; Tian, W.; Chong, K.; Wang, L. Circadian Evening Complex Represses Jasmonate-Induced Leaf Senescence in Arabidopsis. Mol. Plant 2018, 11, 326–337. [Google Scholar] [CrossRef] [Green Version]
  16. Zhang, Y.; Ji, T.-T.; Li, T.-T.; Tian, Y.-Y.; Wang, L.-F.; Liu, W.-C. Jasmonic Acid Promotes Leaf Senescence through MYC2-Mediated Repression of CATALASE2 Expression in Arabidopsis. Plant Sci. 2020, 299, 110604. [Google Scholar] [CrossRef]
  17. Zhang, M.; Su, J.; Zhang, Y.; Xu, J.; Zhang, S. Conveying Endogenous and Exogenous Signals: MAPK Cascades in Plant Growth and Defense. Cell Signal. Gene Regul. 2018, 45, 1–10. [Google Scholar] [CrossRef]
  18. Abdelkhalik, A.F.; Shishido, R.; Nomura, K.; Ikehashi, H. QTL-Based Analysis of Leaf Senescence in an Indica/Japonica Hybrid in Rice (Oryza sativa, L.). Theor. Appl. Genet. 2005, 110, 1226–1235. [Google Scholar] [CrossRef]
  19. Singh, U.M.; Sinha, P.; Dixit, S.; Abbai, R.; Venkateshwarlu, C.; Chitikineni, A.; Singh, V.K.; Varshney, R.K.; Kumar, A. Unraveling Candidate Genomic Regions Responsible for Delayed Leaf Senescence in Rice. PLoS ONE 2020, 15, e0240591. [Google Scholar] [CrossRef]
  20. Vijayalakshmi, K.; Fritz, A.K.; Paulsen, G.M.; Bai, G.; Pandravada, S.; Gill, B.S. Modeling and Mapping QTL for Senescence-Related Traits in Winter Wheat under High Temperature. Mol. Breed. 2010, 26, 163–175. [Google Scholar] [CrossRef]
  21. Bogard, M.; Jourdan, M.; Allard, V.; Martre, P.; Perretant, M.R.; Ravel, C.; Heumez, E.; Orford, S.; Snape, J.; Griffiths, S.; et al. Anthesis Date Mainly Explained Correlations between Post-Anthesis Leaf Senescence, Grain Yield, and Grain Protein Concentration in a Winter Wheat Population Segregating for Flowering Time QTLs. J. Exp. Bot. 2011, 62, 3621–3636. [Google Scholar] [CrossRef] [PubMed] [Green Version]
  22. Pinto, R.S.; Lopes, M.S.; Collins, N.C.; Reynolds, M.P. Modelling and Genetic Dissection of Staygreen under Heat Stress. Theor. Appl. Genet. 2016, 129, 2055–2074. [Google Scholar] [CrossRef] [PubMed] [Green Version]
  23. Chapman, E.A.; Orford, S.; Lage, J.; Griffiths, S. Capturing and Selecting Senescence Variation in Wheat. Front. Plant Sci. 2021, 12, 638738. [Google Scholar] [CrossRef] [PubMed]
  24. Wehner, G.G.; Balko, C.C.; Enders, M.M.; Humbeck, K.K.; Ordon, F.F. Identification of Genomic Regions Involved in Tolerance to Drought Stress and Drought Stress Induced Leaf Senescence in Juvenile Barley. BMC Plant Biol. 2015, 15, 125. [Google Scholar] [CrossRef] [Green Version]
  25. Zhang, J.; Fengler, K.A.; Van Hemert, J.L.; Gupta, R.; Mongar, N.; Sun, J.; Allen, W.B.; Wang, Y.; Weers, B.; Mo, H.; et al. Identification and Characterization of a Novel Stay-Green QTL That Increases Yield in Maize. Plant Biotechnol. J. 2019, 17, 2272–2285. [Google Scholar] [CrossRef]
  26. Xu, W.; Subudhi, P.K.; Crasta, O.R.; Rosenow, D.T.; Mullet, J.E.; Nguyen, H.T. Molecular Mapping of QTLs Conferring Stay-Green in Grain Sorghum (Sorghum Bicolor L. Moench). Genome 2000, 43, 461–469. [Google Scholar] [CrossRef]
  27. Sanchez, A.; Subudhi, P.; Rosenow, D.; Nguyen, H. Mapping QTLs Associated with Drought Resistance in Sorghum (Sorghum bicolor L. Moench). Plant Mol. Biol. 2002, 48, 713–726. [Google Scholar] [CrossRef]
  28. Harris, K.; Subudhi, P.; Borrell, A.; Jordan, D.; Rosenow, D.; Nguyen, H.; Klein, P.; Klein, R.; Mullet, J. Sorghum Stay-Green QTL Individually Reduce Post-Flowering Drought-Induced Leaf Senescence. J. Exp. Bot. 2007, 58, 327–338. [Google Scholar] [CrossRef] [Green Version]
  29. Kiranmayee, K.U.; Hash, C.T.; Sivasubramani, S.; Ramu, P.; Amindala, B.P.; Rathore, A.; Kishor, P.K.; Gupta, R.; Deshpande, S.P. Fine-Mapping of Sorghum Stay-Green QTL on Chromosome10 Revealed Genes Associated with Delayed Senescence. Genes 2020, 11, 1026. [Google Scholar] [CrossRef]
  30. Hurtado, P.X.; Schnabel, S.K.; Zaban, A.; Veteläinen, M.; Virtanen, E.; Eilers, P.H.; Van Eeuwijk, F.A.; Visser, R.G.; Maliepaard, C. Dynamics of Senescence-Related QTLs in Potato. Euphytica Neth. J. Plant Breed. 2012, 183, 289–302. [Google Scholar]
  31. Visscher, P.M.; Wray, N.R.; Zhang, Q.; Sklar, P.; McCarthy, M.I.; Brown, M.A.; Yang, J. 10 Years of GWAS Discovery: Biology, Function, and Translation. Am. J. Hum. Genet. 2017, 101, 5–22. [Google Scholar] [CrossRef] [Green Version]
  32. Kermanshahi, F.; Ghazizadeh, H.; Hussein, N.A.; Amerizadeh, F.; Samadi, S.; Tayefi, M.; Khodabandeh, A.K.; Moohebati, M.; Ebrahimi, M.; Esmaily, H.; et al. Association of a Genetic Variant in the AKT Gene Locus and Cardiovascular Risk Factors. Cell. Mol. Biol. 2020, 66, 57–64. [Google Scholar] [CrossRef]
  33. Shamari, A.-R.; Mehrabi, A.-A.; Maleki, A.; Rostami, A. Association Analysis of Tolerance to Dieback Phenomena and Trunk Form Using ISSR Markers in Quercus Brantii. Cell. Mol. Biol. 2018, 64, 116–124. [Google Scholar] [CrossRef] [Green Version]
  34. Akan, G.; Kisenge, P.; Sanga, T.S.; Mbugi, E.; Adolf, I.; Turkcan, M.K.; Janabi, M.; Atalar, F. Common SNP-Based Haplotype Analysis of the 9p21. 3 Gene Locus as Predictor Coronary Artery Disease in Tanzanian Population. Cell. Mol. Biol. 2019, 65, 33–43. [Google Scholar] [CrossRef]
  35. Zhao, Y.; Qiang, C.; Wang, X.; Chen, Y.; Deng, J.; Jiang, C.; Sun, X.; Chen, H.; Li, J.; Piao, W.; et al. New Alleles for Chlorophyll Content and Stay-Green Traits Revealed by a Genome Wide Association Study in Rice (Oryza sativa). Sci. Rep. 2019, 9, 1–11. [Google Scholar] [CrossRef] [Green Version]
  36. Sekhon, R.S.; Saski, C.; Kumar, R.; Flinn, B.S.; Luo, F.; Beissinger, T.M.; Ackerman, A.J.; Breitzman, M.W.; Bridges, W.C.; de Leon, N.; et al. Integrated Genome-Scale Analysis Identifies Novel Genes and Networks Underlying Senescence in Maize. Plant Cell 2019, 31, 1968–1989. [Google Scholar] [CrossRef] [Green Version]
  37. Liu, Q.; Li, L.; Feng, Z.; Yu, S. Uncovering Novel Genomic Regions and Candidate Genes for Senescence-Related Traits by Genome-Wide Association Studies in Upland Cotton (Gossypium hirsutum L.). Front. Plant Sci. 2021, 12, 809522. [Google Scholar] [CrossRef]
  38. Kang, H.M.; Sul, J.H.; Service, S.K.; Zaitlen, N.A.; Kong, S.; Freimer, N.B.; Sabatti, C.; Eskin, E. Variance Component Model to Account for Sample Structure in Genome-Wide Association Studies. Nat. Genet. 2010, 42, 348–354. [Google Scholar] [CrossRef] [Green Version]
  39. Maurano, M.T.; Humbert, R.; Rynes, E.; Thurman, R.E.; Haugen, E.; Wang, H.; Reynolds, A.P.; Sandstrom, R.; Qu, H.; Brody, J.; et al. Systematic Localization of Common Disease-Associated Variation in Regulatory DNA. Science 2012, 337, 1190–1195. [Google Scholar] [CrossRef] [Green Version]
  40. Overmyer, K.; Tuominen, H.; Kettunen, R.; Betz, C.; Langebartels, C.; Sandermann, H., Jr.; Kangasjärvi, J. Ozone-Sensitive Arabidopsis Rcd1 Mutant Reveals Opposite Roles for Ethylene and Jasmonate Signaling Pathways in Regulating Superoxide-Dependent Cell Death. Plant Cell 2000, 12, 1849–1862. [Google Scholar] [CrossRef] [Green Version]
  41. Overmyer, K.; Brosché, M.; Pellinen, R.; Kuittinen, T.; Tuominen, H.; Ahlfors, R.; Keinänen, M.; Saarma, M.; Scheel, D.; Kangasjärvi, J. Ozone-Induced Programmed Cell Death in the Arabidopsis Radical-Induced Cell Death1 Mutant. Plant Physiol. 2005, 137, 1092–1104. [Google Scholar] [CrossRef] [Green Version]
  42. Chini, A.; Fonseca, S.; Chico, J.M.; Fernández-Calvo, P.; Solano, R. The ZIM Domain Mediates Homo-and Heteromeric Interactions between Arabidopsis JAZ Proteins. Plant J. 2009, 59, 77–87. [Google Scholar] [CrossRef]
  43. Zhou, C.; Cai, Z.; Guo, Y.; Gan, S. An Arabidopsis Mitogen-Activated Protein Kinase Cascade, MKK9-MPK6, Plays a Role in Leaf Senescence. Plant Physiol. 2009, 150, 167–177. [Google Scholar] [CrossRef] [Green Version]
  44. Noh, Y.-S.; Amasino, R.M. Identification of a Promoter Region Responsible for the Senescence-Specific Expression of SAG12. Plant Mol. Biol. 1999, 41, 181–194. [Google Scholar] [CrossRef]
  45. Xiao, S.; Dai, L.; Liu, F.; Wang, Z.; Peng, W.; Xie, D. COS1: An Arabidopsis coronatine insensitive1 Suppressor Essential for Regulation of Jasmonate-Mediated Plant Defense and Senescence. Plant Cell 2004, 16, 1132–1142. [Google Scholar] [CrossRef] [Green Version]
  46. Zimmermann, P.; Heinlein, C.; Orendi, G.; Zentgraf, U. Senescence-Specific Regulation of Catalases in Arabidopsis thaliana (L.) Heynh. Plant Cell Environ. 2006, 29, 1049–1060. [Google Scholar] [CrossRef]
  47. Wang, C.; Li, T.; Liu, Q.; Li, L.; Feng, Z.; Yu, S. Characterization and Functional Analysis of GhNAC82, A NAM Domain Gene, Coordinates the Leaf Senescence in Upland Cotton (Gossypium hirsutum L.). Plants 2022, 11, 1491. [Google Scholar] [CrossRef]
  48. Schippers, J.H.; Schmidt, R.; Wagstaff, C.; Jing, H.-C. Living to Die and Dying to Live: The Survival Strategy behind Leaf Senescence. Plant Physiol. 2015, 169, 914–930. [Google Scholar] [CrossRef] [Green Version]
  49. Watanabe, K.; Taskesen, E.; Van Bochoven, A.; Posthuma, D. Functional Mapping and Annotation of Genetic Associations with FUMA. Nat. Commun. 2017, 8, 1–11. [Google Scholar] [CrossRef] [Green Version]
  50. Guo, Y.; Gan, S. Leaf Senescence: Signals, Execution, and Regulation. Curr. Top. Dev. Biol. 2005, 71, 83–112. [Google Scholar] [CrossRef] [PubMed]
  51. Zhang, T.; Hu, Y.; Jiang, W.; Fang, L.; Guan, X.; Chen, J.; Zhang, J.; Saski, C.A.; Scheffler, B.E.; Stelly, D.M.; et al. Sequencing of Allotetraploid Cotton (Gossypium hirsutum L. Acc. TM-1) Provides a Resource for Fiber Improvement. Nat. Biotechnol. 2015, 33, 531–537. [Google Scholar] [CrossRef] [PubMed] [Green Version]
  52. Ichimura, K.; Shinozaki, K.; Tena, G.; Sheen, J.; Henry, Y.; Champion, A.; Kreis, M.; Zhang, S.; Hirt, H.; Wilson, C.; et al. Mitogen-Activated Protein Kinase Cascades in Plants: A New Nomenclature. Trends Plant Sci. 2002, 7, 301–308. [Google Scholar] [CrossRef]
  53. Widmann, C.; Gibson, S.; Jarpe, M.B.; Johnson, G.L. Mitogen-Activated Protein Kinase: Conservation of a Three-Kinase Module from Yeast to Human. Physiol. Rev. 1999, 79, 143–180. [Google Scholar] [CrossRef] [PubMed]
  54. Zhang, M.; Zhang, S. Mitogen-Activated Protein Kinase Cascades in Plant Signaling. J. Integr. Plant Biol. 2022, 64, 301–341. [Google Scholar] [CrossRef]
  55. Yin, Z.; Zhu, W.; Zhang, X.; Chen, X.; Wang, W.; Lin, H.; Wang, J.; Ye, W. Molecular Characterization, Expression and Interaction of MAPK, MAPKK and MAPKKK Genes in Upland Cotton. Genomics 2021, 113, 1071–1086. [Google Scholar] [CrossRef]
  56. Xu, J.; Li, Y.; Wang, Y.; Liu, H.; Lei, L.; Yang, H.; Liu, G.; Ren, D. Activation of MAPK Kinase 9 Induces Ethylene and Camalexin Biosynthesis and Enhances Sensitivity to Salt Stress in Arabidopsis. J. Biol. Chem. 2008, 283, 26996–27006. [Google Scholar] [CrossRef] [Green Version]
  57. Chen, J.; Zhang, Q.; Wang, Q.; Feng, M.; Li, Y.; Meng, Y.; Zhang, Y.; Liu, G.; Ma, Z.; Wu, H.; et al. RhMKK9, a Rose MAP KINASE KINASE Gene, Is Involved in Rehydration-Triggered Ethylene Production in Rose Gynoecia. BMC Plant Biol. 2017, 17, 51. [Google Scholar] [CrossRef] [Green Version]
  58. Meng, Y.; Ma, N.; Zhang, Q.; You, Q.; Li, N.; Ali Khan, M.; Liu, X.; Wu, L.; Su, Z.; Gao, J. Precise Spatio-Temporal Modulation of ACC Synthase by MPK 6 Cascade Mediates the Response of Rose Flowers to Rehydration. Plant J. 2014, 79, 941–950. [Google Scholar] [CrossRef]
  59. Yoo, S.-D.; Cho, Y.-H.; Tena, G.; Xiong, Y.; Sheen, J. Dual Control of Nuclear EIN3 by Bifurcate MAPK Cascades in C2H4 Signalling. Nature 2008, 451, 789–795. [Google Scholar] [CrossRef]
  60. Shen, L.; Zhuang, B.; Wu, Q.; Zhang, H.; Nie, J.; Jing, W.; Yang, L.; Zhang, W. Phosphatidic Acid Promotes the Activation and Plasma Membrane Localization of MKK7 and MKK9 in Response to Salt Stress. Plant Sci. 2019, 287, 110190. [Google Scholar] [CrossRef]
  61. Alzwiy, I.A.; Morris, P.C. A Mutation in the Arabidopsis MAP Kinase Kinase 9 Gene Results in Enhanced Seedling Stress Tolerance. Plant Sci. 2007, 173, 302–308. [Google Scholar] [CrossRef]
  62. Li, L.; Zhang, C.; Huang, J.; Liu, Q.; Wei, H.; Wang, H.; Liu, G.; Gu, L.; Yu, S. Genomic Analyses Reveal the Genetic Basis of Early Maturity and Identification of Loci and Candidate Genes in Upland Cotton (Gossypium hirsutum L.). Plant Biotechnol. J. 2021, 19, 109–123. [Google Scholar] [CrossRef]
  63. Arnon, D.I. Copper Enzymes in Isolated Chloroplasts. Polyphenoloxidase in Beta Vulgaris. Plant Physiol. 1949, 24, 1. [Google Scholar] [CrossRef] [Green Version]
  64. Zhang, B.; Tieman, D.M.; Jiao, C.; Xu, Y.; Chen, K.; Fei, Z.; Giovannoni, J.J.; Klee, H.J. Chilling-Induced Tomato Flavor Loss Is Associated with Altered Volatile Synthesis and Transient Changes in DNA Methylation. Proc. Natl. Acad. Sci. USA 2016, 113, 12580–12585. [Google Scholar] [CrossRef] [Green Version]
  65. Harrell, F.E.; Dupont, C. Hmisc: Harrell Miscellaneous, Version 4.5-0. 2021. Available online: https://cran.r-project.org/package=Hmisc (accessed on 1 December 2021).
  66. Wei, T.; Simko, V. R Package “Corrplot”: Visualization of a Correlation Matrix, Version 0.84. 2021. Available online: https://githubcom/taiyun/corrplot (accessed on 3 January 2022).
  67. Andrews, S. FastQC: A Quality Control Tool for High Throughput Sequence Data; Babraham Institute: Cambridge, UK, 2010; Available online: http://www.bioinformatics.babraham.ac.uk/projects/fastqc (accessed on 15 March 2021).
  68. Bolger, A.M.; Lohse, M.; Usadel, B. Trimmomatic: A Flexible Trimmer for Illumina Sequence Data. Bioinformatics 2014, 30, 2114–2120. [Google Scholar] [CrossRef] [Green Version]
  69. Chen, Z.J.; Sreedasyam, A.; Ando, A.; Song, Q.; De Santiago, L.M.; Hulse-Kemp, A.M.; Ding, M.; Ye, W.; Kirkbride, R.C.; Jenkins, J.; et al. Genomic Diversifications of Five Gossypium Allopolyploid Species and Their Impact on Cotton Improvement. Nat. Genet. 2020, 52, 525–533. [Google Scholar] [CrossRef] [Green Version]
  70. Li, H. Aligning Sequence Reads, Clone Sequences and Assembly Contigs with BWA-MEM. arXiv 2013, arXiv:13033997. [Google Scholar]
  71. Van der Auwera, G.A.; O’Connor, B.D. Genomics in the Cloud: Using Docker, GATK, and WDL in Terra; O’Reilly Media: Sebastopol, CA, USA, 2020. [Google Scholar]
  72. Browning, B.L.; Zhou, Y.; Browning, S.R. A One-Penny Imputed Genome from next-Generation Reference Panels. Am. J. Hum. Genet. 2018, 103, 338–348. [Google Scholar] [CrossRef] [Green Version]
  73. Yin, L.; Zhang, H.; Tang, Z.; Xu, J.; Yin, D.; Zhang, Z.; Yuan, X.; Zhu, M.; Zhao, S.; Li, X.; et al. RMVP: A Memory-Efficient, Visualization-Enhanced, and Parallel-Accelerated Tool for Genome-Wide Association Study. Genom. Proteom. Bioinform. 2021, 19, 618–628. [Google Scholar] [CrossRef]
  74. Shin, J.-H.; Blay, S.; McNeney, B.; Graham, J. LDheatmap: An r Function for Graphical Display of Pairwise Linkage Disequilibria between Single Nucleotide Polymorphisms. J. Stat. Softw. 2006, 16, 1–9. [Google Scholar] [CrossRef] [Green Version]
  75. Wickham, H. Ggplot2: Elegant Graphics for Data Analysis; Springer: New York, NY, USA, 2016. [Google Scholar]
  76. Camacho, C.; Coulouris, G.; Avagyan, V.; Ma, N.; Papadopoulos, J.; Bealer, K.; Madden, T.L. BLAST+: Architecture and Applications. BMC Bioinform. 2009, 10, 421. [Google Scholar] [CrossRef] [PubMed] [Green Version]
  77. Huang, D.W.; Sherman, B.T.; Lempicki, R.A. Systematic and Integrative Analysis of Large Gene Lists Using DAVID Bioinformatics Resources. Nat. Protoc. 2009, 4, 44–57. [Google Scholar] [CrossRef] [PubMed]
  78. Huang, D.W.; Sherman, B.T.; Lempicki, R.A. Bioinformatics Enrichment Tools: Paths toward the Comprehensive Functional Analysis of Large Gene Lists. Nucleic Acids Res. 2009, 37, 1–13. [Google Scholar] [CrossRef] [PubMed] [Green Version]
  79. Livak, K.J.; Schmittgen, T.D. Analysis of Relative Gene Expression Data Using Real-Time Quantitative PCR and the 2−ΔΔCT Method. Methods 2001, 25, 402–408. [Google Scholar] [CrossRef]
  80. Yan, P.; Zeng, Y.; Shen, W.; Tuo, D.; Li, X.; Zhou, P. Nimble Cloning: A Simple, Versatile, and Efficient System for Standardized Molecular Cloning. Front. Bioeng. Biotechnol. 2020, 7, 460. [Google Scholar] [CrossRef]
  81. Gao, X.; Britt Jr, R.C.; Shan, L.; He, P. Agrobacterium-Mediated Virus-Induced Gene Silencing Assay in Cotton. J. Vis. Exp. JoVE 2011, 54, 2938. [Google Scholar] [CrossRef] [Green Version]
  82. Bent, A. Arabidopsis Thaliana Floral Dip Transformation Method. Agrobacterium Protoc. 2006, 343, 87–104. [Google Scholar] [CrossRef]
Figure 1. Frequency distributions of the mean values of SPAD. (A) The mean value of SPAD in the FBP period. (B) The mean value of SPAD in the BOP period. (C) The mean value of diurnal variation of SPAD.
Ijms 23 08584 g001
Figure 2. GO enrichment analysis of candidate genes associated with cotton senescence.
Ijms 23 08584 g002
Figure 3. GWAS identification of candidate gene in the SGR36. (A) Manhattan plot (upper) and LD heat map (lower) of SGR36. (B) Gene structure and haplotypes of the candidate gene GhMKK9. (C) Phenotypes of different haplotypes. There are 158 accessions for Hap1 and 197 accessions for Hap2. Asterisks indicate significance levels (*** p < 0.001); ns, not significant.
Ijms 23 08584 g003
Figure 4. Functional analysis of the candidate gene GhMKK9. (A) Expression of GhMKK9 in young and old cotton leaves by qRT-PCR. (B) Phenotypes of empty control (CK) and VIGS cotton plants (pTRV2-GhMKK9) under drought stress. After four weeks, the CK and VIGS cotton plants were treated with water shortage for 7 days. (C) Expression levels of GhMKK9 in the CK and VIGS cotton plants. (D) SPAD value of the CK and VIGS plants under drought stress. (E) Phenotypes of six-week-old WT and transgenic Arabidopsis plants (OE7 and OE14). (F) Expression levels of GhMKK9 in the WT and transgenic Arabidopsis plants. (G,H) Expression levels of senescence-marked genes AtSAG12 and AtCAT2 in the WT and transgenic Arabidopsis plants. Asterisks indicate significance levels (*** p < 0.001, ** p < 0.01, and * p < 0.05).
Ijms 23 08584 g004
Figure 5. Distribution of senescence-related genomic regions at chromosomes from this and previous studies. Red vertical bars represent genomic regions from this study. Blue vertical bars represent genomic regions from previous study. Black triangles indicate SGRs located within ~1 Mb of the genomic regions reported by previous study.
Ijms 23 08584 g005
Table 1. Summary of senescence-related genomic regions.
SGRChrStart (bp)End (bp)Trait
SGR1A01115,568,753115,568,865Ratio_ab_FBP
SGR2A026,556,3046,653,102SPAD_BOP_AY17, D_SPAD_blup, D_SPAD_AY17
SGR3A02155,73,34015,573,343D_total_ab, D_chla
SGR4A0282,886,74882,925,332SPAD_BOP_AY16, D_SPAD_AY16
SGR5A035,877,9266,672,551D_SPAD_blup, SPAD_BOP_AY17
SGR6A0382,626,80684,562,267SPAD_BOP_AY16, D_SPAD_AY16
SGR7A03113,682,897113,683,008SPAD_BOP_AY16, D_SPAD_AY16
SGR8A0469,311,01769,315,686Ratio_ab_BOP
SGR9A059,695,6149,695,614Ratio_ab_FBP
SGR10A0531,628,90031,628,910SPAD_BOP_AY17, D_SPAD_AY17
SGR11A0561,940,85461,940,864D_chlb, D_ratio_ab
SGR12A061,128,3962,179,285Chlb_BOP, D_chlb, Total_ab_BOP,
Ratio_ab_BOP, D_ratio_ab
SGR13A0649,902,38249,941,259D_ratio_ab, D_chla, D_total_ab, Chla_BOP,
Total_ab_BOP
SGR14A0661,589,69361,589,748Ratio_ab_FBP
SGR15A0663,390,76863,390,795D_chla, Chla_BOP, Total_ab_BOP
SGR16A06113,048,017115,046,117D_SPAD_HG17, Ratio_ab_BOP
SGR17A0712,602,25712,602,280SPAD_BOP_AY17, D_SPAD_AY17
SGR18A0761,313,63161,313,636Chla_BOP, Total_ab_BOP
SGR19A0818,726,39318,727,072D_SPAD_AY16, SPAD_BOP_AY16
SGR20A0848,942,30050,338,088SPAD_BOP_AY17, D_SPAD_AY17
SGR21A0885,414,25985,415,664Ratio_ab_BOP, D_SPAD_HG17
SGR22A0940,190,61240,190,642D_SPAD_AY17, D_SPAD_blup
SGR23A0971,543,57871,543,578Ratio_ab_FBP
SGR24A0983,855,28384,822,913D_SPAD_AY16, SPAD_BOP_AY16
SGR25A105,521,6945,526,321D_SPAD_AY16, SPAD_BOP_AY16
SGR26A1027,875,32028,364,565BOP_blup, D_SPAD_blup
SGR27A1092,752,43692,766,905SPAD_FBP_HG16, Ratio_ab_FBP
SGR28A115,387,1305,588,967D_SPAD_blup, D_SPAD_AY17, SPAD_BOP_AY17
SGR29A11106,469,948106,477,914D_SPAD_AY16, SPAD_BOP_AY16
SGR30A124,116,2054,126,358Chlb_FBP, Total_ab_FBP
SGR31A1210,742,82910,742,829FBP_blup
SGR32A1212,591,09512,594,279D_SPAD_blup, D_SPAD_AY17, SPAD_BOP_AY17
SGR33A1257,300,05457,307,338D_SPAD_AY16, SPAD_BOP_AY16
SGR34A1262,551,48862,556,405D_ratio_ab, D_ratio_ab
SGR35A1270,740,47470,740,474D_SPAD_blup, D_ratio_ab, D_SPAD_AY17
SGR36A12108,514,660108,934,586SPAD_BOP_AY17, D_SPAD_AY17, D_SPAD_blup
SGR37A1377,580,82277,580,838BOP_blup, SPAD_BOP_AY16
SGR38D0151,414,83951,415,298BOP_blup, D_SPAD_blup
SGR39D0157,675,35357,675,364Ratio_ab_FBP, Chla_FBP
SGR40D0160,671,10760,671,202D_SPAD_blup, D_SPAD_AY17
SGR41D0223,837,46323,837,463Ratio_ab_FBP
SGR42D0232,314,48032,314,480D_SPAD_AY17, SPAD_BOP_AY17
SGR43D0267,476,21367,476,218D_ratio_ab
SGR44D0655,810,68956,177,650Ratio_ab_BOP, D_ratio_ab, D_SPAD_HG17
SGR45D07510,384510,546Ratio_ab_BOP
SGR46D0710,915,96411,432,705SPAD_FBP_HG17, SPAD_FBP_HG17
SGR47D0726,125,29726,125,366Ratio_ab_FBP, D_ratio_ab, Chlb_FBP
SGR48D0843,939,10443,939,104Chlb_FBP
SGR49D1065,317,19267,265,400SPAD_BOP_AY17, BOP_blup, D_SPAD_AY17, FBP_blup, SPAD_FBP_HG16
SGR50D119,657,00910,060,413FBP_blup, SPAD_FBP_HG16
SGR51D1223,540,47123,540,583D_SPAD_AY16
SGR52D1237,359,37941,685,124D_total_ab, Chla_BOP, BOP_blup, SPAD_BOP_HG16, SPAD_FBP_HG16
SGR53D1255,716,43356,755,391Ratio_ab_BOP, D_ratio_ab
SGR54D1326,198,78126,198,804D_SPAD_AY17, SPAD_BOP_AY17
SGR55D1364,827,39064,827,424Ratio_ab_FBP
SGR: senescence-related genomic region; Chr: chromosome.
Publisher’s Note: MDPI stays neutral with regard to jurisdictional claims in published maps and institutional affiliations.

