Article

Metabolic Effects of the Waist-To-Hip Ratio Associated Locus GRB14/COBLL1 Are Related to GRB14 Expression in Adipose Tissue

1
Medical Department III—Endocrinology, Nephrology, Rheumatology, University of Leipzig Medical Center, 04103 Leipzig, Germany
2
Clinic for Visceral, Transplantation and Thorax and Vascular Surgery, University Hospital Leipzig, 04103 Leipzig, Germany
3
Departement of Obesity and Metabolic Surgery, SRH Wald-Klinikum Gera Str.d. Friedens 122, 07548 Gera, Germany
4
Städtisches Klinikum Karlsruhe, Clinic of Visceral Surgery, 76133 Karlsruhe, Germany
5
Municipal Clinic Dresden-Neustadt, 01129 Dresden, Germany
6
Helmholtz Institute for Metabolic, Obesity and Vascular Research (HI-MAG) of the Helmholtz Zentrum München at the University of Leipzig and University Hospital Leipzig, 04103 Leipzig, Germany
7
Deutsches Zentrum für Diabetesforschung e.V., 85764 Neuherberg, Germany
*
Author to whom correspondence should be addressed.
These authors contributed equally to this work and share first authorship.
These authors contributed equally to this work and share last authorship.
Int. J. Mol. Sci. 2022, 23(15), 8558; https://doi.org/10.3390/ijms23158558
Submission received: 8 July 2022 / Revised: 27 July 2022 / Accepted: 28 July 2022 / Published: 2 August 2022

Abstract

:
GRB14/COBLL1 locus has been shown to be associated with body fat distribution (FD), but neither the causal gene nor its role in metabolic diseases has been elucidated. We hypothesize that GRB14/COBLL1 may act as the causal genes for FD-related SNPs (rs10195252 and rs6738627), and that they may be regulated by SNP to effect obesity-related metabolic traits. We genotyped rs10195252 and rs6738627 in 2860 subjects with metabolic phenotypes. In a subgroup of 560 subjects, we analyzed GRB14/COBLL1 gene expression in paired visceral and subcutaneous adipose tissue (AT) samples. Mediation analyses were used to determine the causal relationship between SNPs, AT GRB14/COBLL1 mRNA expression, and obesity-related traits. In vitro gene knockdown of Grb14/Cobll1 was used to test their role in adipogenesis. Both gene expressions in AT are correlated with waist circumference. Visceral GRB14 mRNA expression is associated with FPG and HbA1c. Both SNPs are associated with triglycerides, FPG, and leptin levels. Rs10195252 is associated with HbA1c and seems to be mediated by visceral AT GRB14 mRNA expression. Our data support the role of the GRB14/COBLL1 gene expression in body FD and its locus in metabolic sequelae: in particular, lipid metabolism and glucose homeostasis, which is likely mediated by AT GRB14 transcript levels.

Graphical Abstract

1. Introduction

The prevalence of obesity worldwide has increased dramatically, and intervention efforts for weight loss, including calorie restriction and increased physical activity, have only been able to counteract this trend to a small extent [1]. Despite recent advances, the underlying mechanisms making some individuals more susceptible to obesity and related comorbidities remain unknown. Many studies clearly support the role of genetics in obesity and adverse body FD, which has been acknowledged as a major predictor of obesity-associated metabolic sequelae [2,3,4,5].
Heid et al. performed meta-GWAS for waist–hip ratio (WHR) in 2010, which revealed the single nucleotide polymorphism (SNP) rs10195252 located near the Growth Factor Receptor-Bound Protein 14 (GRB14) gene with evident sexual dimorphism [6]. In this case, the association with WHR was more pronounced in women, and the T-allele carriers had increased GRB14 expression in subcutaneous (sc) and omental adipose tissue (AT). In addition, an association with triglycerides (TG), insulin levels, and high-density (HDL) cholesterol was reported [6,7]. Shungin et al. proposed GRB14, but also Cordon-Bleu WH2 Repeat Protein Like 1 (COBLL1) as potential candidate gene affected by the WHR-associated SNPs in 2015 [8]. Similar to GRB14, the SNP mapping within the COBLL1 gene showed marked sexual dimorphism, with stronger effects on WHR in women. Moreover, another GWAS meta-analysis reported that rs6738627 located in COBLL1 and nearby GRB14 had larger effects on body fat percentage than on BMI, suggesting a specific effect on adiposity rather than total body mass [9]. Interestingly, rs6738627 is in high LD (r2 = 0.81) with the WHR-associated rs10195252. Thus, based on the concomitant and directionally consistent associations with insulin-resistance-related traits and plausible mechanisms of action, the COBLL1/GRB14 locus has become particularly attractive for follow up on potential target genes explaining the association of SNPs within this locus with WHR [10].
GRB14 inhibits insulin receptor (IR) signaling [11] and, consequently, the phosphorylation of downstream signaling peptides like protein kinase B (PKB, also called AKT) or extracellular signal-regulated kinase (ERK) [12,13]. Furthermore, a drastic decrease in insulin induced processing and expression of sterol regulatory element-binding protein 1c (SREBP-1c) was reported as a consequence of Grb14 knock-down in murine primary hepatocytes in 2008 [14]. COBLL1 has not been extensively investigated so far. It has been proposed to be involved in the development of neural tubes [15] and has been reported to be associated with several types of cancers [16,17]. Chen et al. showed that GRB14 knock-out resulted in decreased differentiation efficiency and proliferation rate, along with reduced lipid storage, and COBLL1 knock-out caused excessive lipid storage and lipolysis but did not affect adipogenesis or insulin-stimulated AKT2 phosphorylation in human preadipocytes [18].
Given the robustly replicated SNP associations with WHR, waist and hip circumference and body fat percentage, as well as the known physiological function of GRB14 and COBLL1, we measured the expression of these genes in human visceral (vis) and sc AT and analyzed their correlations with obesity-related metabolic traits. Furthermore, we investigated their functional relevance in adipogenesis in vitro and tested the causal relationship between genetic variants and metabolic traits.

2. Results

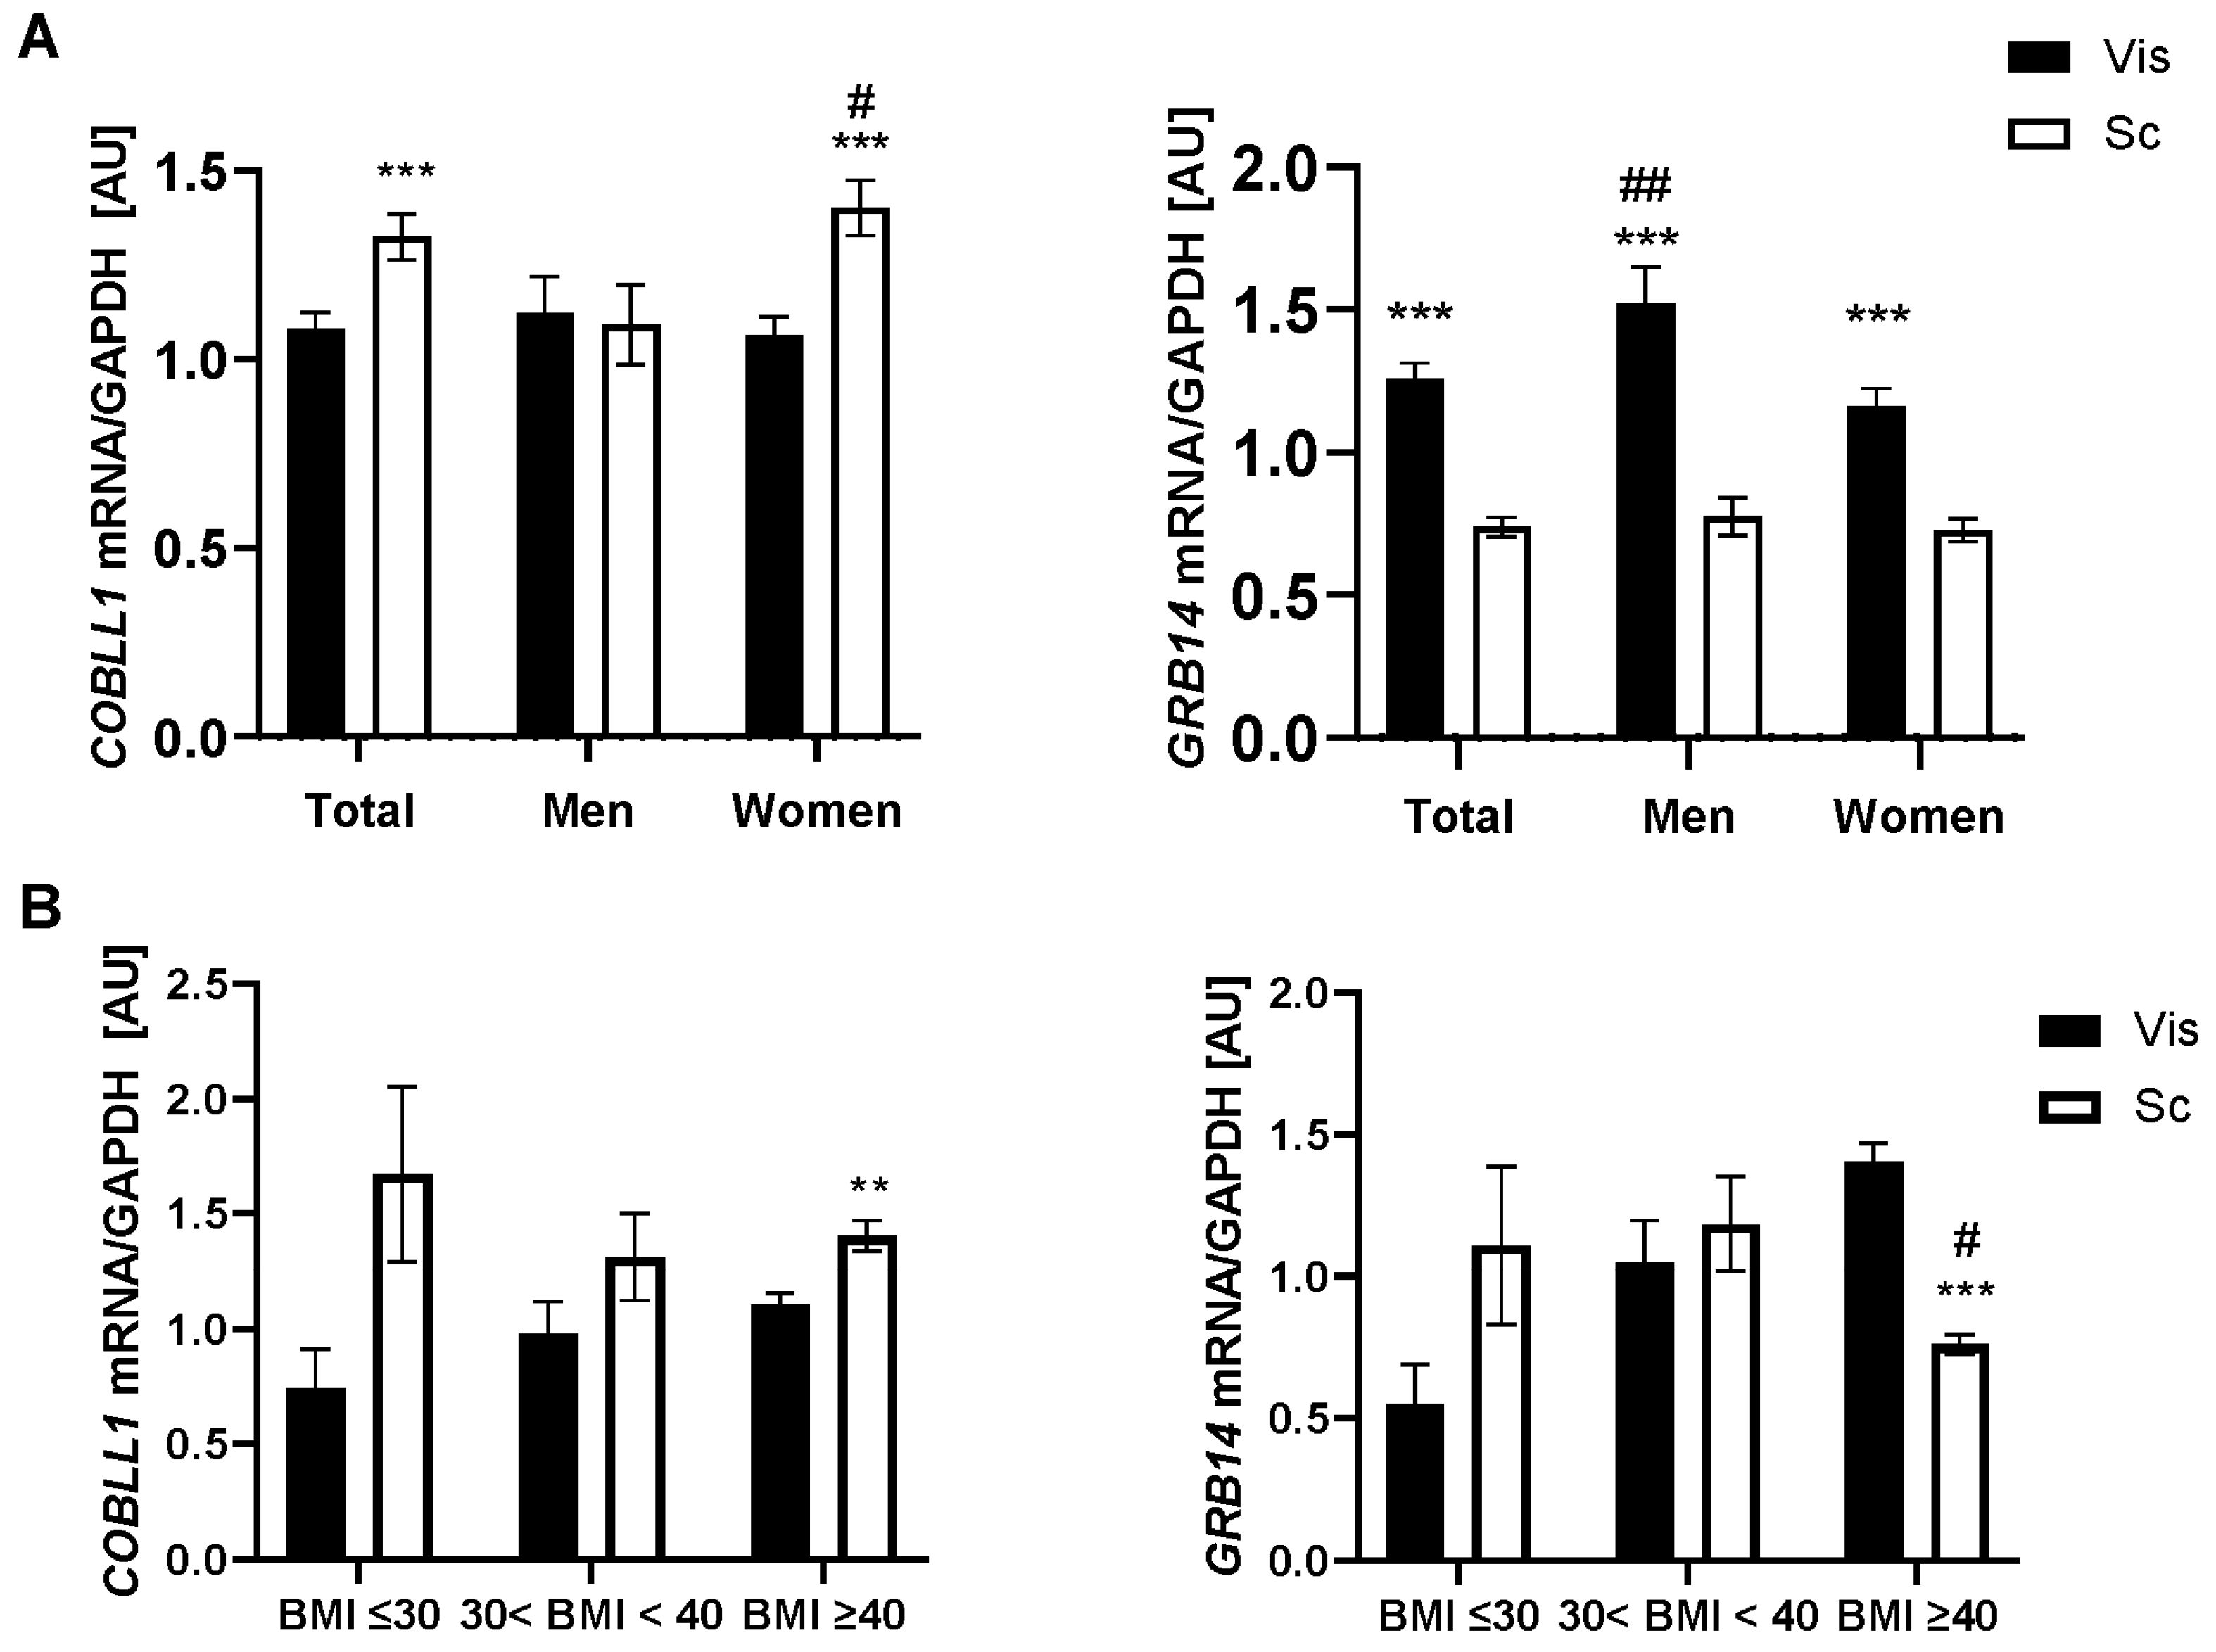
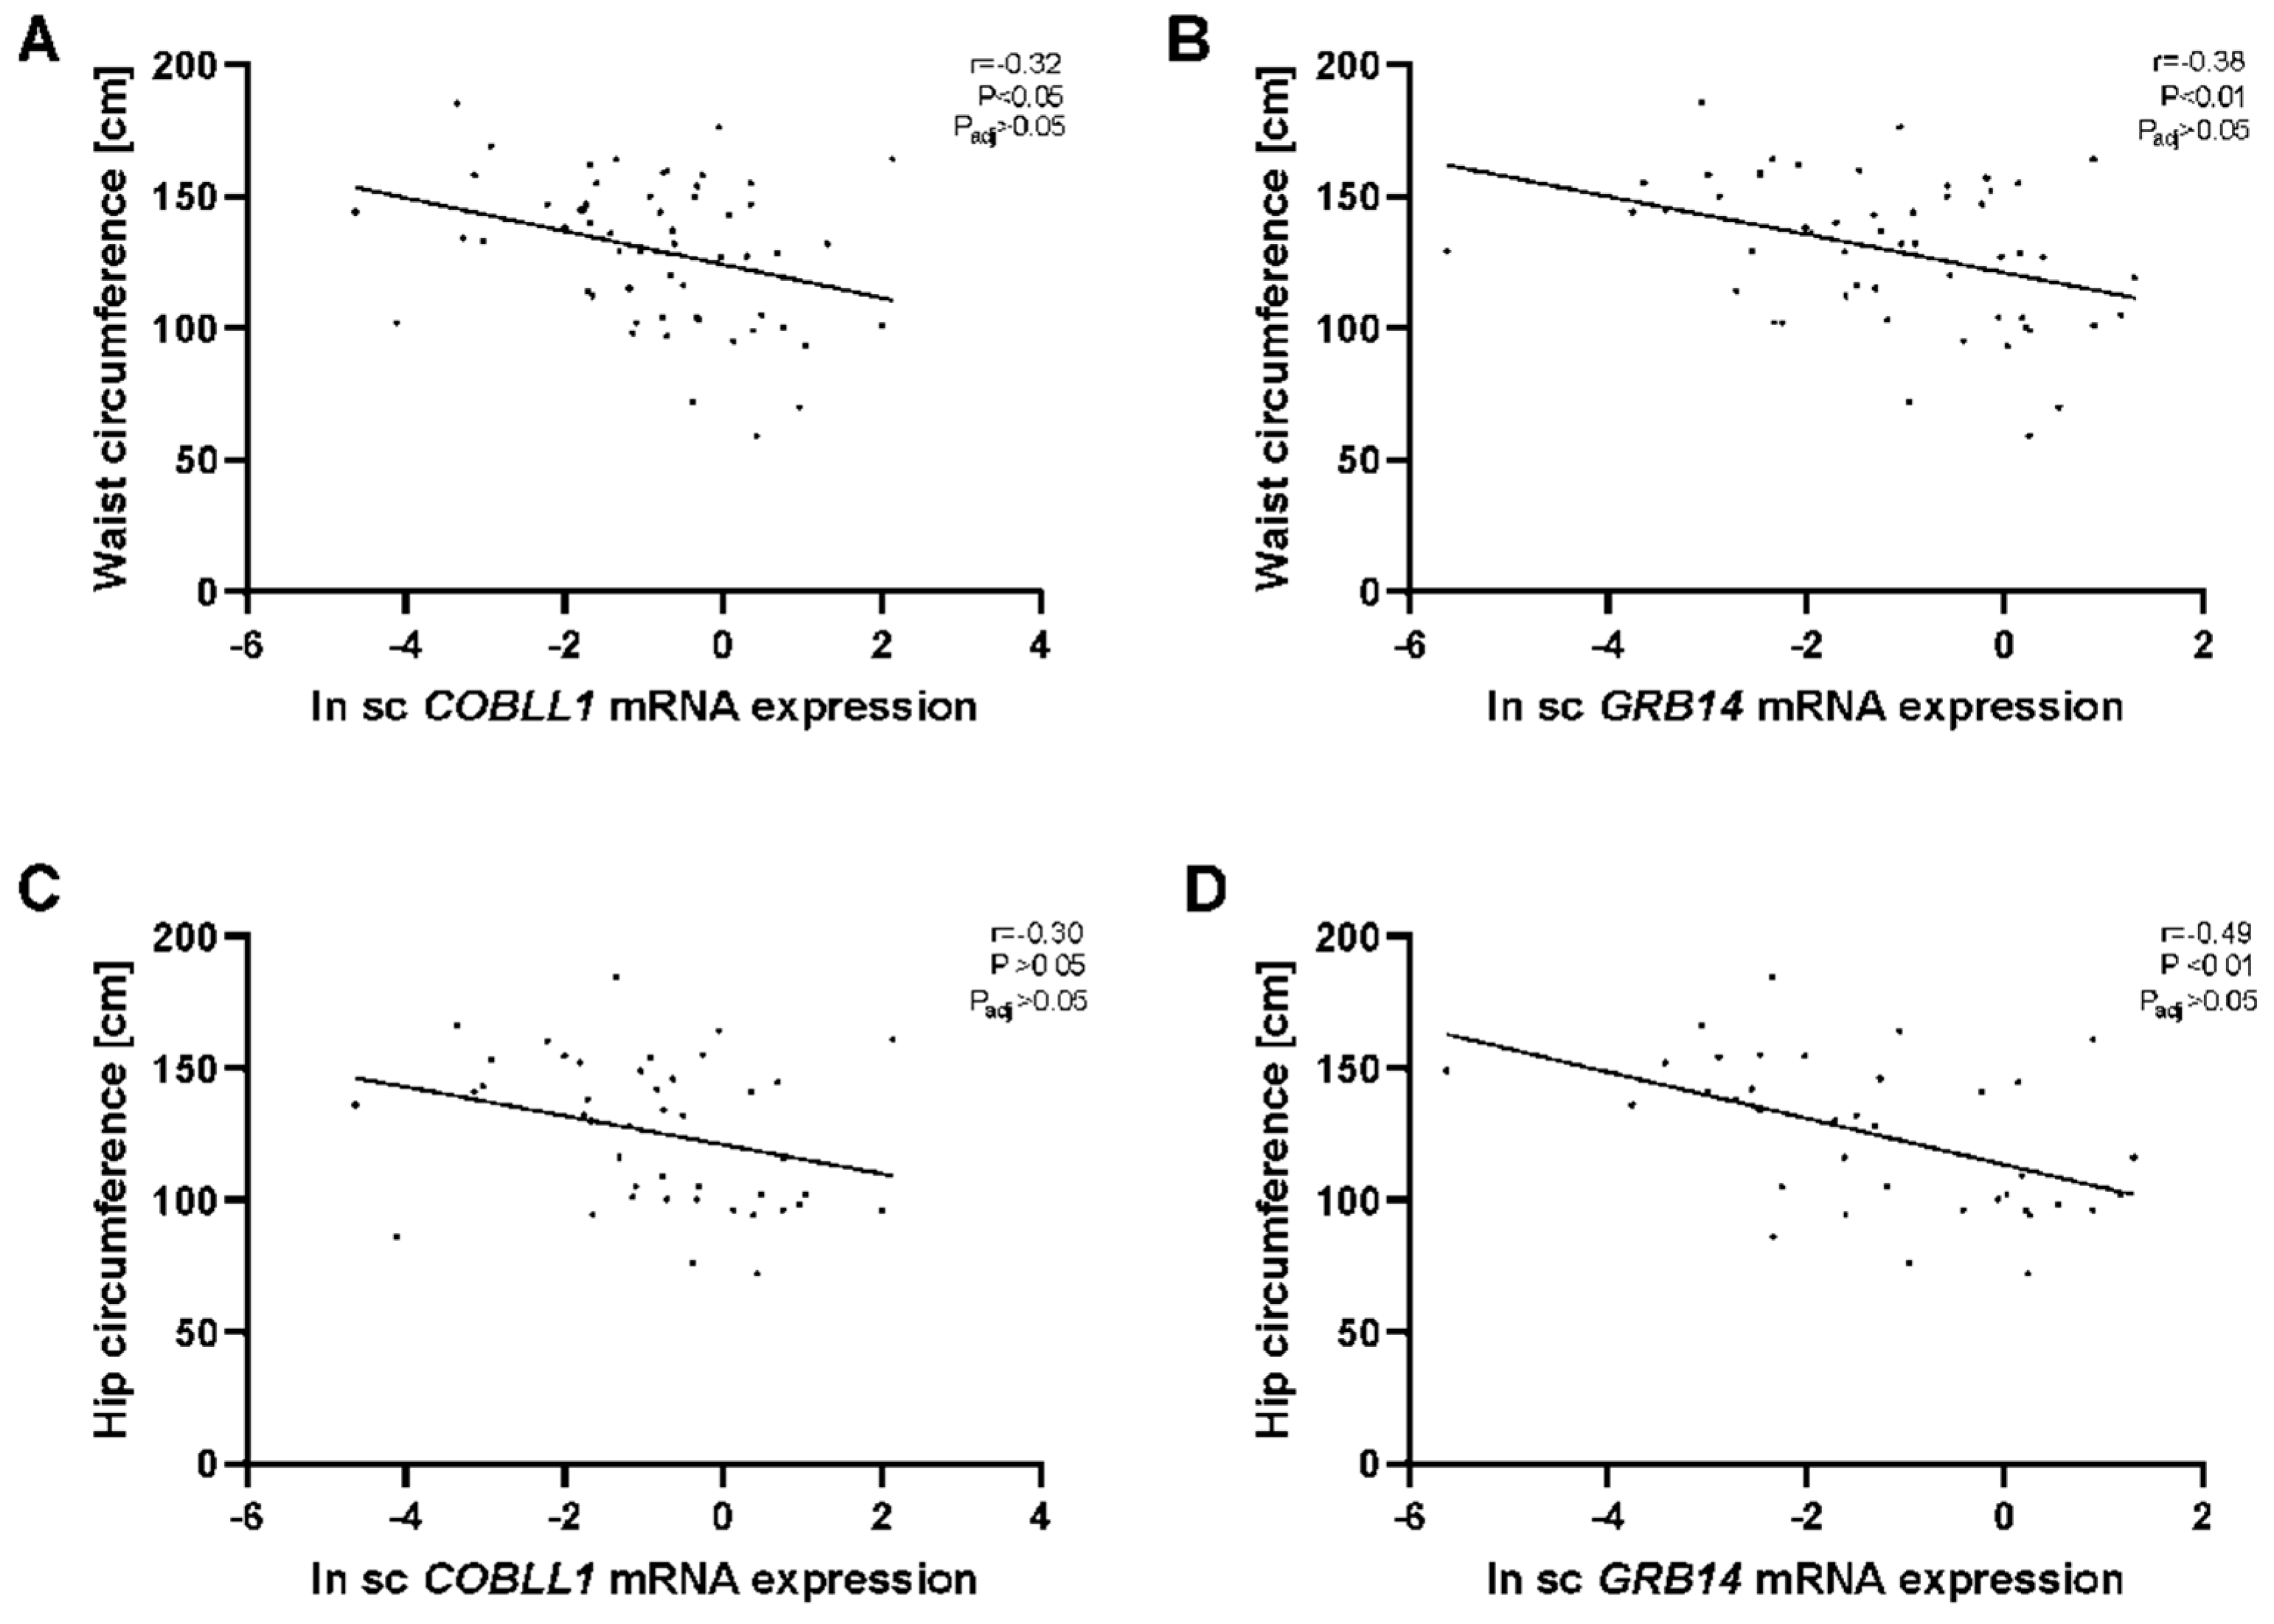
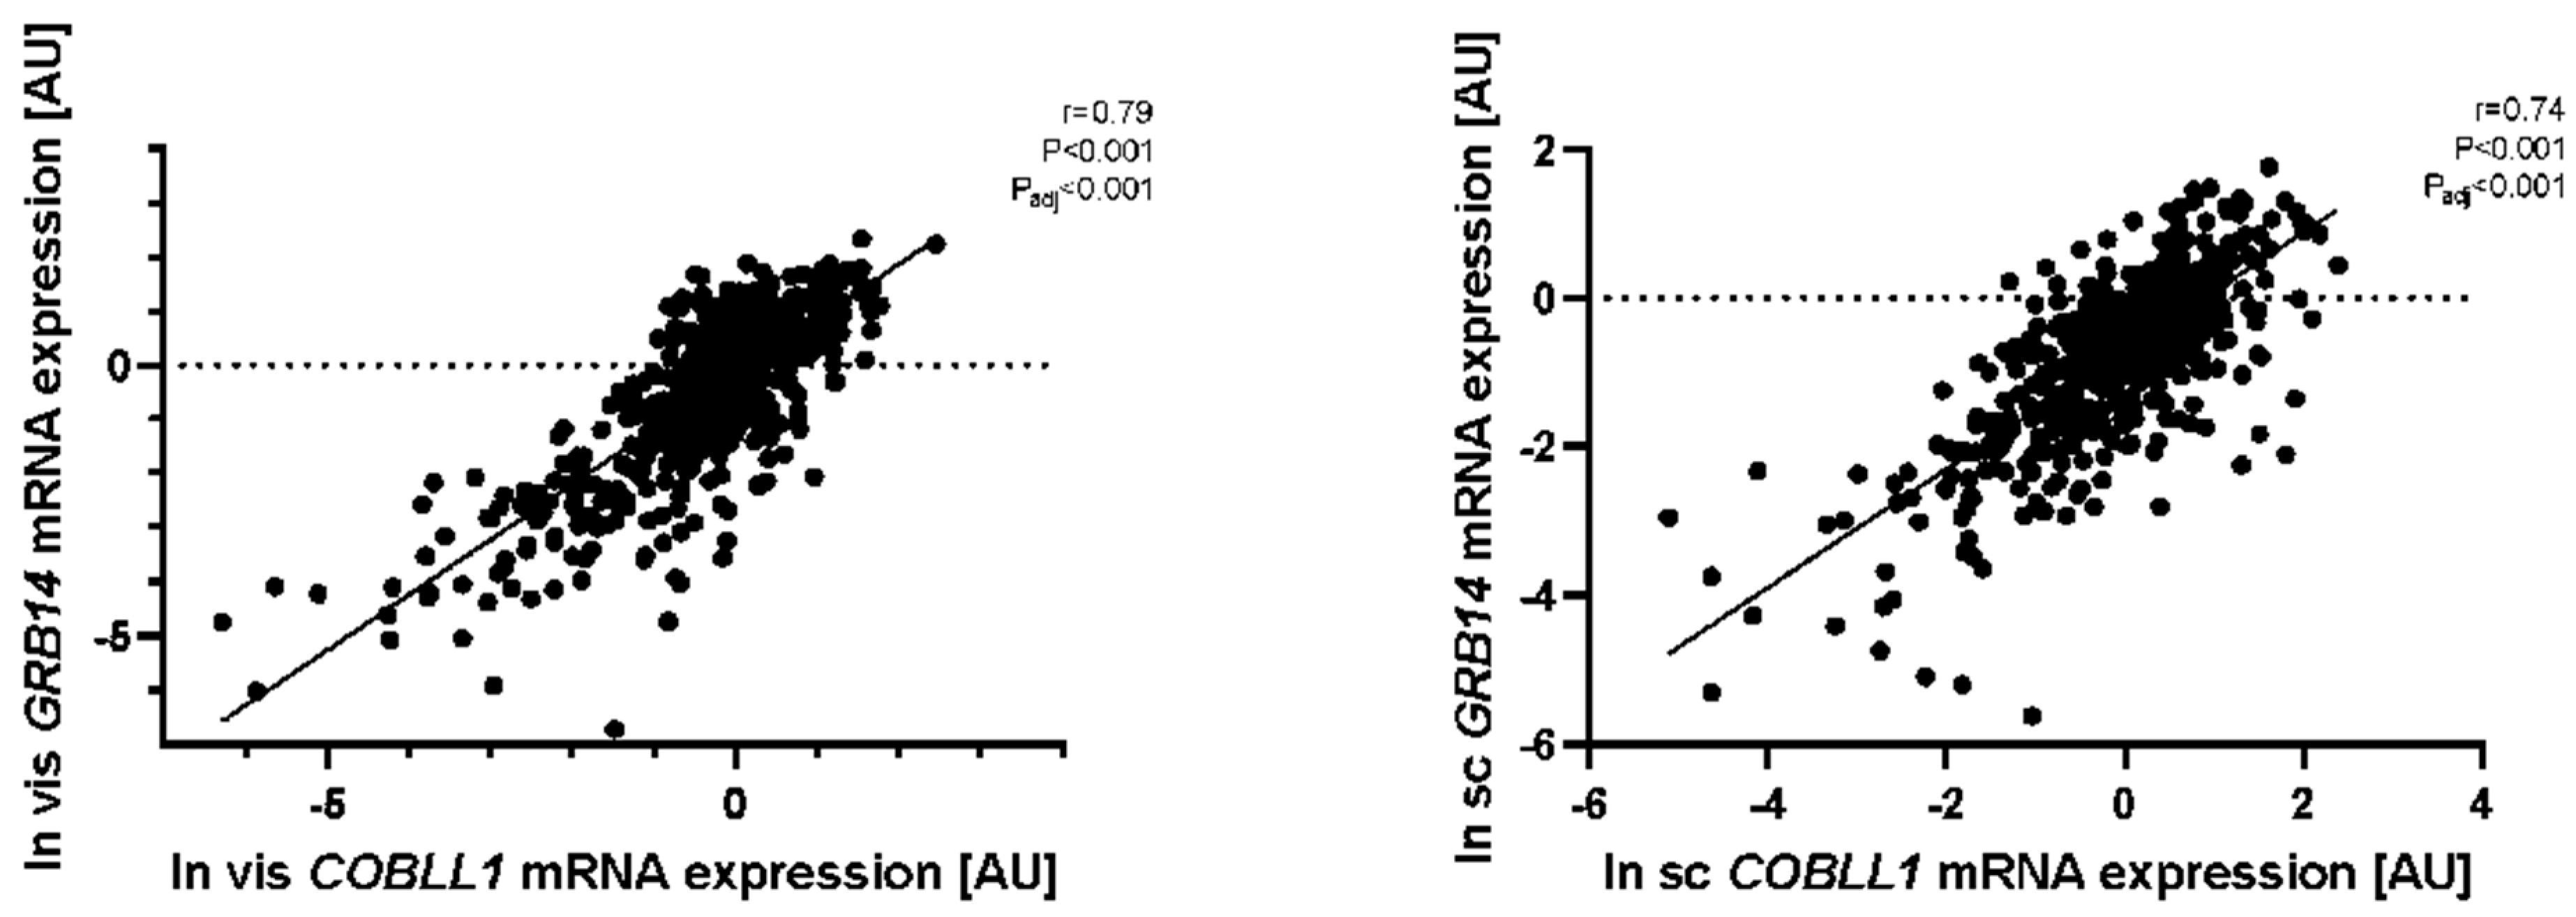
2.1. GRB14 and COBLL1 mRNA Expression in AT Correlates with Parameters of Obesity and Body Fat Distribution

Given the known sexual dimorphism of genetic variants associated with WHR and waist circumference [6,8], we analyzed mRNA expression data in the entire cohort and separately for men and women. Overall, COBLL1 mRNA expression was significantly higher in sc than in vis, specifically for women (p < 0.001), while GRB14 mRNA expression was higher in vis than sc and higher for men than women (p < 0.001; Figure 1A). Therefore, sex was controlled for in all subsequent analyses; all p-values were adjusted for age, sex, and BMI.
Changes in gene/pathway expression activity in AT may be related to a certain FD pattern or to metabolic traits as a cause or consequence. Therefore, we compared mRNA expression between BMI < 30 kg/m2, BMI: 30–40 kg/m2, and BMI ≥ 40 kg/m2 subjects. Except for GRB14, whose mRNA expression was lower in sc AT of individuals with BMI ≥ 40 kg/m2 compared to those with BMI < 30 kg/m2 (p < 0.05), none of the genes showed significant differences in AT mRNA levels between subjects with BMI < 30 kg/m2 and BMI: 30–40 kg/m2 (<30 kg/m2 vs. 30–40 kg/m2 vs. ≥40 kg/m2: 19 vs. 47 vs. 454) (Figure 1B). Although not significant, vis COBLL1 and vis GRB14 mRNA expression tended to be higher with increasing BMI. Surprisingly, only in patients with BMI ≥ 40 kg/m2, GRB14 gene expression was lower (p < 0.001), and COBLL1 mRNA expression was increased in sc AT compared to its expression in vis AT (p < 0.01; Figure 1B). For individual subjects, GRB14 and COBLL1 mRNA expression in vis versus sc AT depots was correlated even after adjustment (padj) for BMI, sex, and age (r = 0.16, p < 0.001, padj < 0.001; r = 0.13, p < 0.01, padj < 0.001).
Moreover, we found a significant correlation between sc COBLL1 and GRB14 mRNA expression with waist circumference (Figure 2A,B) and that sc GRB14 mRNA correlated with hip circumference but did not correlate with sc COBLL1 expression (Figure 2C,D). However, these correlations did not withstand adjustment for BMI. On the other hand, vis COBLL1/GRB14 mRNA expression did not correlate significantly with body FD parameters.

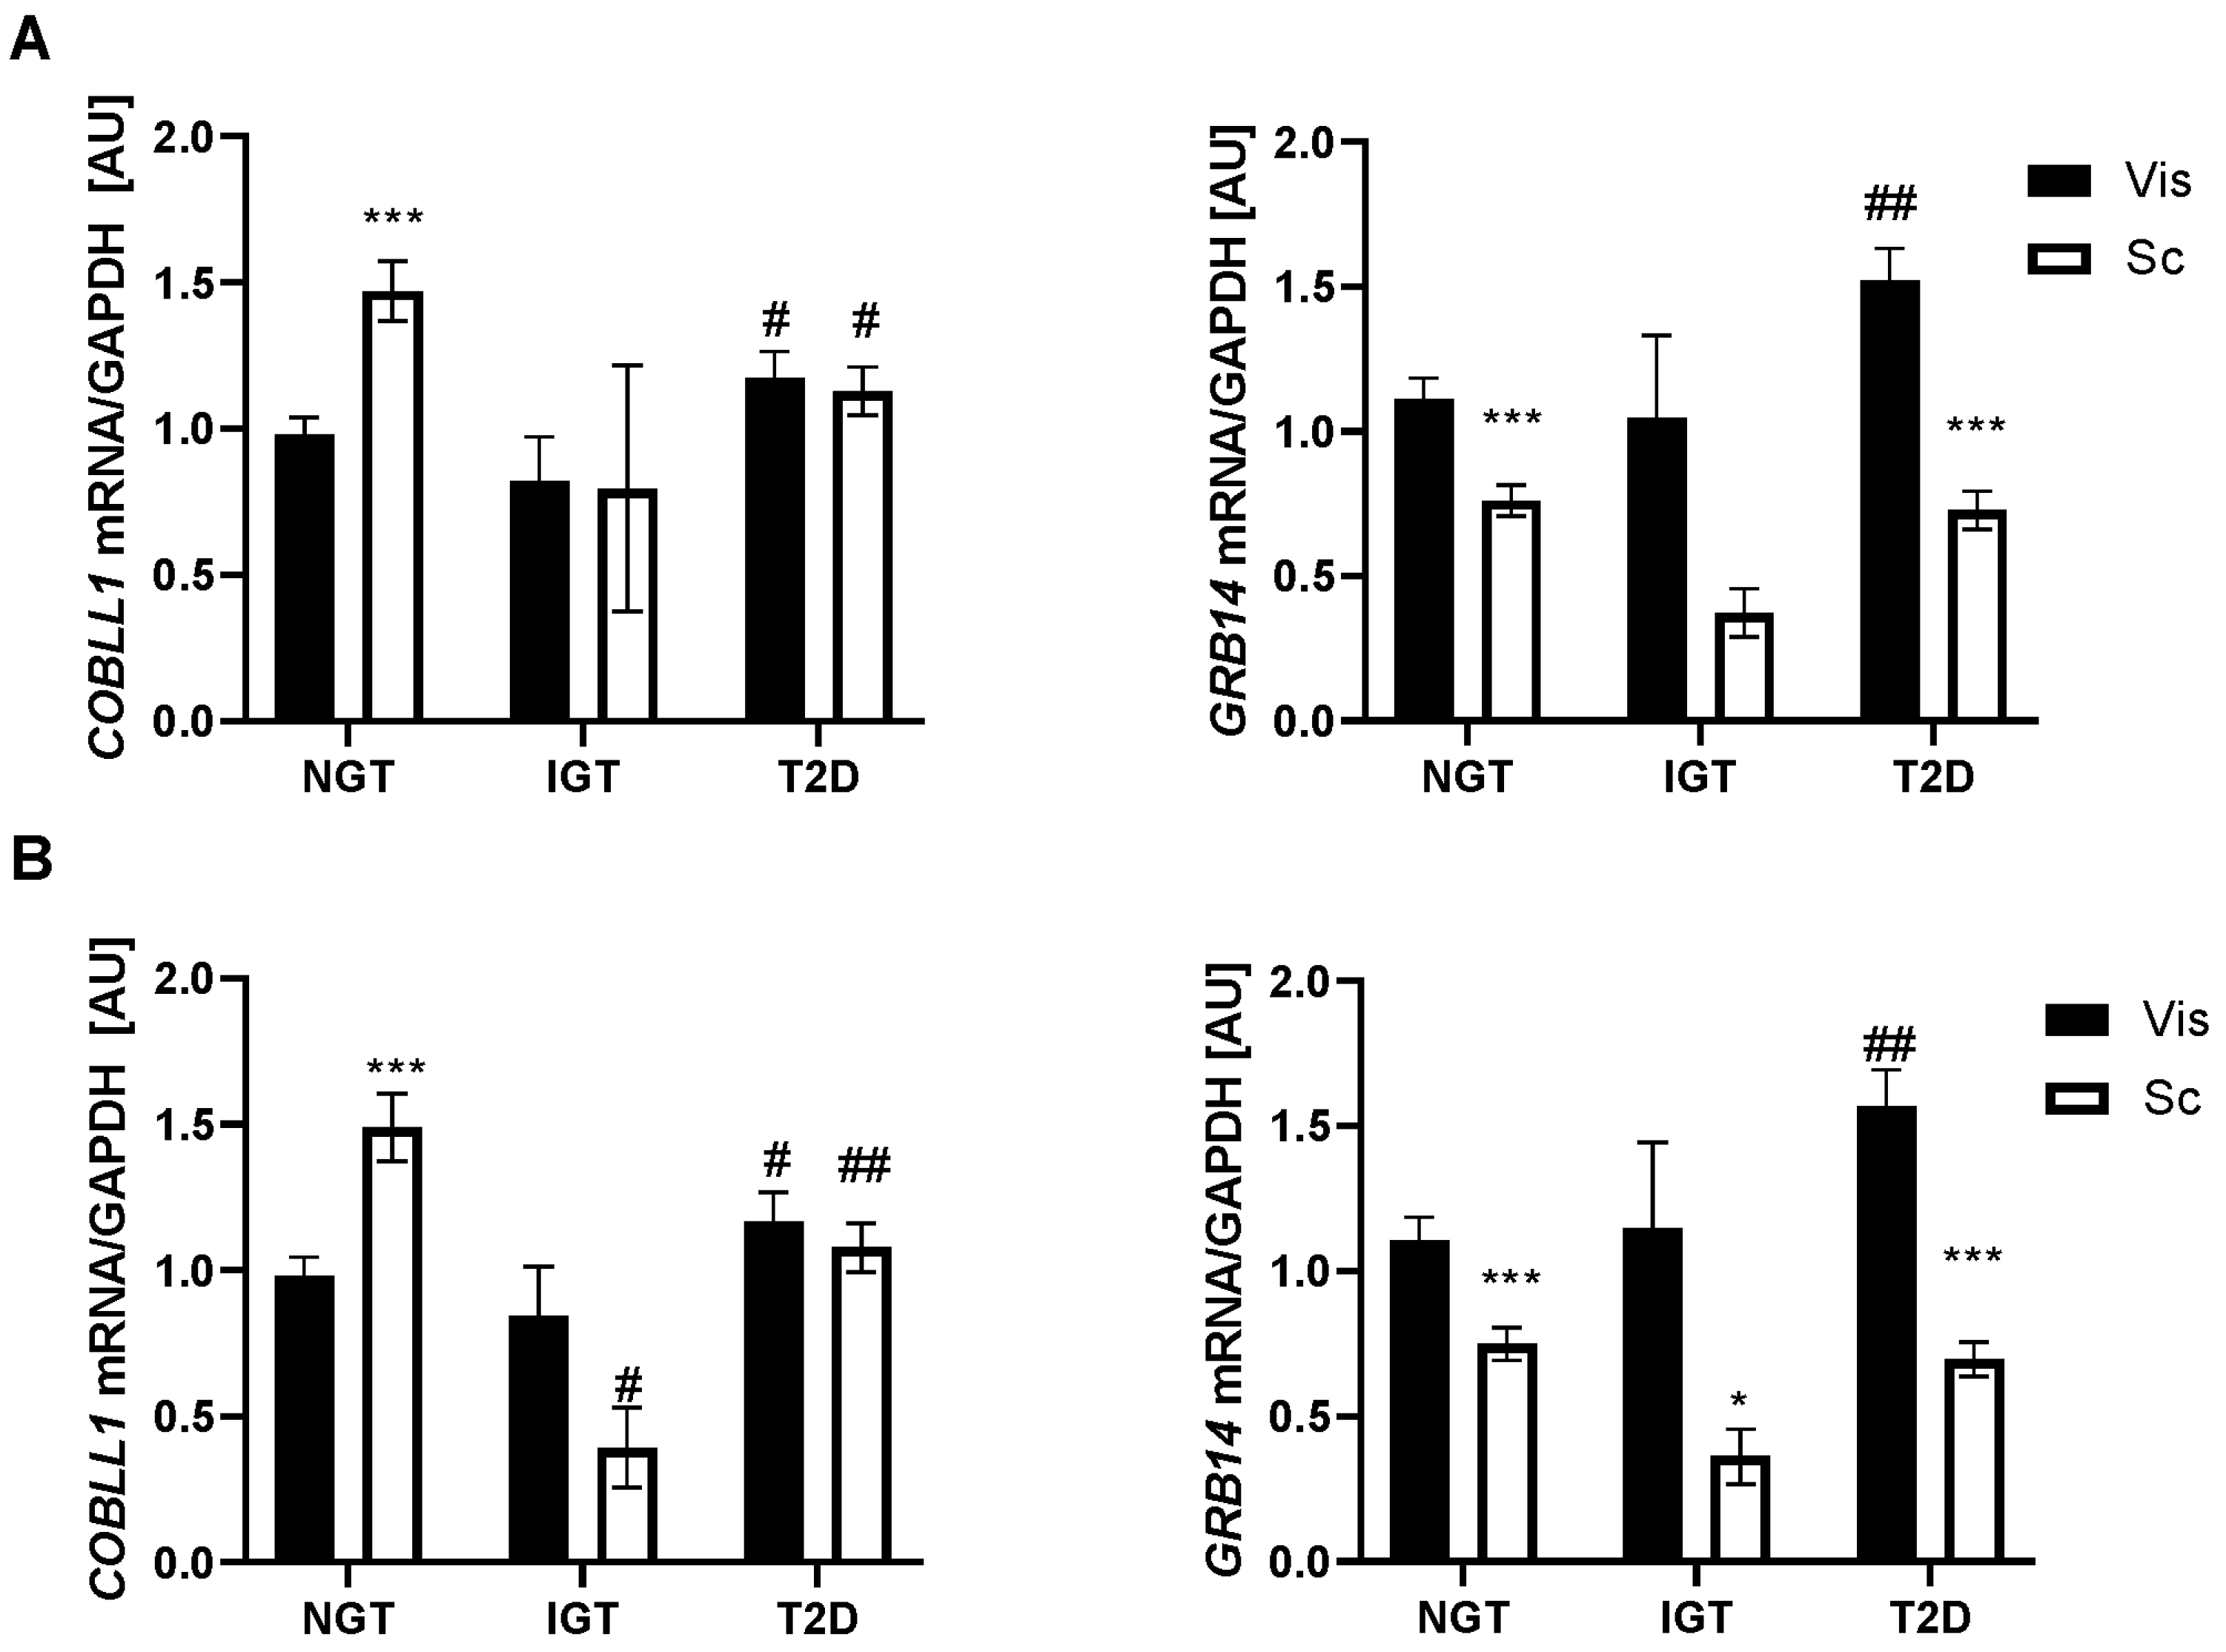
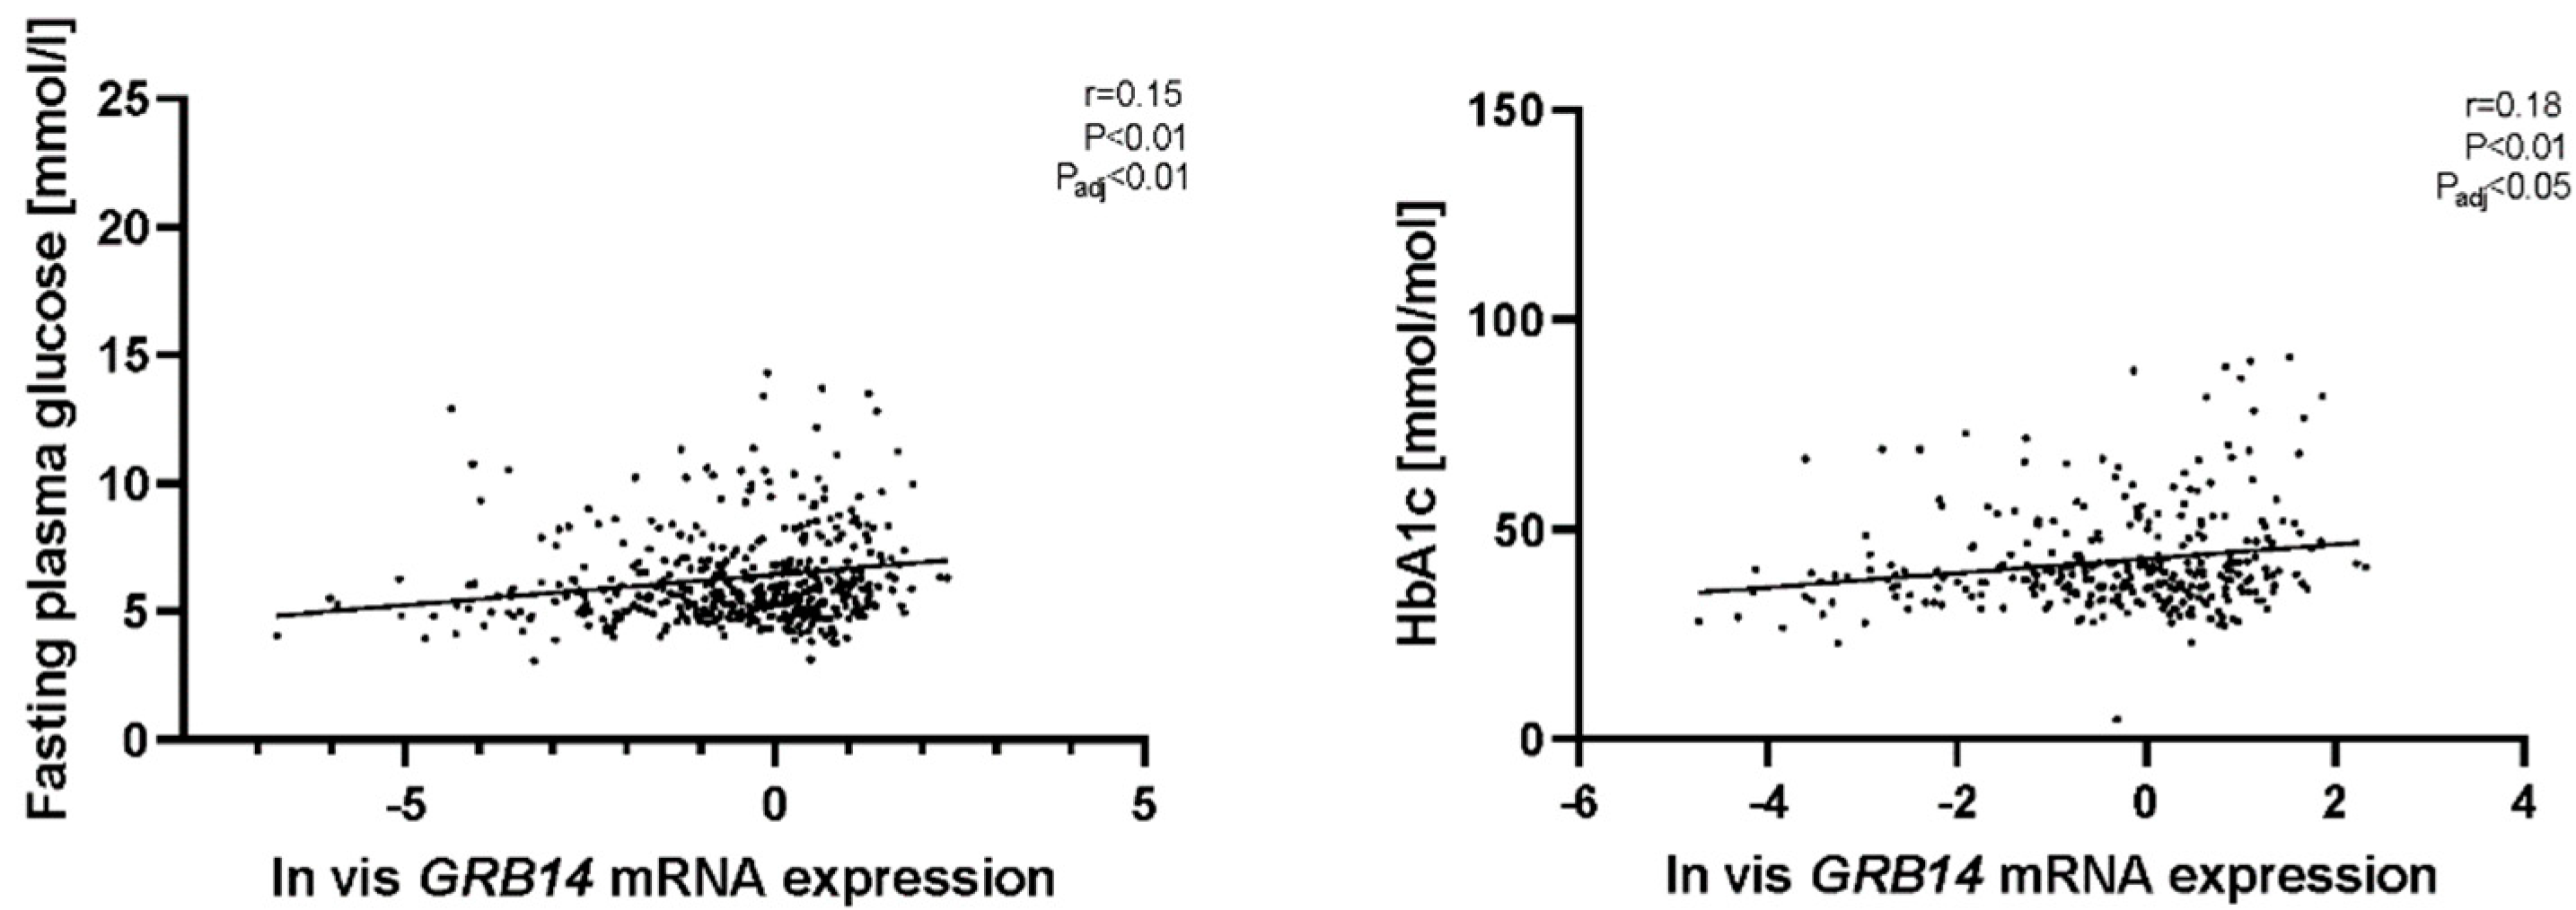
2.2. GRB14 and COBLL1 mRNA Expression in AT Correlates with Diabetes and Parameters of Glucose

As the state of glucose homeostasis may influence transcript expression and since certain genes may regulate vis fat mass accumulation and contribute to the development of T2D, we analyzed COBLL1 and GRB14 mRNA expression in subjects with normal glucose tolerance (NGT), impaired glucose tolerance (IGT), and T2D. Compared to subjects with NGT, subjects with T2D had significantly higher vis GRB14 mRNA levels (p < 0.01; Figure 3A) even after adjusting for BMI, age, and sex (p < 0.05). In contrast, COBLL1 mRNA expression was significantly lower in sc and higher in vis AT in subjects with T2D (p < 0.05; Figure 3A). However, this appears to be driven by age rather than obesity, as the association remained significant after adjusting for BMI and sex (p < 0.05), but not when including age in the statistical model.
Interestingly, in the BMI ≥40 kg/m2 group, vis GRB14 mRNA expression was higher in patients with T2D compared to subjects with NGT (p < 0.01). Consistent with previous results, GRB14 mRNA expression was lower in sc AT compared to vis AT in BMI ≥ 40 kg/m2 group, even under different pre- and diabetes states (p < 0.001). The sc COBLL1 gene expression was lower in subjects with IGT and T2D than in subjects with NGT (p < 0.05). In contrast, COBLL1 mRNA expression was higher in sc AT than in vis AT in subjects with NGT (p < 0.001; Figure 3B), which seems to drive the difference between both fat depots in the cohort with BMI > 40 kg/m2 (Figure 1B).
We analyzed the association between COBLL1 and GRB14 mRNA expression and metabolic phenotypes, including diabetes, lipid, and inflammatory parameters, as well as adipokines (Table S1). We found that vis GRB14 mRNA expression was correlated positively with glycated haemoglobin (HbA1c) and fasting plasma glucose (FPG) (Figure 4), even in multiple linear regression models after adjusting for age, sex, and BMI (padj < 0.05; Table S1). Sc GRB14 mRNA expression was not significantly correlated with glucose variables. On the other hand, there was no significant association between COBLL1 mRNA expression and the phenotypes studied in both AT (Table S1).

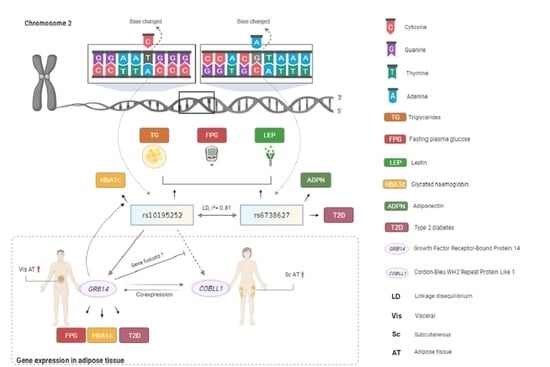
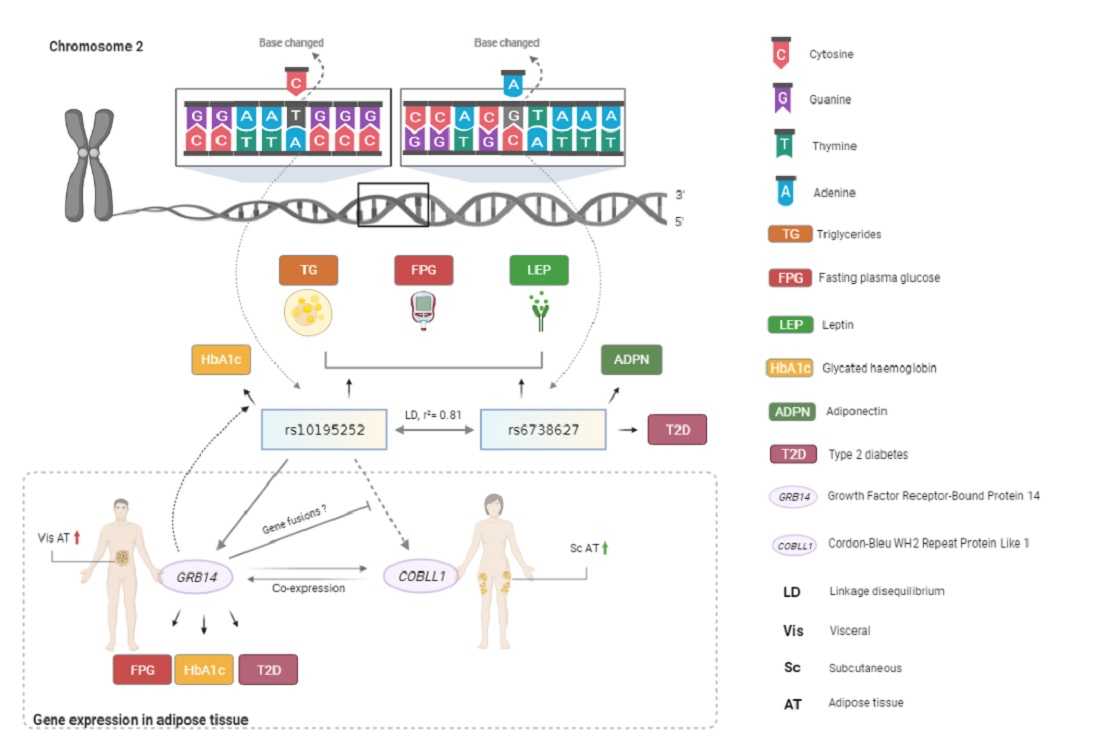
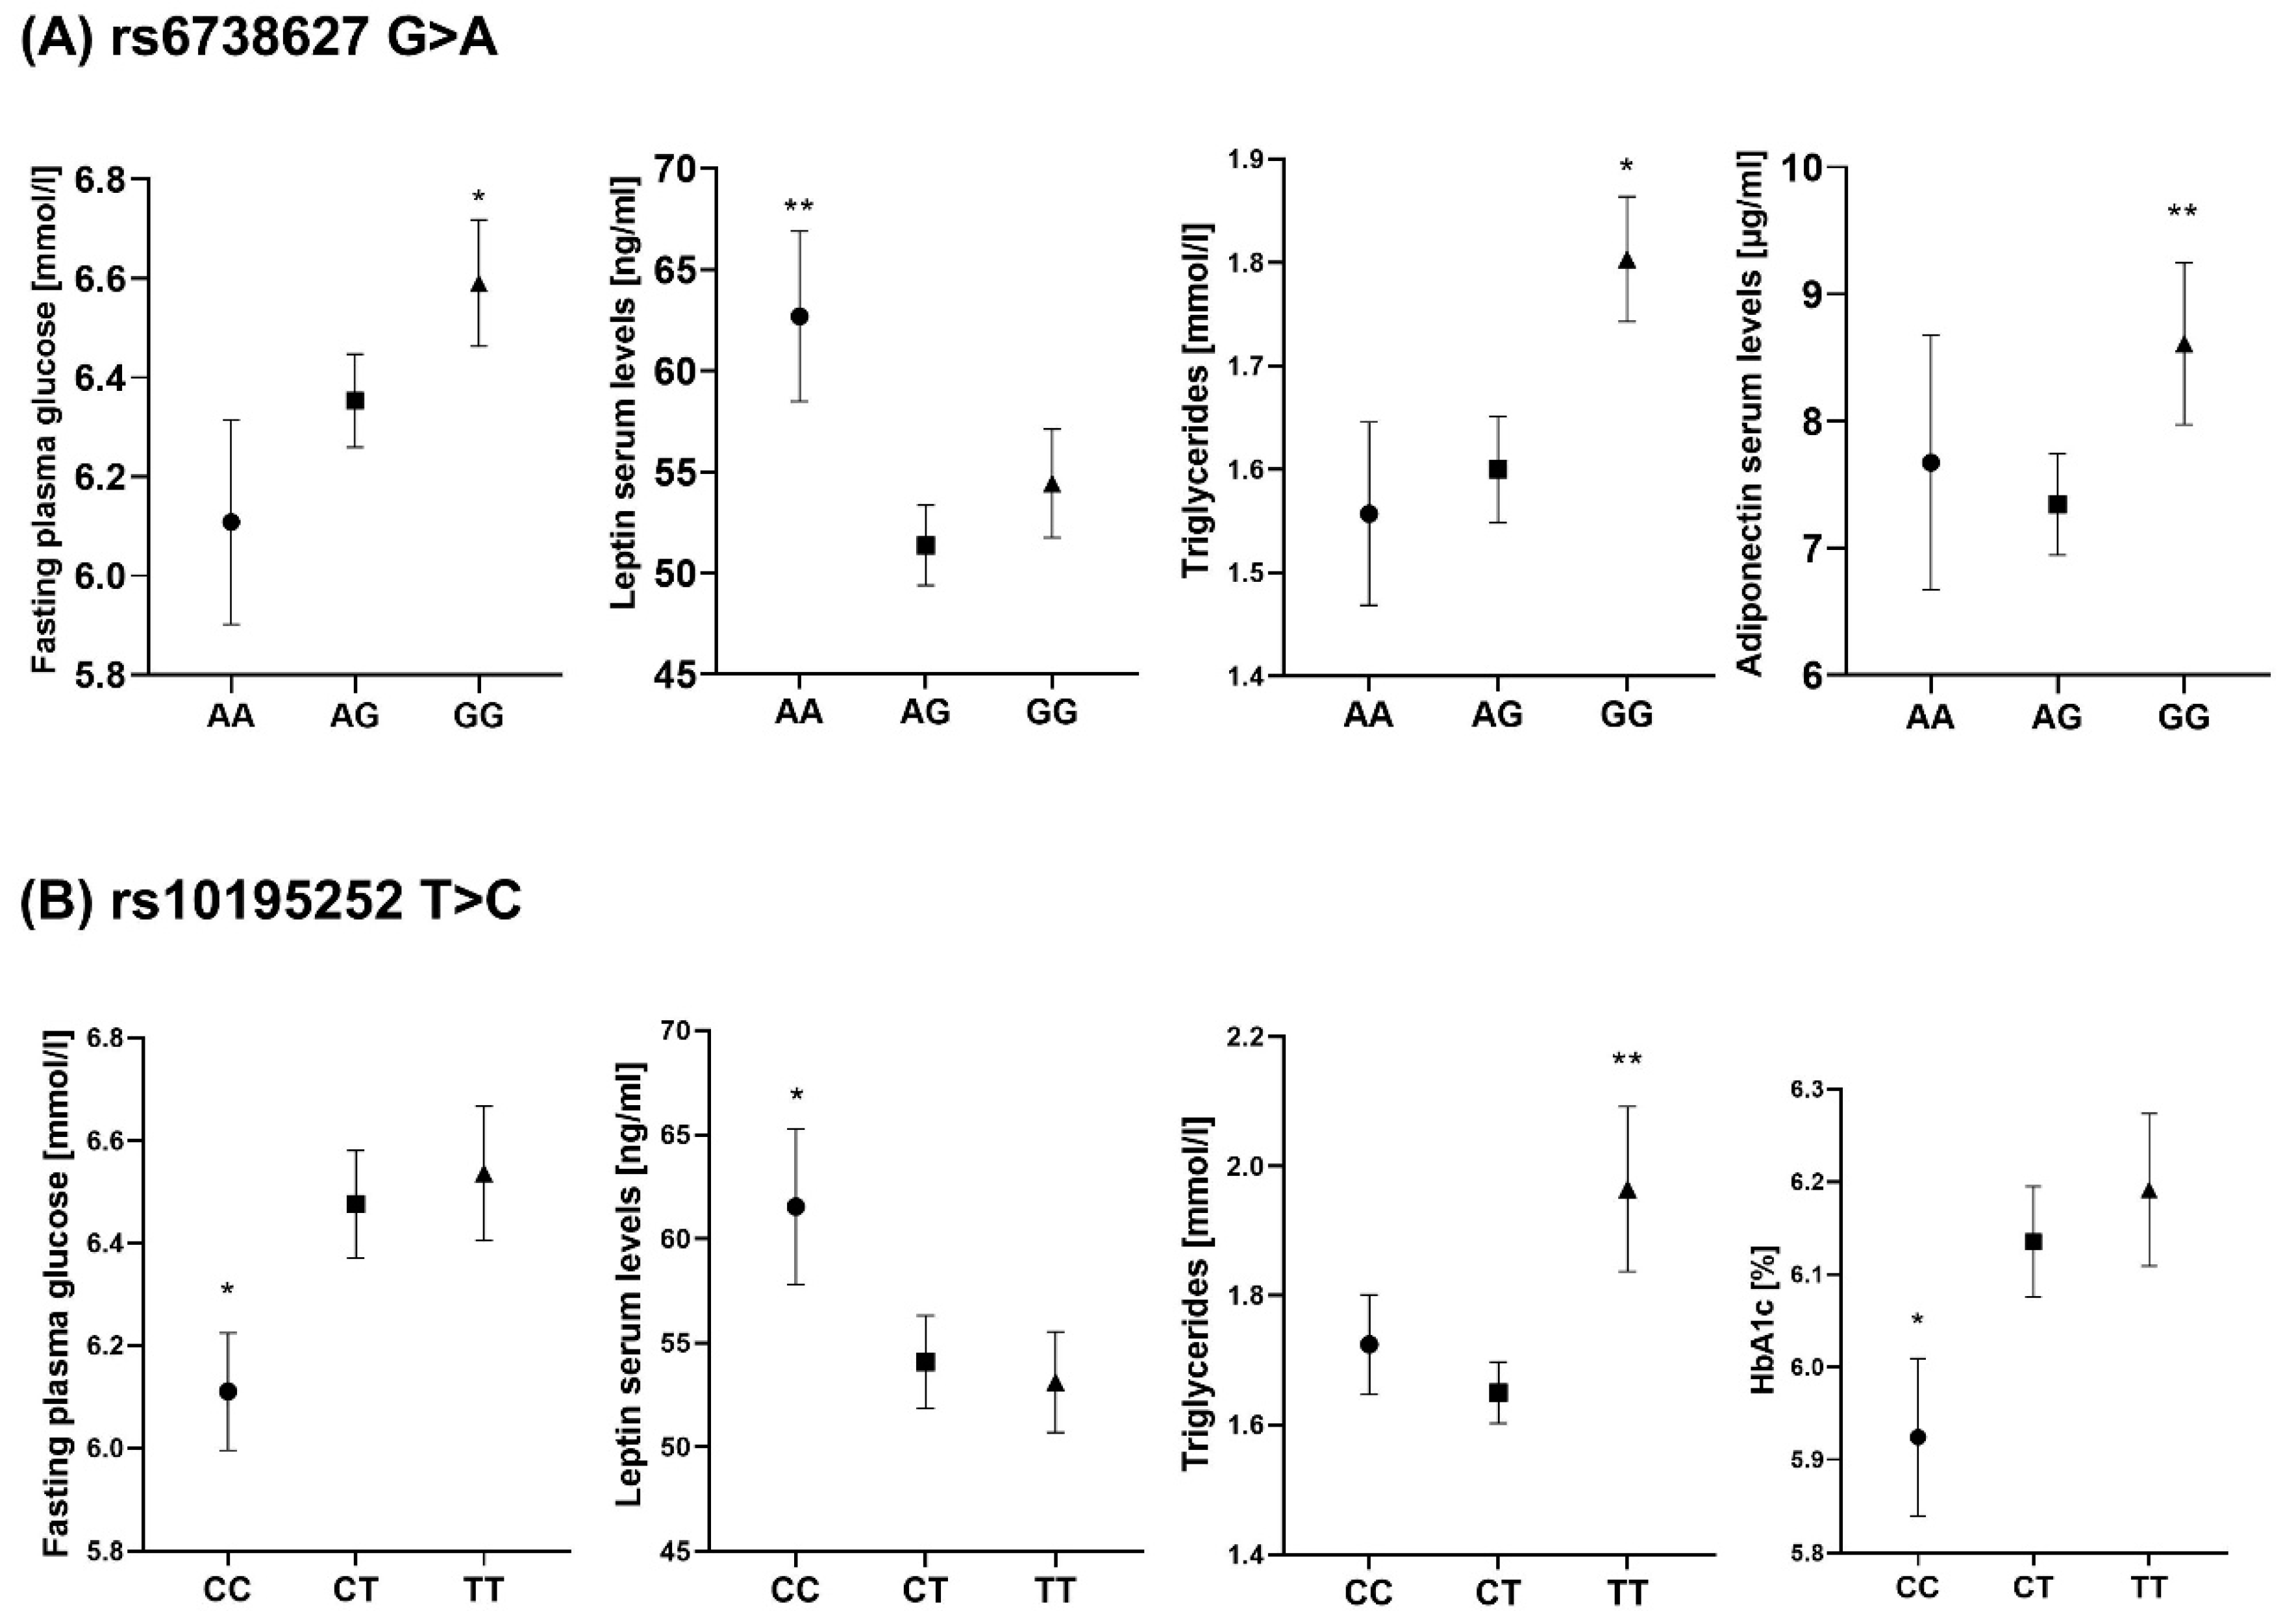
2.3. Both rs10195252 and rs6738627 Are Associated with Glucose and Lipid Metabolism, as well as Circulating Adipokines

To elucidate the possible association between the originally described WHR-associated genetic variant as well as the body fat-associated variant with human metabolic phenotypes [8,9], we genotyped the two SNPs rs10195252 T > C (GRB14-COBLL1) and rs6738627 G > A (COBLL1) in the entire cohort. Both SNPs were in Hardy–Weinberg Equilibrium (p > 0.05) with the following minor allele frequencies (MAFs): 43% for rs10195252 and 39% for rs6738627.
Carriers of the rs6738627 G-allele had a significantly higher risk of T2D compared with carriers of the A-allele (GG: OR 1.85; 95% CI [1.21–2.83], AG: OR 1.78; 95% CI [1.18–2.68], p < 0.01, adjusted for sex, age, and BMI; Table 1). Subsequently, given the association between the development of diabetes and increased BMI, we performed further analyses with stratifications for obesity status. The association between rs6738627 and risk of T2D remained significant even when stratified by BMI ≥ 40 kg/m2 (Table S2).
Furthermore, rs6738627 and rs10195252 were significantly associated with FPG, as well as circulating TG and leptin (p < 0.05, adjusted for sex, age, BMI; Figure 5). Likewise, rs10195252 was significantly associated with HbA1c, and rs6738627 was associated with adiponectin levels (p < 0.05, adjusted for sex, age, BMI; Figure 5). Except for the above associations, no association was observed between the two SNPs and other phenotypes (Table S3).

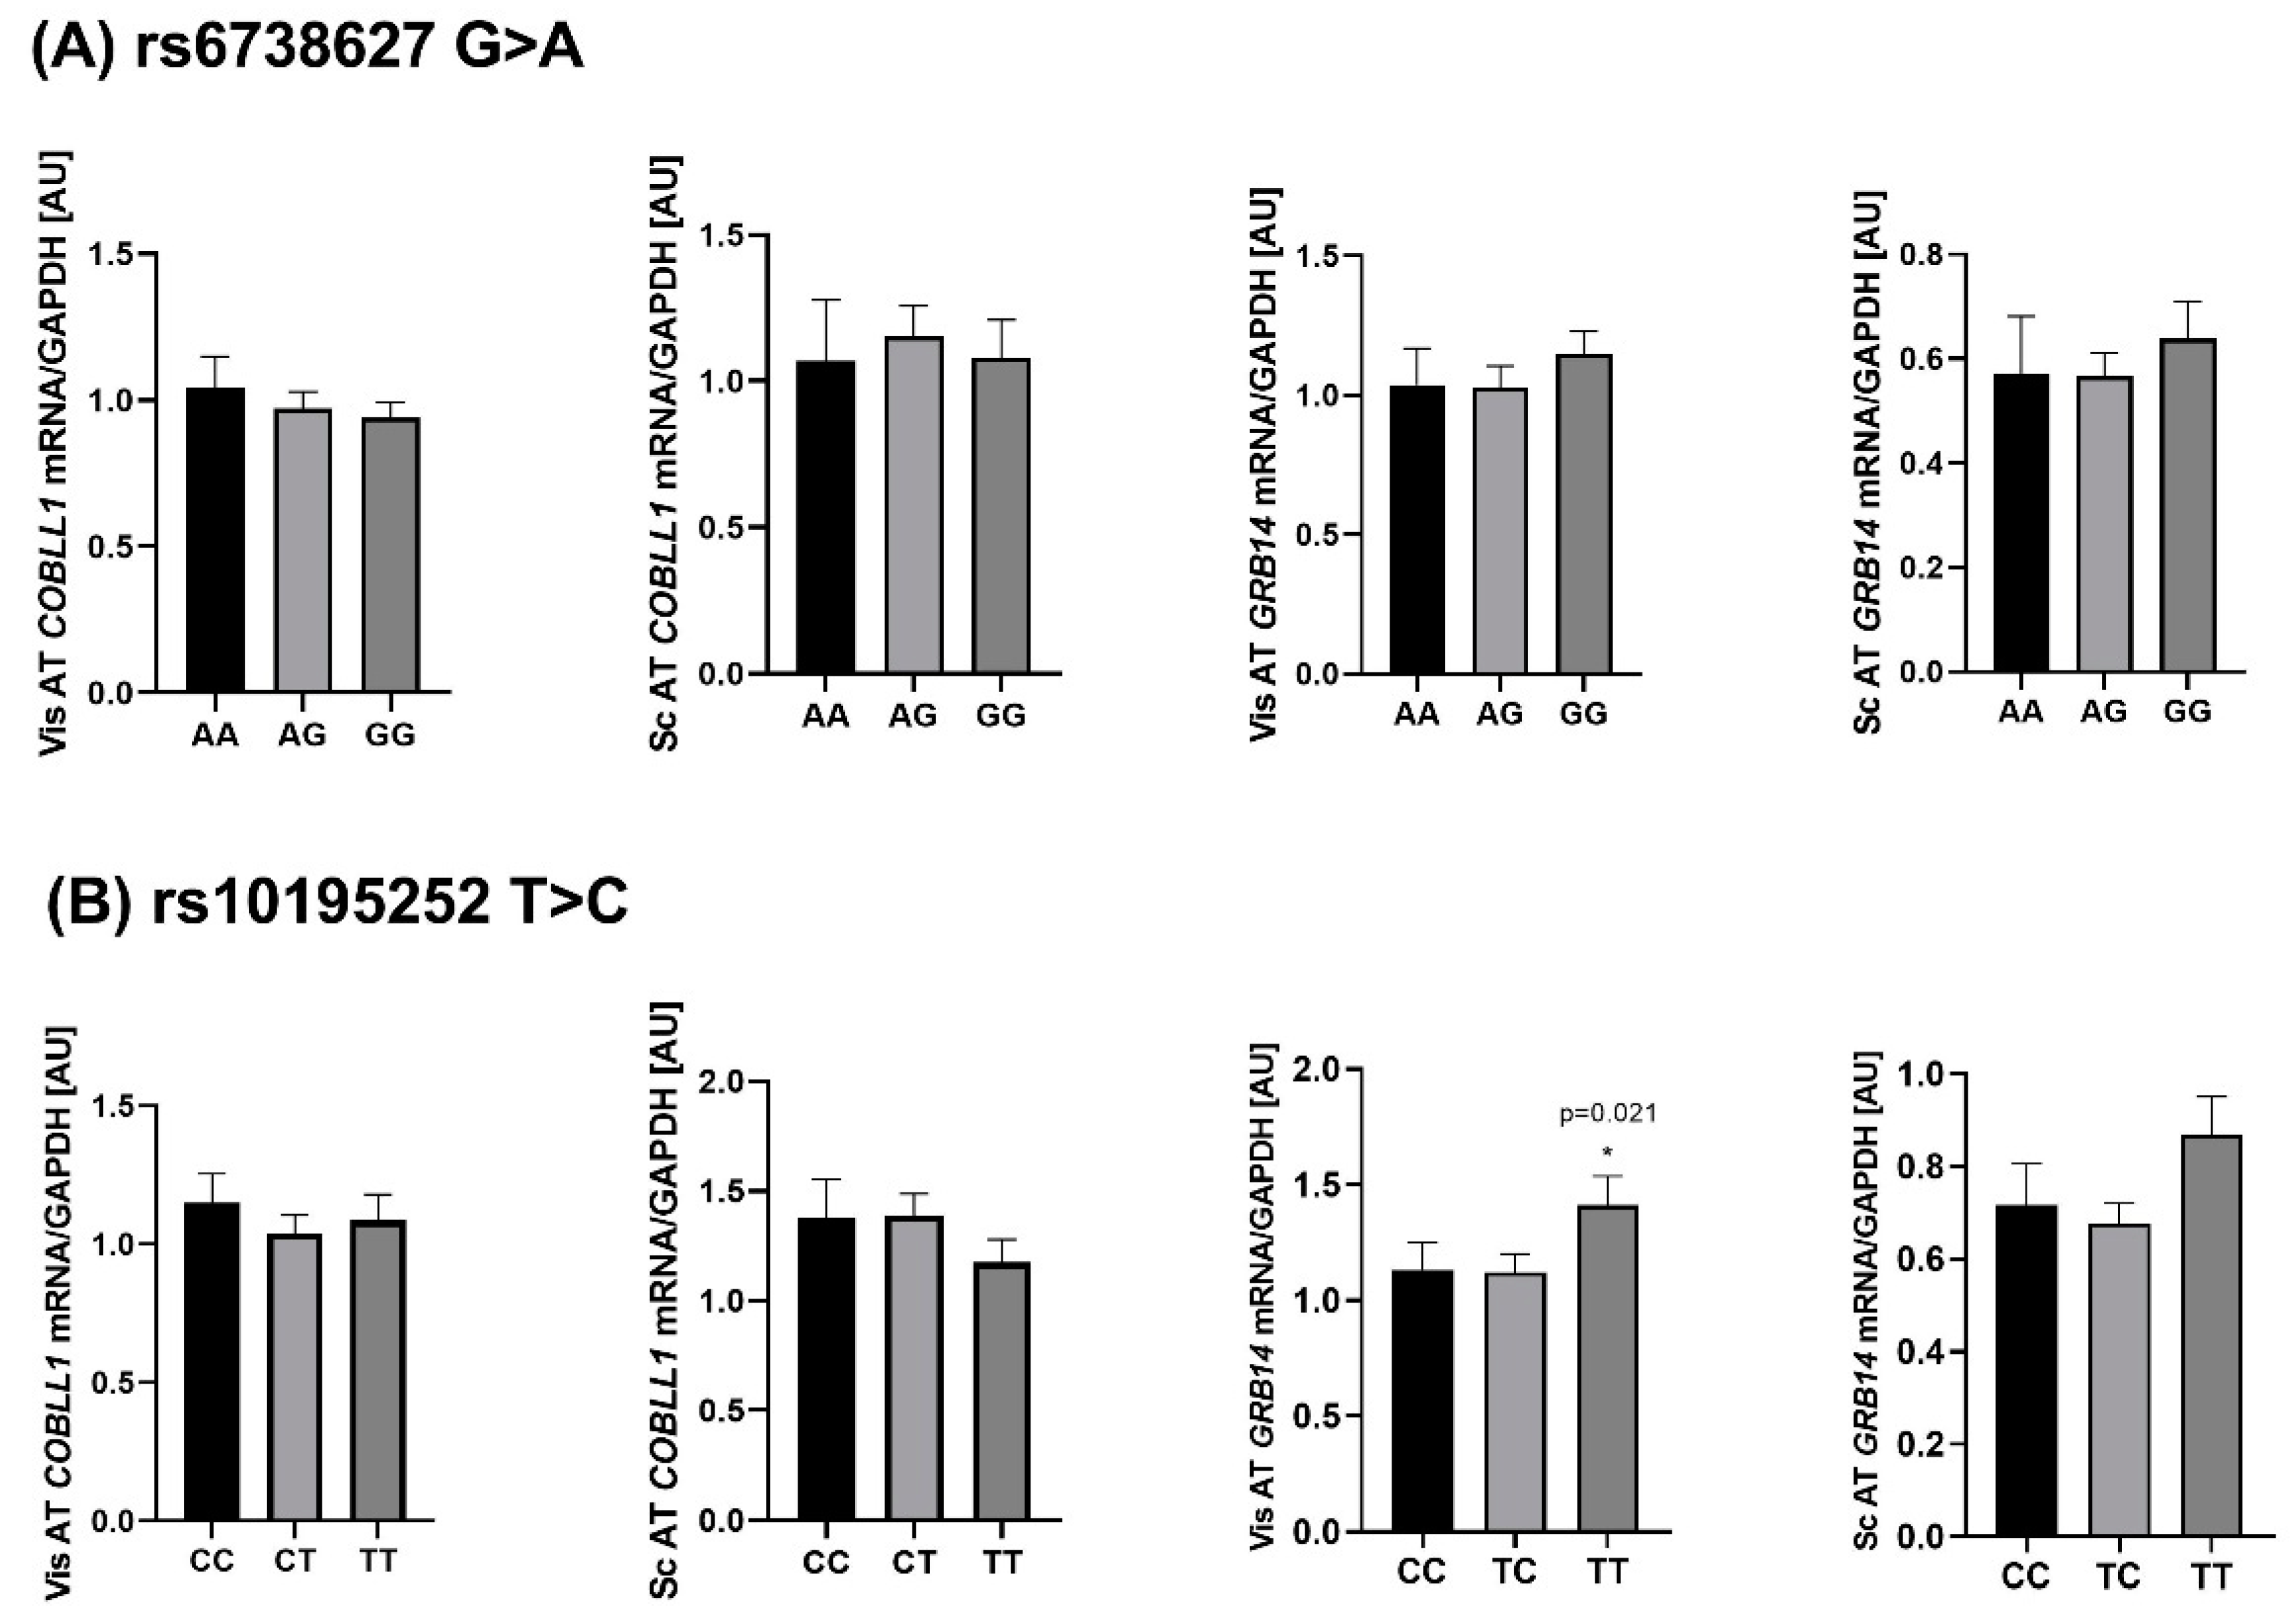
2.4. Genotype-Specific mRNA Expression at Loci Associated with WHR and Body Fat

The eQTL (expression Quantitative Trait Loci) data can implicate regional transcripts that mediate trait associations and may help to sort out the expected direction. Therefore, we analyzed the relationship of rs10195252 and rs6738627 with AT gene expression. None of the SNPs showed association with COBLL1 transcript quantity (Figure 6A). However, the rs10195252 T-allele was significantly associated with increased GRB14 vis mRNA expression (p < 0.025 after adjusting for age, sex, and BMI; Figure 6B). Although not statistically significant, the rs10195252 T-allele carriers showed higher GRB14 mRNA expression in sc AT, consistent with data previously reported by Schleinitz et al. [19].

2.5. Mediation Analyses

We applied mediation analyses between SNP, gene expression, and several obesity and metabolic traits. Mediation analyses revealed that the association between rs10195252 and HbA1c was fully mediated via vis GRB14 gene expression (p < 0.05, Table S4). Although rs10195252 was associated with FPG, this appeared to be driven by other factors, as no significant association was found when GRB14 mRNA expression was the mediating variable (p > 0.05, adjusted for sex, age, and BMI). Notably, COBLL1 and GRB14 mRNA expression were strongly correlated in both AT (Figure 7, Table S5). Although rs10195252 was not significantly associated with COBLL1 mRNA expression in vis AT, mediation analyses revealed that rs10195252 had a significant direct effect on COBLL1 expression (ß = −0.1496, p = 0.0057, adjusted for sex, age, and BMI). This may be due to the indirect effect from GRB14 partially suppressing the direct effect of the SNP on COBLL1 gene expression. On the other hand, the SNP also had a significant indirect effect on GRB14 transcript levels, but not through COBLL1 mRNA expression (p > 0.05, adjusted for sex, age, and BMI).

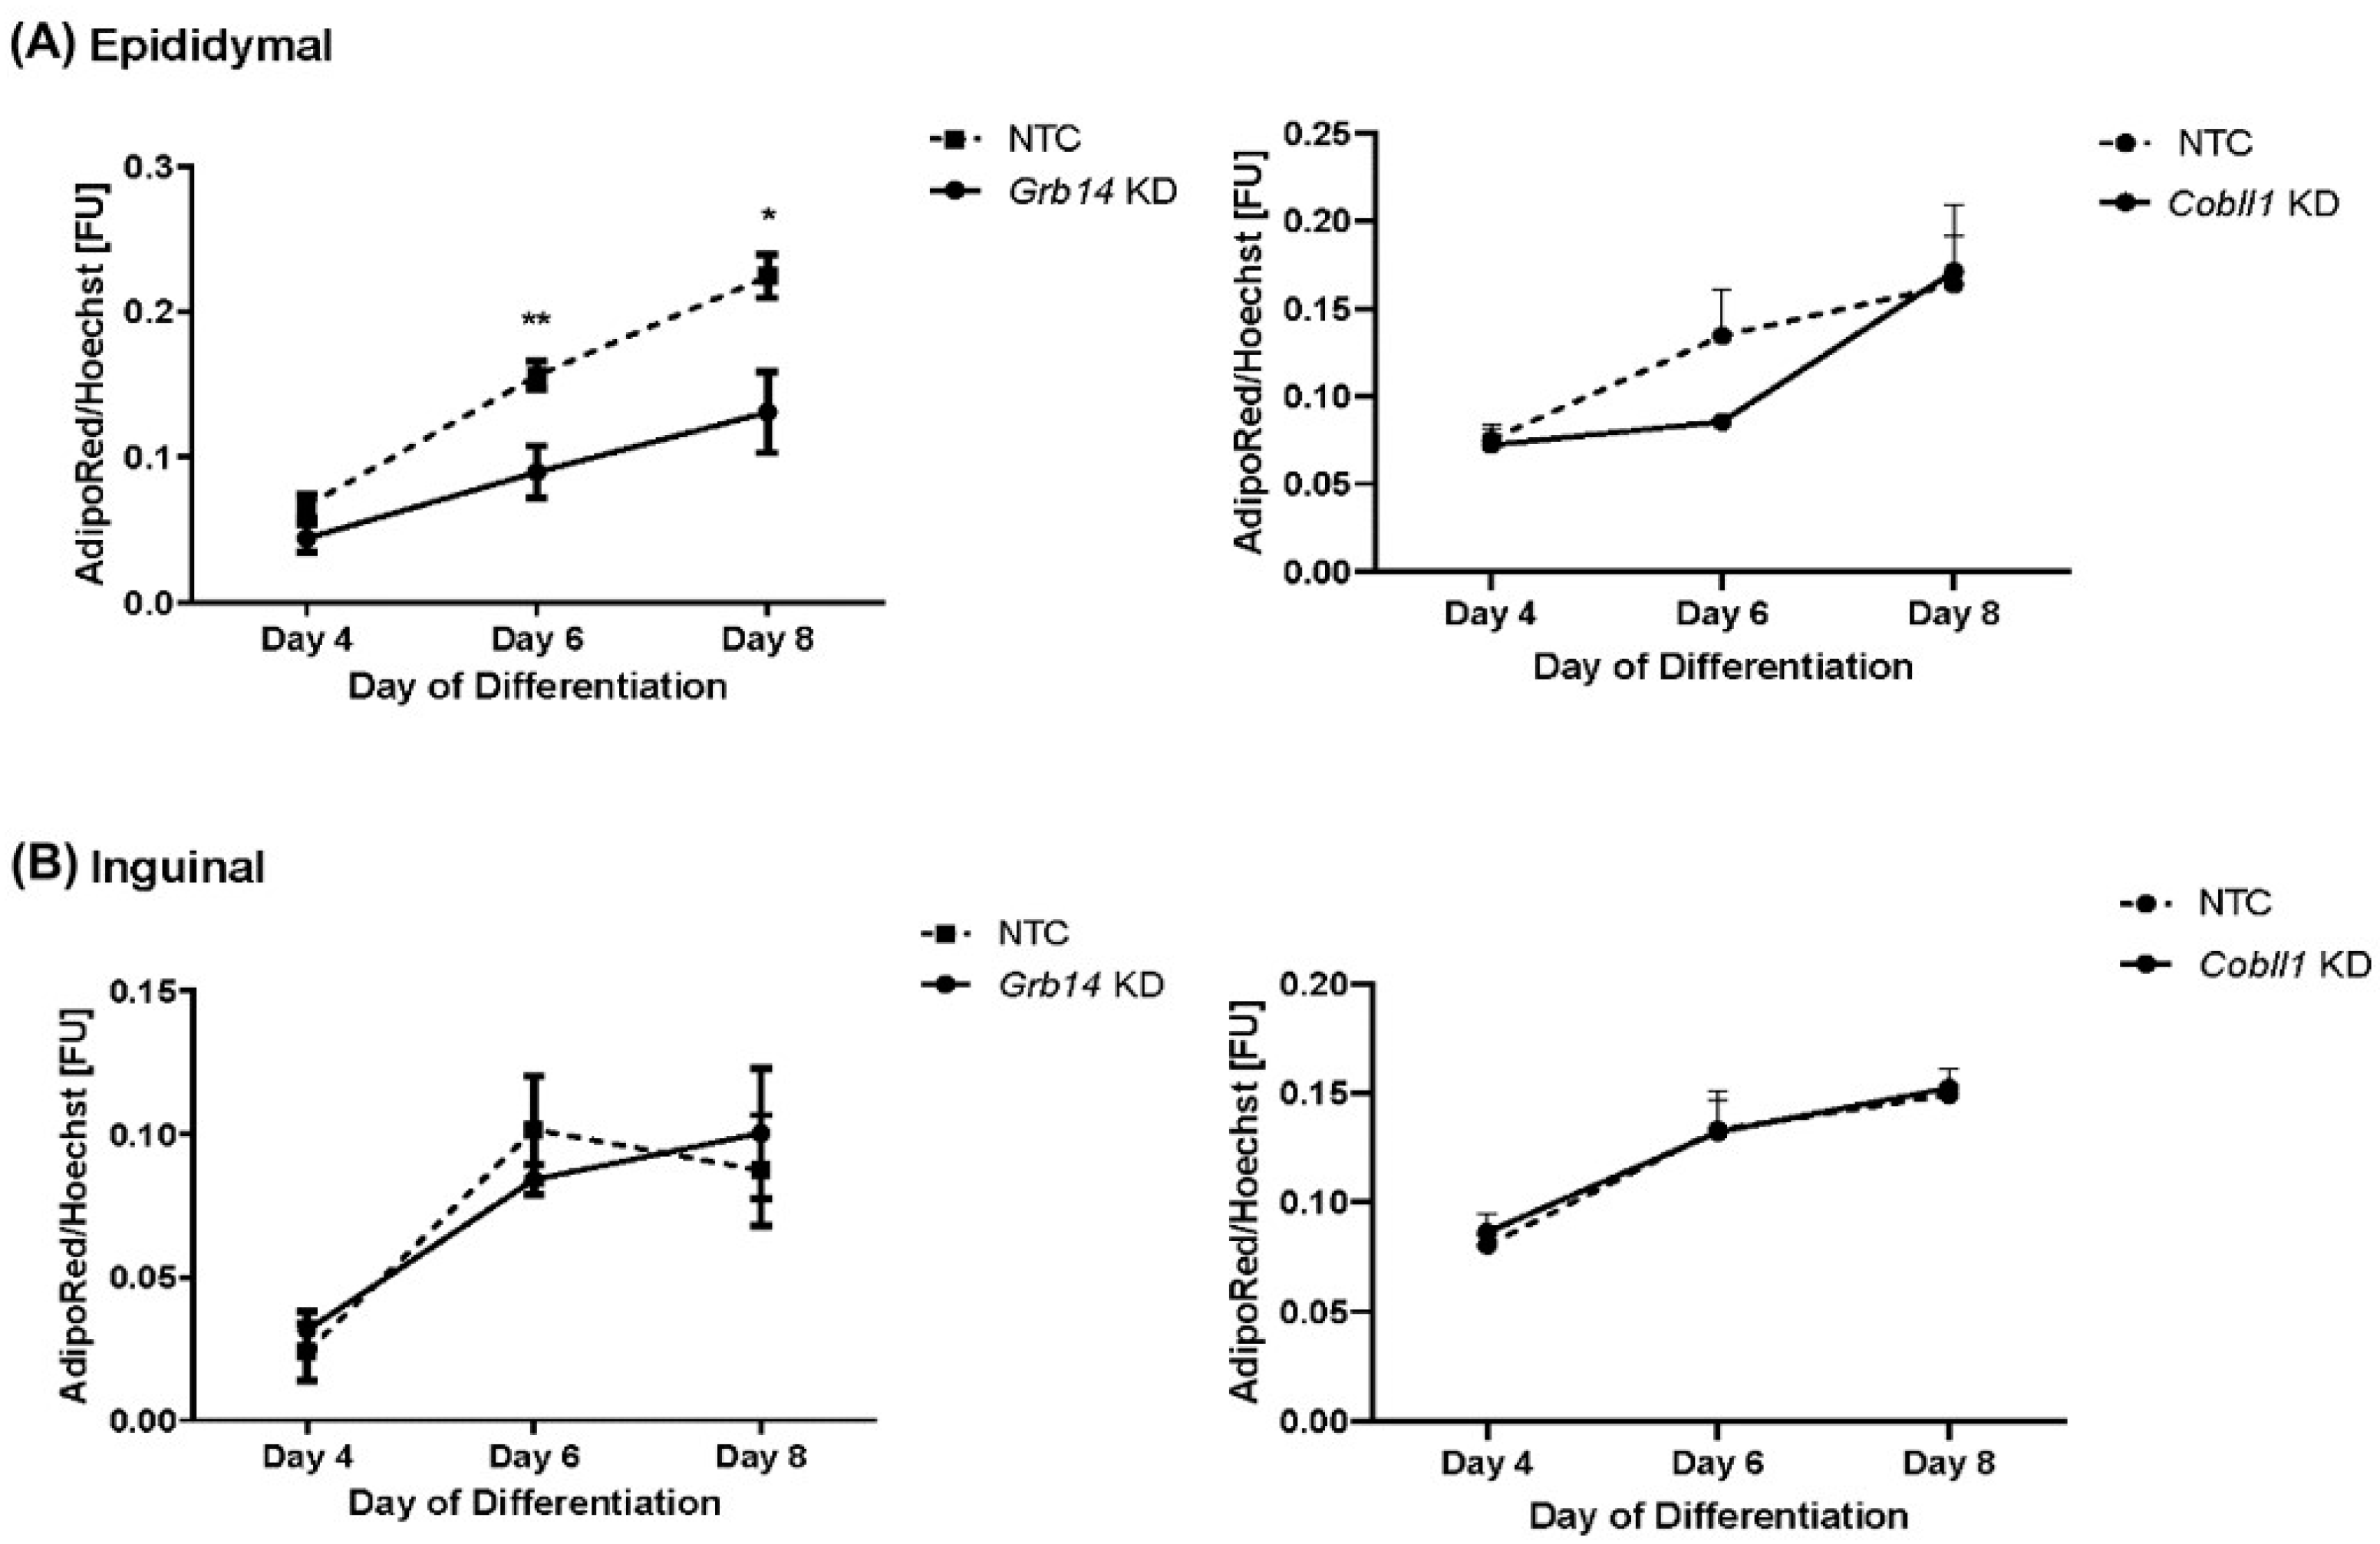
2.6. Decreased Lipid Accumulation in Grb14 Knockdown in Epididymal Cell Line

In vitro results showed that Grb14-knock-down (KD) significantly decreased lipid accumulation only in epididymal adipose tissue cells (p < 0.01 at Day 6 when tested vs. NTC controls) during adipogenesis, especially after 6 days of the induction of differentiation when the maximum lipid reduction was observed (Figure 8A). On the other hand, in inguinal adipose tissue cells, no significant change in lipid accumulation was observed when Grb14 gene expression was decreased (Figure 8B). Cobll1-KD, in both adipose tissue (epididymal and inguinal) cell lines, did not affect lipid accumulation during adipogenesis (Figure 8).

3. Discussion

GWAS identified a large number of previously unrecognized genetic loci that may increase susceptibility to developing obesity, adverse fat distribution, and metabolic diseases. However, functional studies are warranted to clarify mechanisms that mediate the association between the genotype and phenotype. Our study focused on a WHR-associated locus harboring two candidate genes, GRB14 and COBLL1, in the context of effects on obesity, fat distribution, and metabolic parameters. Our key findings are that GRB14 and COBLL1 mRNA expression is fat-depot-specific with differential expression between vis and sc AT and that these differences are gender sensitive. Furthermore, this correlates with measures of obesity/fat distribution and metabolic parameters related to T2D. Both vis and sc GRB14/COBLL1 gene expression correlate with T2D, but vis GRB14 expression is more of a risk factor for glucose metabolism because its mRNA expression is associated with HbA1c, FPG, and T2D independently of obesity. Moreover, rs10195252-T may present higher metabolic risk due to its association with increased transcript levels of the corresponding gene (GRB14 mRNA levels in vis AT). Both SNPs (rs10195252 and rs6738627) were associated with triglycerides, FPG, and leptin serum levels. Rs6738627-G is associated with a higher risk of type 2 diabetes. Briefly, our data support the role of GRB14/COBLL1 gene expression in body FD (vis/sc) and the role of the GRB14/COBLL1 locus in metabolic sequelae of adverse body FD, particularly in lipid metabolism and glucose homeostasis and lipid metabolism, which is likely due to changes in GRB14 expression in AT as suggested by the mediation analyses conducted here.

3.1. GRB14 and COBLL1 Expression Is Fat-Depot-Specific and Related to Obesity and T2D

It has been well-established that adverse body FD is associated with anthropometric and clinical outcomes such as metabolic and cardiovascular diseases [20,21,22]. Indeed, excess in vis adipose tissue imparts a greater risk of insulin resistance and T2D than excess of fat distributed subcutaneously [23,24]. In addition, sc AT seems to be protective against T2D, as its accumulation is associated with improved insulin sensitivity and beneficial lipid profile [25]. Here, we report significantly higher expression of COBLL1 and GRB14 in vis AT in patients with T2D, which seems to be independent of obesity. GRB14 gene expression in vis AT was associated with FPG and HbA1c, further underscoring the potential role of GRB14 in the development of T2D. This may not appear surprising, considering that GRB14 is a multi-domain growth factor receptor bound protein that binds the insulin receptor as a pseudo substrate-inhibitor of the catalytic activity of the insulin receptor [11,12]. GRB14 regulates physiological activity of insulin as had been demonstrated in Grb14 knockout mouse models [13,26,27], which showed improved glucose homeostasis and enhanced insulin signaling [26]. Consistent with these results, our in vitro results showed a decreased in lipid accumulation when we knock down Grb14 in epididymal adipocytes. In humans, GRB14 gene expression in skeletal muscle decreased after gastric bypass surgery accompanied by improved insulin sensitivity but increased in individuals with obesity [28]. Moreover, in vitro studies suggested the role of GRB14 in adipogenesis as well [18]. Consistently, albeit not significantly, our present study showed positive correlation between the GRB14 gene expression in vis AT and BMI.
In contrast to GRB14, the link between obesity related traits and COBLL1 is less clear. According to the gene ontology (GO) classification, COBLL1 is recognized as actin-monomer-binding and cadherin-binding protein. Although GWAS have suggested COBLL1 as a potential determinant of obesity, T2D, and impaired lipid metabolism, functional data are rather scarce to date. However, in support of the COBLL1 role in metabolic disease, our study not only demonstrates fat-depot-specific COBLL1 mRNA expression, but also a significantly lower COBLL1 expression in sc AT of patients with T2D. Considering previously reported associations between COBLL1 expression and lipid metabolism [18], our data suggest that the diminished COBLL1 expression may be related to adipose tissue dysfunction.
It is noteworthy that sexual dimorphism has been reported in GWAS for FD. In line with this, COBLL1 and GRB14 expression in AT showed evident sexual dimorphisms as well. COBLL1 expression, which was higher in sc AT compared to vis AT, was more pronounced in women. In contrast, GRB14 expression was higher in vis AT compared to sc AT and characteristic for men. Sex hormones might influence GRB14/COBLL1 expression in AT. Therefore, sex-specific effects need to be carefully considered in further studies aimed at clarifying the role of COBLL1 and GRB14 in adverse body FD and associated metabolic disorders.

3.2. Genetic Association of WHR-Related SNPs with Clinical Variables

It must be acknowledged that despite the clear evidence for strong correlations between COBLL1 and GRB14 mRNA expression levels in AT and metabolic traits related to obesity, the observed findings do not allow for drawing any conclusions regarding causal relationships between these entities. Therefore, mediation analyses such as, e.g., Mendelian randomization present a powerful tool to test the causal effect of a modifiable exposure on traits or diseases by using sequence variants in genes. Thus, we used this tool to test the associations of the reported WHR-SNPs on obesity and diabetes related metabolic traits. Rs10195252 and rs6738627 were as eQTLs for GRB14 in esophagus-muscularis and for COBLL1 in thyroid and brain-cerebellum tissues in GTEx database (www.gtexportal.org; accessed on 24 January 2022). Our data support rs10195252 as an eQTL for GRB14 in visceral adipose tissue. The two SNPs in this study were significantly associated with TG, FPG and leptin serum levels, which in part confirmed previously reported data (particularly the association between rs10195252 and TG, and between rs6738627 and leptin levels) [29,30]. Of note, recent GWAS meta-analyses reported nominal evidence for sex heterogeneity for rs10195252 (pheterogeneity = 0.039) with more effects on fasting insulin (FI) level in women than men [31]. In this study, we did not observe the association between rs10195252 and FI, even in the subgroup analyzed by gender. One possible reason is the limited statistical power to detect these associations (nour~1200 vs. nGWAS~96,000). Moreover, rs10195252 was associated with HbA1c and rs6738627 with adiponectin serum levels. Since both SNPs are in high LD (r2 = 0.81), the strong concordance of association results was not surprising. This is further emphasized by the relationship between the COBLL1/GRB14 locus and FD and lipid metabolism. We therefore sought to clarify how the respective target genes of these variants contribute to the complex etiology of obesity and diabetes. Surprisingly, the rs6738627 showed significant association with T2D, as the risk of T2D for the homozygous G-allele carrier is 85% higher than for the homozygous A-allele carrier (Table 1). Furthermore, statistical analyses also presented an 83% increased risk of T2D for homozygous G-allele carriers in patients with BMI ≥ 40 kg/m2 (Table S2). Albeit not significantly associated with T2D in this study, rs10195252 was associated with T2D in previous GWAS, presenting a 7% higher risk only for T-allele carrier [32]. In summary, the SNP association analysis on rs6738627 and rs1019525 partly confirmed already known associations with traits within the loci reported by previous GWAS. Moreover, our study strengthened these findings by further genetic associations with numerous obesity-related metabolic traits (e.g., rs10195252 with FPG, leptin and HbA1c; rs6738627 with T2D, FPG, leptin, TG, and adiponectin). Altogether, both previous studies as well as the present study clearly point to the importance of the GRB14/COBLL1 area in association with T2D and metabolism traits. Notably, rs6738627 has been reported as a potential candidate locus for T2D that deserves further attention [9].
Considering the relationship between GRB14 and COBLL1 mRNA expression in AT with obesity and diabetes-related parameters, as well as taking into account the above-mentioned SNP associations with metabolic traits, we conducted mediation analyses by statistically simulating the causal relationship between rs10195252 and GRB14 mRNA expression in vis AT and HbA1c. We found GRB14 gene expression in vis AT fully mediating the effects of rs10195252 on HbA1c (Table S4). Interestingly, there is a marked correlation between COBLL1 and GRB14 gene expression in AT. This may be due to the fact that GRB14 and COBLL1 are directly neighboring on the chromosome, and both genes might share the same promoters activating common transcriptional mechanisms (e.g., enhancer). In line with this, data from the public available database for the retrieval of interacting genes (STRING) implicated that the co-expression and interaction of GRB14 and COBLL1 may occur via gene fusions [33]. Our simulated data showed that GRB14 gene expression in AT suppressed, at least in part, the direct effect of the rs10195252 on COBLL1 gene expression. Considering the strong correlation of GRB14/COBLL1 mRNA expression in AT and its potential function on lipid metabolism, we may need to consider the interaction of COBLL1 and GRB14 in adverse body FD and associated metabolic disorders in further studies.
Our study has some limitations that need to be acknowledged. Although we measured COBLL1 and GRB14 mRNA expression in a relatively high number (n = 560) of paired human sc and vis AT samples, we are aware that this sample size still limits the power of our study to detect weaker correlations. Similarly, we studied two SNPs in ~1200 samples; thus, the statistical power is markedly lower than in reported GWAS. Admittedly, most of the observed nominal significant associations between SNPs and traits related to adverse FD or obesity would not withstand corrections for multiple testing.

4. Materials and Methods

4.1. Subjects

The cohort includes a total of 2860 metabolically well-characterized participants (Table 2) of the Leipzig Obesity BioBank, recruited at four bariatric surgery centers in Leipzig, Karlsruhe, Dresden, and Gera (all in Germany). All subjects underwent routine clinical phenotyping as described previously [34,35]. All subjects had a stable weight, defined as fluctuations of <2% of body weight for at least 3 months before surgery. According to ADA criteria [36], 1034 subjects were diagnosed with type 2 diabetes (T2D), and 1826 had normal glucose tolerance (NGT). Furthermore, patients who had acute or chronic hepatic, inflammatory, infectious, or neoplastic diseases were excluded from the study. The study was approved by the ethics committee of the University of Leipzig (approval numbers: 159-12-21052012, 017-12-23012012). The study design follows the Declaration of Helsinki, and all participants gave written informed consent prior to participation.

4.2. COBLL1 and GRB14 mRNA Expression Analyses in AT

Paired samples of abdominal omental (visceral, vis) and sc AT were obtained from 560 Caucasian men (n = 149) and women (n = 411) who underwent open abdominal surgery as described previously [37]. The age ranged from 18 to 85 years and BMI from 18.5 to 90 kg/m2. After surgery, AT was immediately frozen in liquid nitrogen and stored at −80 °C. RNA was extracted from AT by using RNeasy Lipid Tissue Mini Kit (Qiagen, Hilden, Germany), and quantitative (q) PCR was performed as described [37,38]. Real-time qPCR was performed with the TaqMan Assay predesigned by Applied Biosystems (Foster City, CA, USA) for the detection of human GRB14 (Hs00938593_m1), COBLL1 (Hs01117513_m1), and glyceraldehyde 3-phosphate dehydrogenase (GAPDH) (Hs 02786624_g1) mRNA expression in AT. All reactions were carried out in 96-well plates using the QuantStudioTM 6 Flex System Fast Real-Time PCR system. COBLL1 and GRB14 mRNA expression was calculated relative to GAPDH mRNA expression.

4.3. Genotyping

Genotyping of the two SNPs rs10195252 and rs6738627 was conducted according to the manufacturer’s protocol using the SNP genotyping probes C_10003489_10 (rs6738627) and C_121021_10 (rs10195252) (Thermo Fisher Scientific, Waltham, MA, USA) and the ABI PRISM 7500 Sequence Detecting System (Life Technologies, Foster City, CA, USA). To control genotyping quality, a random selection of about 5% of samples were re-genotyped for both SNPs. All genotypes matched the initial designated genotypes. Genotype distributions were in Hardy–Weinberg equilibrium, all presenting p > 0.05.

4.4. Mediation Analysis

To test for the causative relationship between the genetic variant (independent variable), the expression of either GRB14 or COBLL1 (mediator), and the dependent variable (outcome of correlation analysis), the simple mediation model of the SPSS macro by Preacher and Hayes was used (Model 4, including the Sobel Test for testing the significance of the direct and indirect effects; bootstrapping procedure of 5000 samples providing 95% confidence interval (CI)).

4.5. In Vitro Grb14 and Cobll1 Knockdown in Murine Epididymal and Inguinal Cell Lines

Adipose tissue of newborn FVB mice was extracted and immortalized using the SV40 T antigen as described in detail elsewhere [39]. These immortalized epididymal and inguinal adipocytes were cultured and differentiated according to the reported protocols [39,40]. Epididymal fat was considered as the visceral adipose depot and inguinal was considered as the subcutaneous fat depot. Shortly, cells were grown in Dulbecco’s modified Eagle’s medium (high glucose) supplemented 20% fetal bovine serum at 37 °C and 5% CO2 until reaching 80% confluence. Three days prior to induction, electroporation transfection of siRNA into the cell was performed using Neon® Transfection System. Subsequently, induction was initiated by adding 0.125 mM indomethacine, 2 µg/mL dexamethasone, and 0.5 mM isobutylmethylxanthine to the growth medium for 24 h and for differentiation; growth medium was supplemented with 20 mM insulin and 1 nM triiodthyronine. A second chemical transfection method was perfomed one day after the induction. In this case, the transfection Reagent DharmaFECT® was used. Cells were grown for 8 days in differentiation medium. Thus, cells were harvested at time point: 80% confluence (=day−2), day 0 (=day of induction), day 2, 4, 6, 8 (=2, 4, 6, 8 days after induction), and washed and frozen immediately at −80 °C until RNA or protein extraction. All differentiation lines were run in triplicate. Adipocyte differentiation and lipid droplet accumulation was monitored by AdipoRedTM staining (Lonza, Basel Switzerland); siRNA for Grb14 (Horizon, Catalog ID: L-044828-00-0005), Cobll1 (Horizon, Catalog ID: L-051032-01-0005), and a negative control (ON-TARGETplus Non-Targeting Pool, Horizon, Catalog ID: D-001810-10-20) were used. Grb14 and Cobll1 knock-downs were validated at mRNA and protein level. The mRNA knockdown efficiency was 40% and 50% knock-down in inguinal and epididymal, respectively (Figure S1).

4.6. Statistical Analysis

Statistical tests were performed using the IBM SPSS Statistic 25 software (IBM Corp., Armok, NY, USA). Normal distribution of variables included in this study was checked prior statistical analyses and logarithmically transformed to achieve approximate normal distribution. Differences in mRNA expression between vis and sc AT were assessed using the paired Student’s t-test. Unpaired t-Test was used to analyze differences in adipose tissue mRNA expression among the groups. Logistic regression analyses have been conducted for the association of the SNP and the obesity/diabetes status. Linear regression analyses were used to assess the relationship between genetic variants/mRNA expression levels and quantitative metabolic traits. Pearson’s correlation analyses were conducted using two-way bivariate correlations. The additive model (with genotypes coded to 0, 1, and 2) was used, and if not stated otherwise, all p-values are adjusted for age, sex, and BMI. Two-sided p-values ≤ 0.05 were considered to provide evidence for nominal association and are presented without correction for multiple hypothesis testing.

5. Conclusions

Our data support the role of GRB14/COBLL1 gene expression in body fat distribution (vis/sc) and the GRB14/COBLL1 locus in metabolic sequelae of adverse fat distribution. In particular, their role in lipid metabolism and glucose homeostasis is likely to be mediated by GRB14 gene expression in visceral AT. Considering the mediation, which is largely based on statistical modeling with genetic variants, it will now be inevitable to confirm these findings in functional experiments in vitro and/or in vivo to better understand molecular mechanisms underlying the SNP associations with adverse body FD.

Supplementary Materials

The following supporting information can be downloaded at: https://www.mdpi.com/article/10.3390/ijms23158558/s1.

Author Contributions

Conceptualization, E.G.-J., J.B. and P.K.; methodology, C.S. (Chang Sun), B.G. and F.F.; investigation, C.S. (Chang Sun), F.F., Y.M., C.S. (Christine Stroh), A.D., M.R.S., D.G., T.L., M.D., J.B. and E.G.-J.; formal analysis, C.S. (Chang Sun), F.F. and E.G.-J.; resources, Y.M., C.S. (Christine Stroh), A.D., M.R.S., D.G., T.L., M.D., M.S., P.K. and M.B.; writing—original draft preparation, C.S., F.F. and E.G.-J.; writing—review and editing, C.S. (Chang Sun), F.F., B.G., Y.M., C.S. (Christine Stroh), A.D., M.R.S., D.G., T.L., M.D., P.K., M.S., M.B., J.B. and E.G.-J.; supervision, P.K., J.B. and E.G.-J.; funding acquisition, M.B. and P.K. All authors have read and agreed to the published version of the manuscript.

Funding

This work was supported by the Deutsche Forschungsgemeinschaft (DFG, German Research Foundation) through CRC 1052, project number 209933838, subproject B1 to M.B. and subproject B3 to P.K., by Deutsches Zentrum für Diabetesforschung (DZD, Grant: 82DZD00601) to M.B., P.K., E.G.-J. and by China Scholarship Council to C.S. (Chang Sun).

Institutional Review Board Statement

The study was conducted in accordance with the Declaration of Helsinki and approved by the Institutional Review Board (or Ethics Committee) of the University of Leipzig (Approval numbers: 159-12-21052012 (May 2012) and 017-12-23012012 (January 2012)).

Informed Consent Statement

Informed consent was obtained from all subjects involved in the study. Written informed consent has been obtained from the patient(s) to publish this paper.

Data Availability Statement

Not applicable.

Acknowledgments

The authors would like to thank all study participants who took part in the study. Further, we would also like to thank Johannes Klein (University of Lübeck, Germany) for providing the immortalized mice cell lines and to Manuela Quandt, Claudia Ruffert, Daniela Kern, and Susan Berthold for their technical support.

Conflicts of Interest

The authors declared no conflict of interest.

References

  1. Heymsfield, S.B.; Wadden, T.A. Mechanisms, Pathophysiology, and Management of Obesity. N. Engl. J. Med. 2017, 376, 254–266. [Google Scholar] [CrossRef] [PubMed]
  2. Khera, A.V.; Chaffin, M.; Wade, K.H.; Zahid, S.; Brancale, J.; Xia, R.; Distefano, M.; Senol-Cosar, O.; Haas, M.E.; Bick, A.; et al. Polygenic Prediction of Weight and Obesity Trajectories from Birth to Adulthood. Cell 2019, 177, 587–596.e9. [Google Scholar] [CrossRef] [PubMed] [Green Version]
  3. Khera, A.V.; Chaffin, M.; Aragam, K.G.; Haas, M.E.; Roselli, C.; Choi, S.H.; Natarajan, P.; Lander, E.S.; Lubitz, S.A.; Ellinor, P.T.; et al. Genome-wide polygenic scores for common diseases identify individuals with risk equivalent to monogenic mutations. Nat. Genet. 2018, 50, 1219–1224. [Google Scholar] [CrossRef]
  4. Sun, C.; Kovacs, P.; Guiu-Jurado, E. Genetics of Obesity in East Asians. Front. Genet. 2020, 11, 575049. [Google Scholar] [CrossRef]
  5. Sun, C.; Kovacs, P.; Guiu-Jurado, E. Genetics of Body Fat Distribution: Comparative Analyses in Populations with European, Asian and African Ancestries. Genes 2021, 12, 841. [Google Scholar] [CrossRef]
  6. Heid, I.M.; Jackson, A.U.; Randall, J.C.; Winkler, T.W.; Qi, L.; Steinthorsdottir, V.; Thorleifsson, G.; Zillikens, M.C.; Speliotes, E.K.; Mägi, R.; et al. Meta-analysis identifies 13 new loci associated with waist-hip ratio and reveals sexual dimorphism in the genetic basis of fat distribution. Nat. Genet. 2010, 42, 949–960. [Google Scholar] [CrossRef] [PubMed] [Green Version]
  7. Ridker, P.M.; Paré, G.; Parker, A.N.; Zee, R.Y.; Miletich, J.P.; Chasman, D.I. Polymorphism in the CETP Gene Region, HDL Cholesterol, and Risk of Future Myocardial Infarction. Circ. Cardiovasc. Genet. 2009, 2, 26–33. [Google Scholar] [CrossRef] [Green Version]
  8. Shungin, D.; Winkler, T.W.; Croteau-Chonka, D.C.; Ferreira, T.; Locke, A.E.; Mägi, R.; Strawbridge, R.J.; Pers, T.H.; Fischer, K.; Justice, A.E.; et al. New genetic loci link adipose and insulin biology to body fat distribution. Nature 2015, 518, 187–196. [Google Scholar] [CrossRef] [PubMed] [Green Version]
  9. Lu, Y.; Day, F.R.; Gustafsson, S.; Buchkovich, M.L.; Na, J.; Bataille, V.; Cousminer, D.L.; Dastani, Z.; Drong, A.W.; Esko, T.; et al. New loci for body fat percentage reveal link between adiposity and cardiometabolic disease risk. Nat. Commun. 2016, 7, 10495. [Google Scholar] [CrossRef]
  10. Manning, A.K.; Hivert, M.-F.; Scott, R.A.; Grimsby, J.L.; Bouatia-Naji, N.; Chen, H.; Rybin, D.; Liu, C.-T.; Bielak, L.F.; Pro-kopenko, I.; et al. A genome-wide approach accounting for body mass index identifies genetic variants influencing fasting glycemic traits and insulin resistance. Nat. Genet. 2012, 44, 659–669. [Google Scholar] [CrossRef]
  11. Depetris, R.S.; Hu, J.; Gimpelevich, I.; Holt, L.; Daly, R.; Hubbard, S.R. Structural Basis for Inhibition of the Insulin Receptor by the Adaptor Protein Grb14. Mol. Cell 2005, 20, 325–333. [Google Scholar] [CrossRef] [PubMed] [Green Version]
  12. Béréziat, V.; Kasus-Jacobi, A.; Perdereau, D.; Cariou, B.; Girard, J.; Burnol, A.-F. Inhibition of Insulin Receptor Catalytic Activity by the Molecular Adapter Grb14. J. Biol. Chem. 2002, 277, 4845–4852. [Google Scholar] [CrossRef] [Green Version]
  13. Popineau, L.; Morzyglod, L.; Carré, N.; Caüzac, M.; Bossard, P.; Prip-Buus, C.; Lenoir, V.; Ragazzon, B.; Fauveau, V.; Robert, L.; et al. Novel Grb14-Mediated Cross Talk between Insulin and p62/Nrf2 Pathways Regulates Liver Lipogenesis and Selective Insulin Resistance. Mol. Cell. Biol. 2016, 36, 2168–2181. [Google Scholar] [CrossRef] [Green Version]
  14. Carré, N.; Caüzac, M.; Girard, J.; Burnol, A.-F. Dual Effect of the Adapter Growth Factor Receptor-Bound Protein 14 (Grb14) on Insulin Action in Primary Hepatocytes. Endocrinology 2008, 149, 3109–3117. [Google Scholar] [CrossRef] [PubMed] [Green Version]
  15. Carroll, E.A.; Gerrelli, D.; Gasca, S.; Berg, E.; Beier, D.R.; Copp, A.; Klingensmith, J. Cordon-bleu is a conserved gene involved in neural tube formation. Dev. Biol. 2003, 262, 16–31. [Google Scholar] [CrossRef] [Green Version]
  16. Han, S.H.; Kim, S.-H.; Kim, H.-J.; Lee, Y.; Choi, S.-Y.; Park, G.; Kim, D.-H.; Lee, A.; Kim, J.; Choi, J.-M.; et al. Cobll1 is linked to drug resistance and blastic transformation in chronic myeloid leukemia. Leukemia 2017, 31, 1532–1539. [Google Scholar] [CrossRef]
  17. Plešingerová, H.; Janovská, P.; Mishra, A.; Smyčková, L.; Poppová, L.; Libra, A.; Plevová, K.; Ovesná, P.; Radová, L.; Doubek, M.; et al. Expression of COBLL1 encoding novel ROR1 binding partner is robust predictor of survival in chronic lymphocytic leukemia. Haematologica 2017, 103, 313–324. [Google Scholar] [CrossRef] [Green Version]
  18. Chen, Z.; Yu, H.; Shi, X.; Warren, C.R.; Lotta, L.A.; Friesen, M.; Meissner, T.B.; Langenberg, C.; Wabitsch, M.; Wareham, N.; et al. Functional Screening of Candidate Causal Genes for Insulin Resistance in Human Preadipocytes and Adipocytes. Circ. Res. 2020, 126, 330–346. [Google Scholar] [CrossRef]
  19. Schleinitz, D.; Klöting, N.; Lindgren, C.; Breitfeld, J.; Dietrich, A.; Schön, M.R.; Lohmann, T.; Dreßler, M.; Stumvoll, M.; McCarthy, M.; et al. Fat depot-specific mRNA expression of novel loci associated with waist-hip ratio. Int. J. Obes. 2013, 38, 120–125. [Google Scholar] [CrossRef]
  20. Jensen, M.D. Role of Body Fat Distribution and the Metabolic Complications of Obesity. J. Clin. Endocrinol. Metab. 2008, 93, s57–s63. [Google Scholar] [CrossRef] [Green Version]
  21. Pischon, T.; Boeing, H.; Hoffmann, K.; Bergmann, M.; Schulze, M.B.; Overvad, K.; Van Der Schouw, Y.T.; Spencer, E.; Moons, K.G.M.; Tjønneland, A.; et al. General and Abdominal Adiposity and Risk of Death in Europe. N. Engl. J. Med. 2008, 359, 2105–2120. [Google Scholar] [CrossRef] [PubMed] [Green Version]
  22. Yusuf, S.; Hawken, S.; Ôunpuu, S.; Bautista, L.; Franzosi, M.G.; Commerford, P.; Lang, C.C.; Rumboldt, Z.; Onen, C.L.; Lisheng, L.; et al. Obesity and the risk of myocardial infarction in 27 000 participants from 52 countries: A case-control study. Lancet 2005, 366, 1640–1649. [Google Scholar] [CrossRef]
  23. Wang, Y.; Rimm, E.B.; Stampfer, M.J.; Willett, W.C.; Hu, F.B. Comparison of abdominal adiposity and overall obesity in predicting risk of type 2 diabetes among men. Am. J. Clin. Nutr. 2005, 81, 555–563. [Google Scholar] [CrossRef] [PubMed] [Green Version]
  24. Misra, M.; Bredella, M.A.; Tsai, P.; Mendes, N.; Miller, K.K.; Klibanski, A. Lower growth hormone and higher cortisol are associated with greater visceral adiposity, intramyocellular lipids, and insulin resistance in overweight girls. Am. J. Physiol. Metab. 2008, 295, E385–E392. [Google Scholar] [CrossRef] [PubMed] [Green Version]
  25. Karastergiou, K.; Fried, S.K. Multiple Adipose Depots Increase Cardiovascular Risk via Local and Systemic Effects. Curr. Atheroscler. Rep. 2013, 15, 361. [Google Scholar] [CrossRef] [Green Version]
  26. Cooney, G.J.; Lyons, R.J.; Crew, A.J.; Jensen, T.E.; Molero, J.C.; Mitchell, C.J.; Biden, T.J.; Ormandy, C.J.; James, D.E.; Daly, R.J. Improved glucose homeostasis and enhanced insulin signalling in Grb14-deficient mice. EMBO J. 2004, 23, 582–593. [Google Scholar] [CrossRef] [Green Version]
  27. Holt, L.J.; Lyons, R.J.; Ryan, A.S.; Beale, S.M.; Ward, A.; Cooney, G.J.; Daly, R.J. Dual Ablation of Grb10 and Grb14 in Mice Reveals Their Combined Role in Regulation of Insulin Signaling and Glucose Homeostasis. Mol. Endocrinol. 2009, 23, 1406–1414. [Google Scholar] [CrossRef]
  28. Park, J.-J.; Berggren, J.R.; Hulver, M.W.; Houmard, J.A.; Hoffman, E.P. GRB14, GPD1, and GDF8 as potential network collaborators in weight loss-induced improvements in insulin action in human skeletal muscle. Physiol. Genom. 2006, 27, 114–121. [Google Scholar] [CrossRef] [Green Version]
  29. Kilpeläinen, T.O.; Carli, J.F.M.; Skowronski, A.A.; Sun, Q.; Kriebel, J.; Feitosa, M.F.; Hedman, Å.K.; Drong, A.W.; Hayes, J.E.; Zhao, J.; et al. Genome-wide meta-analysis uncovers novel loci influencing circulating leptin levels. Nat. Commun. 2016, 7, 10494. [Google Scholar] [CrossRef]
  30. Teslovich, T.M.; Musunuru, K.; Smith, A.V.; Edmondson, A.C.; Stylianou, I.M.; Koseki, M.; Pirruccello, J.P.; Ripatti, S.; Chasman, D.I.; Willer, C.J.; et al. Biological, clinical and population relevance of 95 loci for blood lipids. Nature 2010, 466, 707–713. [Google Scholar] [CrossRef]
  31. Lagou, V.; Mägi, R.; Hottenga, J.-J.; Grallert, H.; Perry, J.R.B.; Bouatia-Naji, N.; Marullo, L.; Rybin, D.; Jansen, R.; Min, J.L.; et al. Sex-dimorphic genetic effects and novel loci for fasting glucose and insulin variability. Nat. Commun. 2021, 12, 24. [Google Scholar] [CrossRef] [PubMed]
  32. Mahajan, A.; Taliun, D.; Thurner, M.; Robertson, N.R.; Torres, J.M.; Rayner, N.W.; Payne, A.J.; Steinthorsdottir, V.; Scott, R.A.; Grarup, N.; et al. Fine-mapping type 2 diabetes loci to single-variant resolution using high-density imputation and islet-specific epigenome maps. Nat. Genet. 2018, 50, 1505–1513. [Google Scholar] [CrossRef] [PubMed] [Green Version]
  33. STRING CONSORTIUM. 2021. Available online: https://string-db.org/cgi/network?taskId=bgS30COMyNqT&sessionId=bkY8toNhfF54 (accessed on 16 September 2021).
  34. Klöting, N.; Fasshauer, M.; Dietrich, A.; Kovacs, P.; Schön, M.R.; Kern, M.; Stumvoll, M.; Blüher, M. Insulin-sensitive obesity. Am. J. Physiol. Endocr. Metab. 2010, 299, E506–E515. [Google Scholar] [CrossRef] [PubMed]
  35. Blüher, M.; Unger, R.; Rassoul, F.; Richter, V.; Paschke, R. Relation between glycaemic control, hyperinsulinaemia and plasma concentrations of soluble adhesion molecules in patients with impaired glucose tolerance or Type II diabetes. Diabetologia 2002, 45, 210–216. [Google Scholar] [CrossRef] [Green Version]
  36. American Diabetes Association. Diagnosis and Classification of Diabetes Mellitus. Diabetes Care 2014, 37 (Suppl. S1), S81–S90. [Google Scholar] [CrossRef] [Green Version]
  37. Mardinoglu, A.; Heiker, J.T.; Gärtner, D.; Björnson, E.; Schön, M.R.; Flehmig, G.; Klöting, N.; Krohn, K.; Fasshauer, M.; Stumvoll, M.; et al. Extensive weight loss reveals distinct gene expression changes in human subcutaneous and visceral adipose tissue. Sci. Rep. 2015, 5, 14841. [Google Scholar] [CrossRef]
  38. Gesta, S.; Blüher, M.; Yamamoto, Y.; Norris, A.W.; Berndt, J.; Kralisch, S.; Boucher, J.; Lewis, C.; Kahn, C.R. Evidence for a role of developmental genes in the origin of obesity and body fat distribution. Proc. Natl. Acad. Sci. USA 2006, 103, 6676–6681. [Google Scholar] [CrossRef] [Green Version]
  39. Klein, J.; Fasshauer, M.; Ito, M.; Lowell, B.B.; Benito, M.; Kahn, C.R. β3-Adrenergic Stimulation Differentially Inhibits Insulin Signaling and Decreases Insulin-induced Glucose Uptake in Brown Adipocytes. J. Biol. Chem. 1999, 274, 34795–34802. [Google Scholar] [CrossRef] [Green Version]
  40. Kovsan, J.; Osnis, A.; Maissel, A.; Mazor, L.; Tarnovscki, T.; Hollander, L.; Ovadia, S.; Meier, B.; Klein, J.; Bashan, N.; et al. Depot-specific adipocyte cell lines reveal differential drug-induced responses of white adipocytes—Relevance for partial lipodystrophy. Am. J. Physiol. Metab. 2009, 296, E315–E322. [Google Scholar] [CrossRef] [Green Version]
Figure 1. (A) COBLL1 and GRB14 mRNA expression in 524/560 paired human visceral (vis) and subcutaneous (sc) adipose tissue (AT) samples in the total cohort and grouped by sex (131/149 men, 393/411 women). Data are shown as mean ± SEM; *** for comparisons between sc and vis fat depot expression; # for comparison between men and women in the same AT depot; # p < 0.05; ## p< 0.01; *** p < 0.001. (B) COBLL1 and GRB14 mRNA expression in paired human visceral (vis) and subcutaneous (sc) adipose tissue (AT) samples grouped by obesity status (BMI < 30 kg/m2, n = 19; 30 ≤ BMI < 40 kg/m2, n = 47; BMI ≥ 40 kg/m2, n = 454). Mean ± SEM; ** sc vs. vis AT depot; # 30–40 kg/m2 ≥ 40 kg/m2 vs. <30 kg/m2 depot; # p < 0.05; ** p < 0.01; *** p < 0.001.
Ijms 23 08558 g001
Figure 2. Correlation between AT COBLL1/GRB14 mRNA expression and fat distribution variables. The correlation of natural log transformed sc COBLL1/GRB14 mRNA levels with waist circumference (A,B, n = 59/53) and hip circumference (C,D, n = 43/37) is shown. Pearson correlation coefficients and corresponding p-value have been included; padj: adjusted by BMI, age, and sex; sc: subcutaneous adipose tissue.
Ijms 23 08558 g002
Figure 3. (A) COBLL1 and GRB14 mRNA expression in paired human visceral (vis) and subcutaneous (sc) adipose tissue (AT) samples grouped by type 2 diabetes status (NGT: subjects with normal glucose tolerance, n = 238; IGT: subjects with impaired glucose tolerance, n = 10; subjects with Type 2 diabetes, n = 197). Mean ± SEM; *vis vs. sc AT depot; #IGT/T2D vs. NGT; # p < 0.05; ## p < 0.01; *** p < 0.001. (B) COBLL1 and GRB14 mRNA in paired human visceral (vis) and subcutaneous (sc) adipose tissue (AT) samples grouped by type 2 diabetes status in BMI ≥ 40 kg/m2 patients. (NGT: subjects with normal glucose tolerance, n = 200; IGT: subjects with impaired glucose tolerance, n = 9; T2D: subjects with diabetes, n = 175). Mean ± SEM; *vis vs. sc AT depot; #IGT/T2D vs. NGT; */# p < 0.05; ## p < 0.01; *** p < 0.001.
Ijms 23 08558 g003
Figure 4. Correlation between vis AT GRB14 mRNA expression glucose variables. The correlation of natural log transformed vis GRB14 mRNA levels with fasting plasma glucose (n = 473) and glycated haemoglobin (HbA1c) (n = 309) is shown. Pearson correlation coefficients and corresponding p-value have been included; padj: adjusted by BMI, age, and sex; vis: visceral adipose tissue.
Ijms 23 08558 g004
Figure 5. Association analyses of rs6738627 and rs10195252 with metabolic traits. (A) Association analyses of rs6738627 with FPG, leptin, TG, and adiponectin. (B) Association analyses of rs10195252 with FPG, leptin, TG, and HbA1c. * p < 0.05; ** p < 0.01; p adjusted for sex, age, and BMI.
Ijms 23 08558 g005
Figure 6. Association of rs6738627 and rs10195252 with COBLL1 and GRB14 mRNA expression in visceral (vis) and subcutaneous (sc) AT. (A) shows the rs6738627 associated with COBLL1 and GRB14 mRNA expression in both ATs. (B) shows the rs10195252 associated with COBLL1 and GRB14 mRNA expression in both ATs. Data are given as arithmetic mean ± SEM; p < 0.05 in additive mode of inheritance; adjusted for sex, age, BMI.
Ijms 23 08558 g006
Figure 7. The correlation of GRB14 and COBLL1 mRNA expression in visceral (vis) and subcutaneous (sc) AT. The correlation of natural log transformed vis COBLL1/GRB14 mRNA levels (n = 563) and sc COBLL1/GRB14 mRNA (n = 486) are shown. Pearson correlation coefficients and corresponding p-value have been included; padj: adjusted by BMI, age, and sex.
Ijms 23 08558 g007
Figure 8. Quantification of lipid droplets by measuring the AdipoRedTM fluorescence signal normalized to the Hoechst fluorescence signal. Lipid droplets quantification (A) in the epididymal cell line and (B) in the inguinal cell line. Lipid accumulation normalized to the Hoechst signal compared to NTC (non-silencing siRNA group). AdipoRed stains the triglycerides of the lipid droplets and Hoechst stains the nuclei of cells. KD: knock-down. * p < 0.05, ** p < 0.01.
Ijms 23 08558 g008
Table 1. Case control study for type 2 diabetes.
Genetic VariantsNGTT2DMAF NGT/T2Dp-Value (Add Model) adj. for Age, Sex, BMI (OR [95% CI])(a) p-Value (Add Model) adj. for Age, Sex, BMI (OR [95% CI])
rs6738627 (G/A)
GG215 (36.7%)176 (38.1%)0.4/0.360.018(1.269 [1.041–1.547])0.005 (1.85 [1.21–2.83])
AG270 (46.1%)235 (50.9%)0.006 (1.78 [1.18–2.68])
AA101 (17.2%)51 (11%)
rs10195252 (T/C)
CC132 (19%)94 (17%)0.43/0.420.339 (1.09 [0.914–1.3])
TC334 (47.8%)285 (52%)
TT233 (33.2)174 (31%)
NGT: subjects with normal glucose tolerance; T2D: subjects with type 2 diabetes; MAF: minor allele frequency; OR: odds ratio for the minor allele; CI: confidence interval; add: additive model; adj: adjusted; (a): T2D logistic regression for rs6738627, AA as an indicator, adjusted for sex, age, and BMI.
Table 2. Anthropometric and metabolic characteristics of the studied cohort.
BMI < 30 kg/m2BMI 30~40 kg/m2BMI ≥ 40 kg/m2
(N = 256)(N = 354)(N = 2250)
Age (years)61 ± 1550 ± 1346 ± 12
Women/Men (n)134/122248/1061585/665
T2D (n)36118880
Body weight (kg)72 ± 11.6104.4 ±14.7146.7 ± 27.4
Height (m)1.7 ± 0.11.7 ± 0.11.7 ± 0.1
BMI (kg/m2)25.0 ± 2.836.2 ± 2.850.6 ± 7.8
Waist circumference (cm)89.7 ± 17.9116.6 ± 14.8142.5 ± 17.4
Hip circumference (cm)94.6 ± 12118.3 ± 12.9148.8 ± 17
WHR0.9 ± 0.11 ± 0.11 ± 0.1
Body fat (%)23.5 ± 5.338 ± 8.848.1 ± 8.4
FPG (mmol/L)5.7 ± 1.26.2 ± 2.66.6 ± 2.7
FPI (pmol/L)56.3 ± 74.8109.3 ± 143153 ± 136.5
HbA1c (%)5.6 ± 0.65.9 ± 0.96.2 ± 1.3
HbA1c (mmol/mol)29.4 ± 2.440.1 ± 11.843.3 ± 15.2
Total cholesterol (mmol/L)5.2 ± 15.1 ± 1.24.9 ± 1.1
HDL-C (mmol/L)1.4 ± 0.41.3 ± 0.41.2 ± 0.5
LDL-C (mmol/L)3.1 ± 0.93.3 ± 13.1 ± 0.9
Triglycerides (mmol/L)1.2 ± 0.61.7 ± 1.11.9 ± 1.4
AT COBLL1 mRNA expression n (%)19 (3)38 (7)467 (90)
AT GRB14 mRNA expression n (%)18 (3)44 (8)498 (89)
rs10195252 (T > C) carrier n (%)131 (10)146 (11)1106 (79)
rs6738627 (G > A) carrier n (%)133 (13)123 (12)870 (75)
Data are given as means ± SD. AT: adipose tissue; BMI: body max index; WHR: waist-to-hip ratio; FPG: fasting plasma glucose; FPI: fasting plasma insulin; HbA1c: glycated haemoglobin; HDL-C: high-density lipoprotein cholesterol; LDL-C: low density lipoprotein cholesterol; n: number.
Publisher’s Note: MDPI stays neutral with regard to jurisdictional claims in published maps and institutional affiliations.

