
CSatDTA: Prediction of Drug–Target Binding Affinity Using Convolution Model with Self-Attention


Abstract
:1. Introduction
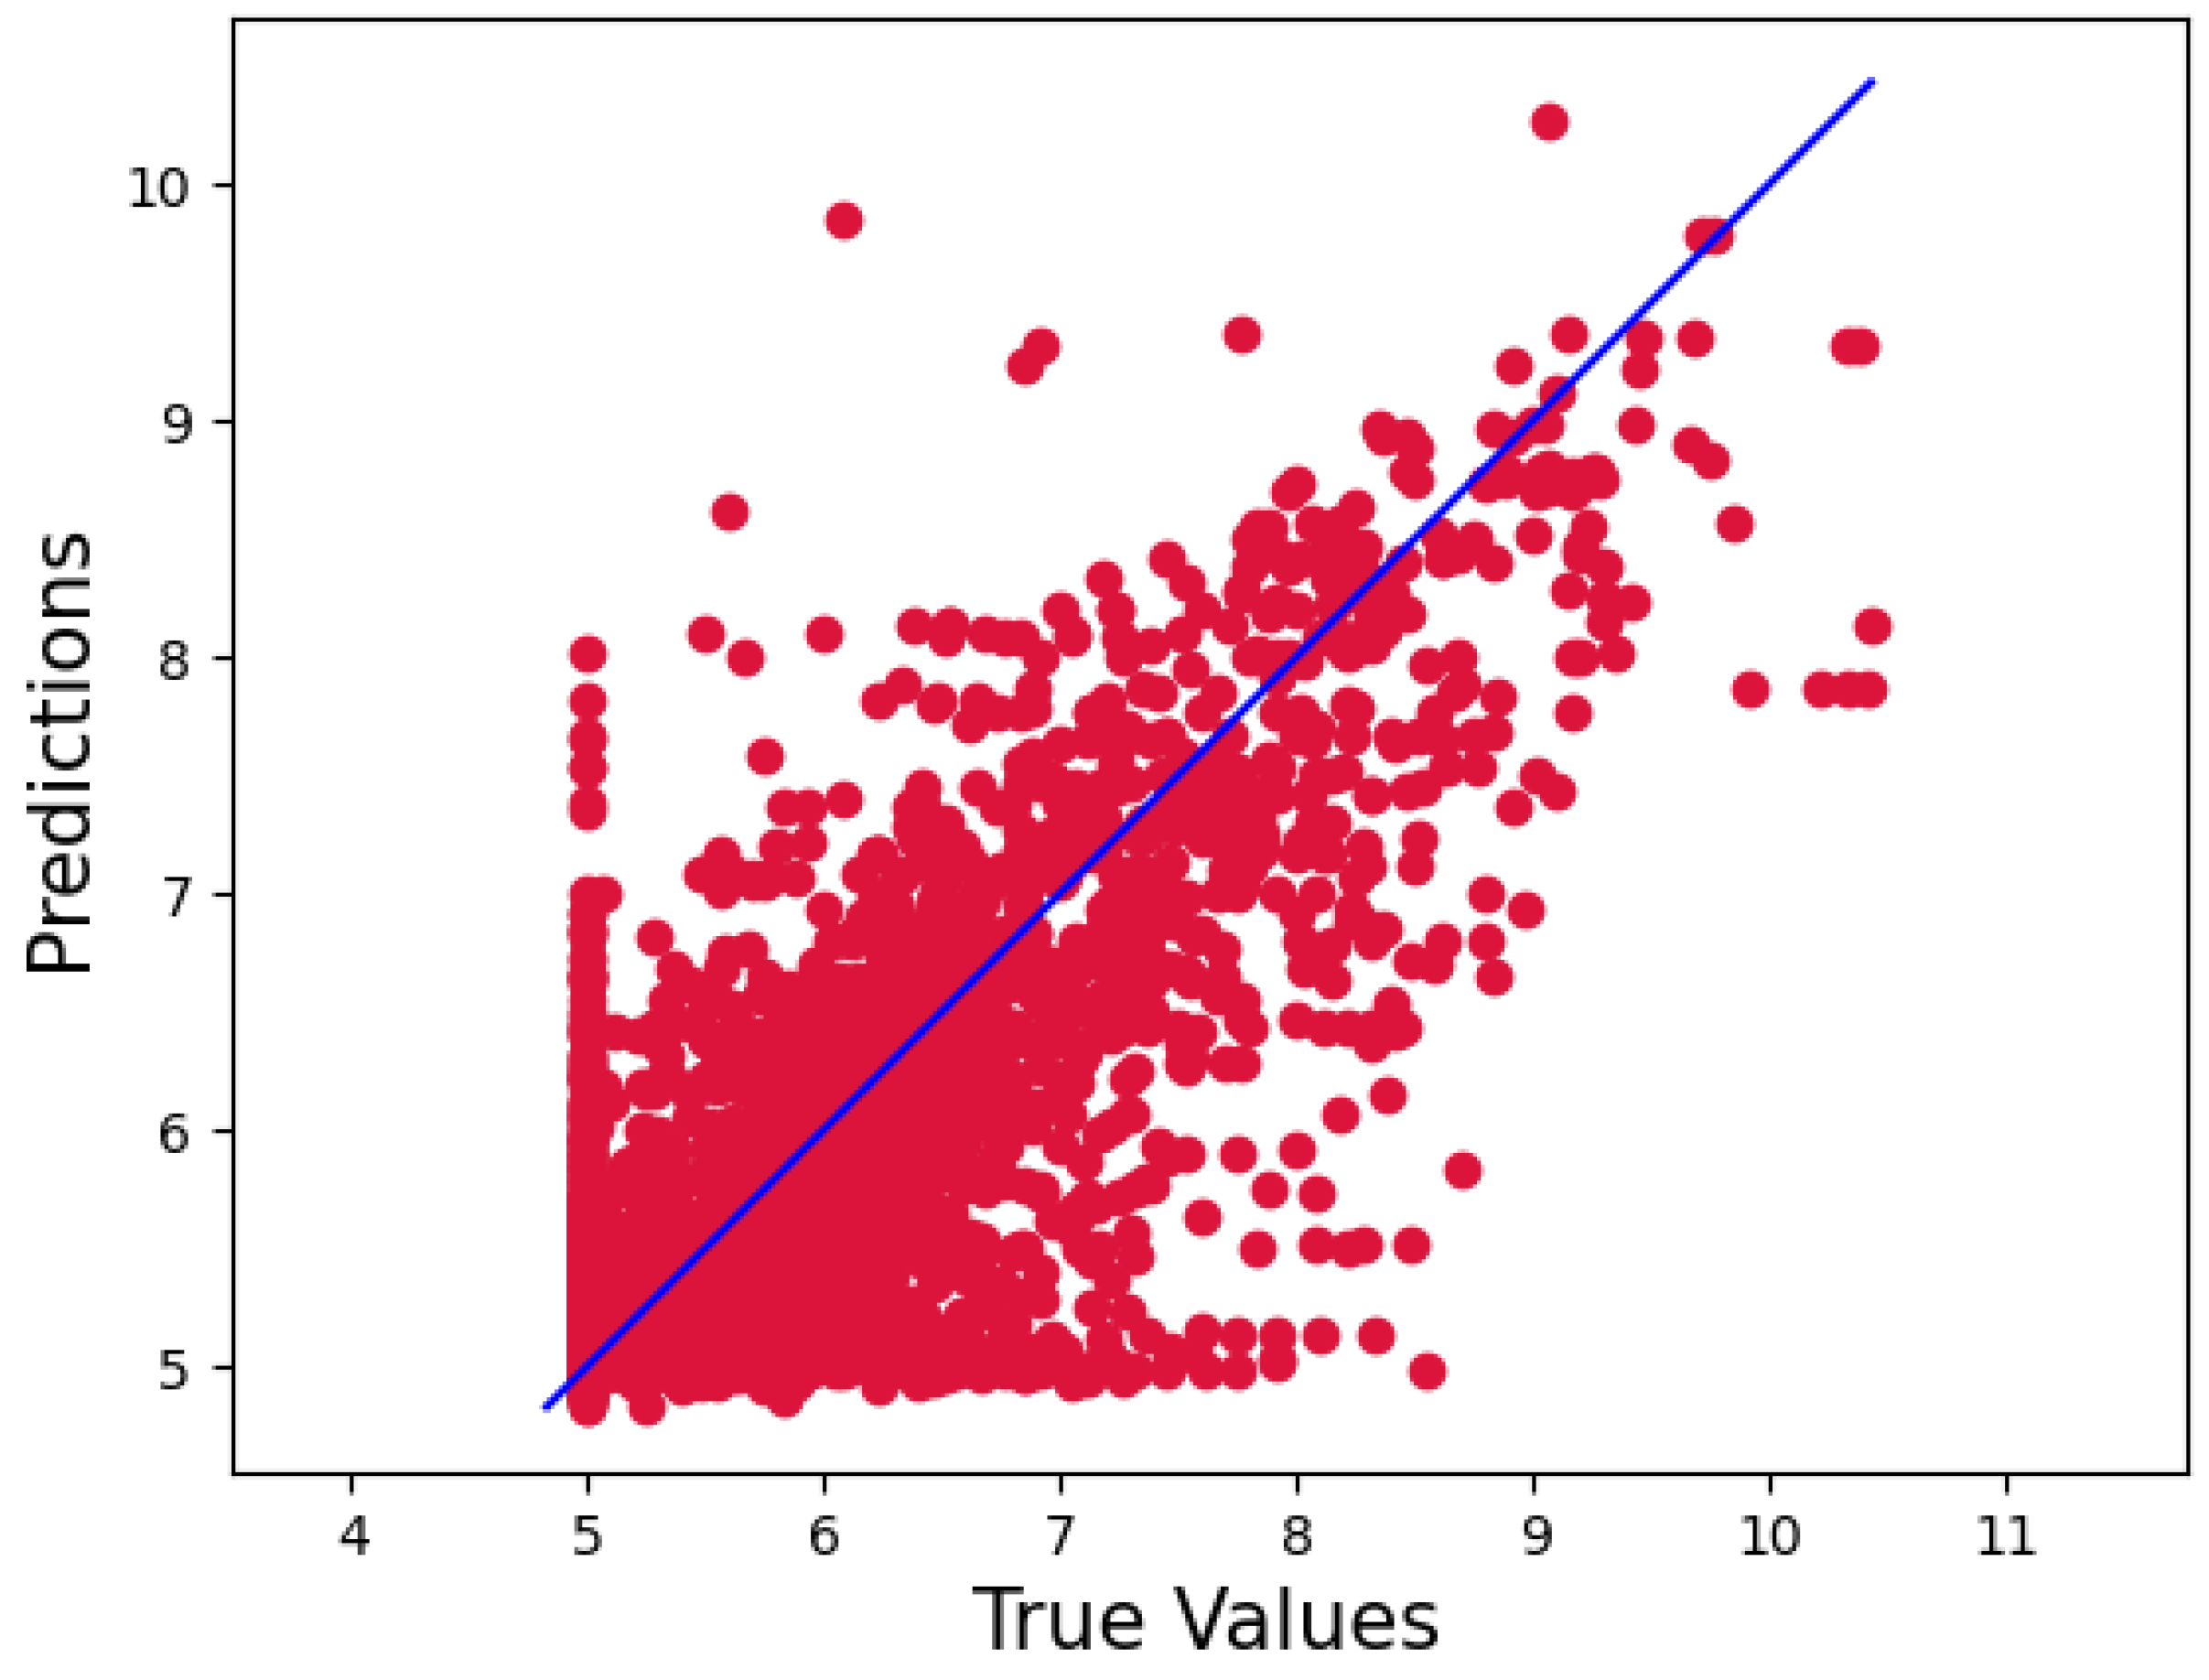
2. Result
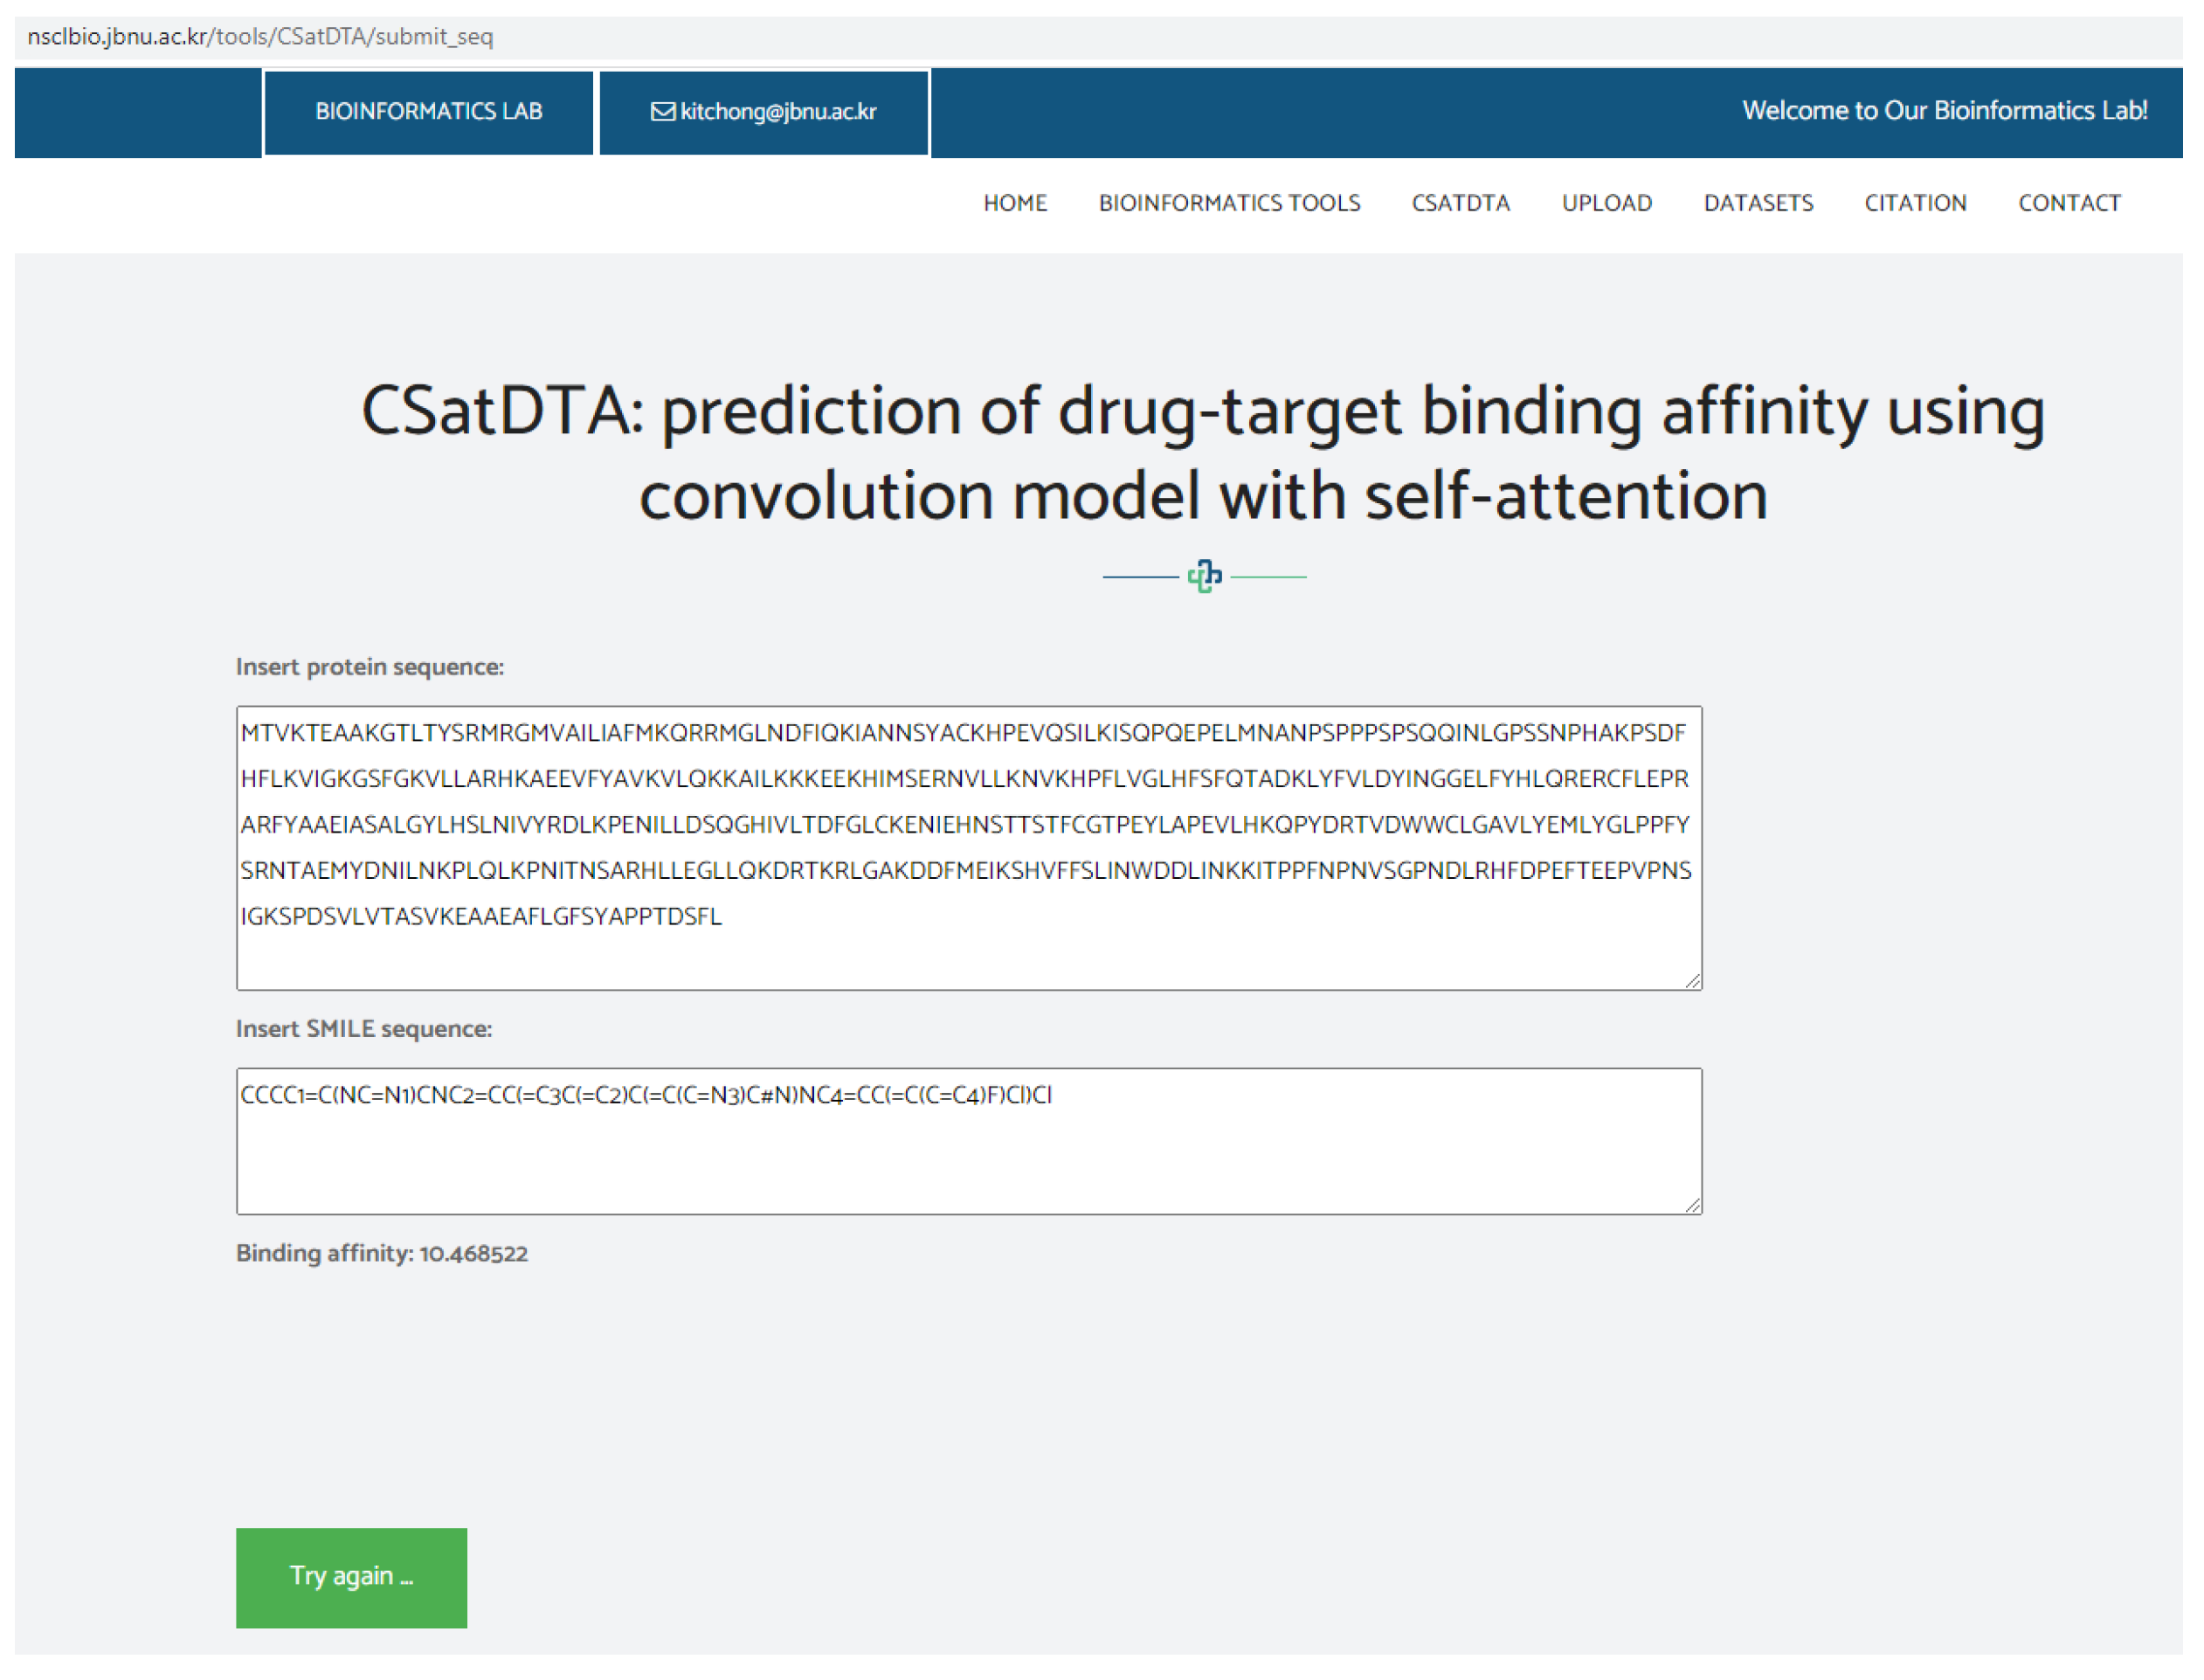
Prediction Web Server
3. Discussion
4. Materials and Methods
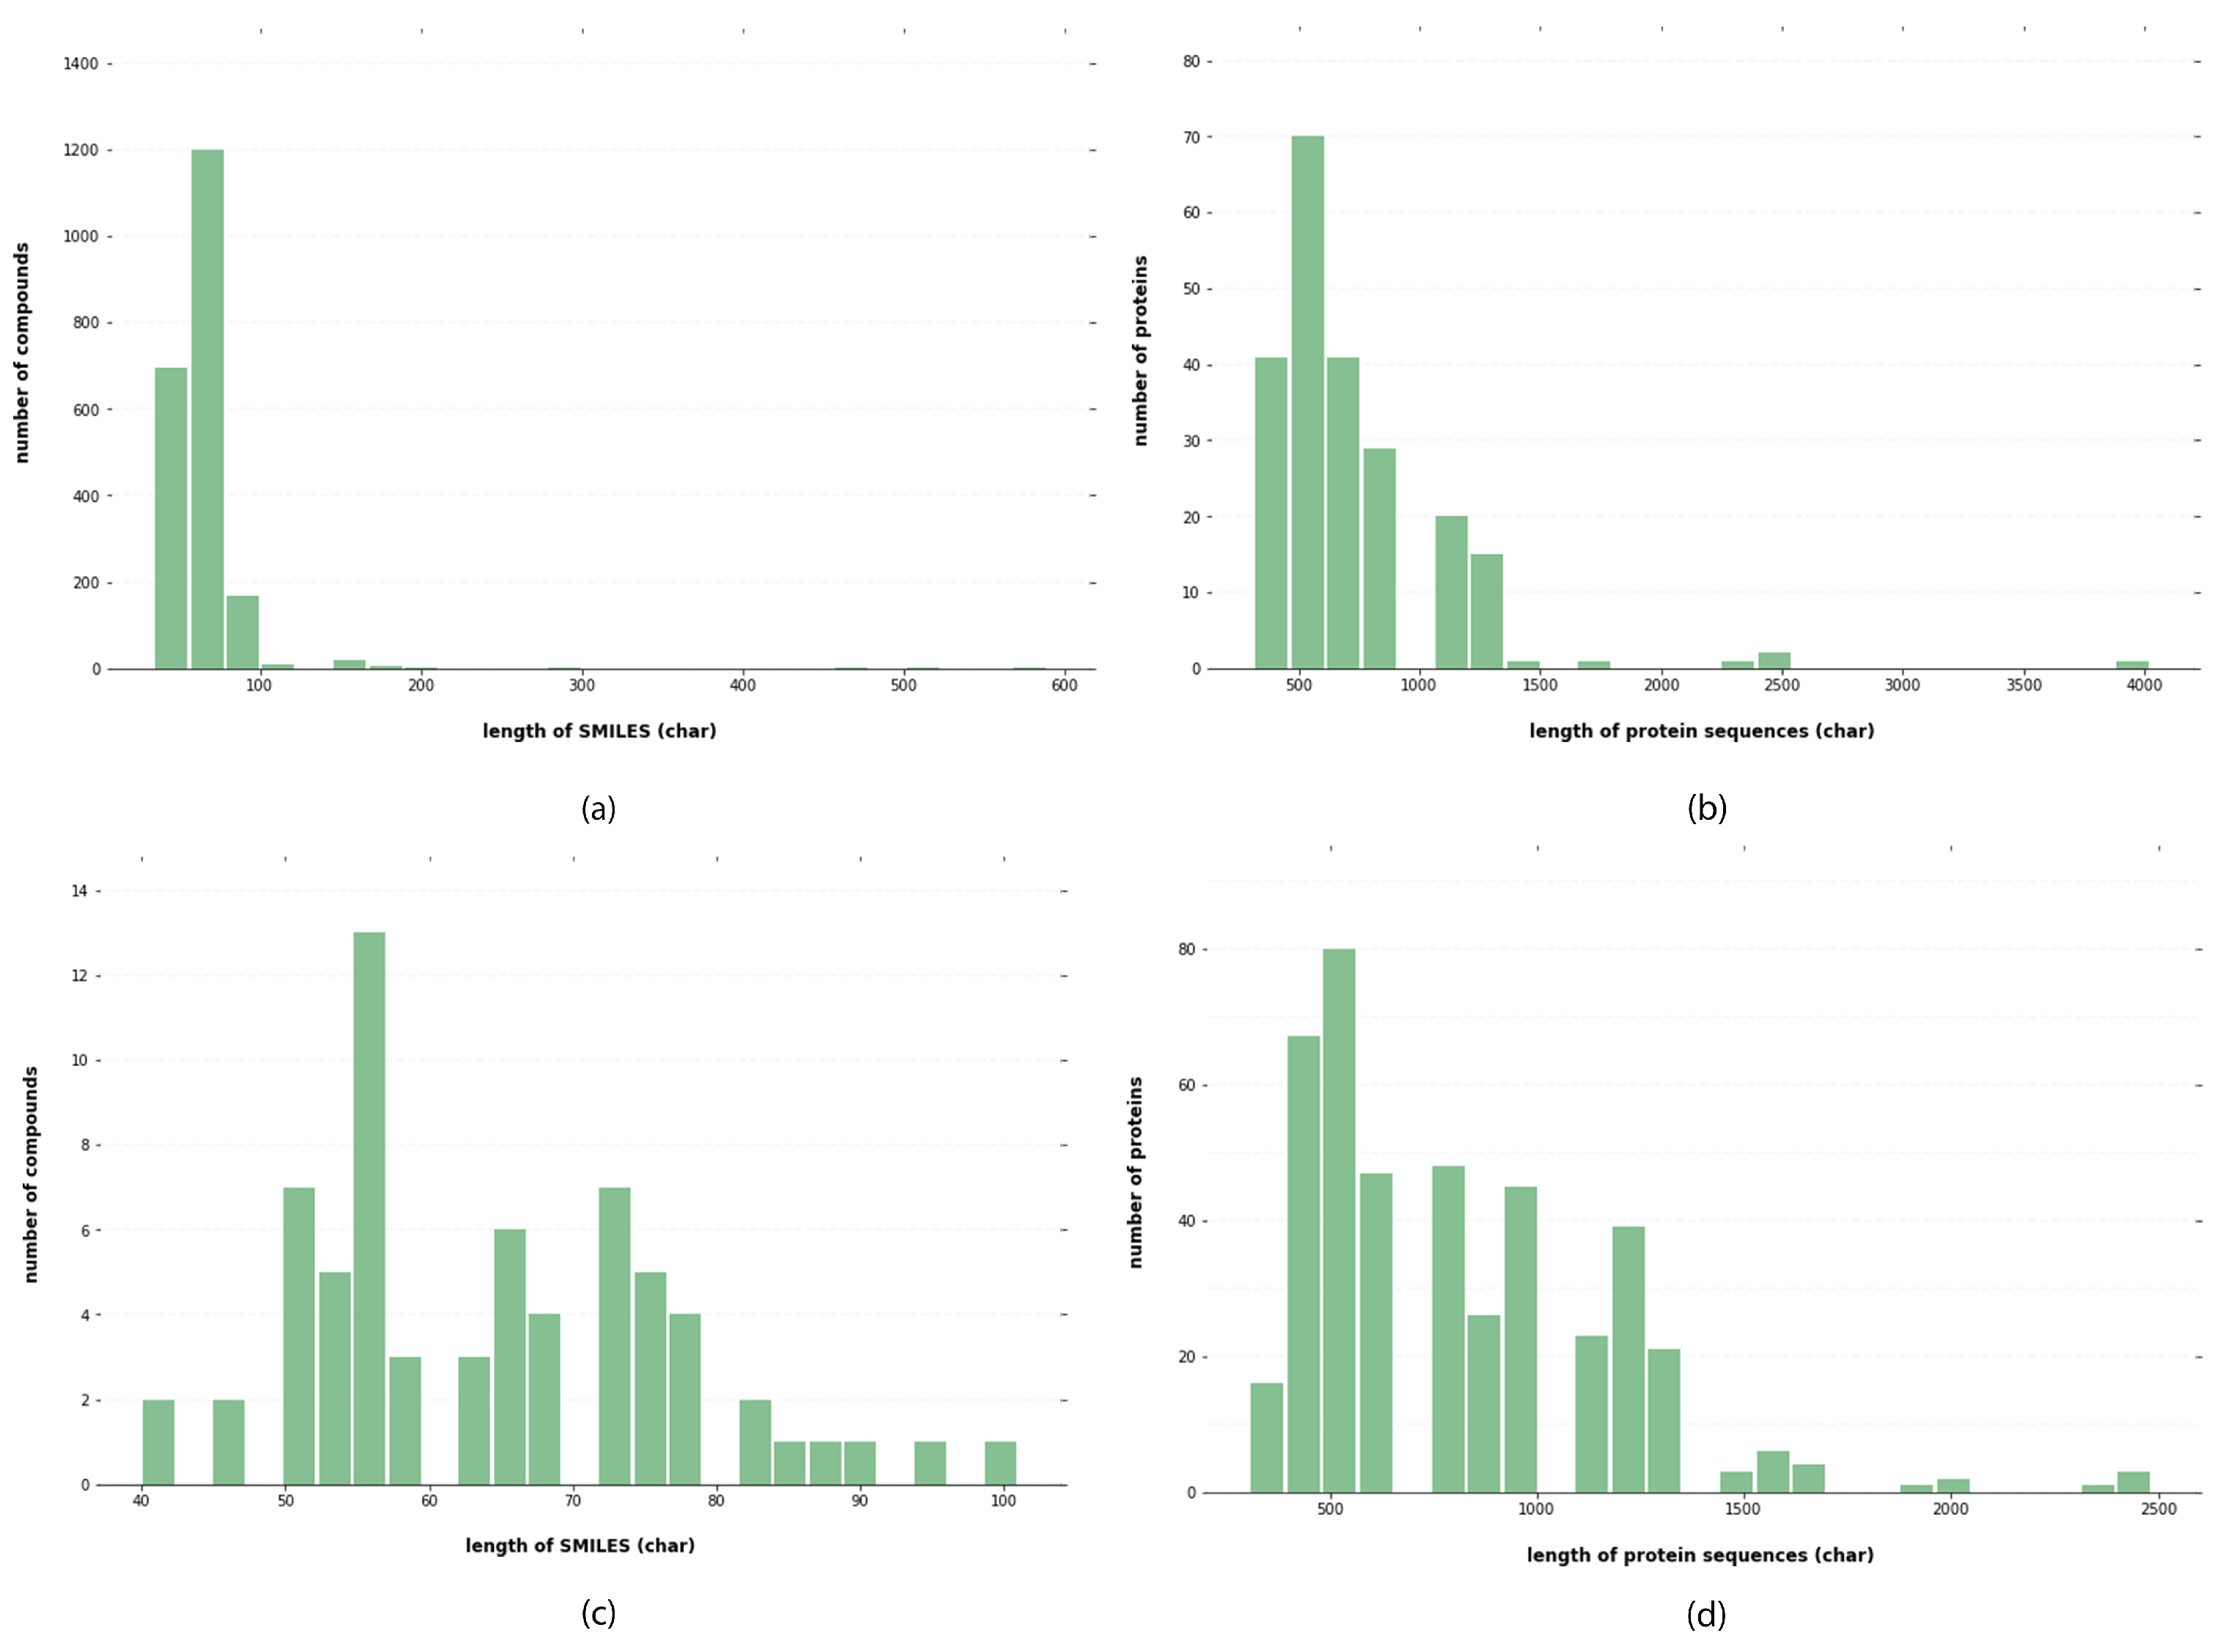
4.1. Materials
4.2. Drug and Target Representation
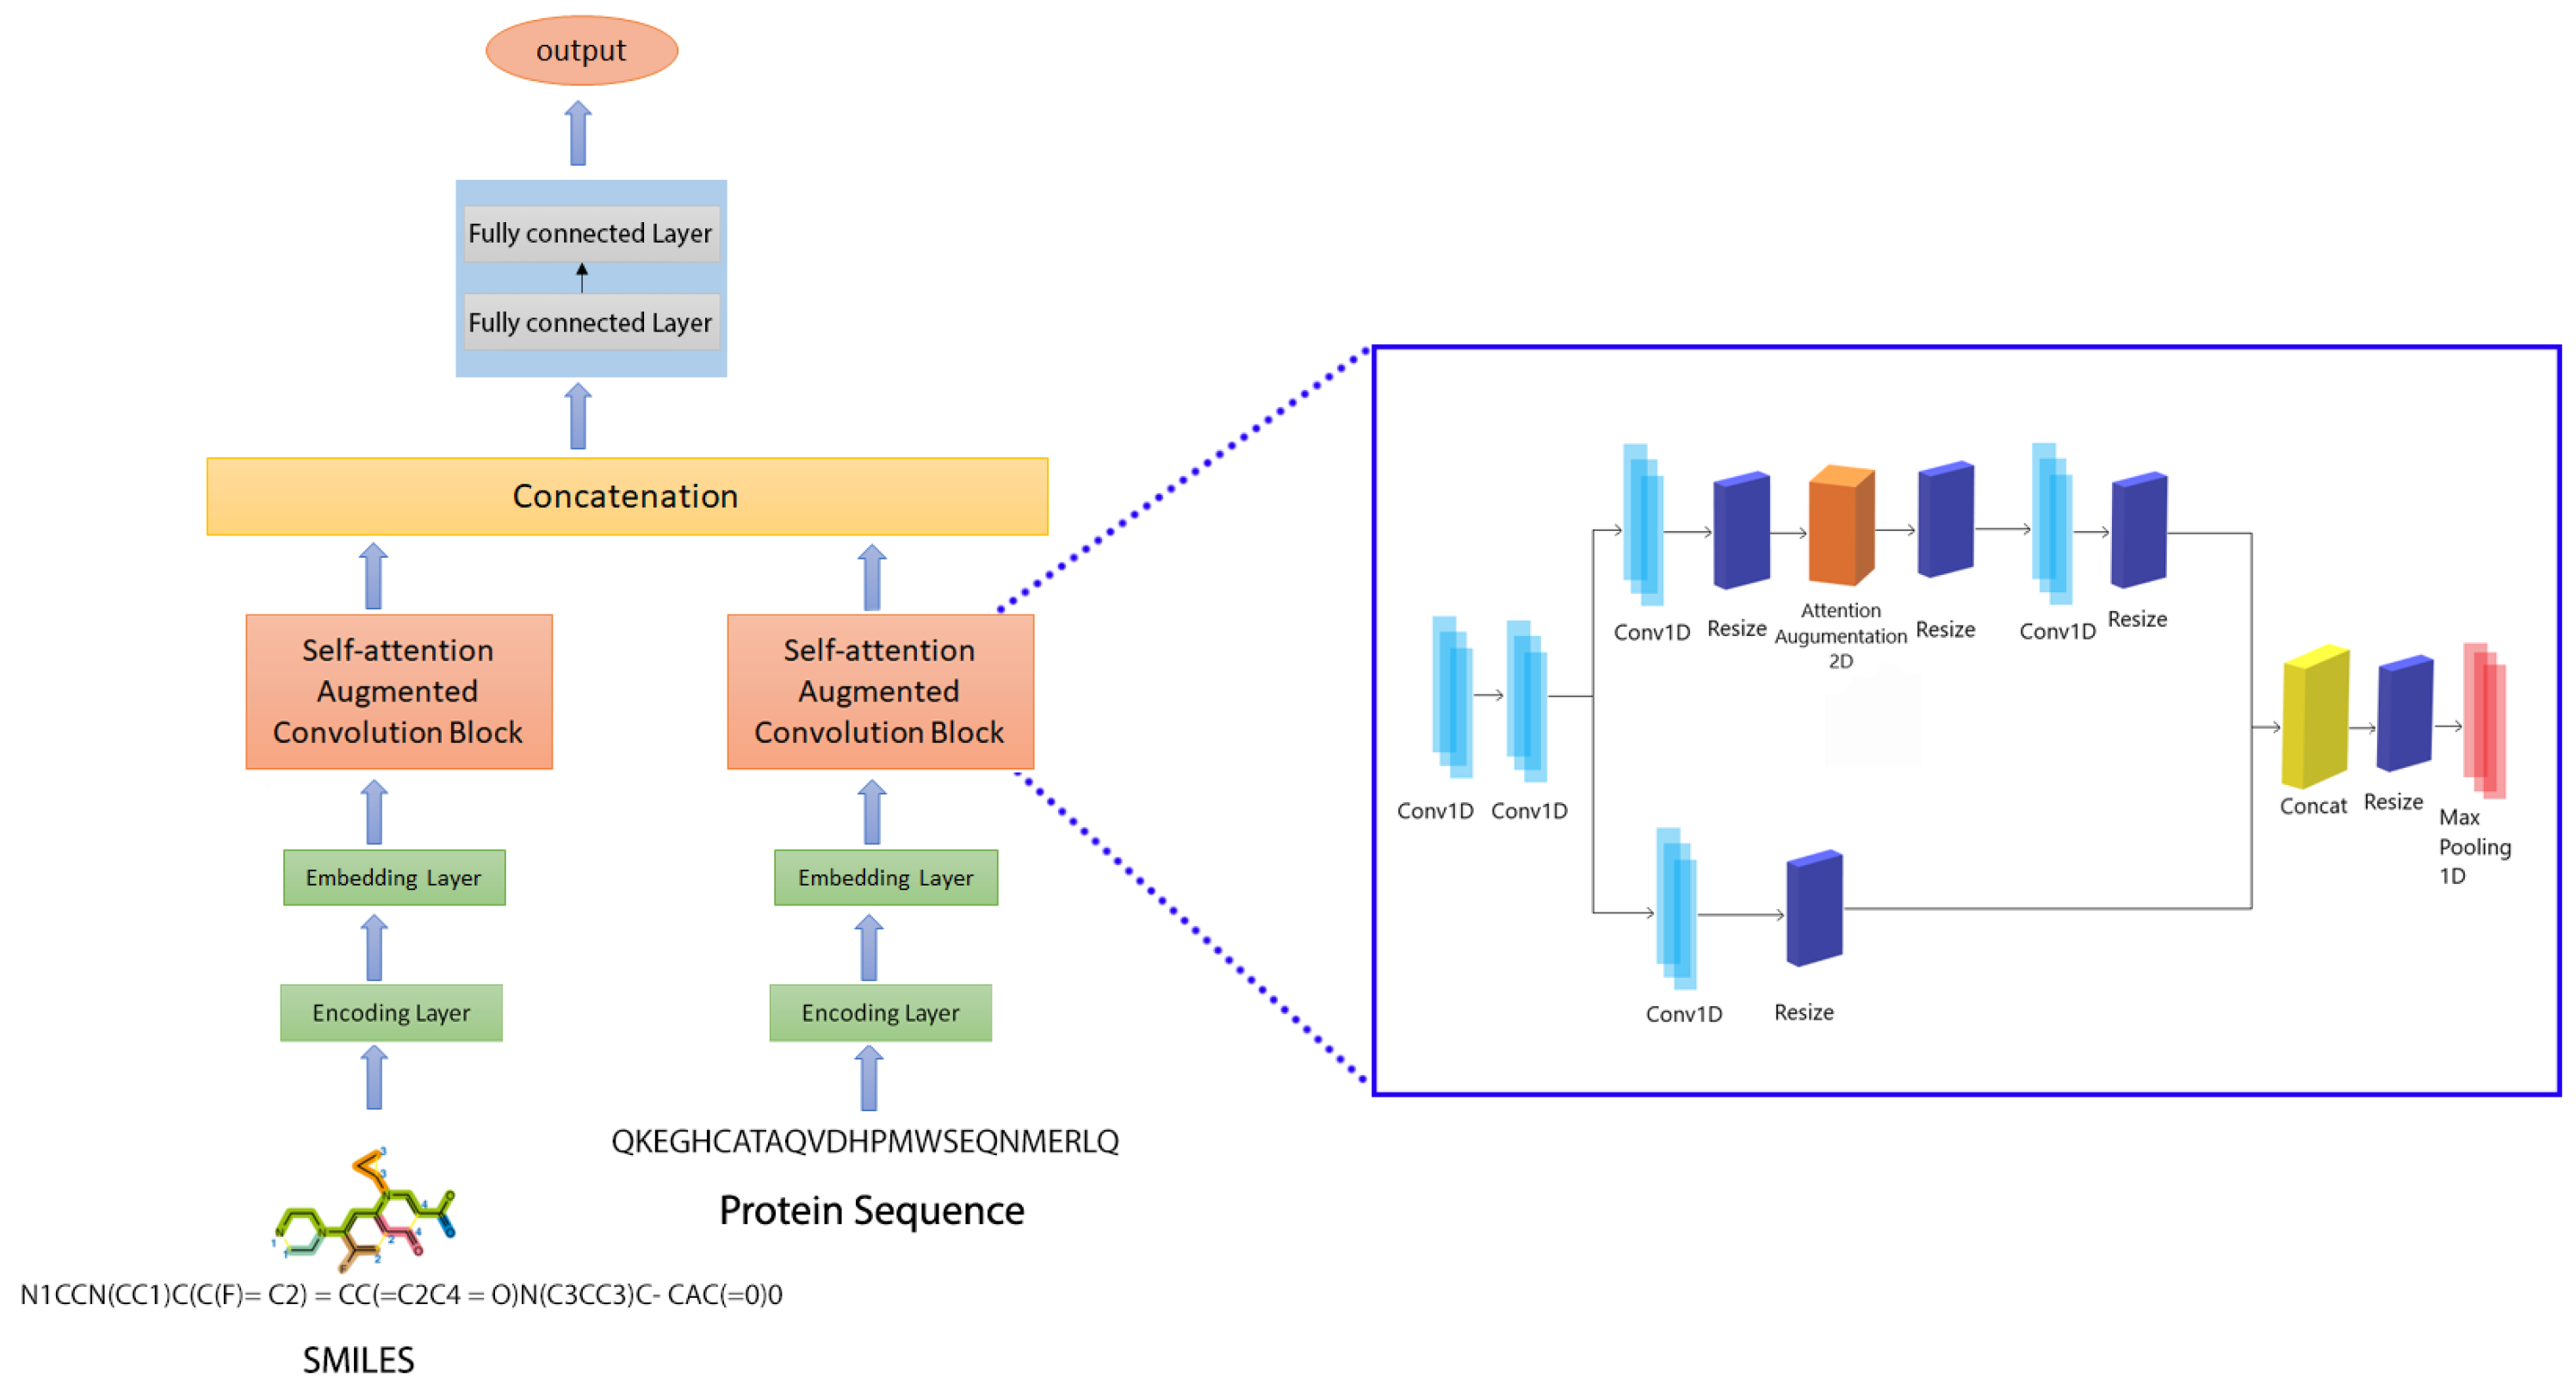
4.3. Proposed Prediction Model: CSatDTA
4.3.1. Attention Mechanism
4.3.2. Combining Attention and Convolutional Feature Mapping
4.3.3. Impact on the Number of Parameters
4.3.4. Attention Augmented Convolutional Architectures
4.4. Evaluation Metrics
4.4.1. Concordance Index
4.4.2. Mean-Squared Error
4.4.3. Root-Mean-Squared Error
Author Contributions
Funding
Institutional Review Board Statement
Informed Consent Statement
Data Availability Statement
Conflicts of Interest
Abbreviations
| CSatDTA | Prediction of drug–target affinity using convolution model with self-attention |
| DTA | Drug–target affinity |
| CNN | Convolutional neural network |
| PDB | Protein Data Bank |
| MSE | Mean-squared error |
| CI | Concordance index |
| FC | Fully connected |
| MHA | Multi-head attention |
| SMILES | Simplified Molecular Input Line Entry System |
References
- Gonzalez, M.W.; Kann, M.G. Chapter 4: Protein interactions and disease. PLoS Comput. Biol. 2012, 8, e1002819. [Google Scholar] [CrossRef] [PubMed] [Green Version]
- Weinshilboum, R. Inheritance and drug response. N. Engl. J. Med. 2003, 348, 529–537. [Google Scholar] [CrossRef] [PubMed] [Green Version]
- Mullard, A. New drugs cost US $ 2.6 billion to develop. Nat. Rev. Drug Discov. 2014, 13, 877. [Google Scholar] [CrossRef]
- Ashburn, T.T.; Thor, K.B. Drug repositioning: Identifying and developing new uses for existing drugs. Nat. Rev. Drug Discov. 2004, 3, 673–683. [Google Scholar] [CrossRef]
- Lowe, M.M.; Blaser, D.A.; Cone, L.; Arcona, S.; Ko, J.; Sasane, R.; Wicks, P. Increasing patient involvement in drug development. Value Health 2016, 19, 869–878. [Google Scholar] [CrossRef] [PubMed] [Green Version]
- Chapagain, A.; Ghimire, A.; Joshi, A.; Jaiswal, A. Predicting Breast Cancer using Support Vector Machine Learning Algorithm. Int. Res. J. Innov. Eng. Technol. 2020, 4, 10. [Google Scholar]
- Khanal, J.; Tayara, H.; Zou, Q.; Chong, K.T. Identifying dna n4-methylcytosine sites in the rosaceae genome with a deep learning model relying on distributed feature representation. Comput. Struct. Biotechnol. J. 2021, 19, 1612–1619. [Google Scholar] [CrossRef]
- Kandel, J.; Tayara, H.; Chong, K.T. PUResNet: Prediction of protein–ligand binding sites using deep residual neural network. J. Cheminformatics 2021, 13, 1–14. [Google Scholar] [CrossRef]
- Rehman, M.U.; Tayara, H.; Chong, K.T. DCNN-4mC: Densely connected neural network based N4-methylcytosine site prediction in multiple species. Comput. Struct. Biotechnol. J. 2021, 19, 6009–6019. [Google Scholar] [CrossRef]
- Rehman, M.U.; Akhtar, S.; Zakwan, M.; Mahmood, M.H. Novel architecture with selected feature vector for effective classification of mitotic and non-mitotic cells in breast cancer histology images. Biomed. Signal Process. Control 2022, 71, 103212. [Google Scholar] [CrossRef]
- Yamanishi, Y.; Araki, M.; Gutteridge, A.; Honda, W.; Kanehisa, M. Prediction of drug–target interaction networks from the integration of chemical and genomic spaces. Bioinformatics 2008, 24, i232–i240. [Google Scholar] [CrossRef] [PubMed]
- Haggarty, S.J.; Koeller, K.M.; Wong, J.C.; Butcher, R.A.; Schreiber, S.L. Multidimensional chemical genetic analysis of diversity-oriented synthesis-derived deacetylase inhibitors using cell-based assays. Chem. Biol. 2003, 10, 383–396. [Google Scholar] [CrossRef] [Green Version]
- Jiang, M.; Li, Z.; Zhang, S.; Wang, S.; Wang, X.; Yuan, Q.; Wei, Z. Drug–target affinity prediction using graph neural network and contact maps. RSC Adv. 2020, 10, 20701–20712. [Google Scholar] [CrossRef] [PubMed]
- Gromiha, M.M.; Yugandhar, K.; Jemimah, S. Protein–protein interactions: Scoring schemes and binding affinity. Curr. Opin. Struct. Biol. 2017, 44, 31–38. [Google Scholar] [CrossRef] [PubMed]
- Cer, R.Z.; Mudunuri, U.; Stephens, R.; Lebeda, F.J. IC 50-to-K i: A web-based tool for converting IC 50 to K i values for inhibitors of enzyme activity and ligand binding. Nucleic Acids Res. 2009, 37, W441–W445. [Google Scholar] [CrossRef] [Green Version]
- Hu, P.W.; Chan, K.C.; You, Z.H. Large-scale prediction of drug–target interactions from deep representations. In Proceedings of the 2016 International Joint Conference on Neural Networks (IJCNN), Vancouver, BC, Canada, 24–29 July 2016; pp. 1236–1243. [Google Scholar]
- Tian, K.; Shao, M.; Wang, Y.; Guan, J.; Zhou, S. Boosting compound-protein interaction prediction by deep learning. Methods 2016, 110, 64–72. [Google Scholar] [CrossRef]
- Hamanaka, M.; Taneishi, K.; Iwata, H.; Ye, J.; Pei, J.; Hou, J.; Okuno, Y. CGBVS-DNN: Prediction of Compound-protein Interactions Based on Deep Learning. Mol. Inform. 2017, 36, 1600045. [Google Scholar] [CrossRef]
- Pahikkala, T.; Airola, A.; Pietilä, S.; Shakyawar, S.; Szwajda, A.; Tang, J.; Aittokallio, T. Toward more realistic drug–target interaction predictions. Briefings Bioinform. 2015, 16, 325–337. [Google Scholar] [CrossRef]
- Rose, P.W.; Prlić, A.; Altunkaya, A.; Bi, C.; Bradley, A.R.; Christie, C.H.; Costanzo, L.D.; Duarte, J.M.; Dutta, S.; Feng, Z.; et al. The RCSB protein data bank: Integrative view of protein, gene and 3D structural information. Nucleic Acids Res. 2016, 45, D271–D281. [Google Scholar]
- Öztürk, H.; Özgür, A.; Ozkirimli, E. DeepDTA: Deep drug–target binding affinity prediction. Bioinformatics 2018, 34, i821–i829. [Google Scholar] [CrossRef] [PubMed] [Green Version]
- Ghimire, A.; Chapagain, A.; Bhattarai, U.; Jaiswal, A. Nepali Handwriting Recognition using Convolution Neural Network. Int. Res. J. Innov. Eng. Technol. 2020, 4, 5. [Google Scholar] [CrossRef]
- Khanal, J.; Nazari, I.; Tayara, H.; Chong, K.T. 4mCCNN: Identification of N4-methylcytosine sites in prokaryotes using convolutional neural network. IEEE Access 2019, 7, 145455–145461. [Google Scholar] [CrossRef]
- Abbas, Z.; Tayara, H.; Chong, K. Spinenet-6ma: A novel deep learning tool for predicting dna n6-methyladenine sites in genomes. IEEE Access 2020, 8, 201450–201457. [Google Scholar] [CrossRef]
- Alam, W.; Ali, S.D.; Tayara, H.; Chong, K. A CNN-based RNA N6-methyladenosine site predictor for multiple species using heterogeneous features representation. IEEE Access 2020, 8, 138203–138209. [Google Scholar] [CrossRef]
- Davis, M.I.; Hunt, J.P.; Herrgard, S.; Ciceri, P.; Wodicka, L.M.; Pallares, G.; Hocker, M.; Treiber, D.K.; Zarrinkar, P.P. Comprehensive analysis of kinase inhibitor selectivity. Nat. Biotechnol. 2011, 29, 1046–1051. [Google Scholar] [CrossRef]
- Tang, J.; Szwajda, A.; Shakyawar, S.; Xu, T.; Hintsanen, P.; Wennerberg, K.; Aittokallio, T. Making sense of large-scale kinase inhibitor bioactivity data sets: A comparative and integrative analysis. J. Chem. Inf. Modeling 2014, 54, 735–743. [Google Scholar] [CrossRef]
- Nascimento, A.C.; Prudêncio, R.B.; Costa, I.G. A multiple kernel learning algorithm for drug–target interaction prediction. BMC Bioinform. 2016, 17, 1–16. [Google Scholar] [CrossRef] [Green Version]
- He, T.; Heidemeyer, M.; Ban, F.; Cherkasov, A.; Ester, M. SimBoost: A read-across approach for predicting drug–target binding affinities using gradient boosting machines. J. Cheminformatics 2017, 9, 1–14. [Google Scholar] [CrossRef]
- Öztürk, H.; Ozkirimli, E.; Özgür, A. WideDTA: Prediction of drug–target binding affinity. arXiv 2019, arXiv:1902.04166. [Google Scholar]
- Nguyen, T.; Le, H.; Quinn, T.P.; Nguyen, T.; Le, T.D.; Venkatesh, S. GraphDTA: Predicting drug–target binding affinity with graph neural networks. Bioinformatics 2021, 37, 1140–1147. [Google Scholar] [CrossRef]
- Weininger, D. SMILES, a chemical language and information system. 1. Introduction to methodology and encoding rules. J. Chem. Inf. Comput. Sci. 1988, 28, 31–36. [Google Scholar] [CrossRef]
- Bello, I.; Zoph, B.; Vaswani, A.; Shlens, J.; Le, Q.V. Attention augmented convolutional networks. In Proceedings of the IEEE/CVF International Conference on Computer Vision, Seoul, Korea, 27 October–2 November 2019; pp. 3286–3295. [Google Scholar]
- Srivastava, N.; Hinton, G.; Krizhevsky, A.; Sutskever, I.; Salakhutdinov, R. Dropout: A simple way to prevent neural networks from overfitting. J. Mach. Learn. Res. 2014, 15, 1929–1958. [Google Scholar]
- Vaswani, A.; Shazeer, N.; Parmar, N.; Uszkoreit, J.; Jones, L.; Gomez, A.N.; Kaiser, Ł.; Polosukhin, I. Attention is all you need. Adv. Neural Inf. Process. Syst. 2017, 30, 5998–6008. [Google Scholar]
- Ioffe, S.; Szegedy, C. Batch normalization: Accelerating deep network training by reducing internal covariate shift. In Proceedings of the International Conference on Machine Learning, Lille, France, 6–11 July 2015; PMLR: London, UK, 2015; pp. 448–456. [Google Scholar]
- Hu, J.; Shen, L.; Albanie, S.; Sun, G.; Vedaldi, A. Gather-excite: Exploiting feature context in convolutional neural networks. Adv. Neural Inf. Process. Syst. 2018, 31, 9401–9411. [Google Scholar]
- Hu, J.; Shen, L.; Sun, G. Squeeze-and-excitation networks. In Proceedings of the IEEE Conference on Computer Vision and Pattern Recognition, Salt Lake City, UT, USA, 18–22 June 2018; pp. 7132–7141. [Google Scholar]


| Hyperparameters | |
|---|---|
| Learning rate (initially) | 0.001 |
| Batch size | 64 |
| Optimizer | Adadelta |
| Kernel initializer | Glorot Normal |
| CNN layers | 2 |
| Attention layers | 2 |
| Number of attention heads for SMILES | 4 |
| Number of attention heads for proteins | 10 |
| Filters for keys and values for SMILES | 2 |
| Filters for keys and values for proteins | 5 |
| Method | Compound Rep. | Protein Rep. | MSE | RMSE | CI |
|---|---|---|---|---|---|
| KronRLS | Pubchem-Sim | Smith–Waterman | 0.411 | 0.641 | 0.782 |
| SimBoost | Pubchem-Sim | Smith–Waterman | 0.222 | 0.471 | 0.836 |
| DeepDTA | 1D | 1D | 0.179 | 0.423 | 0.863 |
| WideDTA | 1D + LMCS | 1D + PDM | 0.194 | 0.440 | 0.875 |
| GAT_GCN | Graph | 1D | 0.140 | 0.374 | 0.891 |
| CsatDTA (Proposed) | 1D | 1D | 0.134 | 0.366 | 0.898 |
| Method | Compound Rep. | Protein Rep. | MSE | RMSE | CI |
|---|---|---|---|---|---|
| KronRLS | Pubchem-Sim | Smith–Waterman | 0.379 | 0.615 | 0.871 |
| SimBoost | Pubchem-Sim | Smith–Waterman | 0.282 | 0.531 | 0.872 |
| DeepDTA | 1D | 1D | 0.261 | 0.510 | 0.878 |
| WideDTA | 1D + LMCS | 1D + PDM | 0.262 | 0.511 | 0.886 |
| GAT_GCN | Graph | 1D | 0.245 | 0.494 | 0.881 |
| CsatDTA (Proposed) | 1D | 1D | 0.241 | 0.490 | 0.892 |
| Proteins | Compounds | Interactions | |
|---|---|---|---|
| KIBA | 229 | 2111 | 118,254 |
| Davis | 442 | 68 | 30,056 |
Publisher’s Note: MDPI stays neutral with regard to jurisdictional claims in published maps and institutional affiliations. |
© 2022 by the authors. Licensee MDPI, Basel, Switzerland. This article is an open access article distributed under the terms and conditions of the Creative Commons Attribution (CC BY) license (https://creativecommons.org/licenses/by/4.0/).
Share and Cite
Ghimire, A.; Tayara, H.; Xuan, Z.; Chong, K.T. CSatDTA: Prediction of Drug–Target Binding Affinity Using Convolution Model with Self-Attention. Int. J. Mol. Sci. 2022, 23, 8453. https://doi.org/10.3390/ijms23158453
Ghimire A, Tayara H, Xuan Z, Chong KT. CSatDTA: Prediction of Drug–Target Binding Affinity Using Convolution Model with Self-Attention. International Journal of Molecular Sciences. 2022; 23(15):8453. https://doi.org/10.3390/ijms23158453
Chicago/Turabian StyleGhimire, Ashutosh, Hilal Tayara, Zhenyu Xuan, and Kil To Chong. 2022. "CSatDTA: Prediction of Drug–Target Binding Affinity Using Convolution Model with Self-Attention" International Journal of Molecular Sciences 23, no. 15: 8453. https://doi.org/10.3390/ijms23158453
APA StyleGhimire, A., Tayara, H., Xuan, Z., & Chong, K. T. (2022). CSatDTA: Prediction of Drug–Target Binding Affinity Using Convolution Model with Self-Attention. International Journal of Molecular Sciences, 23(15), 8453. https://doi.org/10.3390/ijms23158453