Article

Microvesicles and Microvesicle-Associated microRNAs Reflect Glioblastoma Regression: Microvesicle-Associated miR-625-5p Has Biomarker Potential

by
Natalia Simionescu
1,2,†,
Miruna Nemecz
3,†,
Anca-Roxana Petrovici
1,
Ioan Sebastian Nechifor
2,
Razvan-Cristian Buga
2,
Marius Gabriel Dabija
2,
Lucian Eva
2 and
Adriana Georgescu
3,*
1
Centre of Advanced Research in Bionanoconjugates and Biopolymers, “Petru Poni” Institute of Macromolecular Chemistry, 41A Grigore Ghica Voda Alley, 700487 Iasi, Romania
2
“Prof. Dr. Nicolae Oblu” Emergency Clinical Hospital, 2 Ateneului Street, 700309 Iasi, Romania
3
Department of Pathophysiology and Pharmacology, Institute of Cellular Biology and Pathology “Nicolae Simionescu” of the Romanian Academy, 8 B.P. Hasdeu Street, 050568 Bucharest, Romania
*
Author to whom correspondence should be addressed.
These authors contributed equally to this work.
Int. J. Mol. Sci. 2022, 23(15), 8398; https://doi.org/10.3390/ijms23158398
Submission received: 13 July 2022 / Revised: 26 July 2022 / Accepted: 27 July 2022 / Published: 29 July 2022
(This article belongs to the Special Issue Molecular Biology of RNA: Recent Progress)

Abstract

:
Glioblastoma (GB) is the most aggressive and recurrent form of brain cancer in adults. We hypothesized that the identification of biomarkers such as certain microRNAs (miRNAs) and the circulating microvesicles (MVs) that transport them could be key to establishing GB progression, recurrence and therapeutic response. For this purpose, circulating MVs were isolated from the plasma of GB patients (before and after surgery) and of healthy subjects and characterized by flow cytometry. OpenArray profiling and the individual quantification of selected miRNAs in plasma and MVs was performed, followed by target genes’ prediction and in silico survival analysis. It was found that MVs’ parameters (number, EGFRvIII and EpCAM) decreased after the surgical resection of GB tumors, but the inter-patient variability was high. The expression of miR-106b-5p, miR-486-3p, miR-766-3p and miR-30d-5p in GB patients’ MVs was restored to control-like levels after surgery: miR-106b-5p, miR-486-3p and miR-766-3p were upregulated, while miR-30d-5p levels were downregulated after surgical resection. MiR-625-5p was only identified in MVs isolated from GB patients before surgery and was not detected in plasma. Target prediction and pathway analysis showed that the selected miRNAs regulate genes involved in cancer pathways, including glioma. In conclusion, miR-625-5p shows potential as a biomarker for GB regression or recurrence, but further in-depth studies are needed.

1. Introduction

The clinical hallmarks of glioblastoma (GB), the most aggressive form of adult brain cancer, are high tumor heterogeneity, extensive vascularization, fast growth and invasiveness, poor survival and minimal response to therapy [1,2]. The latest World Health Organization (WHO) classification of tumors of the central nervous system (CNS) [3] relies on clinical presentation and histological data, as well as molecular markers for the diagnosis of GB. Therefore, GB (GB, isocitrate dehydrogenase (IDH)-wildtype) is now classified as an adult-type diffuse and astrocytic glioma, characterized by “microvascular proliferation or necrosis or telomerase reverse transcriptase (TERT) promoter mutation or epidermal growth factor receptor (EGFR) gene amplification or +7/−10 chromosome copy number changes” [3].
Traditionally, GB prognosis projections were conducted based on clinical presentation, histological features and percent of surgical resection, but recently, molecular biomarkers have been used for tumor grading and prognosis estimation [3]. Moreover, the late diagnosis of recurrence is one of the major drawbacks of GB, despite therapeutic advances and improved imaging techniques, and long-term disease management is difficult and expensive. Therefore, cost-effective, easy-to-measure and minimally invasive biomarkers for GB therapeutic response monitoring and recurrence are needed in order to better manage the disease progression.
Some of the most promising biomarkers are microRNAs (miRNAs), small non-coding RNAs which regulate gene expression post-transcriptionally through the inhibition of translation and/or the degradation of messenger RNA (mRNA) [4]. MiRNA levels are modified during disease progression [5,6] and they have been found in several body fluids, including blood, circulating in extracellular vesicles (EVs) or associated with lipoproteins or protein complexes [7]. Furthermore, miRNAs’ circulating profiles often reflect their modified expression in the tissue of origin or indicate increased intercellular communication [7,8]. MiRNAs’ quantification in biological fluids is relatively easy and cost-effective, supporting their use as biomarkers for prognosis and therapeutic response monitoring. However, to date, serum miRNA biomarkers are not applied in clinical settings for GB.
Another promising biomarker category is represented by EVs, a heterogenous group of cell-derived lipid vesicles which exhibit specific markers of their cells of origin and transport tissue-specific cargo, including miRNAs [9,10,11,12,13,14]. EVs are intercellular communication mediators in physiological and pathological conditions [11,15], capable of crossing the blood–brain barrier [16,17]. EVs have been isolated from biological fluids [18,19,20,21,22,23], providing insights into molecular and pathological processes, as well as accessible samples for biomarker discovery. EVs exhibited diagnostic potential in different pathologies [24,25], as well as biomarker potential in the context of treatment response and disease recurrence [26,27,28,29,30,31]. Additionally, EVs contain distinctive miRNA signatures [14], which change under pathological conditions [24,32,33] and could be applied in clinical settings as biomarkers for prognosis and therapeutic response monitoring. A particular type of EV is represented by microvesicles (MVs), which are phosphatidylserine (PS)-positive EVs (100–1000 nm) with variable shapes generated by blebbing of the plasma membrane of activated cells [11,33]. MVs transport miRNAs, exhibit markers from their cells of origin, such as EGFR, its mutant variant (EGFRvIII) or epithelial cell adhesion molecule (EpCAM) [12,34], and have been shown to have diagnostic and therapeutic potential in various pathologies, including GB [24,33,35].
Despite ongoing efforts to improve the survival of GB patients, minimal advances have been made in the early detection of GB recurrence. In this study, we tried to find out whether circulating MVs and some plasma or MV-associated miRNAs could have the potential to be biomarkers for GB patients. For this purpose, we analyzed and characterized plasma MVs by flow cytometry, and we employed OpenArray screening for MV-associated miRNAs in order to identify specifically modulated miRNAs. Next, we selected several miRNAs and determined their expression in MVs and plasma, followed by target genes’ prediction and in silico survival analysis. Our final goal was to identify MV-associated miRNAs with biomarker potential for GB regression or recurrence.

2. Results and Discussion

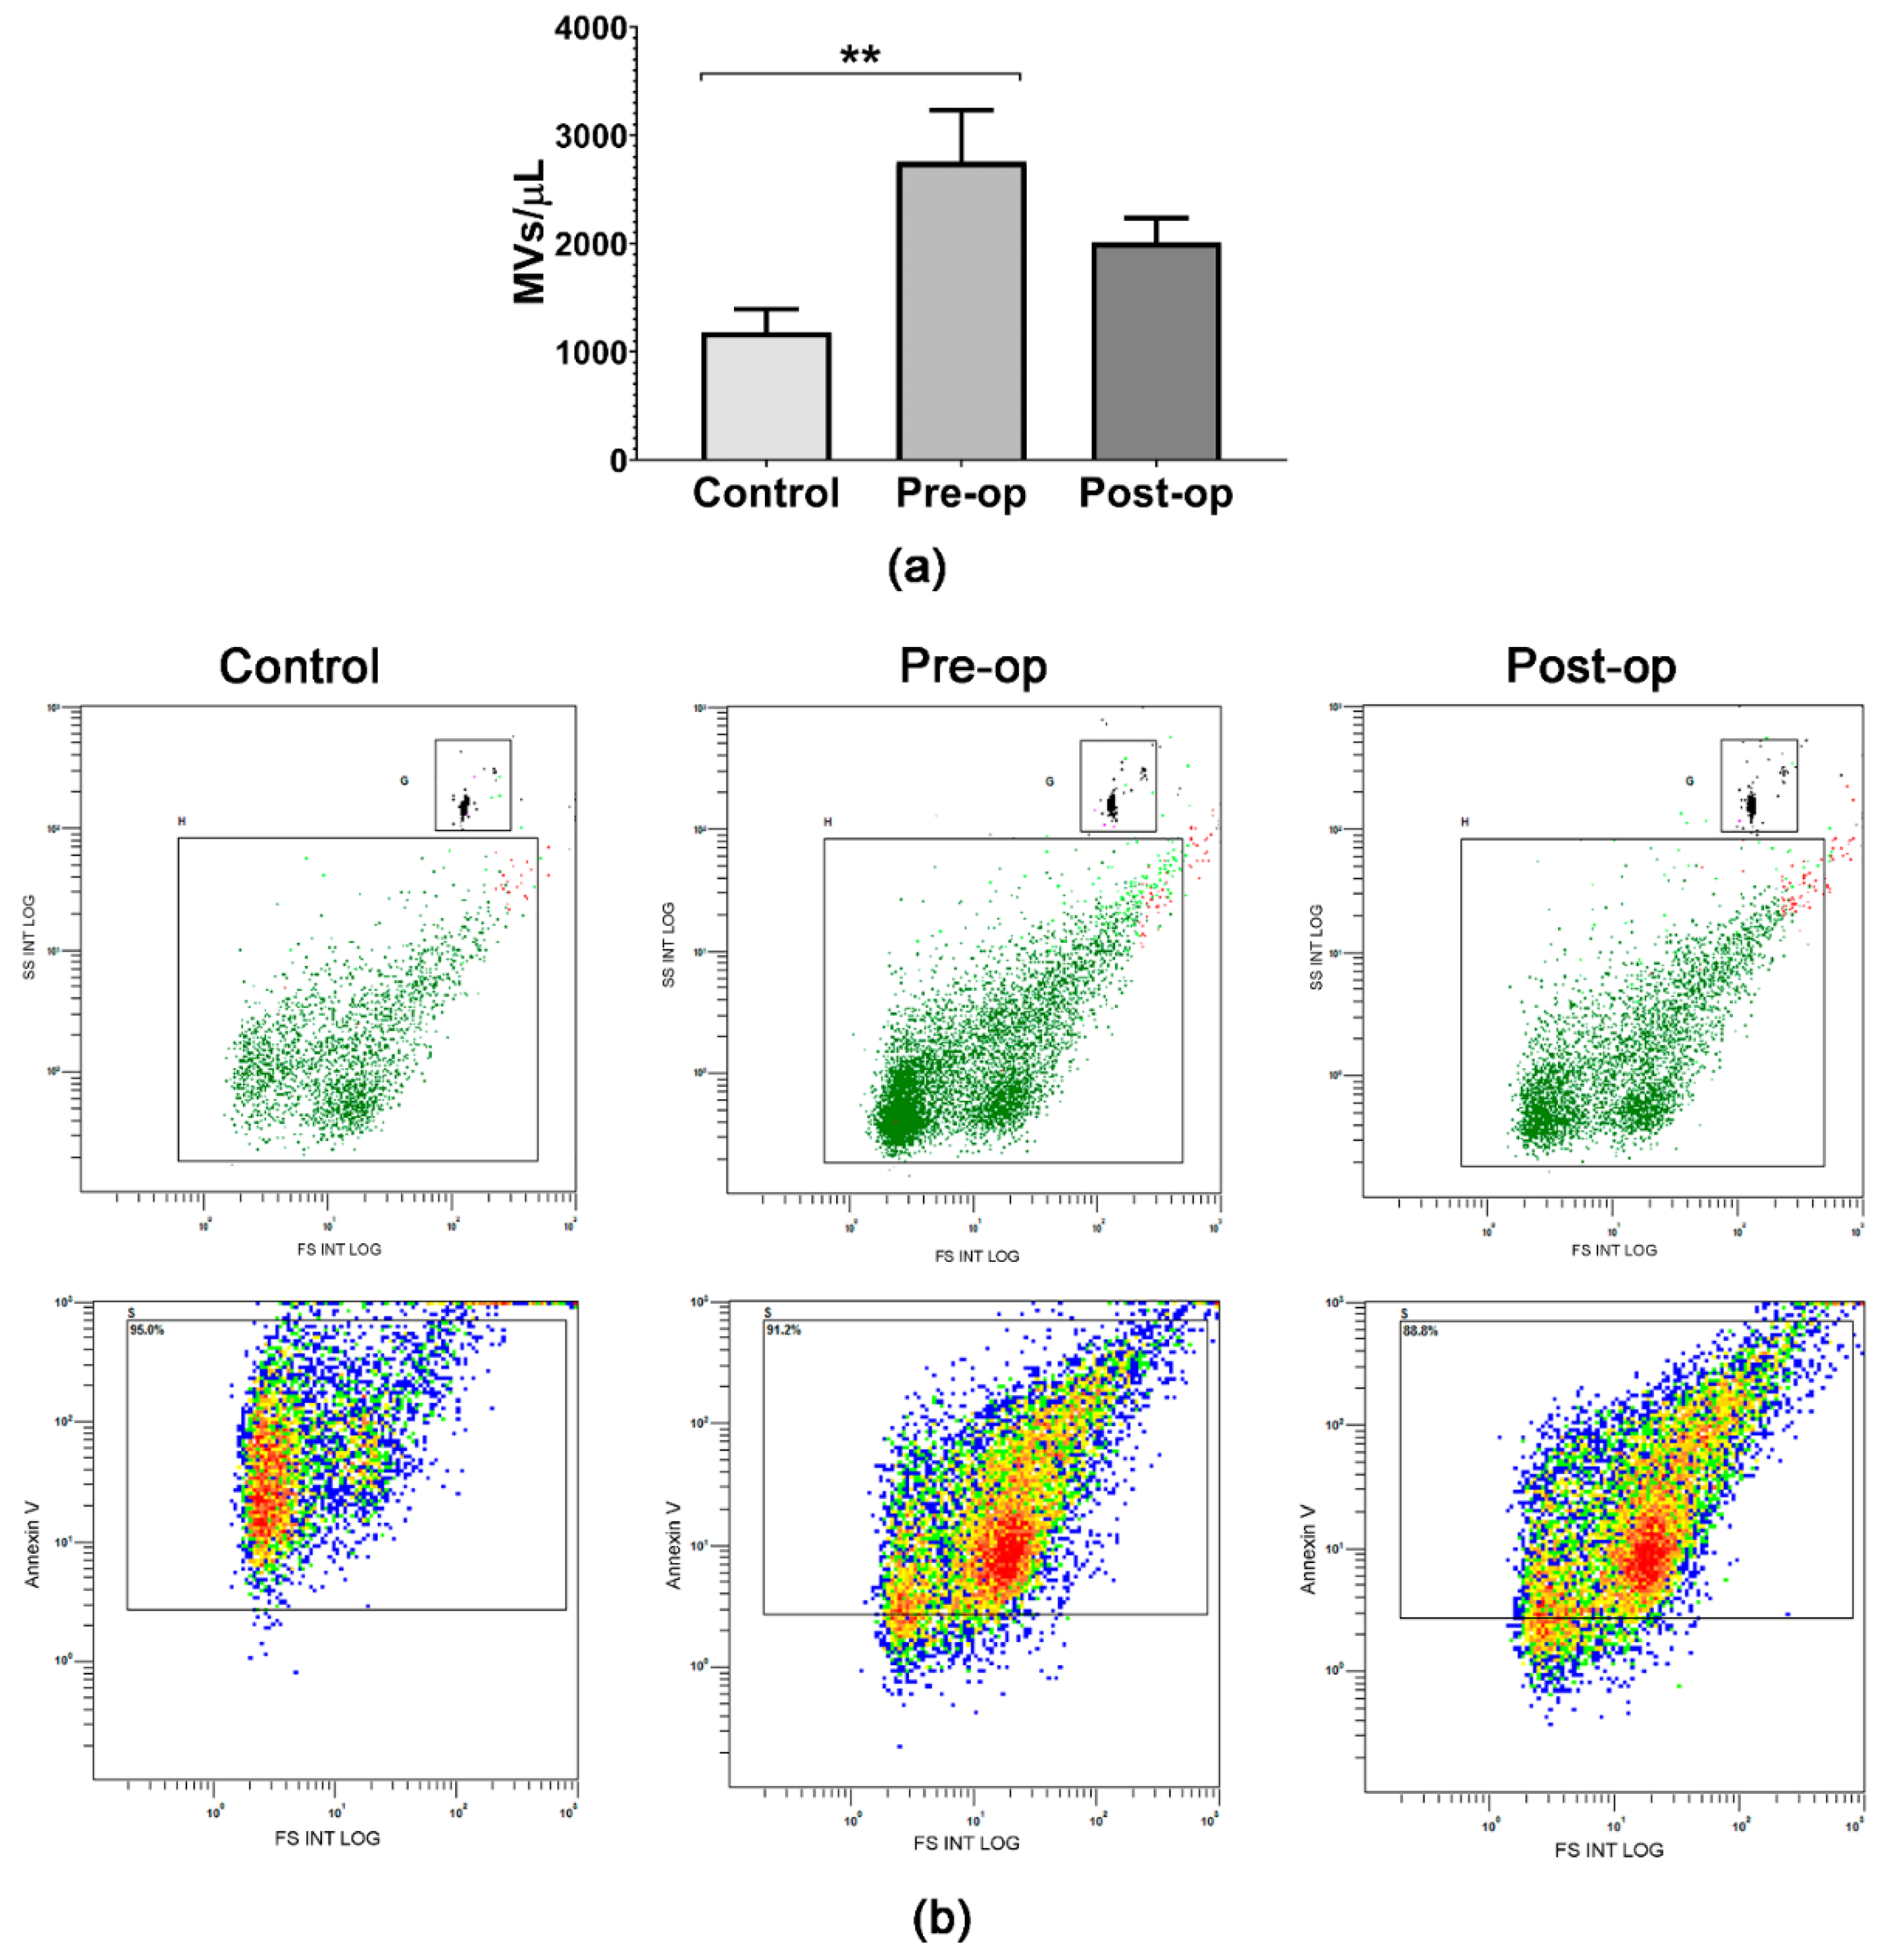
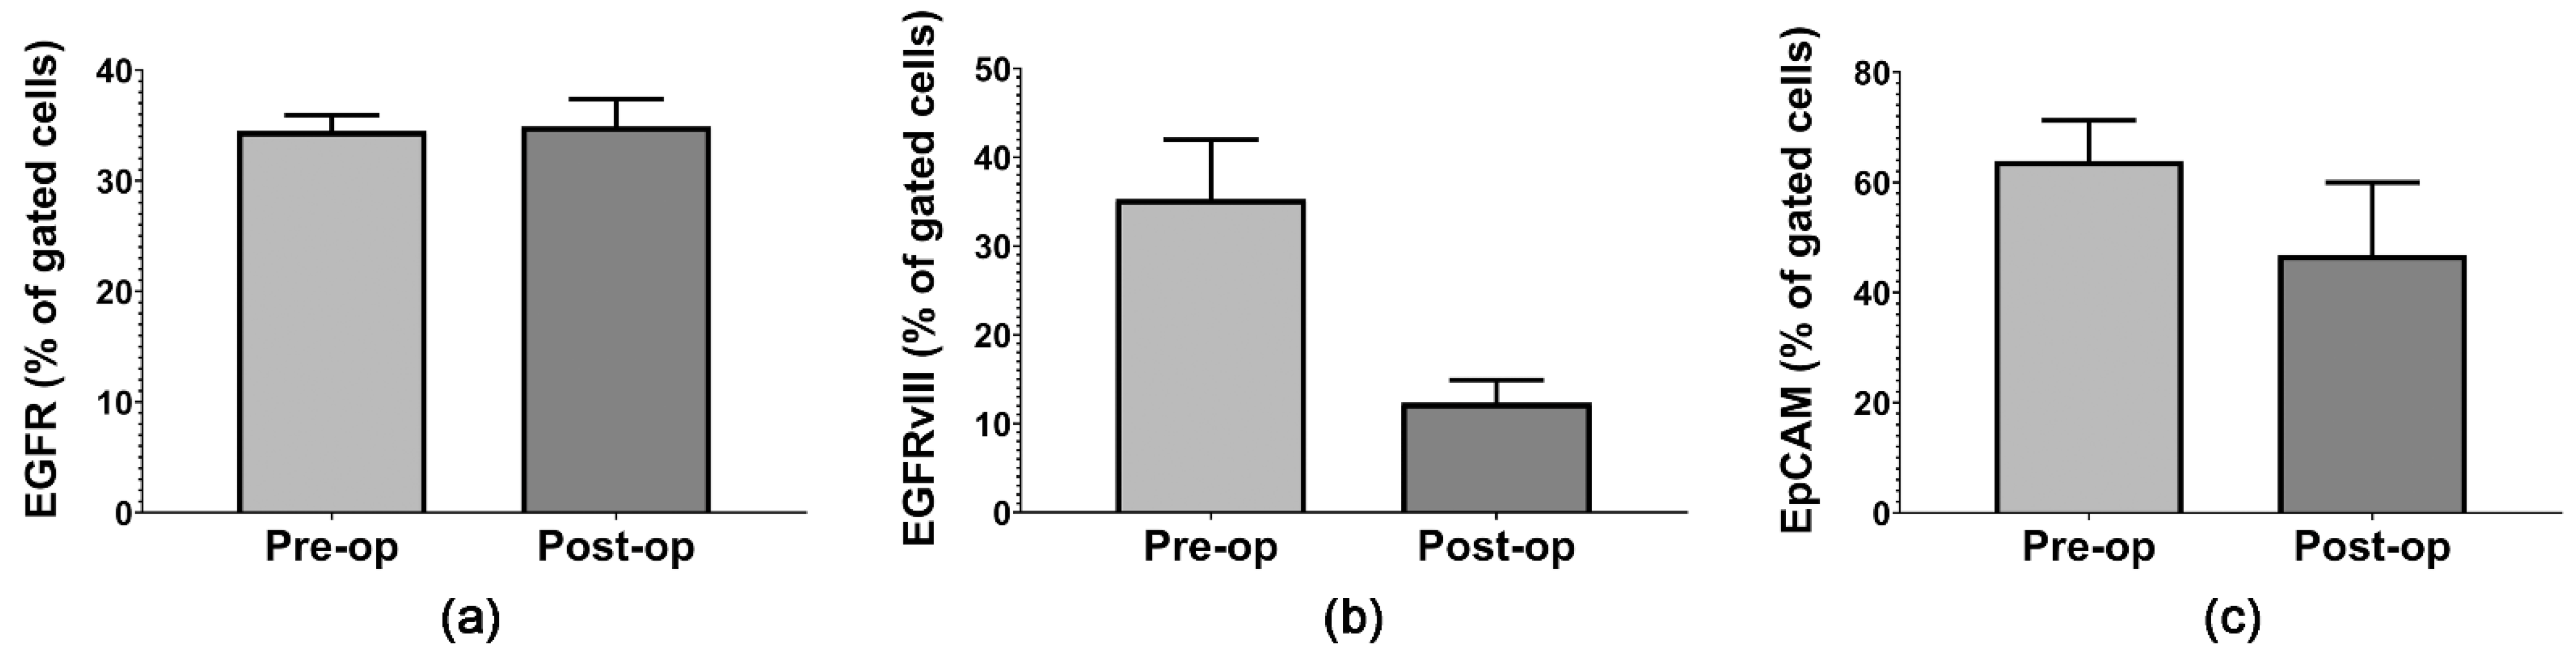
2.1. Quantifying Circulating Plasma MVs and GB-Specific Surface Markers

Flow cytometry was used to analyze and characterize MVs isolated from plasma, including the detection of EGFR, EGFRvIII and EpCAM expression on their surface (Figure 1 and Figure 2). Control subjects had significantly lower circulating MV levels (2.34 times) compared to Pre-op GB patients (Figure 1a), in agreement with previous reports [32,36], which suggests increased intercellular communication and possibly the release of MVs from GB tumors. In addition, the circulating plasma MV concentrations (Annexin-V-positive MVs) decreased slightly (1.37 times) in GB patients’ plasma after surgical resection (Figure 1a), in agreement with Skog et al. [13]. Moreover, Koch et al. [36] showed that MVs’ number could be used to distinguish true progression from the pseudo-progression of GB. Representative dot-plots show the MV quantification and characterization strategy based on calibrated size beads and PS staining as a specific marker for MVs (Figure 1b). They also highlight the purity of MVs isolated, confirmed by PS staining with Annexin V-FITC (Figure 1b).
Our flow cytometric analysis revealed that Annexin-V-positive MVs express GB-specific markers: EGFR, EGFRvIII and EpCAM (Figure 2). There was no difference in EGFR expression on MVs’ surface between the Pre-op and Post-op groups (Figure 2a). EGFRvIII expression decreased (2.85 times) after the surgical resection of GB tumors (Figure 2b), in agreement with results reported by Skog et al. [13], and EpCAM expression decreased slightly (1.36 times) after surgery (Figure 2c). Although we did not find statistically significant differences between the Pre-op and Post-op groups, these results are consistent with previously published reports [13,34] which show high variability in surface GB markers’ expression between patients, most likely depending on the molecular profiles of their tumors.

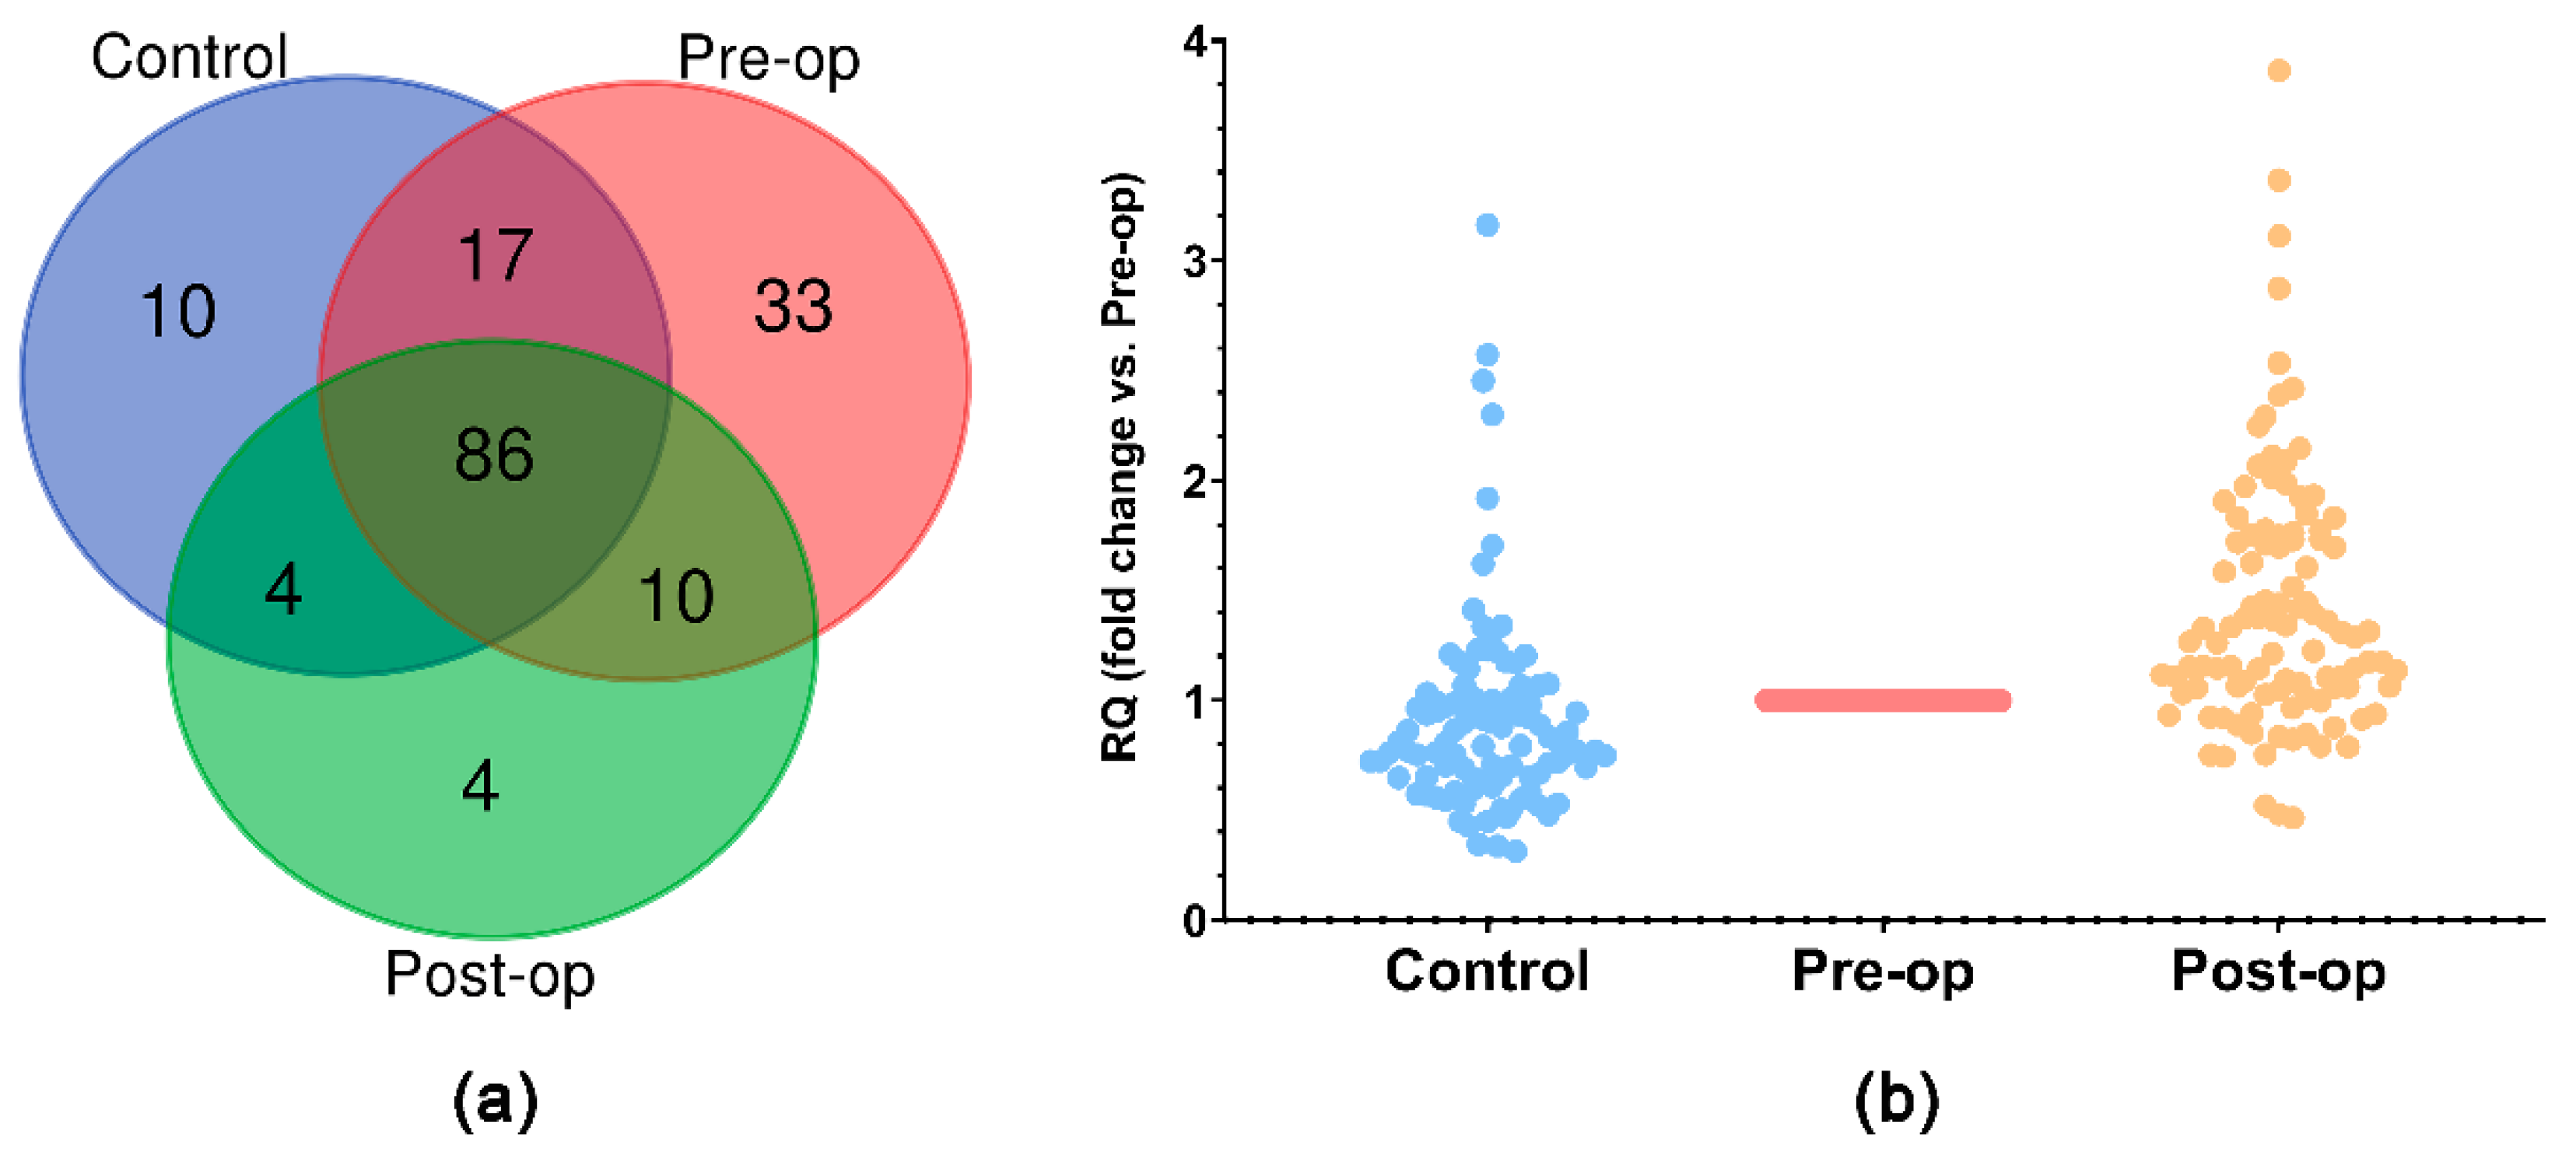
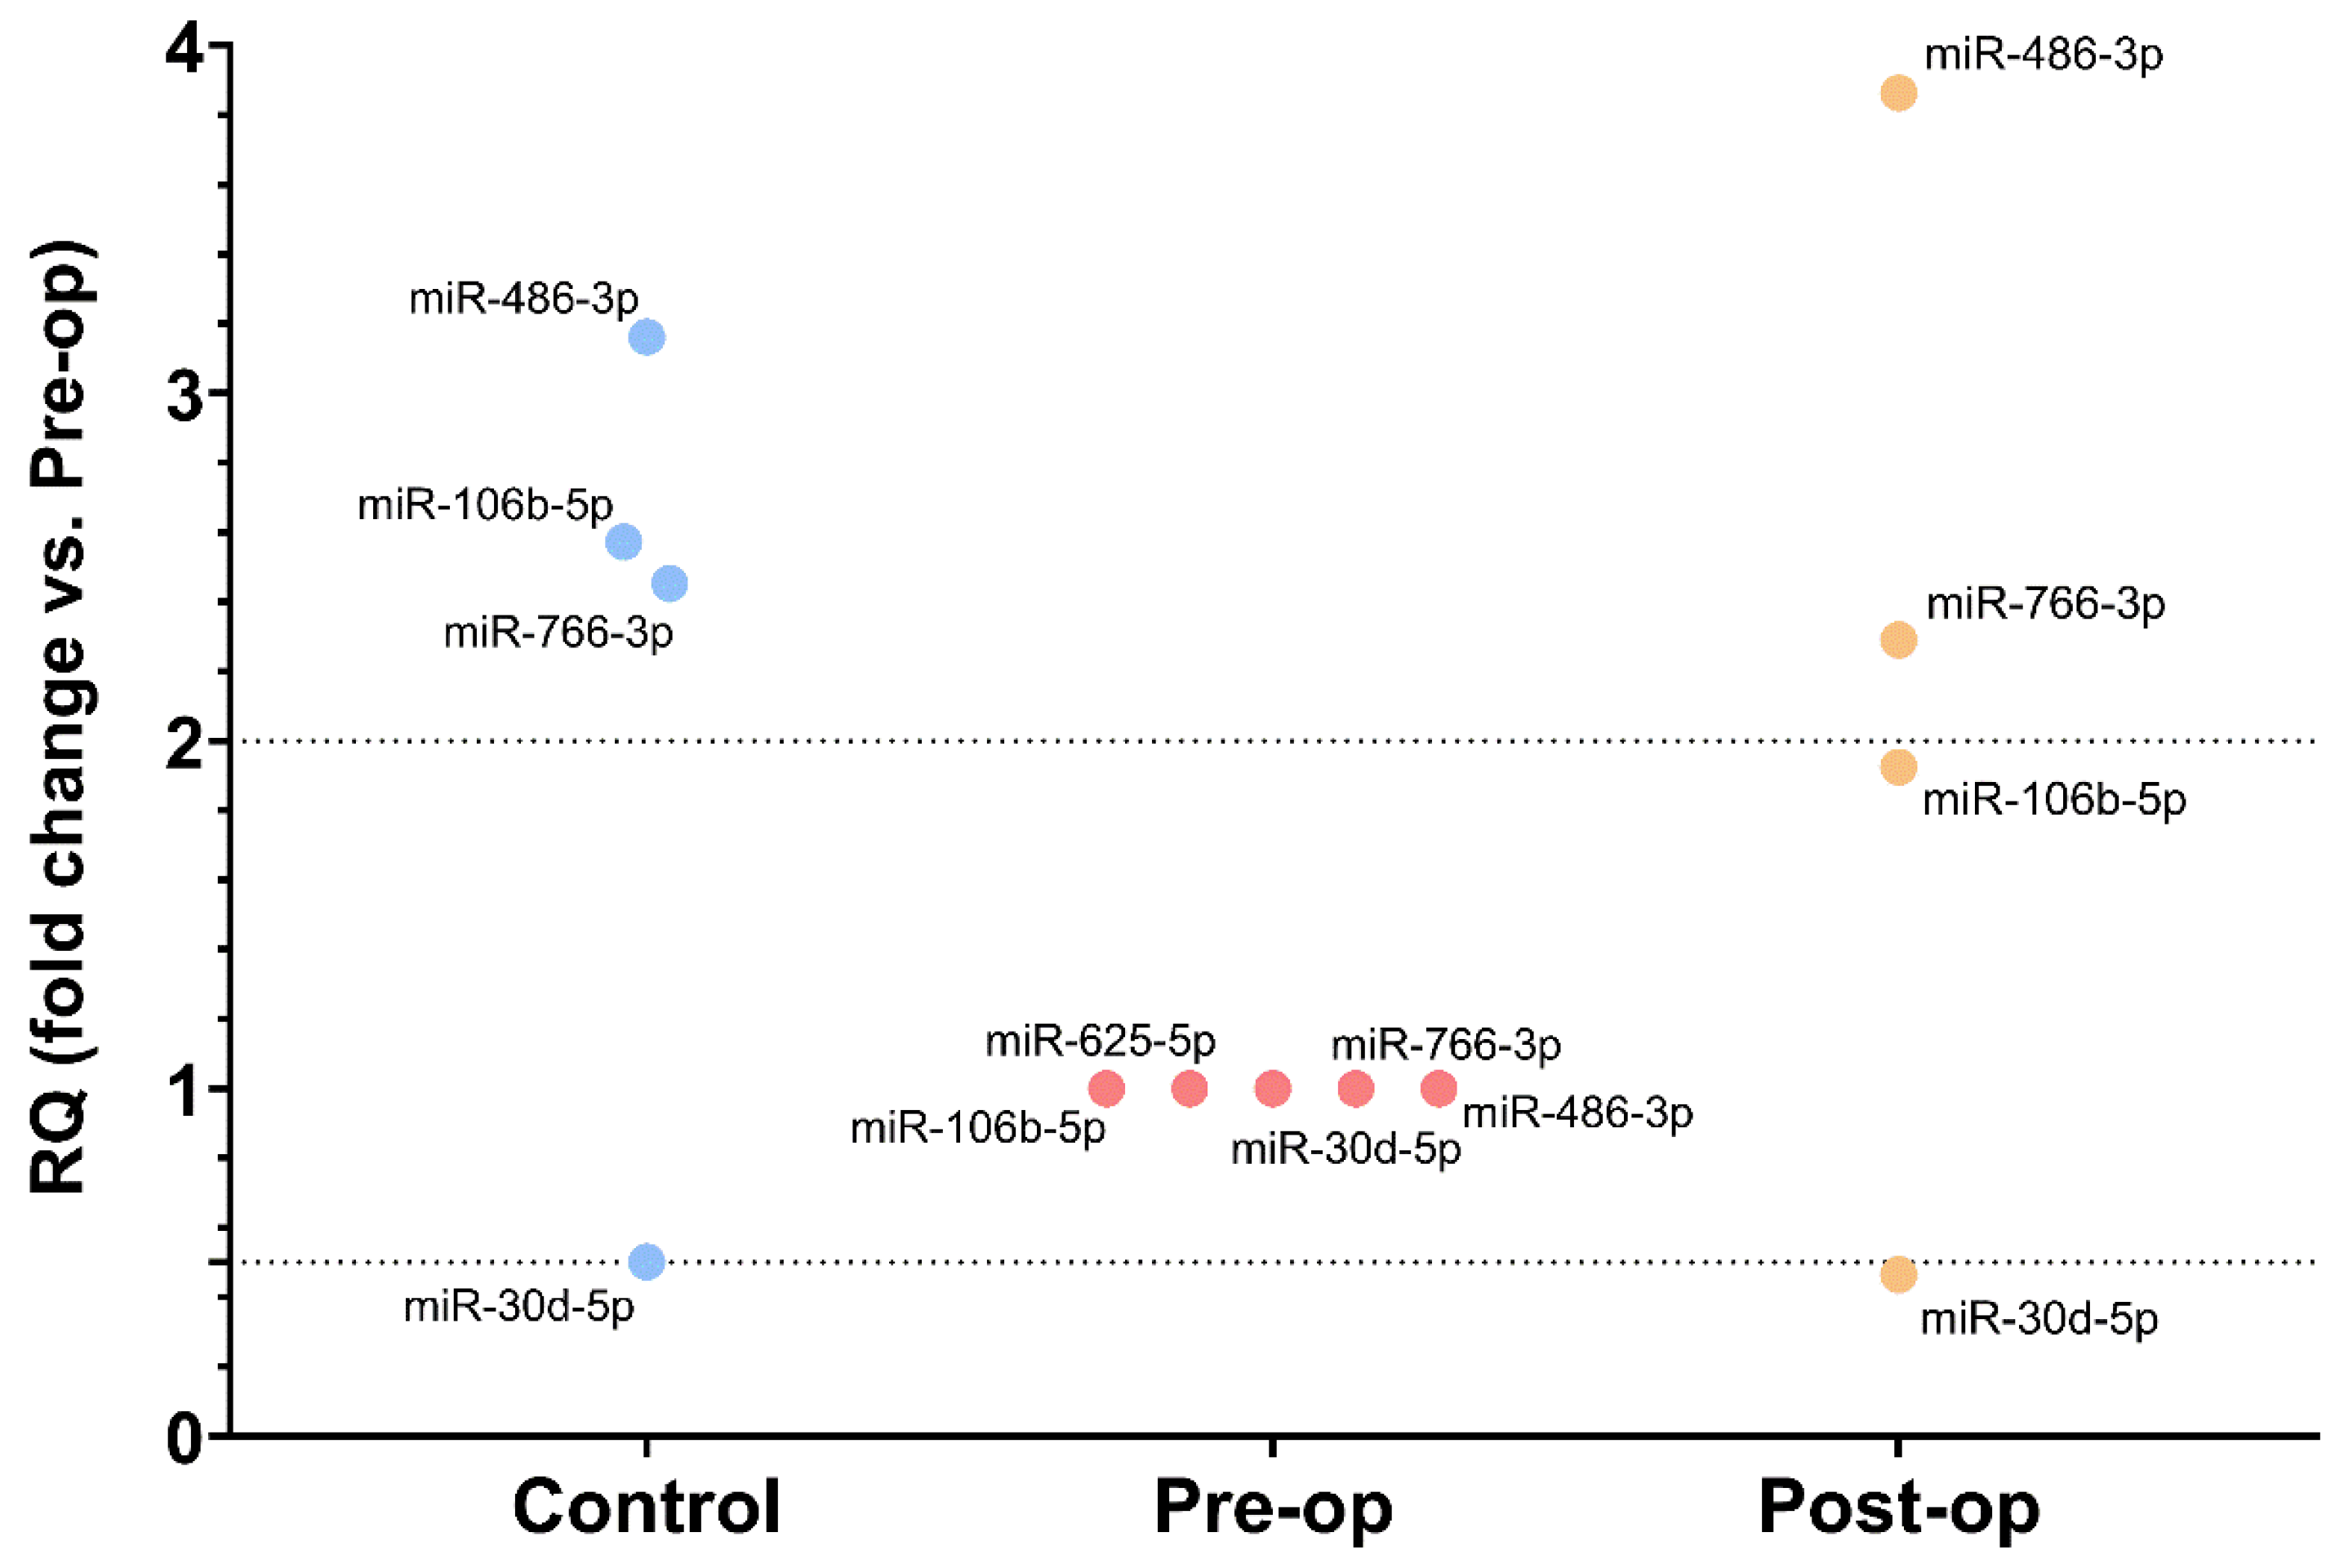
2.2. miRNA Expression Profile in Circulating Plasma MVs

The TaqMan OpenArray Human Advanced MicroRNA Panel, which allows the simultaneous quantification of 754 miRNAs, was used to determine the miRNA expression profile in circulating MVs isolated from the plasma of GB patients and Control subjects. By applying cutoffs for the good amplification quality of CRT < 28 and amplification score > 1, as previously suggested [37], we identified a total of 133 miRNAs expressed in all three groups of subjects (Figure 3a). Compared to the Pre-op group, we identified 1 upregulated (fold change > 2) and 10 downregulated (fold change < 0.5) miRNAs in the Control group and 22 upregulated (fold change > 2) miRNAs in the Post-op group, presented in Figure 3b and Table 1. We found no miRNAs downregulated (fold change < 0.5) in the Post-op group compared to the Pre-op group.
Analyzing all data obtained in the OpenArray profiling, we selected five miRNAs for further analysis (Figure 4): four miRNAs whose levels were restored to control-like levels after surgery (miR-106b-5p, miR-486-3p, miR-766-3p (upregulated) and miR-30d-5p (downregulated)) and one miRNA which was only expressed in the Pre-op group (miR-625-5p).
To date, there are few studies investigating these selected miRNAs in GB progression. It has been reported that miR-106b-5p promotes glioma cell lines’ proliferation, migration and invasion [38,39], regulates the M2 polarization of glioma-infiltrating macrophages [40] and inhibits tumor cell apoptosis in vitro and in vivo [39]. Furthermore, Liu et al. [39] showed that miR-106b-5p had significantly higher expression in GB tumor samples and cell lines than in normal brain tissue, correlated with disease grading. Regarding miR-486-3p, it was determined through in vitro and in vivo experiments that its overexpression increases chemosensitivity to temozolomide by directly targeting O6-methylguanine-DNA methyltransferase (MGMT) [41]. Furthermore, miR-486-3p was found to be overexpressed in primary glioma tissues, promoting glioma aggression, and its levels were correlated with tumor grade and poor overall survival [42]. MiR-766-3p was reported to act as a tumor suppressor in different types of cancers [43,44], but, to the best of our knowledge, its role in glioma has not been investigated. On the other hand, miR-30d-5p was demonstrated to be involved in the development and progression of different types of cancers [45], but, to the best of our knowledge, its involvement in glioma progression has not been investigated. It has been reported that miR-625-5p inhibits glioma cells’ proliferation, migration and invasion and increases their chemosensitivity [46,47]. Furthermore, Zhang et al. [46] reported significantly lower miR-625 expression in tumor samples and cell lines compared to normal brain tissue and astrocytes.

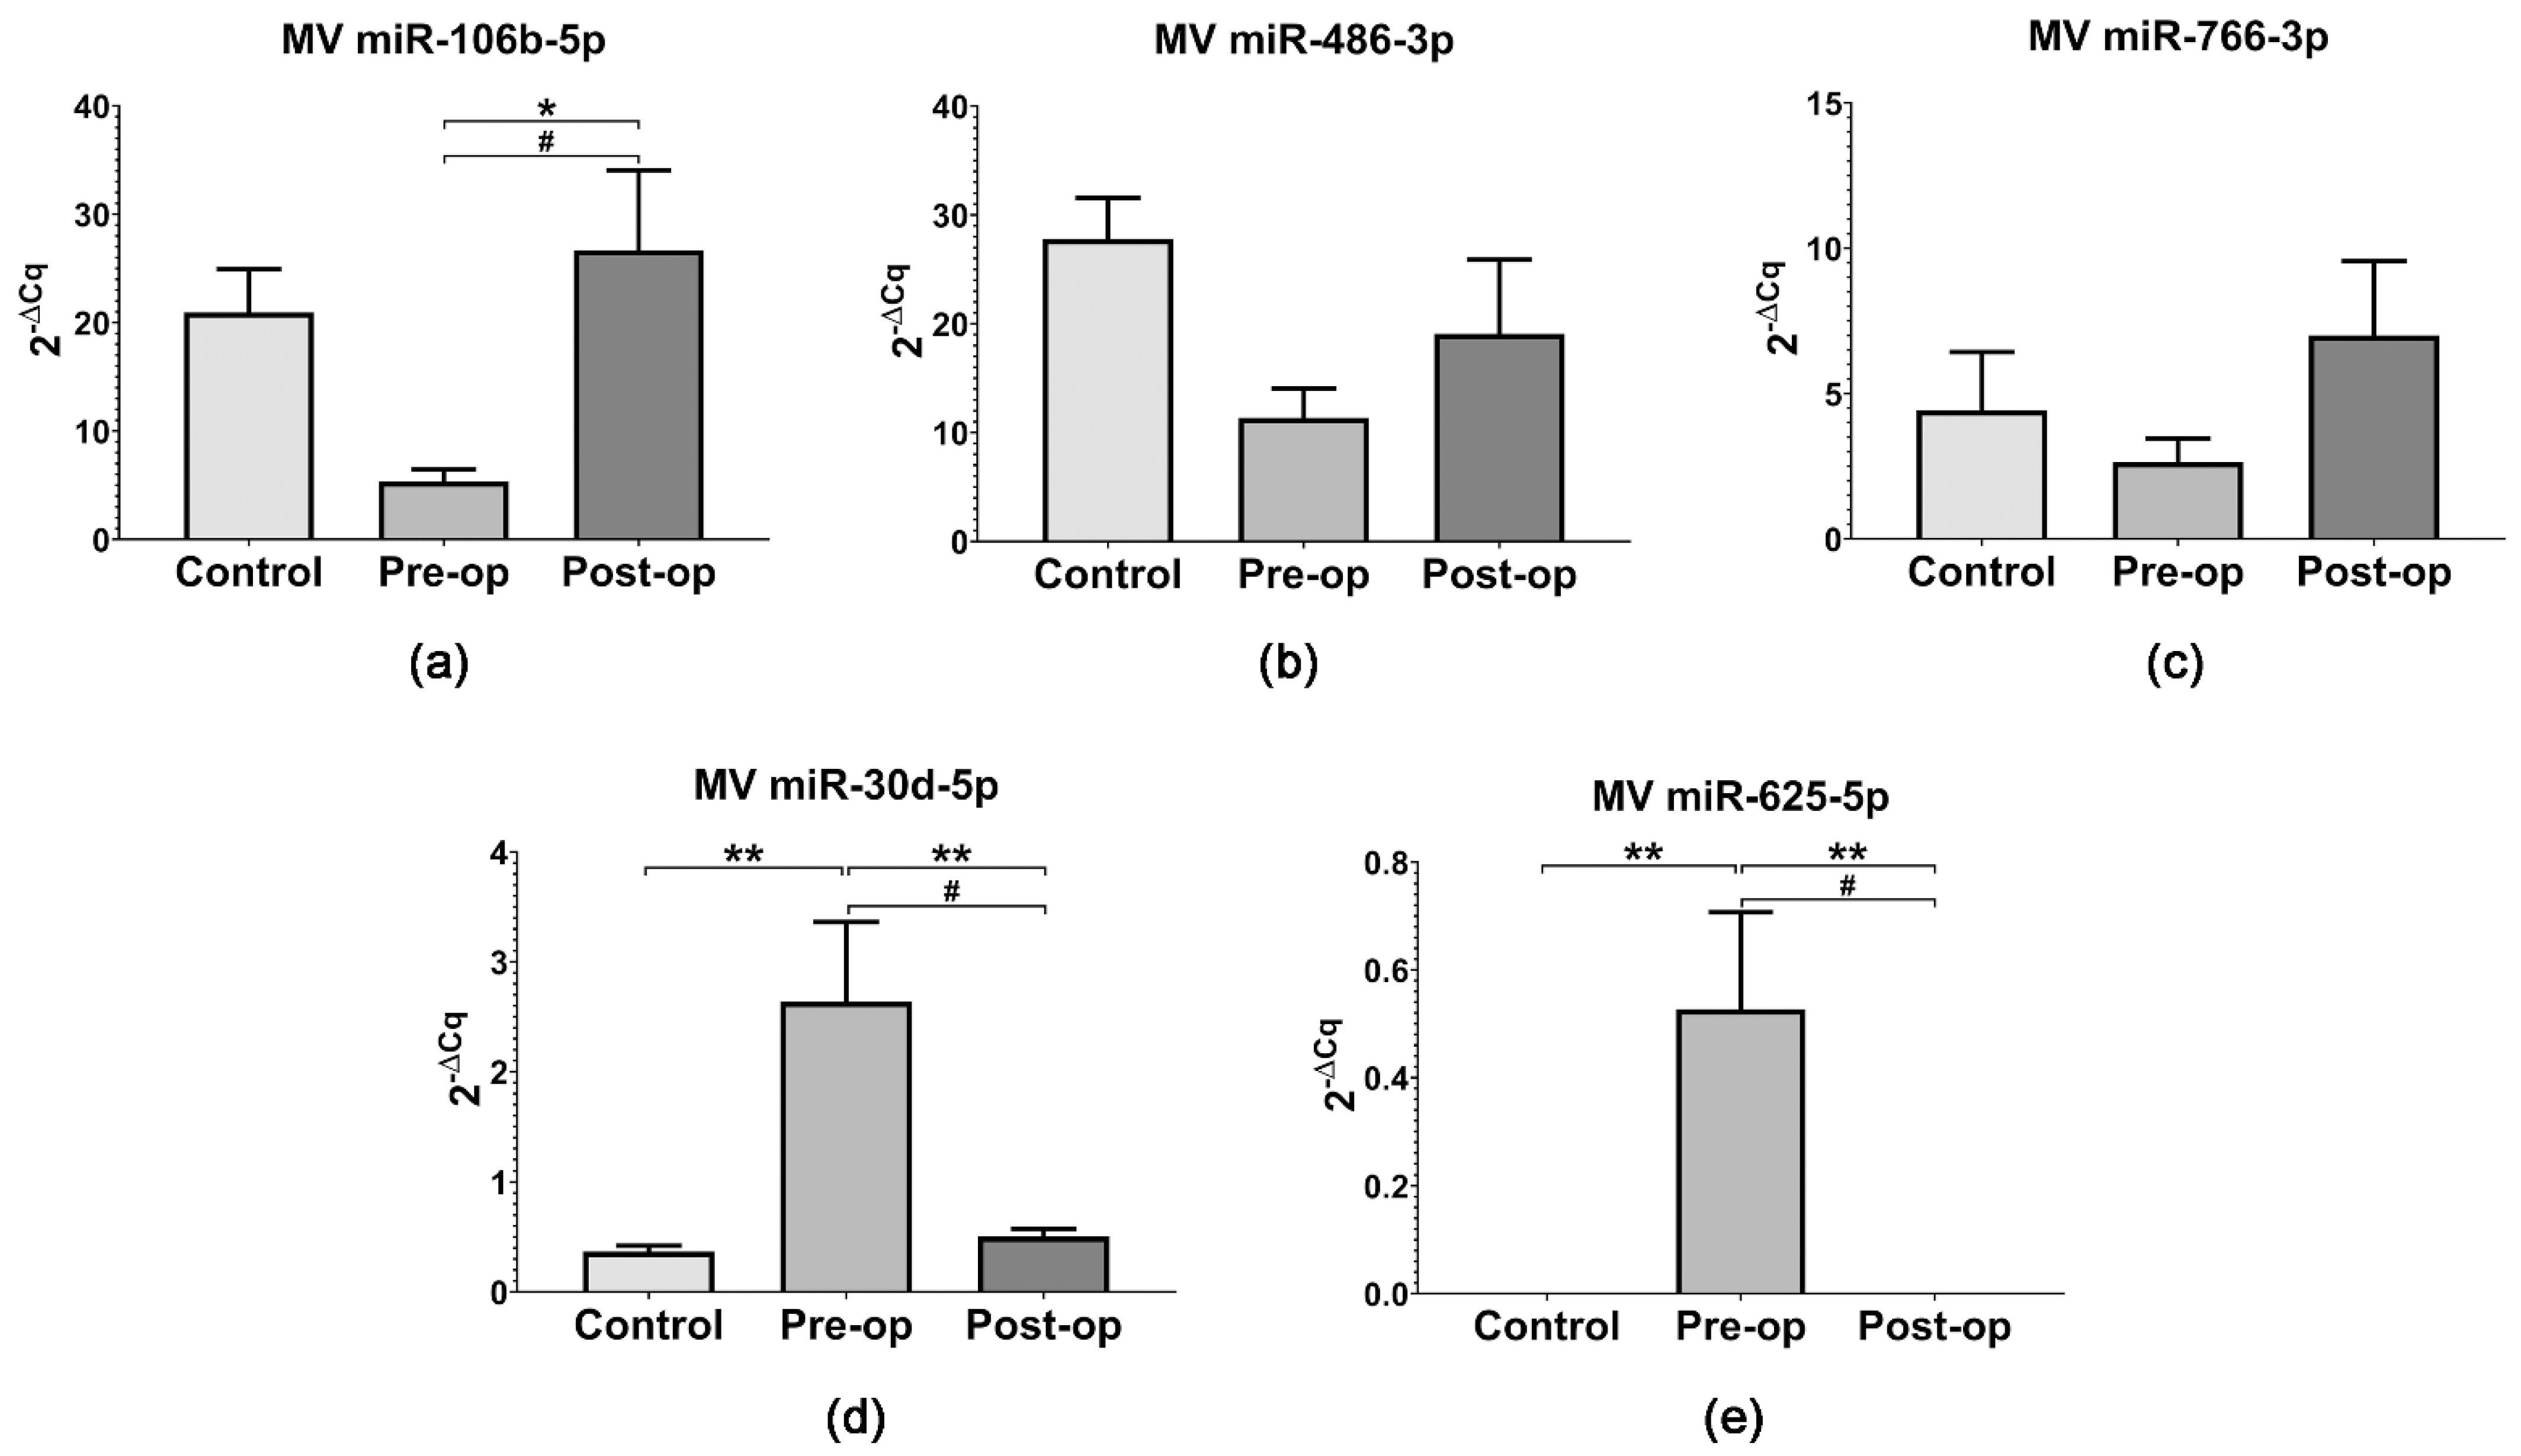
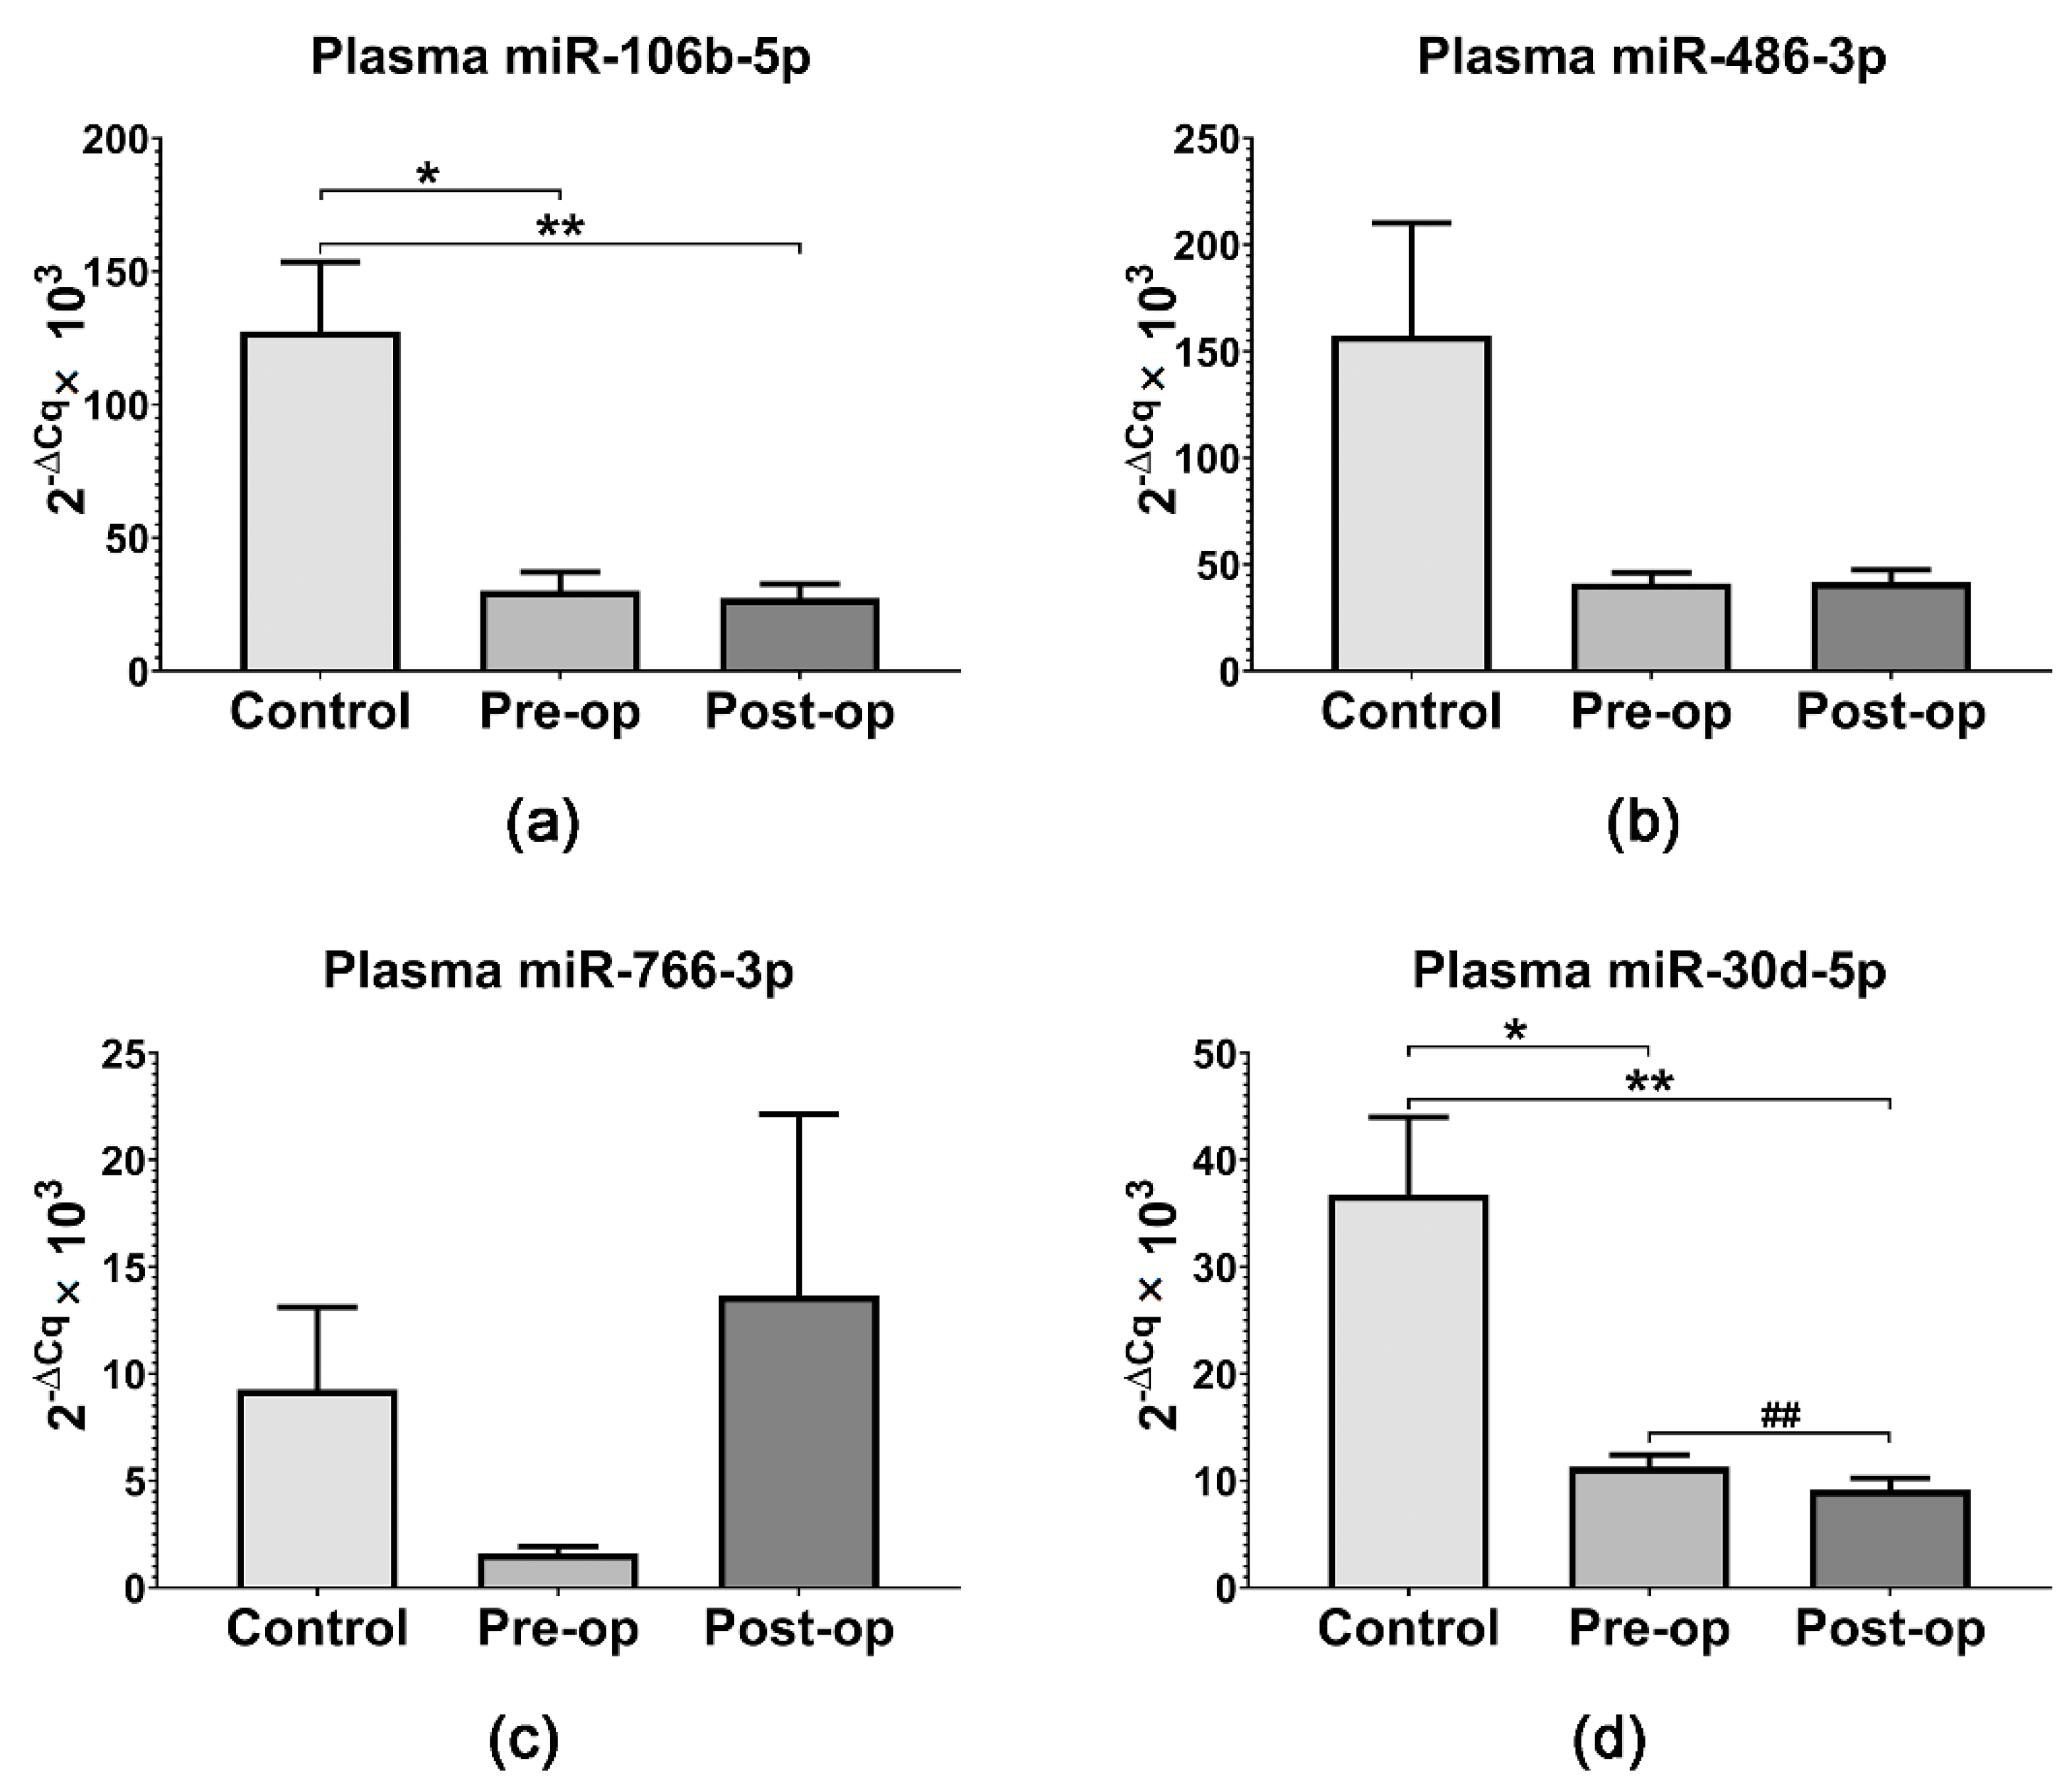
2.3. miRNA Quantification in Circulating MVs and Plasma

Selected miRNAs were quantified using real-time PCR in circulating plasma MVs and plasma samples from GB patients and Control subjects. The individual quantification of miR-106b-5p, miR-486-3p, miR-766-3p, miR-30d-5p and miR-625-5p in MVs confirmed the OpenArray results.
The levels of miR-106b-5p (p = 0.0309, paired t-test), miR-486-3p and miR-766-3p were upregulated in MVs from Post-op patients compared to Pre-op (Figure 5a–c), while miR-30d-5p levels (p = 0.0285, paired t-test) were downregulated after surgical resection (Figure 5d). Additionally, the levels of miR-30d-5p were significantly increased in MVs from Pre-op patients compared to Post-op (p = 0.0039, One-Way ANOVA) and Control MVs (p = 0.0013, One-Way ANOVA) (Figure 5d). In contrast to our results, Hallal et al. [48] found higher levels of miR-106b-5p and miR-486-3p and lower levels of miR-30d-5p in cavitron ultrasonic surgical aspirate (CUSA) and serum EVs from GB patients compared to Controls. However, the same study reported low levels of miR-766-3p in CUSA and serum-EVs compared to Controls and grade II-III glioma, respectively, and high levels of miR-30d-5p in CUSA EVs compared to grade II-III glioma [48], in agreement with our results. Confirming the OpenArray findings, miR-625-5p was only detected in MVs from Pre-op patients (Figure 5e). To the best of our knowledge, this is the first study which reports the quantification of miR-625-5p in circulating MVs from the plasma of GB patients.
Interestingly, miR-106b-5p and miR-30d-5p expression was significantly lower in patients’ plasma (regardless of surgical status) compared to Control subjects’ plasma (Figure 6a,d). Additionally, plasma miR-30d-5p expression was significantly decreased (p = 0.0047, paired t-test) in GB patients’ plasma after surgery (Figure 6d). Plasma miR-486-3p expression was also decreased in patients’ plasma compared to Controls (Figure 6b). Given the fact that miR-106b-5p and miR-486-3p are significantly overexpressed in GB tumors compared to normal brain tissue [39], our results suggest a reduced export of miR-106b-5p and miR-486-3p to circulation in GB patients. The expression of miR-766-3p in plasma samples mirrored the results obtained for MVs, being decreased in Pre-op patients compared to Controls and Post-op patients (Figure 6c). Additionally, miR-625-5p was not detected in plasma samples from GB patients or Control subjects, suggesting it could be specifically transported by MVs.

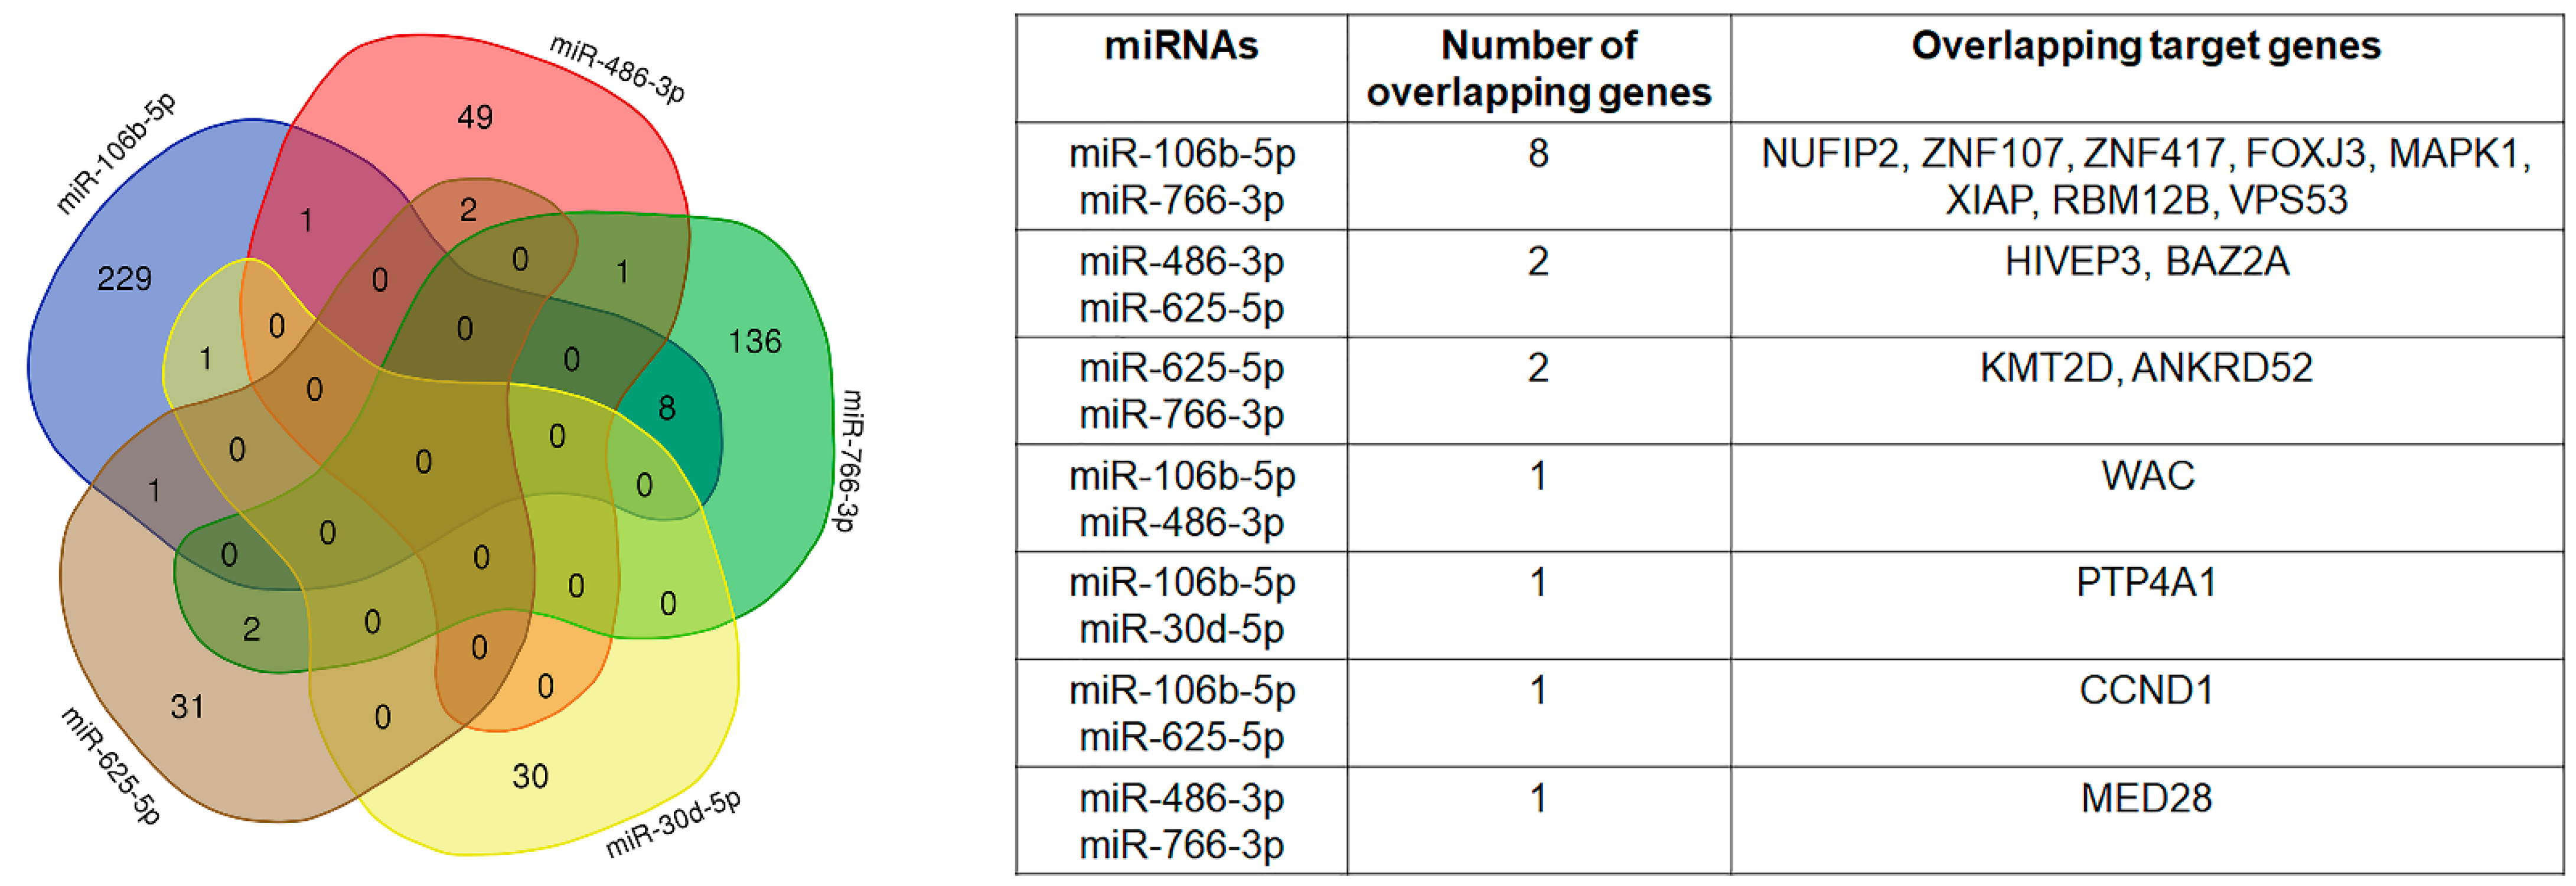
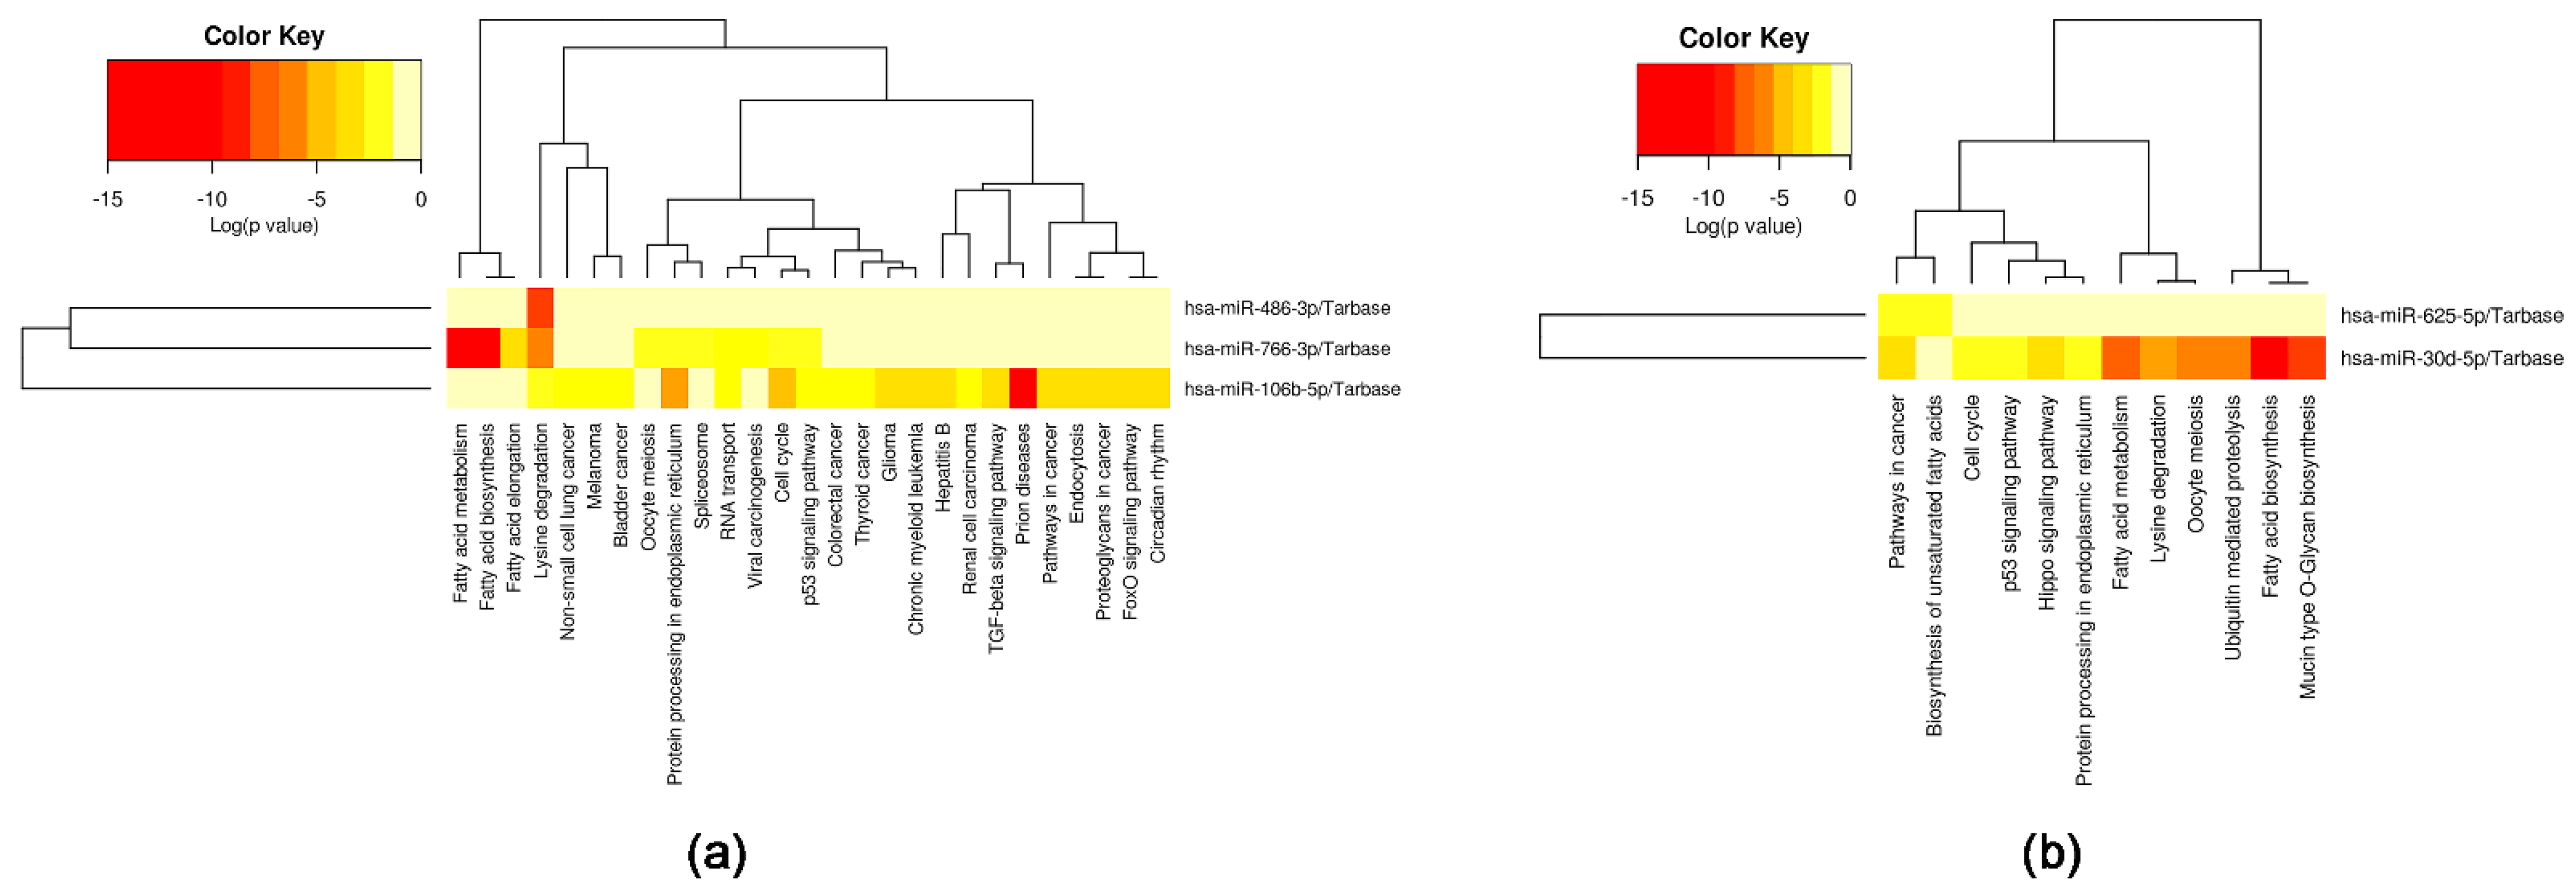
2.4. Selected miRNAs’ Target Genes and Pathways

We performed miRNA target genes’ prediction for miR-106b-5p, miR-486-3p, miR-766-3p, miR-30d-5p and miR-625-5p using the miRWalk algorithm [49]. The analysis returned the validated target genes for the five selected miRNAs: 240 for miR-106b-5p, 53 for miR-486-3p, 147 for miR-766-3p, 31 for miR-30d-5p and 36 for miR-625-5p. Overlapping of target genes occurred between a maximum of two miRNAs, as shown in Figure 7.
For DIANA-miRPath (v3.0) analysis [50], we grouped the selected miRNAs into two categories: miRNAs with decreased expression in Pre-op MVs (miR-106b-5p, miR-486-3p and miR-766-3p) and miRNAs with increased expression in Pre-op MVs (miR-30d-5p and miR-625-5p). The analysis of miR-106b-5p, miR-486-3p and miR-766-3p revealed validated target genes overlapping in the following pathways: endocytosis, pathways in cancer, non-small-cell lung cancer, lysine degradation and prolactin signaling pathway (Figure 8a). Analysis of miR-30d-5p and miR-625-5p showed validated target genes overlapping in glioma, pathways in cancer and melanoma (Figure 8b).

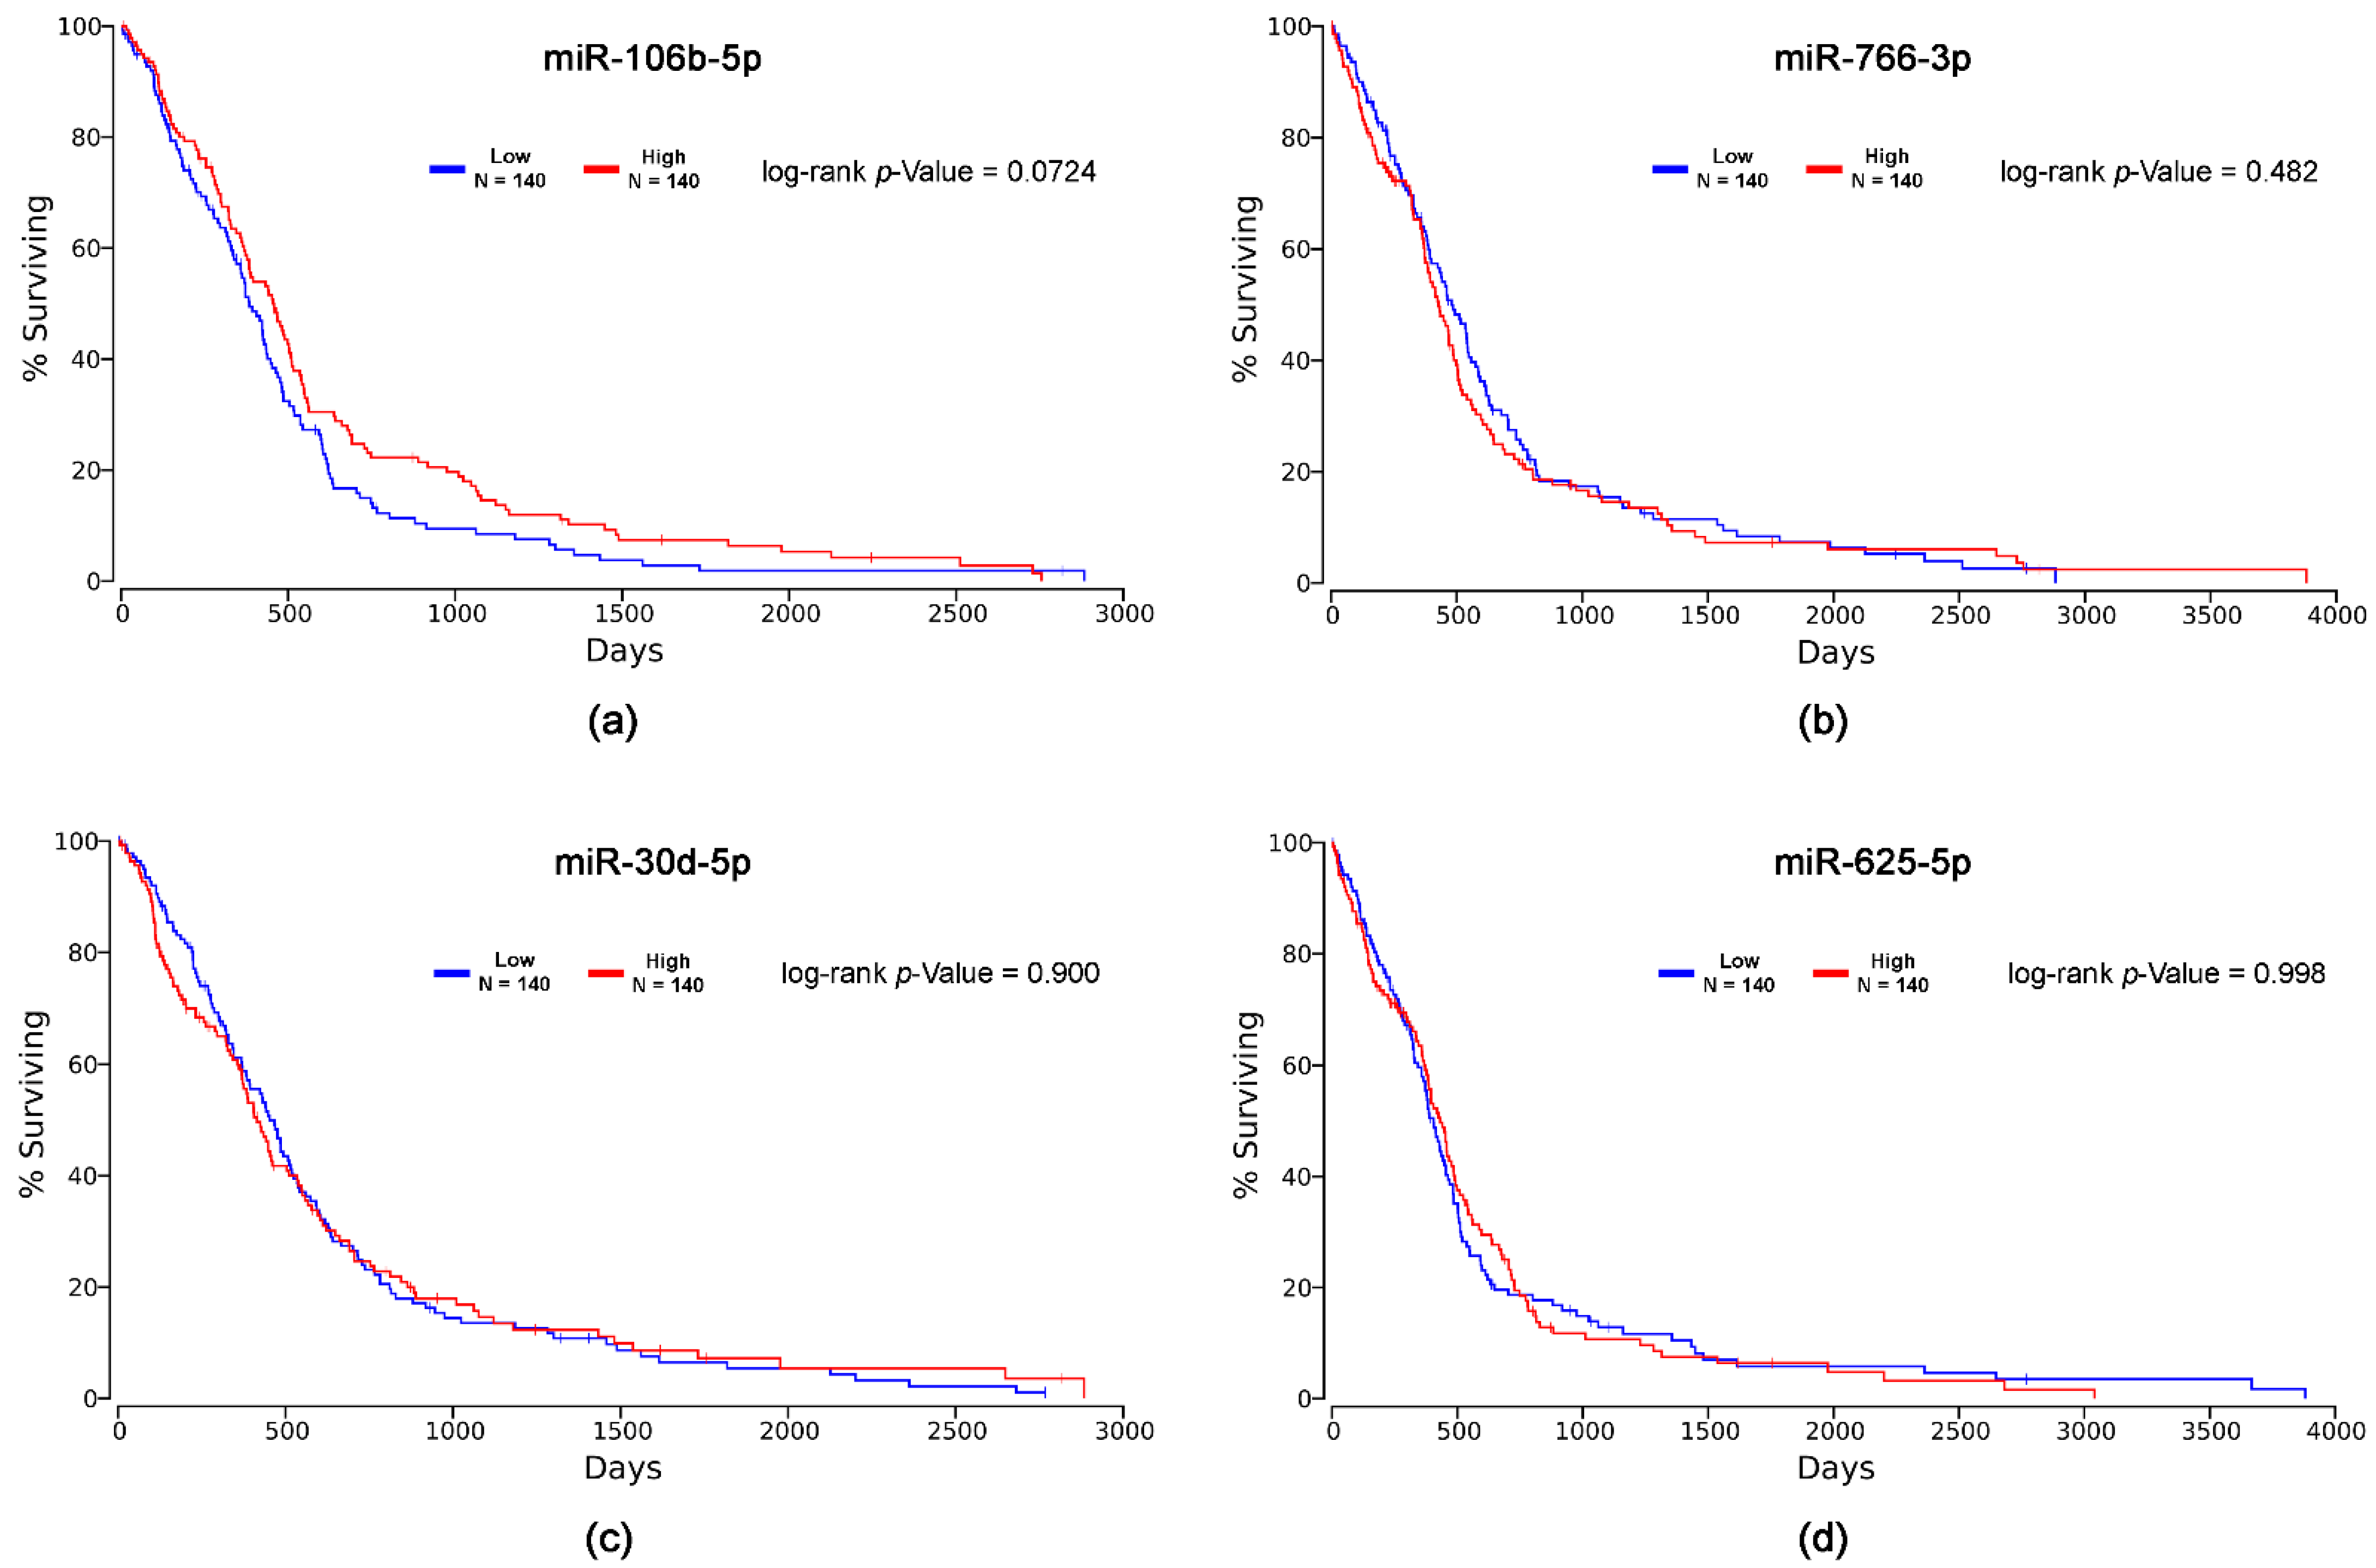
2.5. In Silico Survival Analysis

Using the OncoLnc online platform [51], we investigated whether the selected miRNAs’ expression was associated with GB patients’ survival. In the first stage, we obtained the Cox regression results for the selected miRNAs in GB patients, presented in Table 2. The high expression of miRNAs is correlated with the risk of death if the Cox coefficient has a positive value, while the opposite is indicated by a negative Cox coefficient [51].
The calculated Cox coefficients show that the high expression of miR-106b-5p correlates with the survival of GB patients. This, combined with miR-106b-5p levels increasing after surgical resection, suggests that MV-associated miR-106b-5p has biomarker potential for GB progression. On the other hand, the high expression of miR-766-3p is correlated with the risk of death, indicating an inverse relationship between tissue and circulating levels. The high expression of miR-30d-5p is correlated with the risk of death, which is in line with our results that miR-30d-5p expression is decreased in GB patients’ MVs after surgery. However, these correlations are weak and lack statistical significance (Table 2). On the other hand, the high expression of miR-625-5p correlates significantly (0.333, p = 0.035) with the risk of death, being in agreement with our results for miR-625-5p expression in MVs being restricted only to the Pre-op group. The OncoLnc platform did not return any results for miR-486-3p in GB.
In the second stage, we obtained the Kaplan–Meier curves and log-rank p-values for each miRNA, estimating the association between miRNA expression and GB patients’ survival (Figure 9). We observed the longer survival of patients with high levels of miR-766-3p, as well as of patients with low levels of miR-625-5p. However, the log-rank p-values were not significant. There was no difference between the survival time of patients with low or high expression levels of miR-106b-5p and miR-30d-5p.

2.6. Study Limitations

There are some limitations to our study that we feel we need to mention, namely: (1) freezing the platelet-poor plasma at −80 °C and its subsequent thawing can affect the integrity of MVs obtained by successive centrifugations and characterized by flow cytometry. This problem was prevented by the easy defrosting of samples at room temperature. (2) The contamination of MVs with blood components may exist. To avoid this situation, MVs were washed two times with PBS. (3) There was a risk of incorrectly counting MVs due to contamination of the samples rich in MVs (obtained at 20,000 g) with a small number of apoptotic bodies. The use of counting beads in flow cytometry experiments allowed us to set the MV gate according to their size distribution. (4) Although MVs isolated from plasma were washed with PBS several times, it is possible some plasma miRNAs could have been carried over. However, the specificity and sensitivity of the TaqMan technology mitigates this potential limitation. (5) Survival analysis using the OncoLnc platform was performed using normalized microarray values of miRNAs from tissue samples, and these values may not always correlate with circulating levels. Further studies are needed in this regard, and bio-banks containing body fluid samples from GB patients would be very useful.

3. Materials and Methods

3.1. Study Design and Sample Collection

Patients with GB from the North East region of Romania were recruited after presenting with specific symptomatology [52] at “Prof. Dr. Nicolae Oblu” Emergency Clinical Hospital, Iasi. Patients’ selection was conducted without discrimination in terms of gender, ethnicity or religion. Exclusion criteria were non-compliant patients, autoimmune diseases or acute infections (including SARS-CoV-2). Patients underwent the typical diagnosis protocol, including anamnesis, neurological examination, routine blood tests and brain magnetic resonance imaging (MRI). Next, patients underwent the maximum safe surgical resection (aided by tumor fluorescence induced by 5-aminolevulinic acid (5-ALA)) [53]. Healthy volunteers (Controls) were recruited from the staff of the Centre of Advanced Research in Bionanoconjugates and Biopolymers, “Petru Poni” Institute of Macromolecular Chemistry, Iasi. The study was conducted according to the guidelines of the Declaration of Helsinki and approved by the Ethics Committee of “Prof. Dr. Nicolae Oblu” Emergency Clinical Hospital (no. 19092/21.11.2019). Informed consent was obtained from all subjects involved in the study.
Peripheral blood was collected on tripotassium ethylenediaminetetraacetic acid (K3-EDTA) anticoagulant from Control subjects (one time) and from GB patients before (Pre-op) and one week after the surgical resection of the tumor (Post-op). Peripheral blood was centrifuged at 2500× g for 10 min at 4 °C to collect the platelet-poor plasma (PPP) from the supernatant, which was then aliquoted and stored at −80 °C until further processing. Hemolyzed blood samples were not included in the study.

3.2. MV Isolation

Total circulating MVs were isolated from plasma by sequential centrifugations, using a previously published protocol [35] with some modifications. The platelet-poor plasma (PPP) was centrifuged at 16,000× g for 5 min at 4 °C to remove residual platelets, apoptotic bodies and collect the platelet-free plasma (PFP) in supernatant [54]. MVs were then isolated from PFP by centrifugation at 20,000× g for 90 min at 4 °C, and pelleted MVs were washed twice (20,000× g, 90 min, 4 °C) with Phosphate-Buffered Saline (PBS), re-suspended in PBS and stored at −80 °C until further analysis. For miRNA OpenArray profiling in MVs, equal amounts of plasma were pooled for each group: Control (n = 5), Pre-op (n = 5) and Post-op (n = 5), and MVs were isolated using the protocol described above.

3.3. MV Characterization by Flow Cytometry

MVs were analyzed by flow cytometry using a Gallios Flow Cytometer (Beckman Coulter Life Sciences, CA, USA). Resuspended MVs (10 µL) were mixed with 10 µL of counting beads (1000 beads/µL, 10 µm diameter) and 100 µL of PBS and counted for 60 s. The dot-plot representations (X = forward-scatter intensity, Y = sidescatter intensity) were analyzed in order to determine the number of MVs (0.1–1 µm diameter) in the samples according to the calculation formula: MVs as events/µL = [(MV count/bead count) × bead concentration/µL] × MV purity/100, as previously described [35]. In order to determine MV purity, 10 µL of resuspended MVs was incubated with 2.5 µL of Annexin V antibody (Annexin V Monoclonal Antibody (VAA-33), FITC, eBioscience, Thermo Fisher Scientific, Waltham, MA, USA) in the presence of 2 mM CaCl2 for 40 min at room temperature in the dark, diluted with 100 µL of PBS and analyzed by flow cytometry, as previously described [35]. The isotype control experiments were performed as well.
The expression of GB-specific surface markers on MVs was determined using antibodies against EGFR (EGFR monoclonal antibody (ICR10), PE, Invitrogen, Thermo Fisher Scientific, Waltham, MA USA), EGFRvIII (EGF Receptor vIII (D6T2Q) XP® Rabbit mAb coupled with anti-rabbit IgG (H + L), F(ab’)2 Fragment (Alexa Fluor® 647 Conjugate), Cell Signaling Technology, Danvers, MA, USA) and EpCAM (CD326 (EpCAM) Monoclonal Antibody (1B7), PE, eBioscience, Thermo Fisher Scientific, Waltham, MA, USA). In brief, 10 µL of resuspended MVs was incubated with 2.5 µL of Annexin V antibody and surface marker antibody, diluted at the optimal concentration (according to the manufacturer’s instructions), for 40 min at room temperature in the dark, diluted with 100 µL of PBS and analyzed with a 5000-event cutoff. Data were analyzed with Kaluza Flow Cytometry Analysis Software v2.1 (Beckman Coulter Life Sciences, Indianapolis, IN, USA).

3.4. RNA Isolation

Total miRNAs were isolated from 200 µL of plasma or purified MVs (resuspended in 200 µL of PBS) using the miRNeasy Serum/Plasma Advanced kit (Qiagen, Hilden, Germany), according to the manufacturer’s instructions. For technical normalization purposes, 25 fmol of synthetic cel-miR-39 (Qiagen, Hilden, Germany) was added as spike-in during miRNA isolation from plasma and MVs, as previously described [55]. Purified miRNAs were eluted with 18 μL of RNase-free water and stored at −80 °C until further analysis.

3.5. OpenArray Profiling of miRNAs in MVs

For miRNA OpenArray profiling, miRNAs purified from pooled plasma-derived MVs were used. A poly(A) tailing reaction, adaptor ligation reaction, reverse transcription (RT) and miR-amplification reactions were performed on a Veriti 96-Well Thermal Cycler, using the TaqMan Advanced miRNA cDNA Synthesis Kit (both from Applied Biosystems, Thermo Fisher Scientific, Waltham, MA, USA), according to the manufacturer’s protocol. MiRNA profiling was performed using the TaqMan OpenArray Human Advanced MicroRNA Panel and the TaqMan OpenArray Real-Time PCR Master Mix on a QuantStudio 12K Flex Real-Time PCR System with OpenArray block and an AccuFill System (all from Applied Biosystems, Thermo Fisher Scientific, Waltham, MA, USA), according to the manufacturer’s protocol. The obtained data were analyzed using the QuantStudio 12K Flex Software v1.2 and the ExpressionSuite Software v1.3 (both from Applied Biosystems, Thermo Fisher Scientific, Waltham, MA, USA). The expression level of each miRNA was determined relative to miR-16-5p, as recommended by the manufacturer, calculated using the 2−ΔΔCq method [56] and represented as the fold change (relative quantification, RQ) of Pre-op values for each target. Raw data passed all quality control checks and were filtered by applying cutoffs of CRT < 28 and amp score > 1 (measures of good amplification) [37]. Significant miRNAs were identified and selected for measurement in individual MV and plasma samples.

3.6. Analysis of miRNA Expression in MVs and Plasma Samples

The levels of hsa-miR-106b-5p (ID 000442), hsa-miR-30d-5p (ID 000420), hsa-miR-486-3p (ID 002093), hsa-miR-625-5p (ID 002431) and hsa-miR-766-3p (ID 001986) were measured in MVs and plasma samples using the TaqMan technology. RT was performed on a Veriti 96-Well Thermal Cycler using the TaqMan MicroRNA Reverse Transcription Kit and TaqMan miRNA assays (all from Applied Biosystems, Thermo Fisher Scientific, Waltham, MA, USA). For miRNAs isolated from MVs, the TaqMan™ PreAmp Master Mix (Applied Biosystems, Thermo Fisher Scientific, Waltham, MA, USA) was used for pre-amplification without introducing amplification bias to the sample, according to the manufacturer’s instructions. Real-time quantitative PCR was performed on a QuantStudio 12K Flex Real-Time PCR System, using TaqMan miRNA assays and the TaqMan Gene Expression Master Mix (all from Applied Biosystems, Thermo Fisher Scientific, Waltham, MA, USA), according to the manufacturer’s instructions. Obtained data were analyzed using the QuantStudio 12K Flex Software v1.2 (Applied Biosystems, Thermo Fisher Scientific, Waltham, MA, USA) with the automatic Cq setting. MiRNA levels were calculated using the 2−ΔCq method [56] and multiplied by 103 (for plasma). The expression level of each miRNA of interest was normalized to the exogenous spike-in cel-miR-39-5p (ID 000200) for plasma or snRNU6 (ID001973) for MVs, as previously reported [35,57]. Pre-op and Post-op miRNA levels in MVs and plasma were compared in a patient-matched manner.

3.7. Target Gene Prediction and Pathway Analysis

Target gene prediction was performed for miRNAs selected after OpenArray profiling using the miRWalk tool v3.0 (http://mirwalk.umm.uni-heidelberg.de/, accessed on 29 June 2022), with a score cutoff of ≥0.95 and miRTarBase filter in order to only obtain validated targets [49]. Pathway analysis was conducted with DIANA-miRPath using the miRTarBase algorithm [50].

3.8. In Silico Survival Analysis

The OncoLnc portal (http://www.oncolnc.org, accessed on 24 June 2022) was used to determine the associations between the selected miRNAs’ expression and the survival of GB patients [51]. This platform returns multivariate Cox regression results, as well as Kaplan–Meier plots and log-rank p-values for the analysis [51]. The analysis was performed on data from 563 patients from the TCGA database using the upper 25% and lower 25% slices.

3.9. Statistical Analysis

GraphPad Prism 8 software (GraphPad Software Inc., San Diego, CA, USA) was used for statistical analysis. Data were expressed as means ± standard error of the mean and analyzed using a paired t-test (Pre-op vs. Post-op) or One-Way ANOVA with Tukey’s multiple comparisons test, considering p < 0.05 as statistically significant.

4. Conclusions

Circulating plasma MV levels were positively correlated with GB severity. The surgical resection of GB tumors decreased MVs’ parameters, namely their number, as well as the expression of the EGFRvIII and EpCAM receptors, but the inter-patient variability was high. The expression of miR-106b-5p, miR-486-3p, miR-766-3p and miR-30d-5p in GB patients’ MVs was restored to control-like levels after surgery: miR-106b-5p, miR-486-3p and miR-766-3p were upregulated, while miR-30d-5p levels were downregulated after surgical resection. MiR-625-5p was only identified in MVs isolated from Pre-op GB patients and was not detected in plasma. Target prediction and pathway analysis showed that the selected miRNAs regulate genes involved in cancer pathways, including glioma.
In conclusion, miR-625-5p shows potential as a biomarker for GB regression or recurrence, but further in-depth studies are required in order to establish these miRNAs as biomarkers for GB severity and to elucidate their mechanisms of action in GB progression.

Author Contributions

Conceptualization, N.S. and A.G.; methodology, N.S., M.N., A.-R.P., M.G.D., L.E. and A.G.; validation, N.S., M.N., I.S.N. and R.-C.B.; formal analysis, N.S., M.N., A.-R.P., I.S.N. and R.-C.B.; investigation, N.S., M.N., A.-R.P., I.S.N. and R.-C.B.; resources, N.S., M.G.D., L.E. and A.G.; data curation, N.S., M.N., A.-R.P., I.S.N. and R.-C.B.; writing—original draft preparation, N.S. and A.-R.P.; writing—review and editing, M.G.D., L.E. and A.G.; visualization, N.S., M.N., A.-R.P. and A.G.; supervision, M.G.D., L.E. and A.G.; project administration, N.S. and A.G.; funding acquisition, N.S. and A.G. All authors have read and agreed to the published version of the manuscript.

Funding

This work was supported by the Romanian Academy and by a grant of the Romanian Ministry of Education and Research, CNCS—UEFISCDI, project number PN-III-P1-1.1-PD-2019-0283, within PNCDI III.

Institutional Review Board Statement

The study was conducted in accordance with the Declaration of Helsinki and approved by the Ethics Committee of “Prof. Dr. Nicolae Oblu” Emergency Clinical Hospital (no. 19092/21.11.2019).

Informed Consent Statement

Informed consent was obtained from all subjects involved in the study.

Data Availability Statement

The data presented in this study are available on request from the corresponding author.

Acknowledgments

Access to the research infrastructure developed through the European Social Fund for Regional Development, Competitiveness Operational Programme Axis 1, Action: 1.1.3, Project “Infra SupraChem Lab—Center for Advanced Research in Supramolecular Chemistry” (Contract 339/390015/25.02.2021, cod MySMIS: 108983) is gratefully acknowledged.

Conflicts of Interest

The authors declare no conflict of interest.

References

  1. Patel, A.P.; Tirosh, I.; Trombetta, J.J.; Shalek, A.K.; Gillespie, S.M.; Wakimoto, H.; Cahill, D.P.; Nahed, B.V.; Curry, W.T.; Martuza, R.L.; et al. Single-cell RNA-seq highlights intratumoral heterogeneity in primary glioblastoma. Science 2014, 344, 1396–1401. [Google Scholar] [CrossRef] [Green Version]
  2. Zong, H.; Verhaak, R.G.W.; Canolk, P. The cellular origin for malignant glioma and prospects for clinical advancements. Expert Rev. Mol. Diagn. 2012, 12, 383–394. [Google Scholar] [CrossRef] [Green Version]
  3. Louis, D.N.; Perry, A.; Wesseling, P.; Brat, D.J.; Cree, I.A.; Figarella-Branger, D.; Hawkins, C.; Ng, H.K.; Pfister, S.M.; Reifenberger, G.; et al. The 2021 WHO classification of tumors of the central nervous system: A summary. Neuro. Oncol. 2021, 23, 1231–1251. [Google Scholar] [CrossRef]
  4. Bartel, D.P. MicroRNAs: Genomics, Biogenesis, Mechanism, and Function. Cell 2004, 116, 281–297. [Google Scholar] [CrossRef] [Green Version]
  5. Hayes, J.; Peruzzi, P.P.; Lawler, S. MicroRNAs in cancer: Biomarkers, functions and therapy. Trends Mol. Med. 2014, 20, 460–469. [Google Scholar] [CrossRef]
  6. Areeb, Z.; Stylli, S.S.; Koldej, R.; Ritchie, D.S.; Siegal, T.; Morokoff, A.P.; Kaye, A.H.; Luwor, R.B. MicroRNA as potential biomarkers in Glioblastoma. J. Neurooncol. 2015, 125, 237–248. [Google Scholar] [CrossRef]
  7. Vickers, K.C.; Remaley, A.T. Lipid-based carriers of microRNAs and intercellular communication. Curr. Opin. Lipidol. 2012, 23, 91–97. [Google Scholar] [CrossRef] [PubMed] [Green Version]
  8. Gareev, I.F.; Novicova, L.B.; Beylerli, O.A. Circulating MicroRNA as Novel Potential Biomarkers for the Diagnosis of Highly Malignant Gliomas. Neurosci. Behav. Physiol. 2020, 50, 283–287. [Google Scholar] [CrossRef]
  9. Doyle, L.; Wang, M. Overview of Extracellular Vesicles, Their Origin, Composition, Purpose, and Methods for Exosome Isolation and Analysis. Cells 2019, 8, 727. [Google Scholar] [CrossRef] [Green Version]
  10. Alexandru, N.; Badila, E.; Weiss, E.; Cochior, D.; Stępień, E.; Georgescu, A. Vascular complications in diabetes: Microparticles and microparticle associated microRNAs as active players Dedicated to the 150th anniversary of the Romanian Academy. Biochem. Biophys. Res. Commun. 2016, 472, 1–10. [Google Scholar] [CrossRef]
  11. Jurj, A.; Zanoaga, O.; Braicu, C.; Lazar, V.; Tomuleasa, C.; Irimie, A.; Berindan-neagoe, I. A comprehensive picture of extracellular vesicles and their contents. Molecular transfer to cancer cells. Cancers 2020, 12, 298. [Google Scholar] [CrossRef] [Green Version]
  12. Al-Nedawi, K.; Meehan, B.; Micallef, J.; Lhotak, V.; May, L.; Guha, A.; Rak, J. Intercellular transfer of the oncogenic receptor EGFRvIII by microvesicles derived from tumour cells. Nat. Cell Biol. 2008, 10, 619–624. [Google Scholar] [CrossRef] [PubMed]
  13. Skog, J.; Würdinger, T.; van Rijn, S.; Meijer, D.H.; Gainche, L.; Curry, W.T.; Carter, B.S.; Krichevsky, A.M.; Breakefield, X.O. Glioblastoma microvesicles transport RNA and proteins that promote tumour growth and provide diagnostic biomarkers. Nat. Cell Biol. 2008, 10, 1470–1476. [Google Scholar] [CrossRef]
  14. Collino, F.; Deregibus, M.C.; Bruno, S.; Sterpone, L.; Aghemo, G.; Viltono, L.; Tetta, C.; Camussi, G. Microvesicles derived from adult human bone marrow and tissue specific mesenchymal stem cells shuttle selected pattern of miRNAs. PLoS ONE 2010, 5, e11803. [Google Scholar] [CrossRef]
  15. Abels, E.R.; Maas, S.L.N.; Nieland, L.; Wei, Z.; Cheah, P.S.; Tai, E.; Kolsteeg, C.J.; Dusoswa, S.A.; Ting, D.T.; Hickman, S.; et al. Glioblastoma-Associated Microglia Reprogramming Is Mediated by Functional Transfer of Extracellular miR-21. Cell Rep. 2019, 28, 3105–3119.e7. [Google Scholar] [CrossRef] [PubMed] [Green Version]
  16. Morad, G.; Carman, C.V.; Hagedorn, E.J.; Perlin, J.R.; Zon, L.I.; Mustafaoglu, N.; Park, T.E.; Ingber, D.E.; Daisy, C.C.; Moses, M.A. Tumor-Derived Extracellular Vesicles Breach the Intact Blood-Brain Barrier via Transcytosis. ACS Nano 2019, 13, 13853–13865. [Google Scholar] [CrossRef] [PubMed]
  17. Saint-Pol, J.; Gosselet, F.; Duban-Deweer, S.; Pottiez, G.; Karamanos, Y. Targeting and Crossing the Blood-Brain Barrier with Extracellular Vesicles. Cells 2020, 9, 851. [Google Scholar] [CrossRef] [Green Version]
  18. Akers, J.C.; Ramakrishnan, V.; Yang, I.; Hua, W.; Mao, Y.; Carter, B.S.; Chen, C.C. Optimizing preservation of extracellular vesicular miRNAs derived from clinical cerebrospinal fluid. Cancer Biomark. 2016, 17, 125–132. [Google Scholar] [CrossRef] [Green Version]
  19. Liu, Z.; Cauvi, D.M.; Bernardino, E.M.A.; Lara, B.; Lizardo, R.E.; Hawisher, D.; Bickler, S.; De Maio, A. Isolation and characterization of human urine extracellular vesicles. Cell Stress Chaperones 2018, 23, 943–953. [Google Scholar] [CrossRef] [PubMed]
  20. Arraud, N.; Linares, R.; Tan, S.; Gounou, C.; Pasquet, J.M.; Mornet, S.; Brisson, A.R. Extracellular vesicles from blood plasma: Determination of their morphology, size, phenotype and concentration. J. Thromb. Haemost. 2014, 12, 614–627. [Google Scholar] [CrossRef]
  21. Zonneveld, M.I.; Brisson, A.R.; van Herwijnen, M.J.C.; Tan, S.; van de Lest, C.H.A.; Redegeld, F.A.; Garssen, J.; Wauben, M.H.M.; Hoen, E.N.t.N.M. Recovery of extracellular vesicles from human breast milk is influenced by sample collection and vesicle isolation procedures. J. Extracell. Vesicles 2014, 3, 24215. [Google Scholar] [CrossRef] [PubMed] [Green Version]
  22. Iwai, K.; Yamamoto, S.; Yoshida, M.; Shiba, K. Isolation of Extracellular Vesicles in Saliva Using Density Gradient Ultracentrifugation. Methods Mol. Biol. 2017, 1660, 343–350. [Google Scholar] [CrossRef] [PubMed]
  23. Ebert, B.; Rai, A.J. Isolation and characterization of amniotic fluid-derived extracellular vesicles for biomarker discovery. In Methods in Molecular Biology; Humana Press: Totowa, NJ, USA, 2019; Volume 1885, pp. 287–294. [Google Scholar]
  24. Alexandru, N.; Costa, A.; Constantin, A.; Cochior, D.; Georgescu, A. Microparticles: From Biogenesis to Biomarkers and Diagnostic Tools in Cardiovascular Disease. Curr. Stem Cell Res. Ther. 2016, 12, 89–102. [Google Scholar] [CrossRef] [PubMed]
  25. Chistiakov, D.A.; Chekhonin, V.P. Extracellular vesicles shed by glioma cells: Pathogenic role and clinical value. Tumor Biol. 2014, 35, 8425–8438. [Google Scholar] [CrossRef] [PubMed]
  26. Akers, J.C.; Ramakrishnan, V.; Kim, R.; Skog, J.; Nakano, I.; Pingle, S.; Kalinina, J.; Hua, W.; Kesari, S.; Mao, Y.; et al. miR-21 in the Extracellular Vesicles (EVs) of Cerebrospinal Fluid (CSF): A Platform for Glioblastoma Biomarker Development. PLoS ONE 2013, 8, e78115. [Google Scholar] [CrossRef]
  27. Shi, R.; Wang, P.Y.; Li, X.Y.; Chen, J.X.; Li, Y.; Zhang, X.Z.; Zhang, C.G.; Jiang, T.; Li, W.B.; Ding, W.; et al. Exosomal levels of miRNA-21 from cerebrospinal fluids associated with poor prognosis and tumor recurrence of glioma patients. Oncotarget 2015, 6, 26971–26981. [Google Scholar] [CrossRef] [Green Version]
  28. Santangelo, A.; Imbrucè, P.; Gardenghi, B.; Belli, L.; Agushi, R.; Tamanini, A.; Munari, S.; Bossi, A.M.; Scambi, I.; Benati, D.; et al. A microRNA signature from serum exosomes of patients with glioma as complementary diagnostic biomarker. J. Neurooncol. 2018, 136, 51–62. [Google Scholar] [CrossRef]
  29. Zhong, F.; Huang, T.; Leng, J. Serum miR-29b as a novel biomarker for glioblastoma diagnosis and prognosis. Int. J. Clin. Exp. Pathol. 2019, 12, 4106–4112. [Google Scholar]
  30. Tabibkhooei, A.; Izadpanahi, M.; Arab, A.; Zare-Mirzaei, A.; Minaeian, S.; Rostami, A.; Mohsenian, A. Profiling of novel circulating microRNAs as a non-invasive biomarker in diagnosis and follow-up of high and low-grade gliomas. Clin. Neurol. Neurosurg. 2020, 190, 105652. [Google Scholar] [CrossRef]
  31. Li, Z.; Ye, L.; Wang, L.; Quan, R.; Zhou, Y.; Li, X. Identification of miRNA signatures in serum exosomes as a potential biomarker after radiotherapy treatment in glioma patients. Ann. Diagn. Pathol. 2020, 44, 151436. [Google Scholar] [CrossRef]
  32. André-Grégoire, G.; Bidère, N.; Gavard, J. Temozolomide affects Extracellular Vesicles Released by Glioblastoma Cells. Biochimie 2018, 155, 11–15. [Google Scholar] [CrossRef] [PubMed]
  33. Simionescu, N.; Zonda, R.; Petrovici, A.R.; Georgescu, A. The Multifaceted Role of Extracellular Vesicles in Glioblastoma: microRNA Nanocarriers for Disease Progression and Gene Therapy. Pharmaceutics 2021, 13, 988. [Google Scholar] [CrossRef] [PubMed]
  34. Fraser, K.; Jo, A.; Giedt, J.; Vinegoni, C.; Yang, K.S.; Peruzzi, P.; Chiocca, E.A.; Breakefield, X.O.; Lee, H.; Weissleder, R. Characterization of single microvesicles in plasma from glioblastoma patients. Neuro. Oncol. 2019, 21, 606–615. [Google Scholar] [CrossRef] [PubMed]
  35. Alexandru, N.; Andrei, E.; Niculescu, L.; Dragan, E.; Ristoiu, V.; Georgescu, A. Microparticles of healthy origins improve endothelial progenitor cell dysfunction via microRNA transfer in an atherosclerotic hamster model. Acta Physiol. 2017, 221, 230–249. [Google Scholar] [CrossRef]
  36. Koch, C.J.; Lustig, R.A.; Yang, X.Y.; Jenkins, W.T.; Wolf, R.L.; Martinez-Lage, M.; Desai, A.; Williams, D.; Evans, S.M. Microvesicles as a biomarker for tumor progression versus treatment effect in radiation/temozolomide-treated glioblastoma patients. Transl. Oncol. 2014, 7, 752–758. [Google Scholar] [CrossRef] [Green Version]
  37. Serpente, M.; Fenoglio, C.; D’Anca, M.; Arcaro, M.; Sorrentino, F.; Visconte, C.; Arighi, A.; Fumagalli, G.G.; Porretti, L.; Cattaneo, A.; et al. MiRNA Profiling in Plasma Neural-Derived Small Extracellular Vesicles from Patients with Alzheimer’s Disease. Cells 2020, 9, 1443. [Google Scholar] [CrossRef]
  38. Huang, W.; Shi, Y.; Han, B.; Wang, Q.; Zhang, B.; Qi, C.; Liu, F. LncRNA GAS5-AS1 inhibits glioma proliferation, migration, and invasion via miR-106b-5p/TUSC2 axis. Hum. Cell 2020, 33, 416–426. [Google Scholar] [CrossRef]
  39. Liu, F.; Gong, J.; Huang, W.; Wang, Z.; Wang, M.; Yang, J.; Wu, C.; Wu, Z.; Han, B. MicroRNA-106b-5p boosts glioma tumorigensis by targeting multiple tumor suppressor genes. Oncogene 2013, 33, 4813–4822. [Google Scholar] [CrossRef] [PubMed] [Green Version]
  40. Shi, Y.; Zhang, B.; Zhu, J.; Huang, W.; Han, B.; Wang, Q.; Qi, C.; Wang, M.; Liu, F. miR-106b-5p Inhibits IRF1/IFN-β Signaling to Promote M2 Macrophage Polarization of Glioblastoma. Onco. Targets. Ther. 2020, 13, 7479–7492. [Google Scholar] [CrossRef]
  41. Wu, H.; Li, X.; Zhang, T.; Zhang, G.; Chen, J.; Chen, L.; He, M.; Hao, B.; Wang, C. Overexpression miR-486-3p Promoted by Allicin Enhances Temozolomide Sensitivity in Glioblastoma Via Targeting MGMT. NeuroMolecular Med. 2020, 22, 359–369. [Google Scholar] [CrossRef] [Green Version]
  42. Song, L.; Lin, C.; Gong, H.; Wang, C.; Liu, L.; Wu, J.; Tao, S.; Hu, B.; Cheng, S.Y.; Li, M.; et al. miR-486 sustains NF-κB activity by disrupting multiple NF-κB-negative feedback loops. Cell Res. 2012, 23, 274–289. [Google Scholar] [CrossRef] [PubMed]
  43. You, Y.; Que, K.; Zhou, Y.; Zhang, Z.; Zhao, X.; Gong, J.; Liu, Z. MicroRNA-766-3p Inhibits Tumour Progression by Targeting Wnt3a in Hepatocellular Carcinoma. Mol. Cells 2018, 41, 830–841. [Google Scholar] [CrossRef] [PubMed]
  44. Gao, J.; Fei, L.; Wu, X.; Li, H. MiR-766-3p Suppresses Malignant Behaviors and Stimulates Apoptosis of Colon Cancer Cells via Targeting TGFBI. Can. J. Gastroenterol. Hepatol. 2022, 2022, 7234704. [Google Scholar] [CrossRef]
  45. Zhao, Q.; Yuan, X.; Zheng, L.; Xue, M. miR-30d-5p: A Non-Coding RNA With Potential Diagnostic, Prognostic and Therapeutic Applications. Front. Cell Dev. Biol. 2022, 10, 829435. [Google Scholar] [CrossRef]
  46. Zhang, J.; Zhang, J.; Zhang, J.; Qiu, W.; Xu, S.; Yu, Q.; Liu, C.; Wang, Y.; Lu, A.; Zhang, J.; et al. MicroRNA-625 inhibits the proliferation and increases the chemosensitivity of glioma by directly targeting AKT2. Am. J. Cancer Res. 2017, 7, 55–66. [Google Scholar]
  47. Cui, P.; Su, J.; Li, Q.; Xu, G.; Zhu, N. LncRNA RHPN1-AS1 Targeting miR-625/REG3A Promotes Cell Proliferation And Invasion Of Glioma Cells. Onco. Targets. Ther. 2019, 12, 7911–7921. [Google Scholar] [CrossRef] [PubMed] [Green Version]
  48. Hallal, S.; Khani, S.E.; Wei, H.; Lee, M.Y.T.; Sim, H.W.; Sy, J.; Shivalingam, B.; Buckland, M.E.; Alexander-Kaufman, K.L. Deep sequencing of small RNAs from neurosurgical extracellular vesicles substantiates miR-486-3p as a circulating biomarker that distinguishes glioblastoma from lower-grade astrocytoma patients. Int. J. Mol. Sci. 2020, 21, 4954. [Google Scholar] [CrossRef]
  49. Sticht, C.; De La Torre, C.; Parveen, A.; Gretz, N. miRWalk: An online resource for prediction of microRNA binding sites. PLoS ONE 2018, 13, e0206239. [Google Scholar] [CrossRef]
  50. Vlachos, I.S.; Zagganas, K.; Paraskevopoulou, M.D.; Georgakilas, G.; Karagkouni, D.; Vergoulis, T.; Dalamagas, T.; Hatzigeorgiou, A.G. DIANA-miRPath v3.0: Deciphering microRNA function with experimental support. Nucleic Acids Res. 2015, 43, W460. [Google Scholar] [CrossRef]
  51. Anaya, J. OncoLnc: Linking TCGA survival data to mRNAs, miRNAs, and lncRNAs. PeerJ Comput. Sci. 2016, 2016, e67. [Google Scholar] [CrossRef] [Green Version]
  52. Weller, M.; van den Bent, M.; Preusser, M.; Le Rhun, E.; Tonn, J.C.; Minniti, G.; Bendszus, M.; Balana, C.; Chinot, O.; Dirven, L.; et al. EANO guidelines on the diagnosis and treatment of diffuse gliomas of adulthood. Nat. Rev. Clin. Oncol. 2020, 17, 170–186. [Google Scholar] [CrossRef] [PubMed]
  53. Munteanu, R.M.; Eva, L.; Dobrovăţ, B.I.; Iordache, A.C.; Pendefunda, L.; Dumitrescu, N.; Mihăilă, D.; Gavrilescu, C.M.; Şapte, E.; Poeată, I. Longer survival of a patient with glioblastoma resected with 5-aminolevulinic acid (5-ALA)-guided surgery and foreign body reaction to polyglycolic acid (PGA) suture. Rom. J. Morphol. Embryol. 2017, 58, 671–680. [Google Scholar] [PubMed]
  54. Comariţa, I.K.; Vîlcu, A.; Constantin, A.; Procopciuc, A.; Safciuc, F.; Alexandru, N.; Dragan, E.; Nemecz, M.; Filippi, A.; Chiţoiu, L.; et al. Therapeutic Potential of Stem Cell-Derived Extracellular Vesicles on Atherosclerosis-Induced Vascular Dysfunction and Its Key Molecular Players. Front. Cell Dev. Biol. 2022, 10, 817180. [Google Scholar] [CrossRef] [PubMed]
  55. Sanda, G.M.; Deleanu, M.; Toma, L.; Stancu, C.S.; Simionescu, M.; Sima, A.V. Oxidized LDL-Exposed Human Macrophages Display Increased MMP-9 Expression and Secretion Mediated by Endoplasmic Reticulum Stress. J. Cell. Biochem. 2017, 118, 661–669. [Google Scholar] [CrossRef] [PubMed]
  56. Schmittgen, T.D.; Livak, K.J. Analyzing real-time PCR data by the comparative CT method. Nat. Protoc. 2008, 3, 1101–1108. [Google Scholar] [CrossRef]
  57. Niculescu, L.S.; Simionescu, N.; Sanda, G.M.; Carnuta, M.G.; Stancu, C.S.; Popescu, A.C.; Popescu, M.R.; Vlad, A.; Dimulescu, D.R.; Simionescu, M.; et al. MiR-486 and miR-92a identified in circulating HDL discriminate between stable and vulnerable coronary artery disease patients. BMJ Open 2015, 5, 1–13. [Google Scholar] [CrossRef] [PubMed]
Figure 1. Circulating MV analysis and characterization by flow cytometry: (a) plasma Annexin-V-positive MV concentrations for the three groups of investigated subjects; (b) representative dot-plots showing the MV quantification strategy based on calibration beads 10 μm in size and 1000/µL in concentration (upper row), and purity of the isolated MV fraction based on the percentages of MVs positive for Annexin V (lower row). Data are represented as means ± standard error of the mean. ** p < 0.01 (One-Way ANOVA with Tukey’s multiple comparisons test).
Ijms 23 08398 g001
Figure 2. Flow cytometric analysis of GB-specific MV surface markers: (a) EGFR; (b) EGFRvIII; (c) EpCAM. Data are represented as means ± standard error of the mean.
Ijms 23 08398 g002
Figure 3. (a) Venn diagram of miRNAs identified in the 3 groups of subjects using TaqMan OpenArray; (b) scatter-plot of RQ values (fold change vs. Pre-op) for miRNAs identified in the 3 groups using TaqMan OpenArray.
Ijms 23 08398 g003
Figure 4. MiRNAs selected for further analysis after OpenArray profiling of MVs.
Ijms 23 08398 g004
Figure 5. Relative expression (2−ΔCq) of selected miRNAs in MVs from the plasma of GB patients and Control subjects: (a) miR-106b-5p; (b) miR-486-3p; (c) miR-766-3p; (d) miR-30d-5p; (e) miR-625-5p. Data are represented as means ± standard error of the mean. * p < 0.05, ** p < 0.01 (One-Way ANOVA with Tukey’s multiple comparisons test), # p < 0.05 (paired t-test Pre-op vs. Post-op).
Ijms 23 08398 g005
Figure 6. Relative expression (2−ΔCq × 103) of selected miRNAs in plasma from GB patients and Control subjects: (a) miR-106b-5p; (b) miR-486-3p; (c) miR-766-3p; (d) miR-30d-5p. Data are represented as means ± standard error of the mean. * p < 0.05, ** p < 0.01 (One-Way ANOVA with Tukey’s multiple comparisons test), ## p < 0.01 (paired t-test Pre-op vs. Post-op).
Ijms 23 08398 g006
Figure 7. Overlapping of selected miRNA target genes.
Ijms 23 08398 g007
Figure 8. Heatmaps of significant pathways predicted by DIANA-miRPath for: (a) miR-106b-5p, miR-486-3p and miR-766-3p; (b) miR-30d-5p and miR-625-5p.
Ijms 23 08398 g008
Figure 9. Kaplan–Meier curves and log-rank p-values for: (a) miR-106b-5p; (b) miR-766-3p; (c) miR-30d-5p; (d) miR-625-5p.
Ijms 23 08398 g009
Table 1. Upregulated (fold change > 2) and downregulated (fold change < 0.5) miRNAs in Control and Post-op groups compared to Pre-op group.
ControlPost-op
miRNAFold ChangemiRNAFold Change
hsa-let-7f-1-3p0.389hsa-let-7b-5p2.205
hsa-miR-15b-3p0.460hsa-miR-10b-5p3.211
hsa-miR-22-5p0.489hsa-miR-30b-5p2.651
hsa-miR-130a-3p0.445hsa-miR-96-5p2.547
hsa-miR-139-5p0.456hsa-miR-99a-5p2.796
hsa-miR-143-3p0.447hsa-miR-106a-5p2.175
hsa-miR-199a-3p0.408hsa-miR-106b-5p2.278
hsa-miR-221-3p0.476hsa-miR-122-5p2.698
hsa-miR-374a-5p0.472hsa-miR-125a-5p2.584
hsa-miR-423-3p0.269hsa-miR-142-3p2.032
hsa-miR-150-5p2.586
hsa-miR-151a-5p2.104
hsa-miR-192-5p2.161
hsa-miR-324-5p2.816
hsa-miR-340-5p2.289
hsa-miR-342-3p2.253
hsa-miR-345-5p2.650
hsa-miR-425-3p2.532
hsa-miR-450a-5p4.384
hsa-miR-486-3p2.401hsa-miR-486-3p3.161
hsa-miR-766-3p3.511
hsa-miR-1260a2.365
Table 2. Cox regression results for selected miRNAs in GB patients.
miRNACox Coefficientp-ValueFDR CorrectedRankMedian ExpressionMean Expression
miR-106b-5p-0.0370.6000.96232510.8510.81
miR-766-3p0.0810.3400.9191926.556.7
miR-30d-5p0.0510.5500.96229610.210.24
miR-625-5p0.3330.0350.659276.636.66
Publisher’s Note: MDPI stays neutral with regard to jurisdictional claims in published maps and institutional affiliations.

