
Antitumor Effects of Ral-GTPases Downregulation in Glioblastoma

 ,
,  , , , , , and
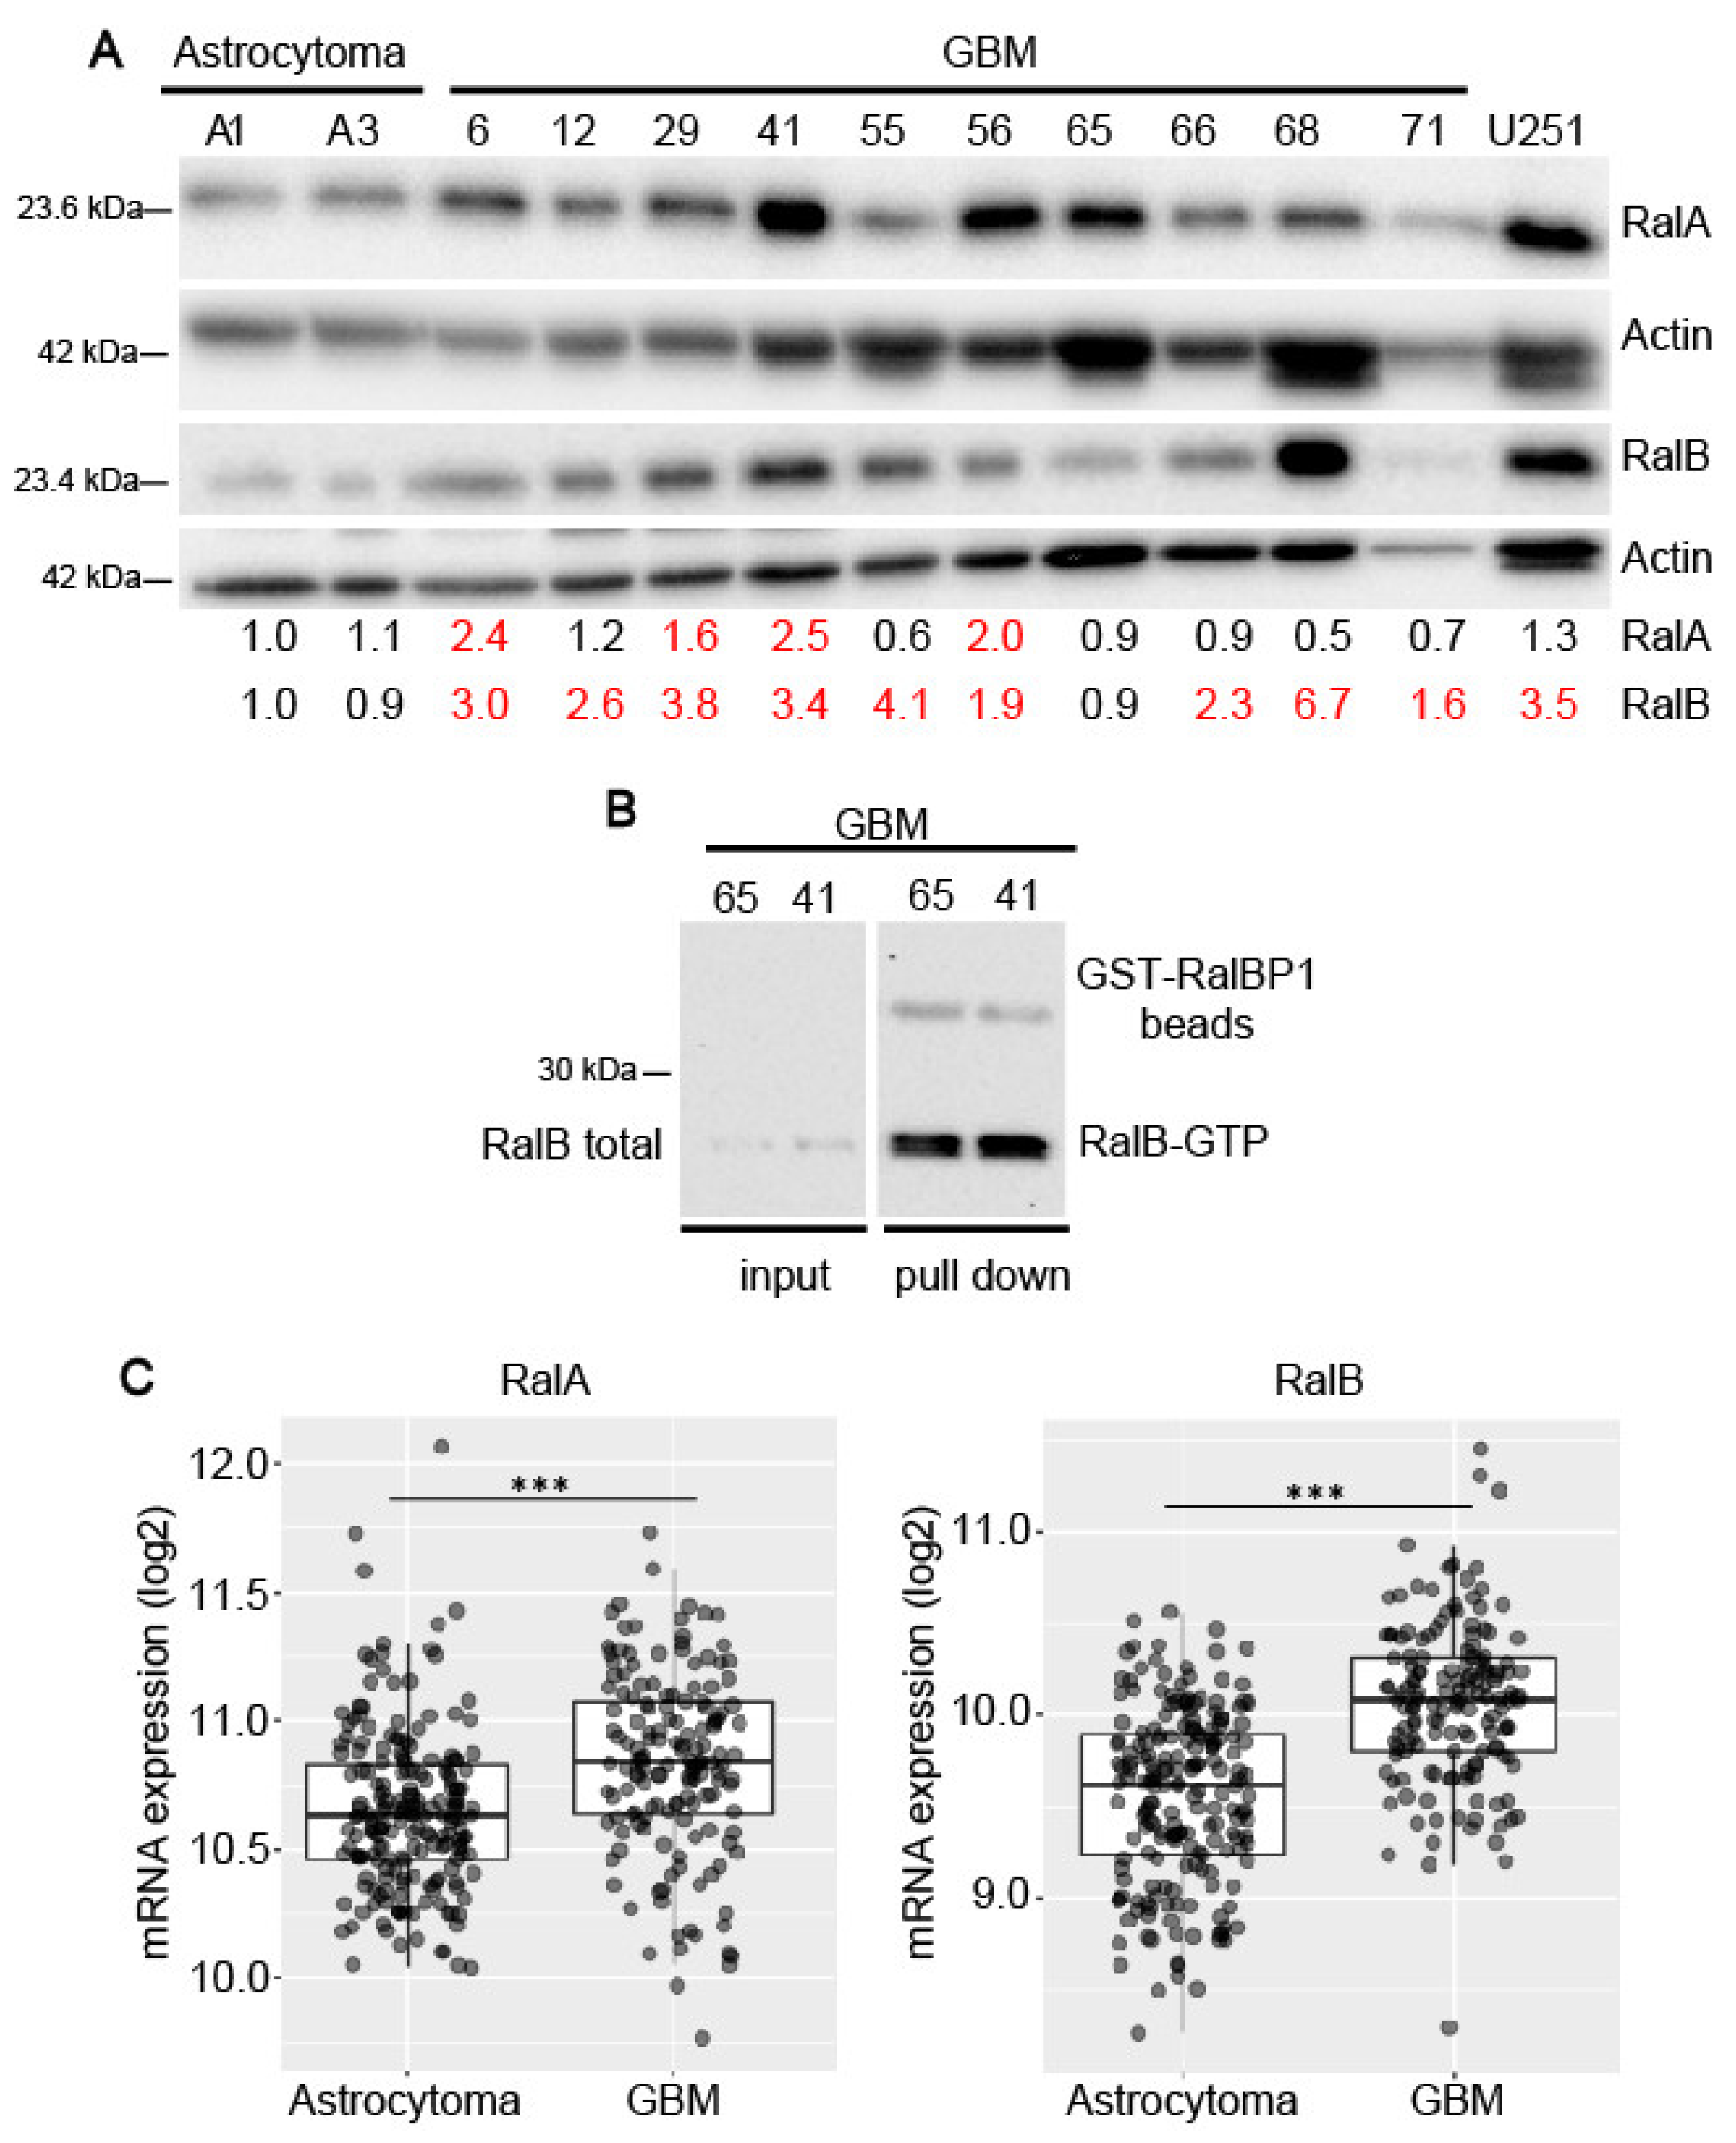
Abstract
:1. Introduction
2. Results
2.1. Expression of Ral-GTPases in Primary Human Glioblastoma Cells
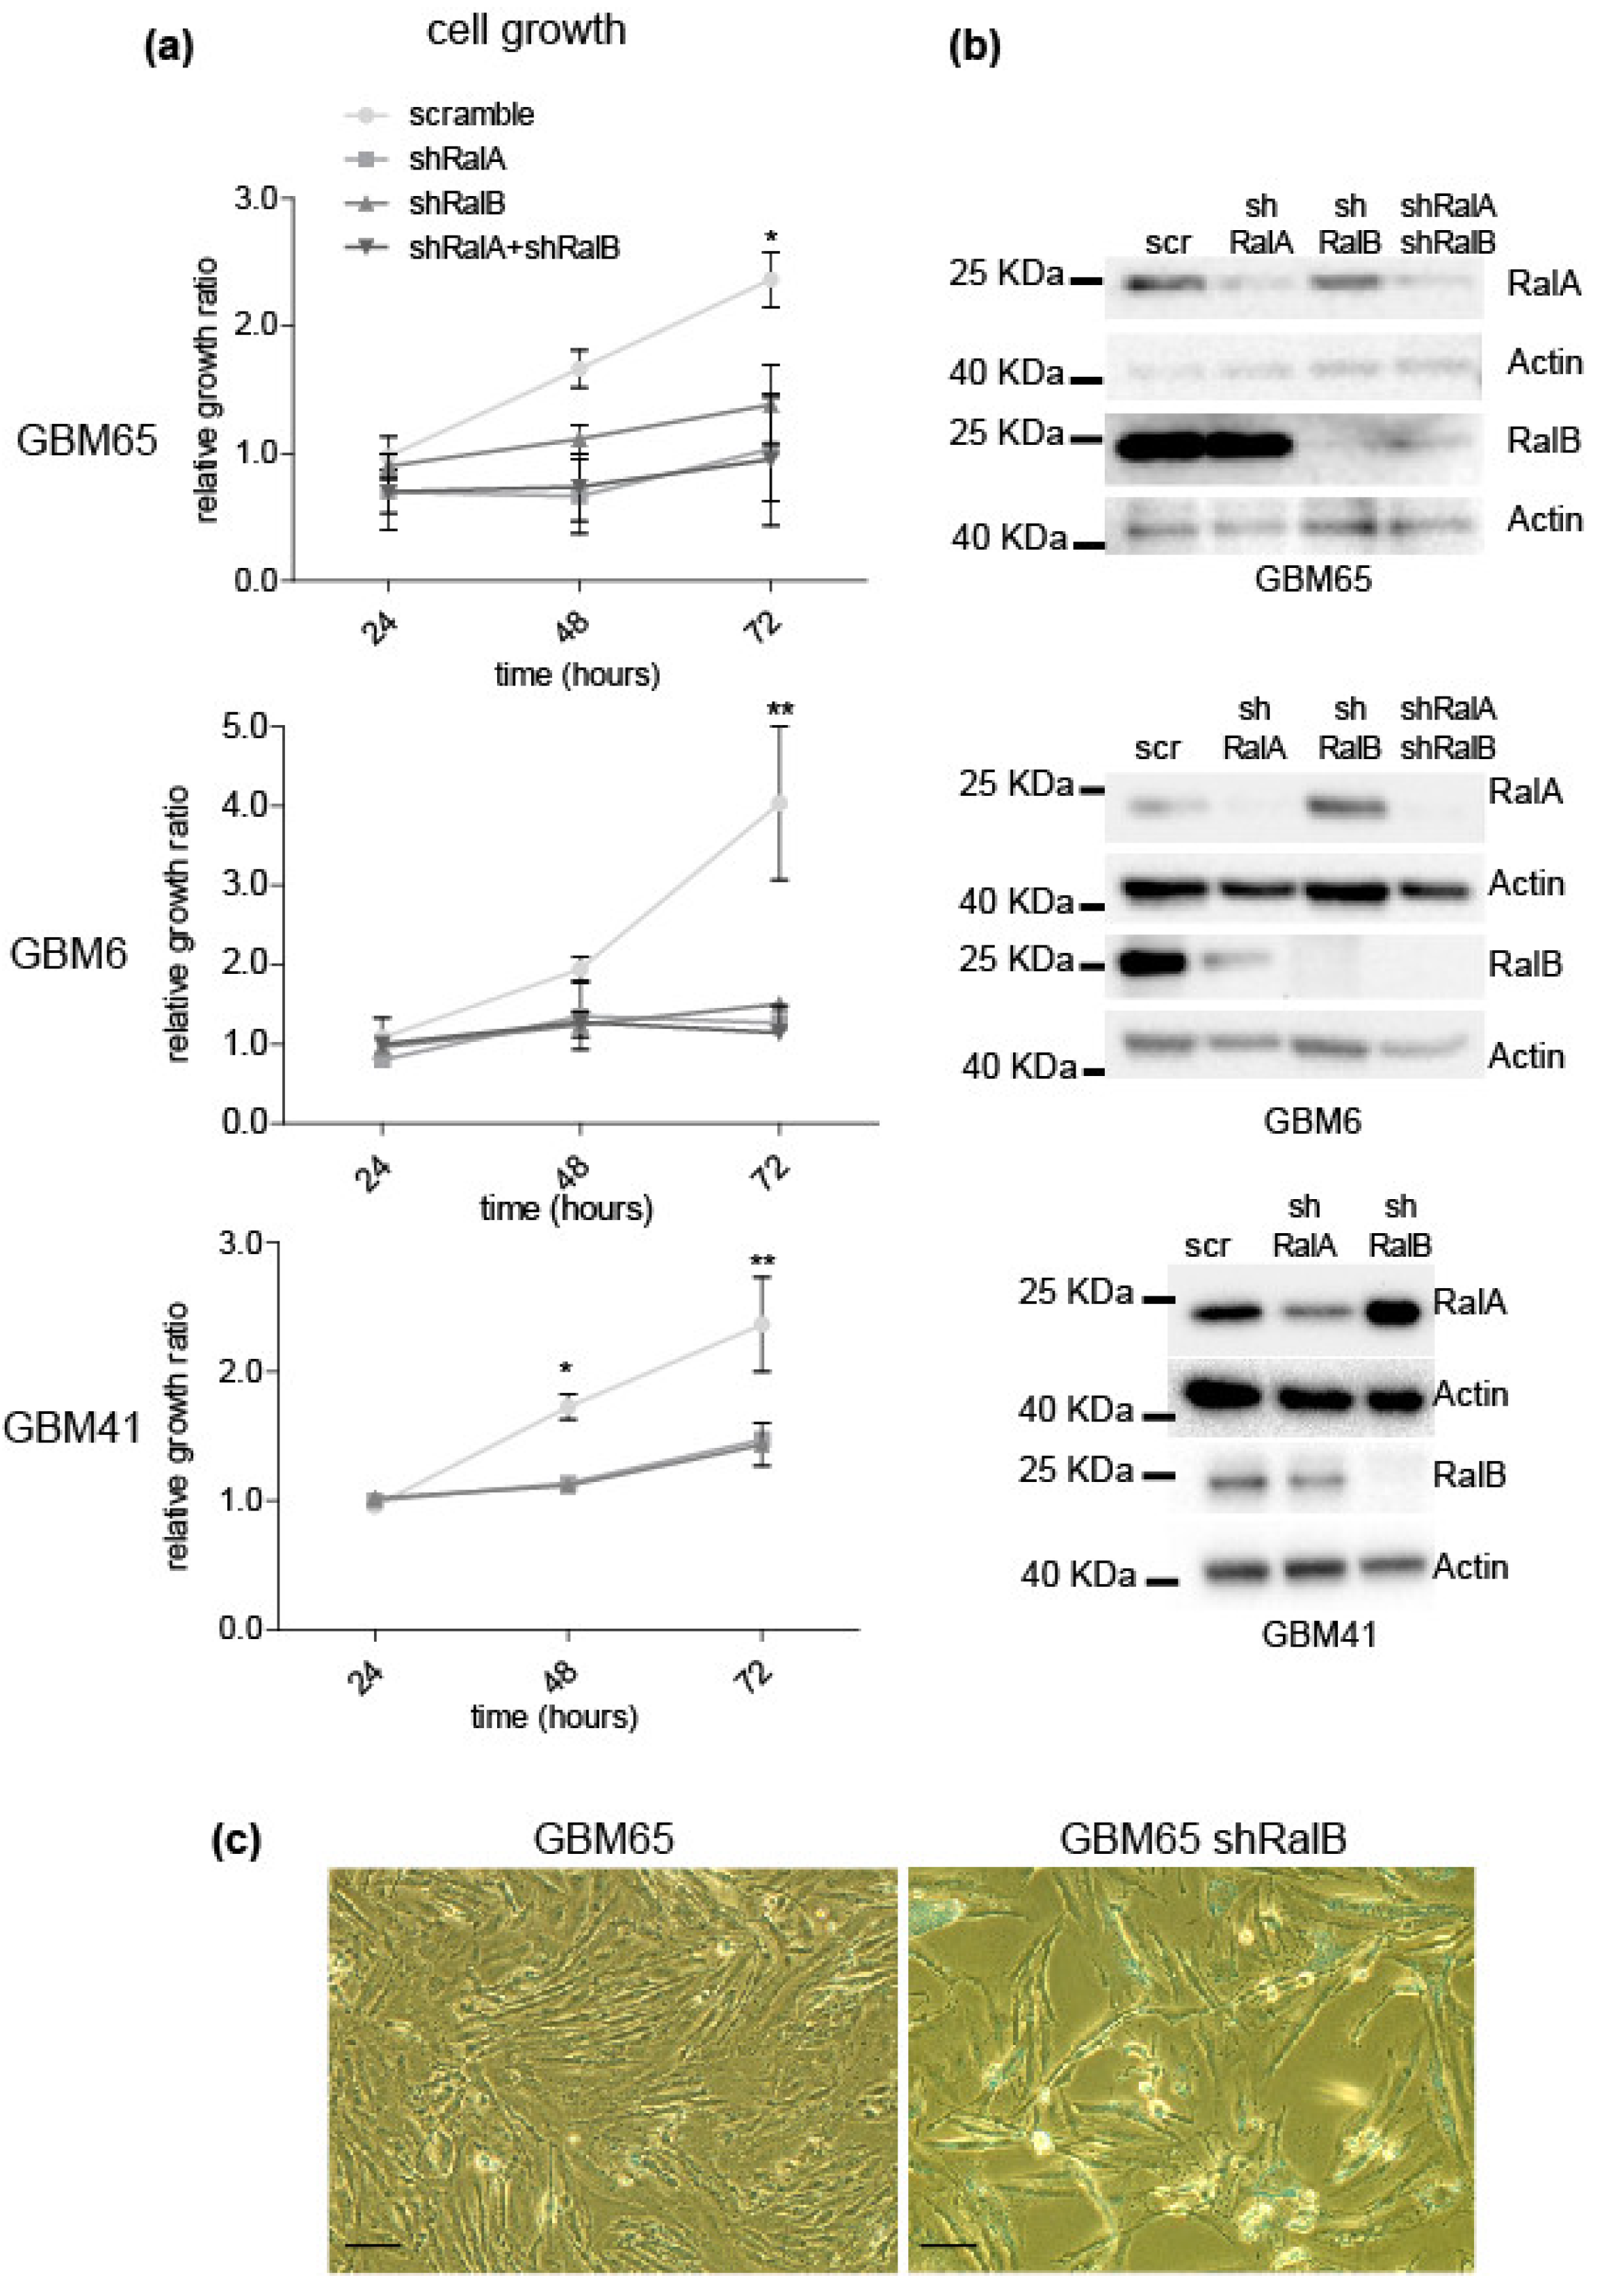
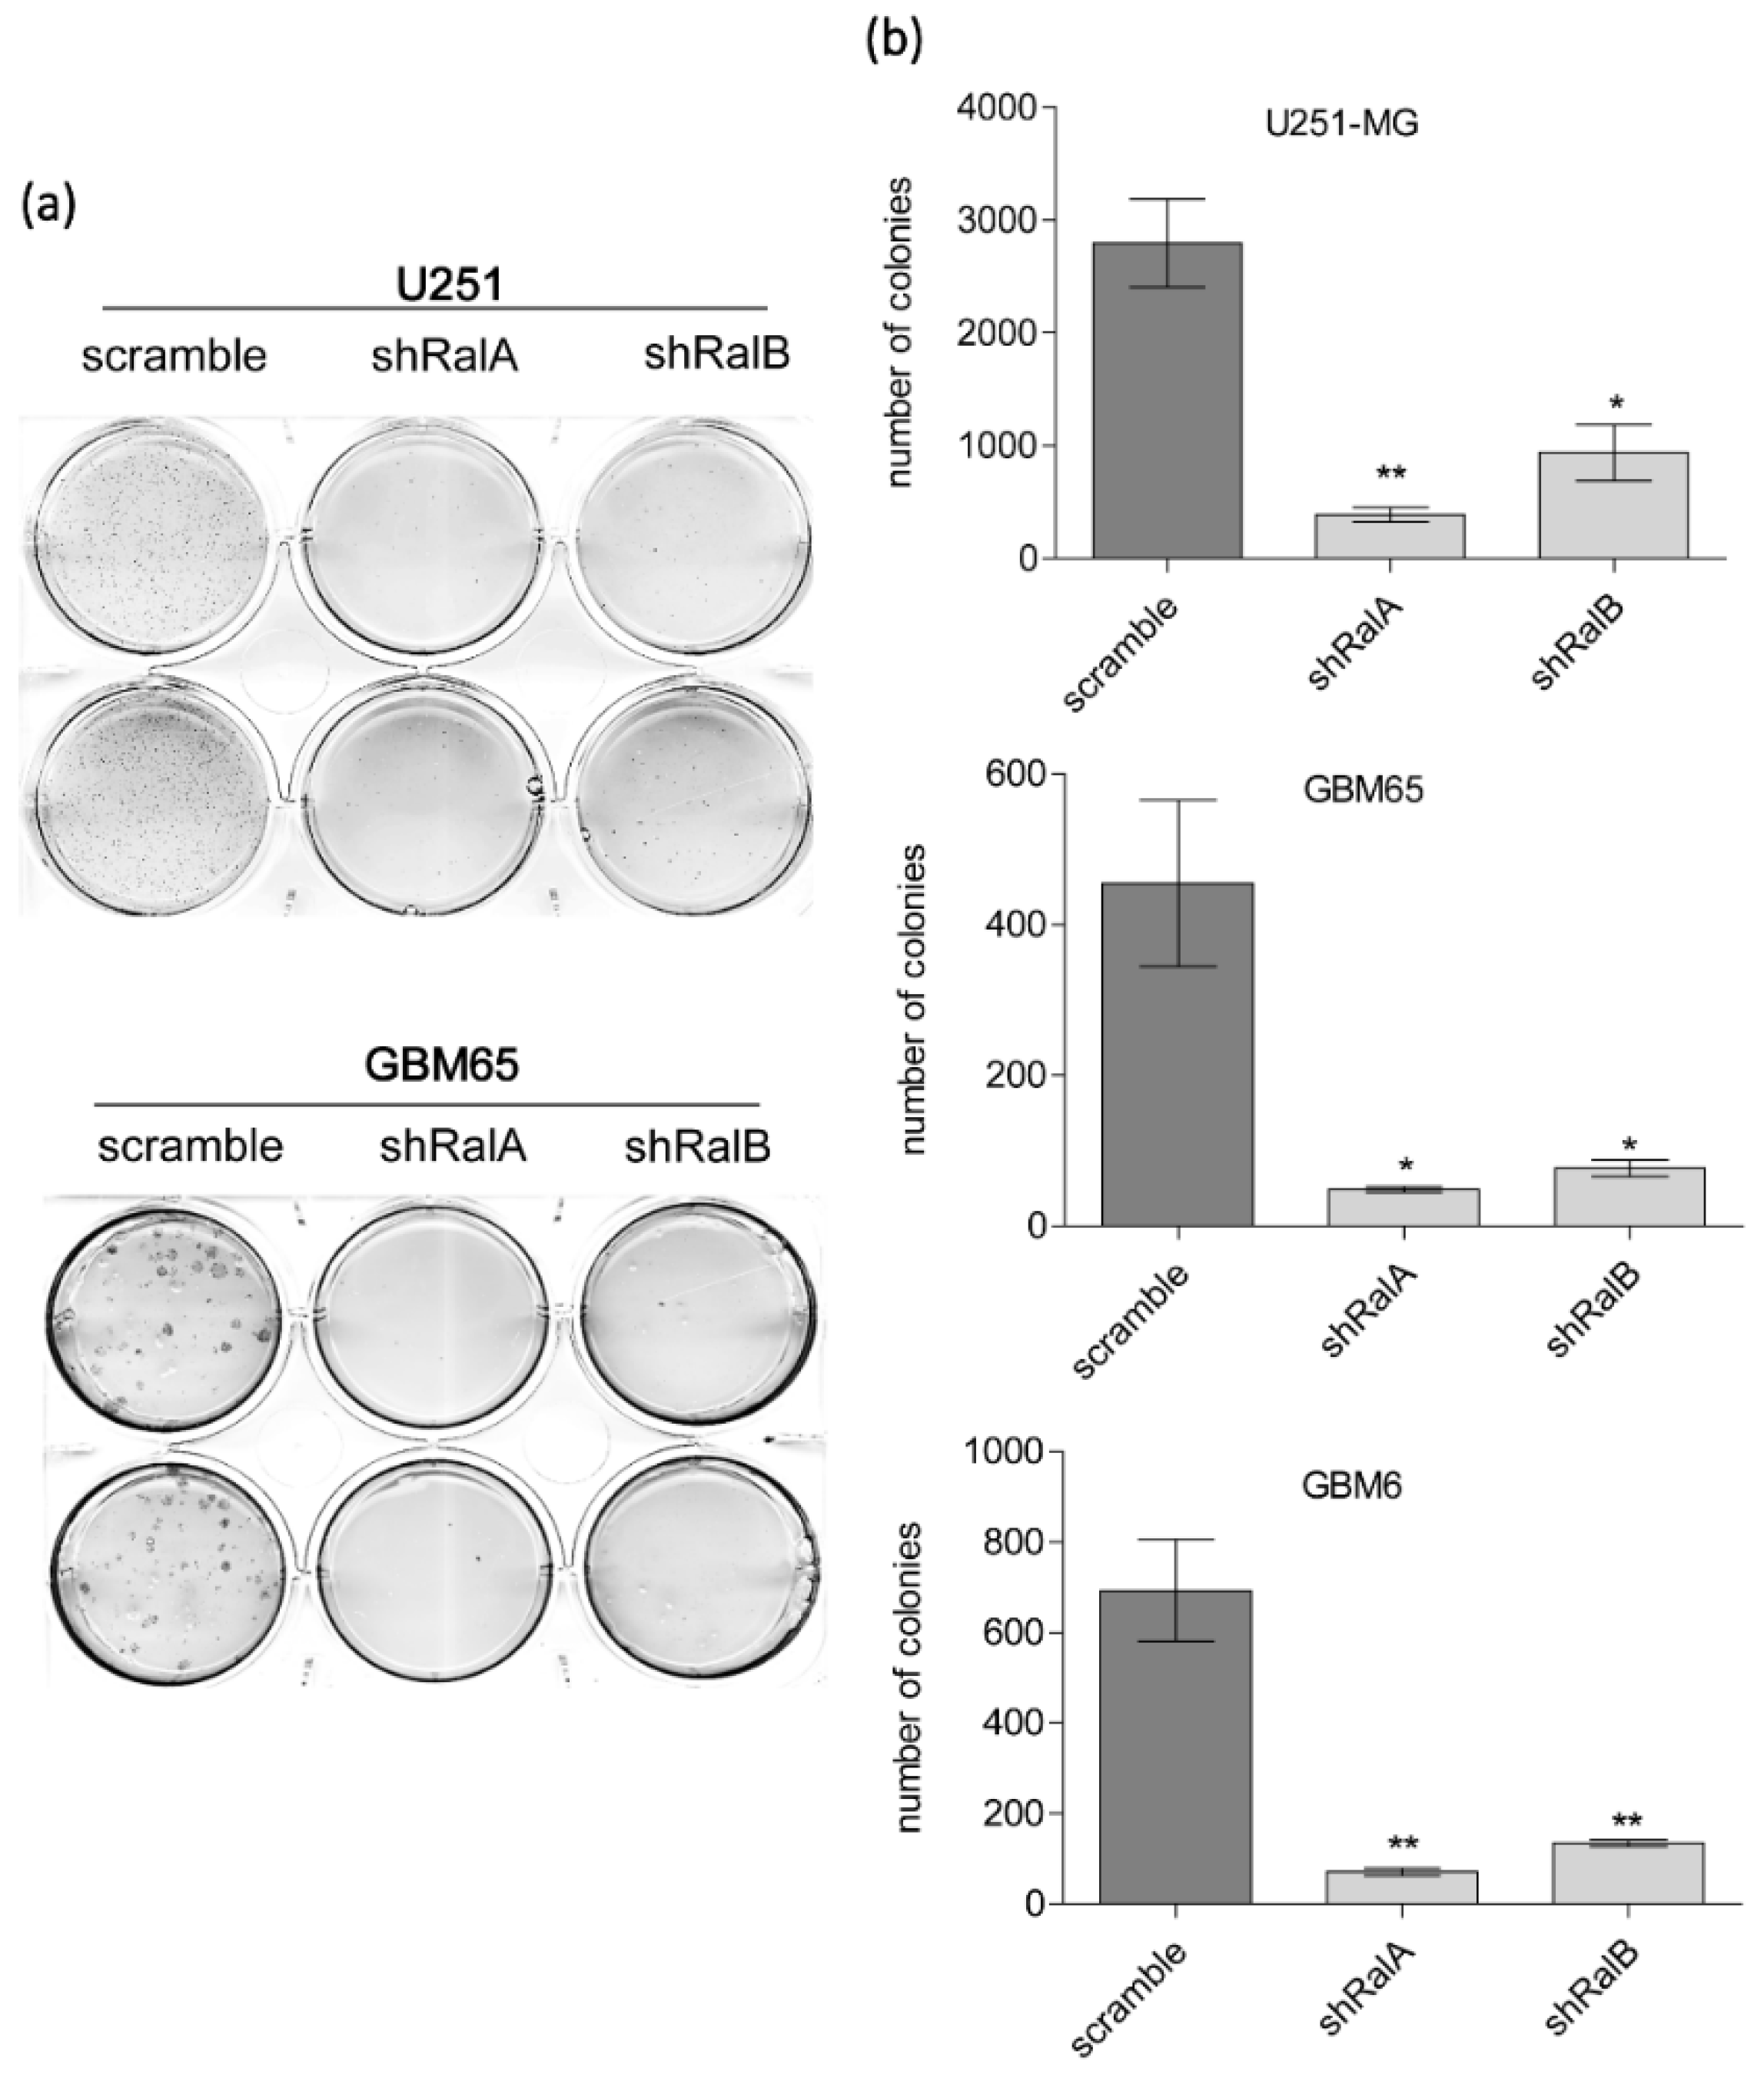
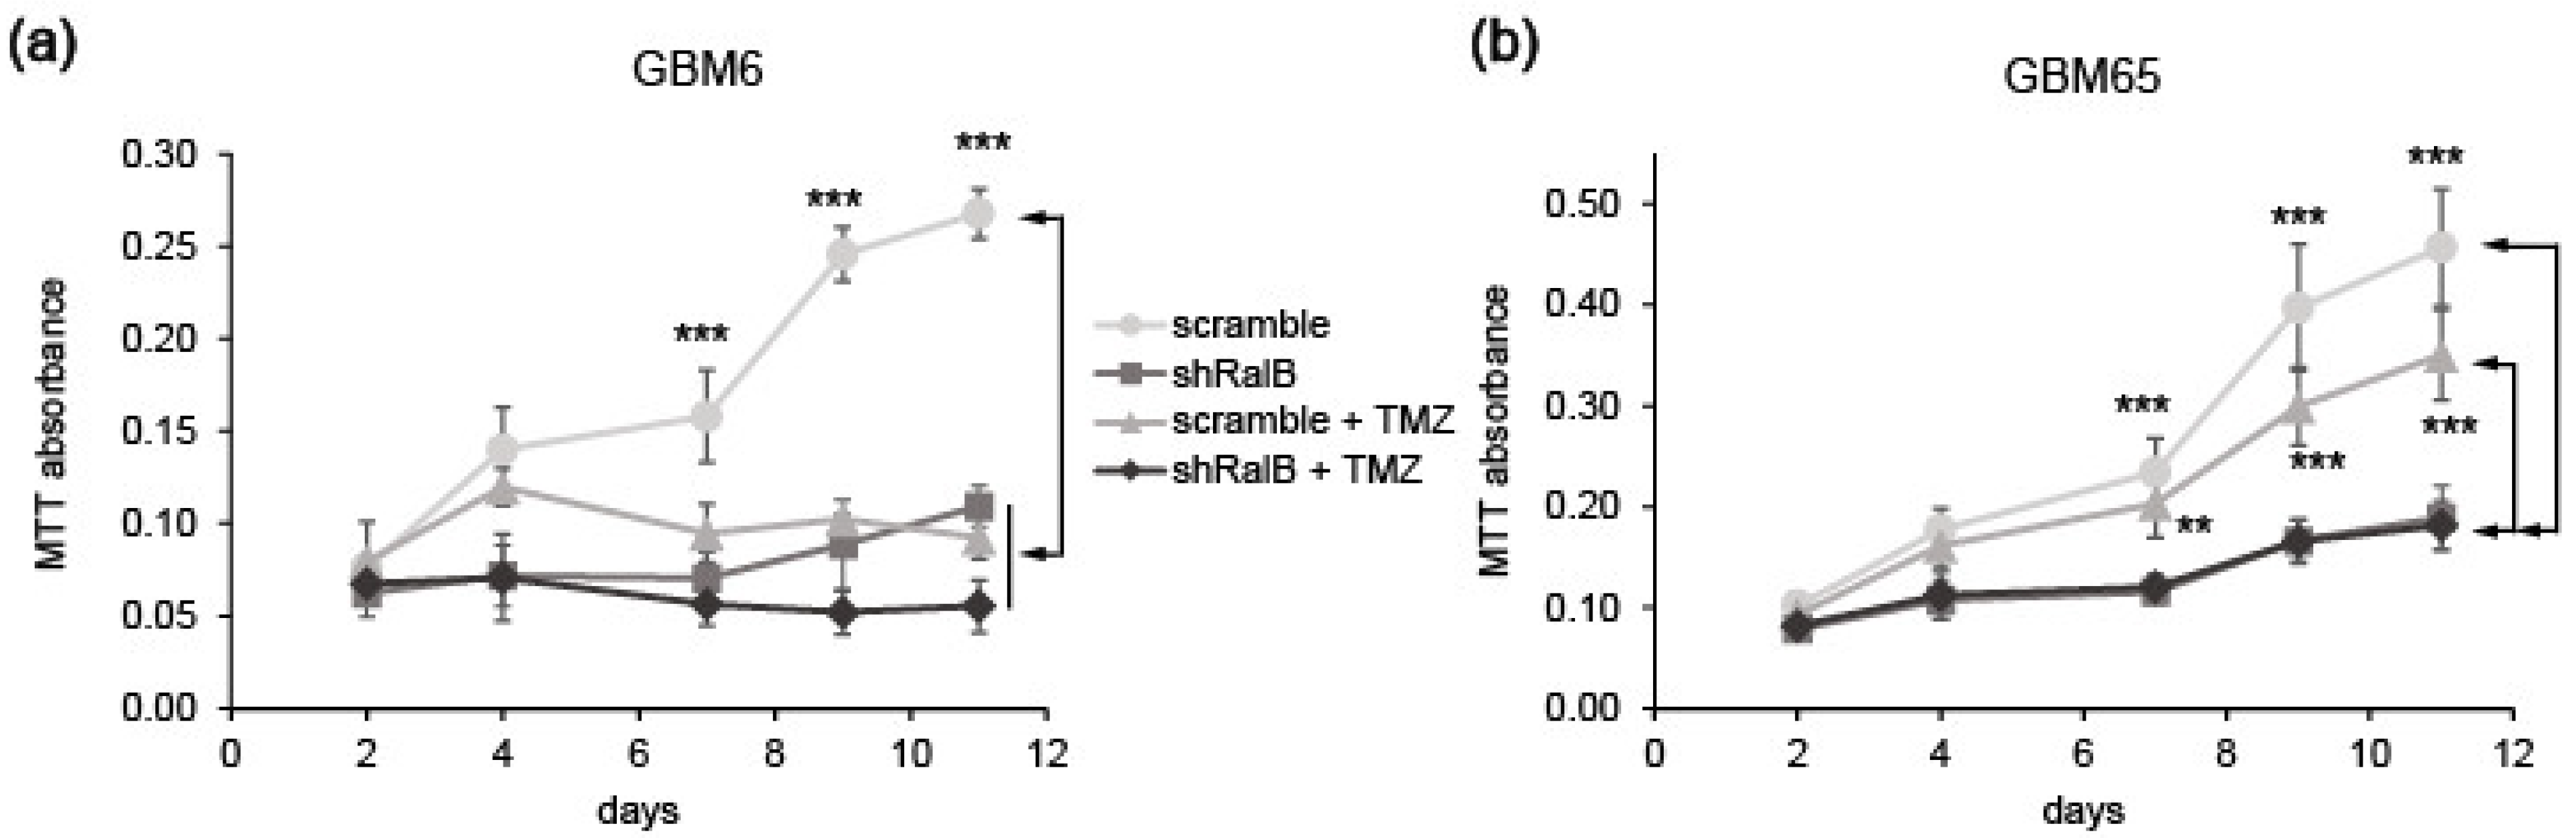
2.2. Relevance of Ral-GTPases in Glioblastoma Growth
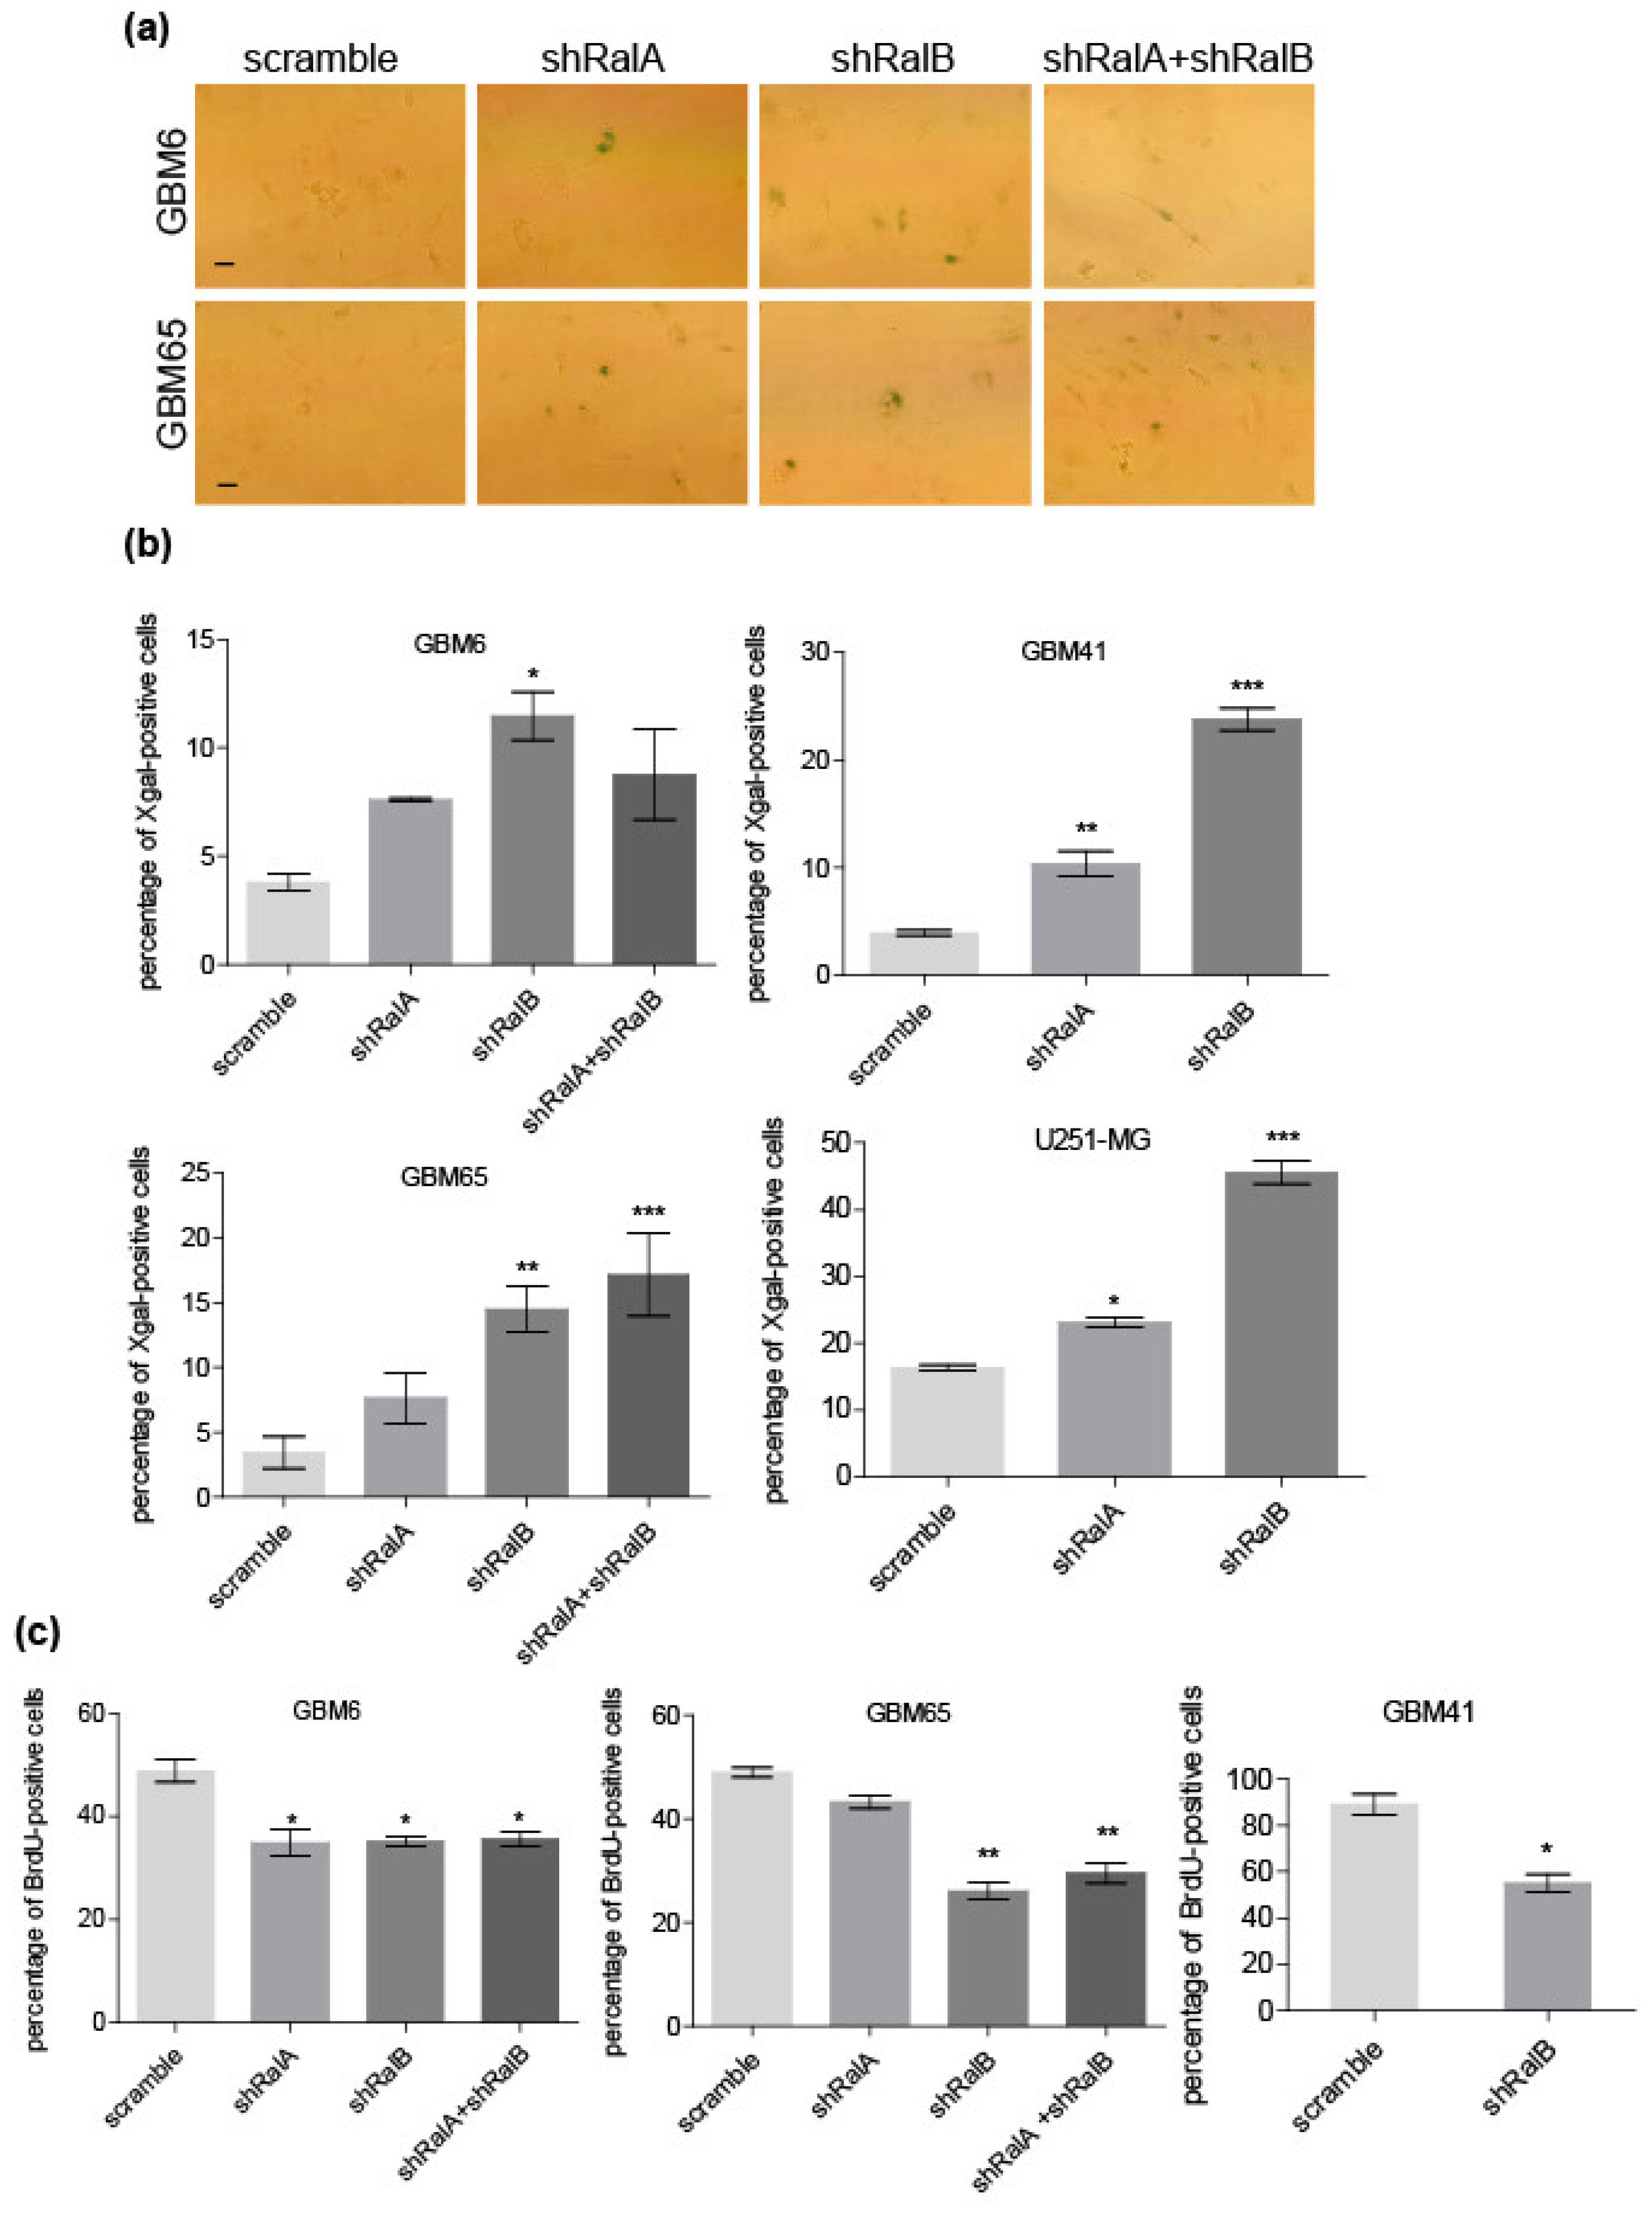
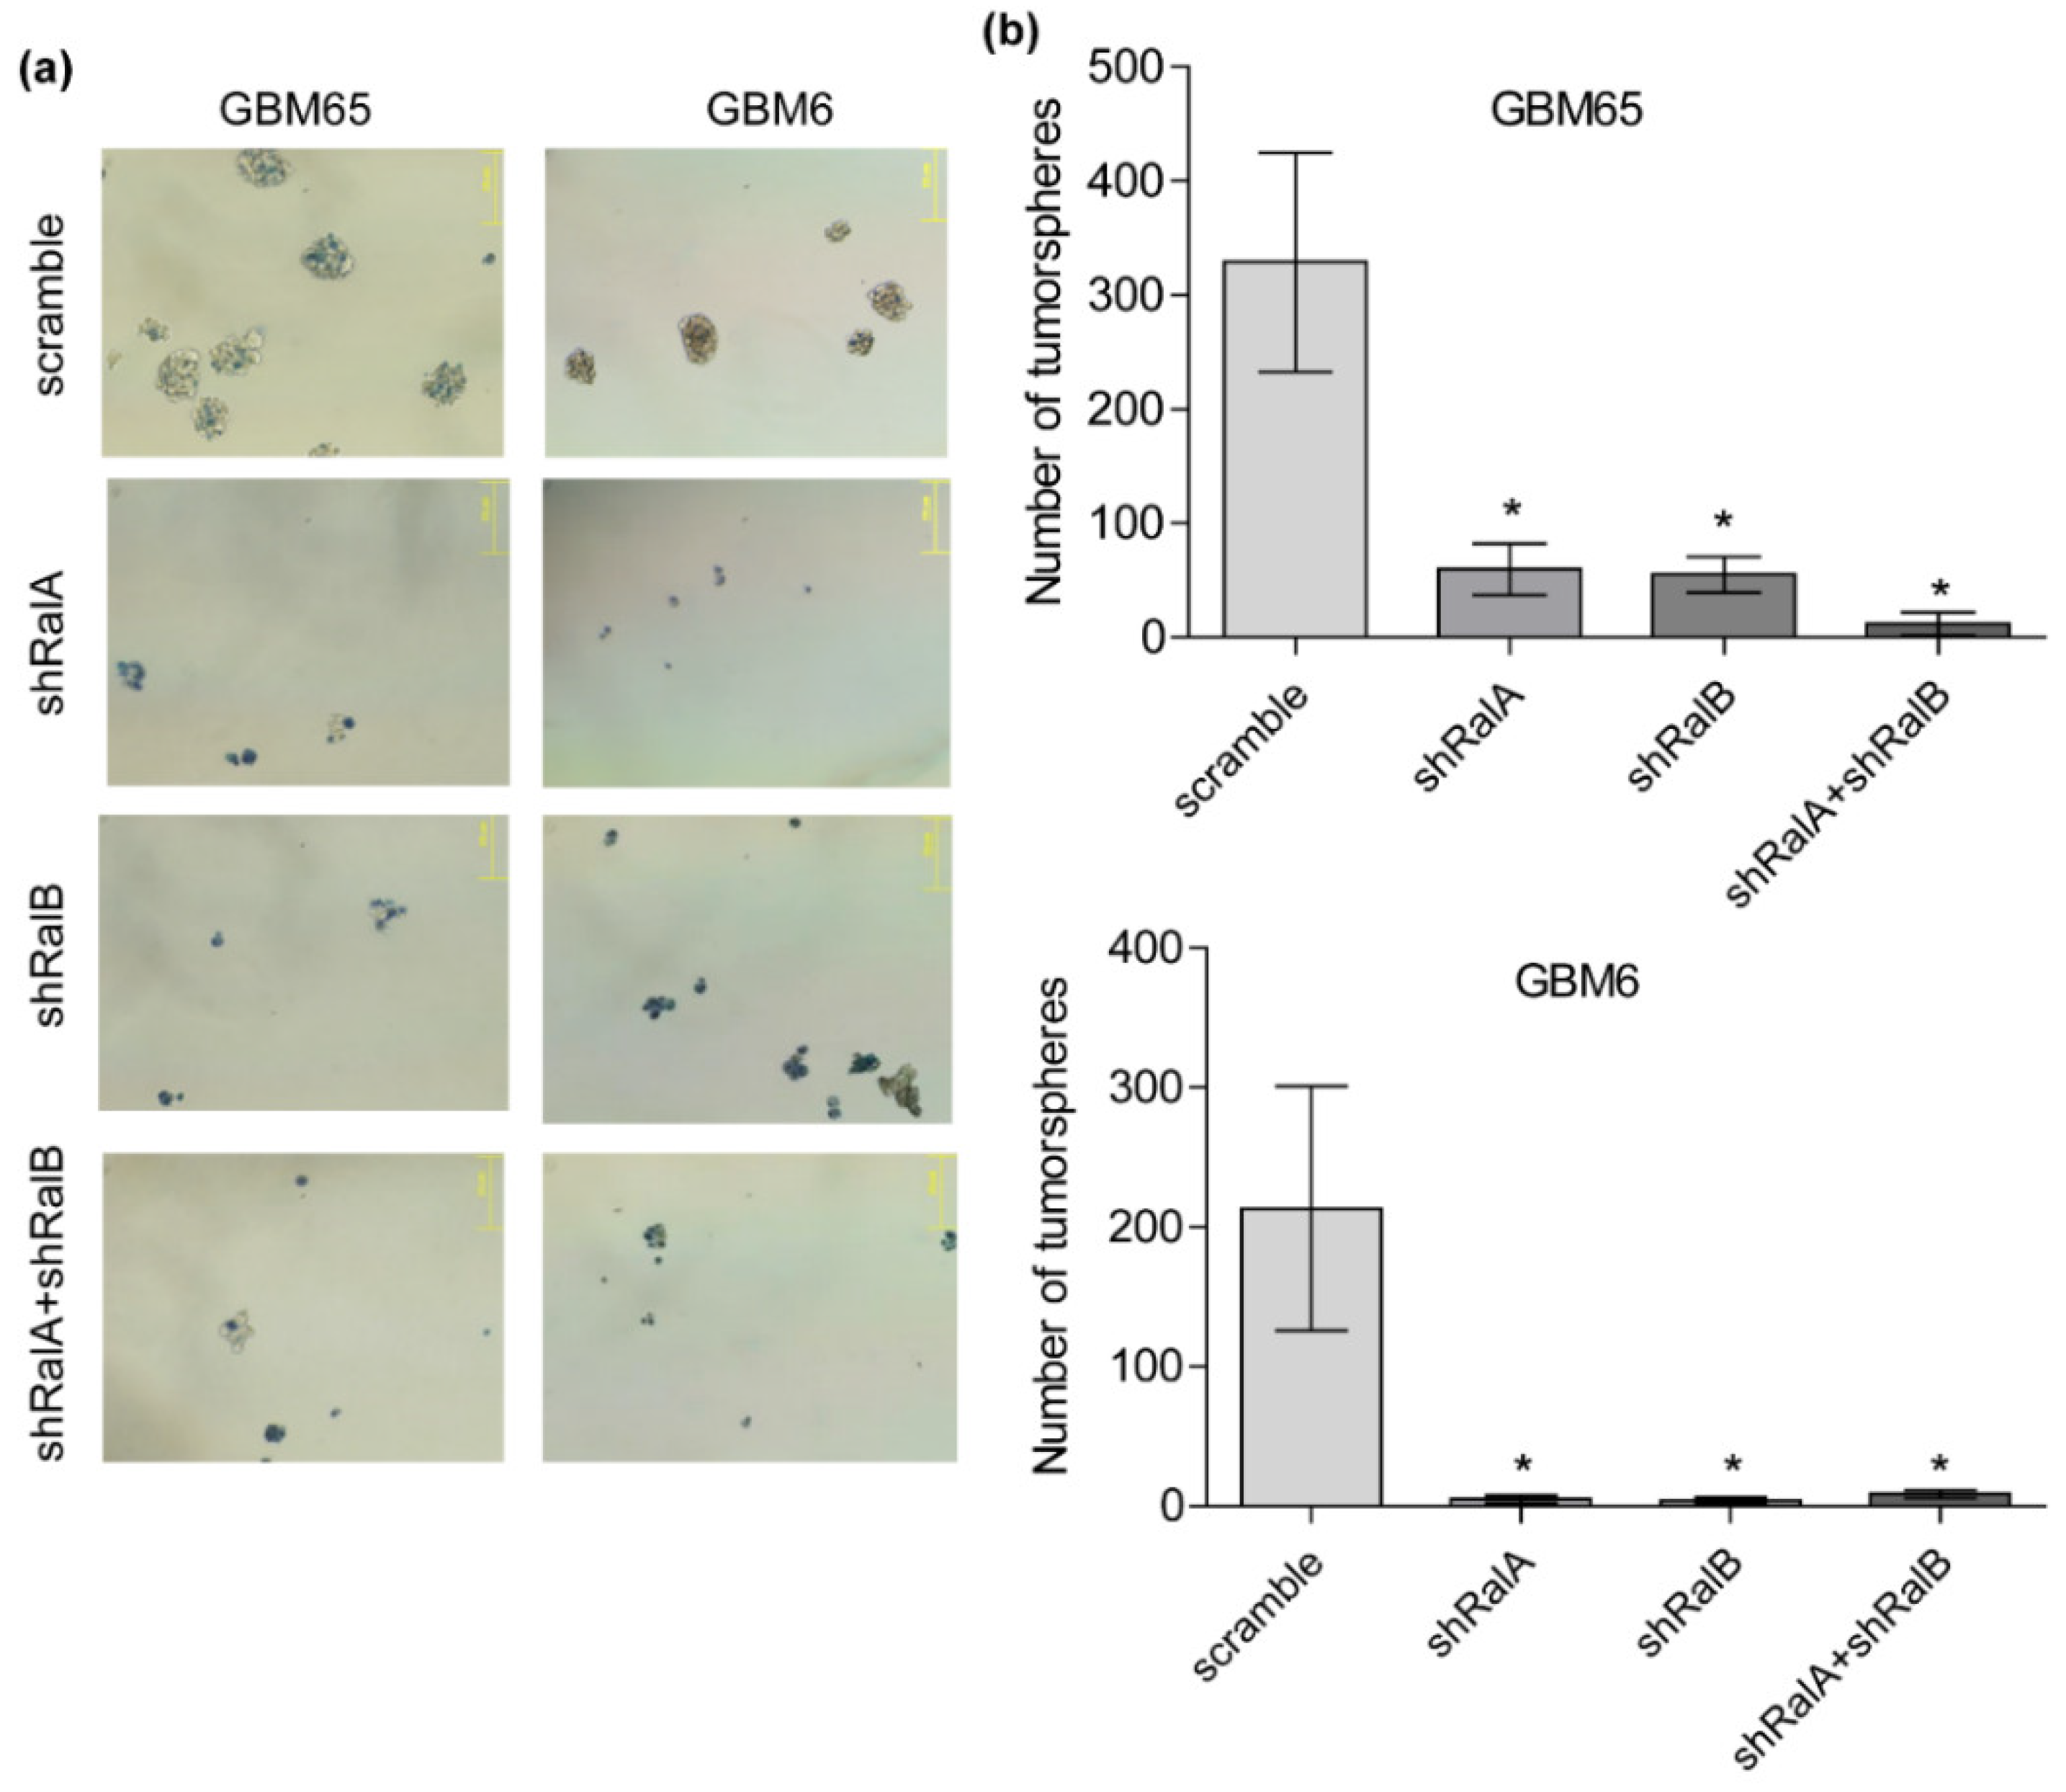
2.3. Ral Downregulation Promotes a Senescence-like State in Primary Glioblastoma Cells
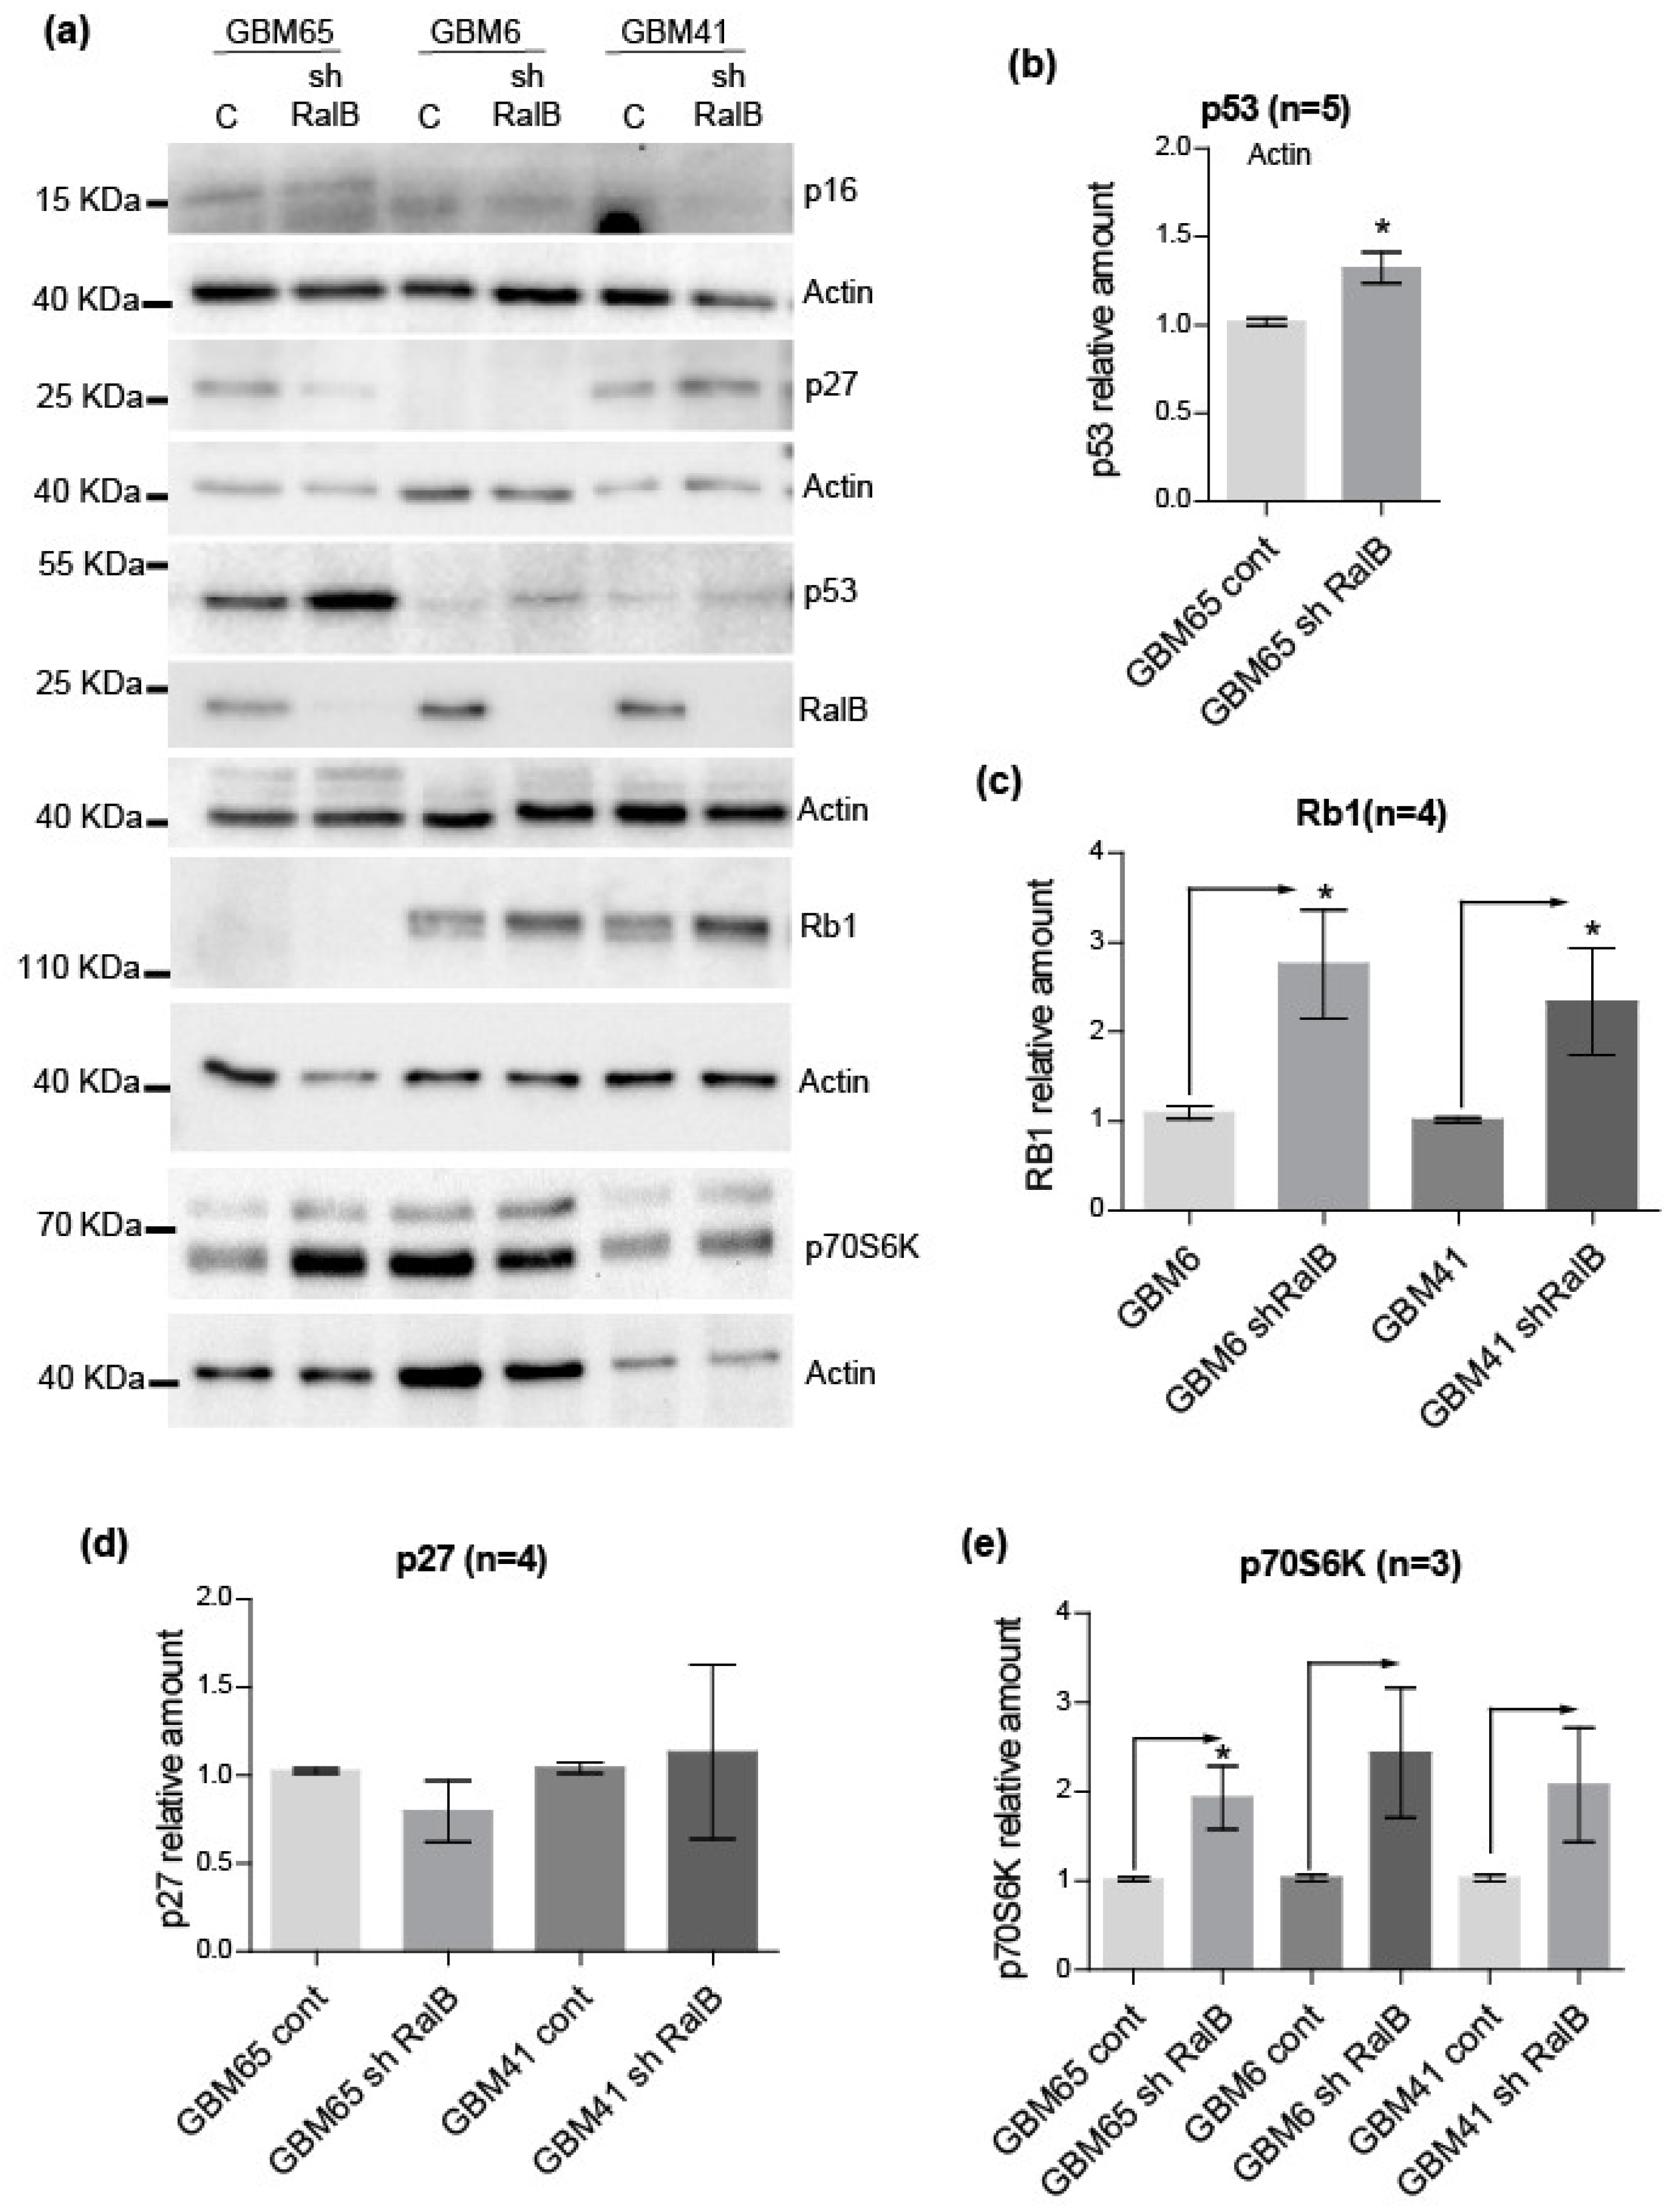
2.4. RalB-Knockdown Induces a Senescent-like Response in Primary Glioblastoma Cells through Non-Canonical Mechanisms
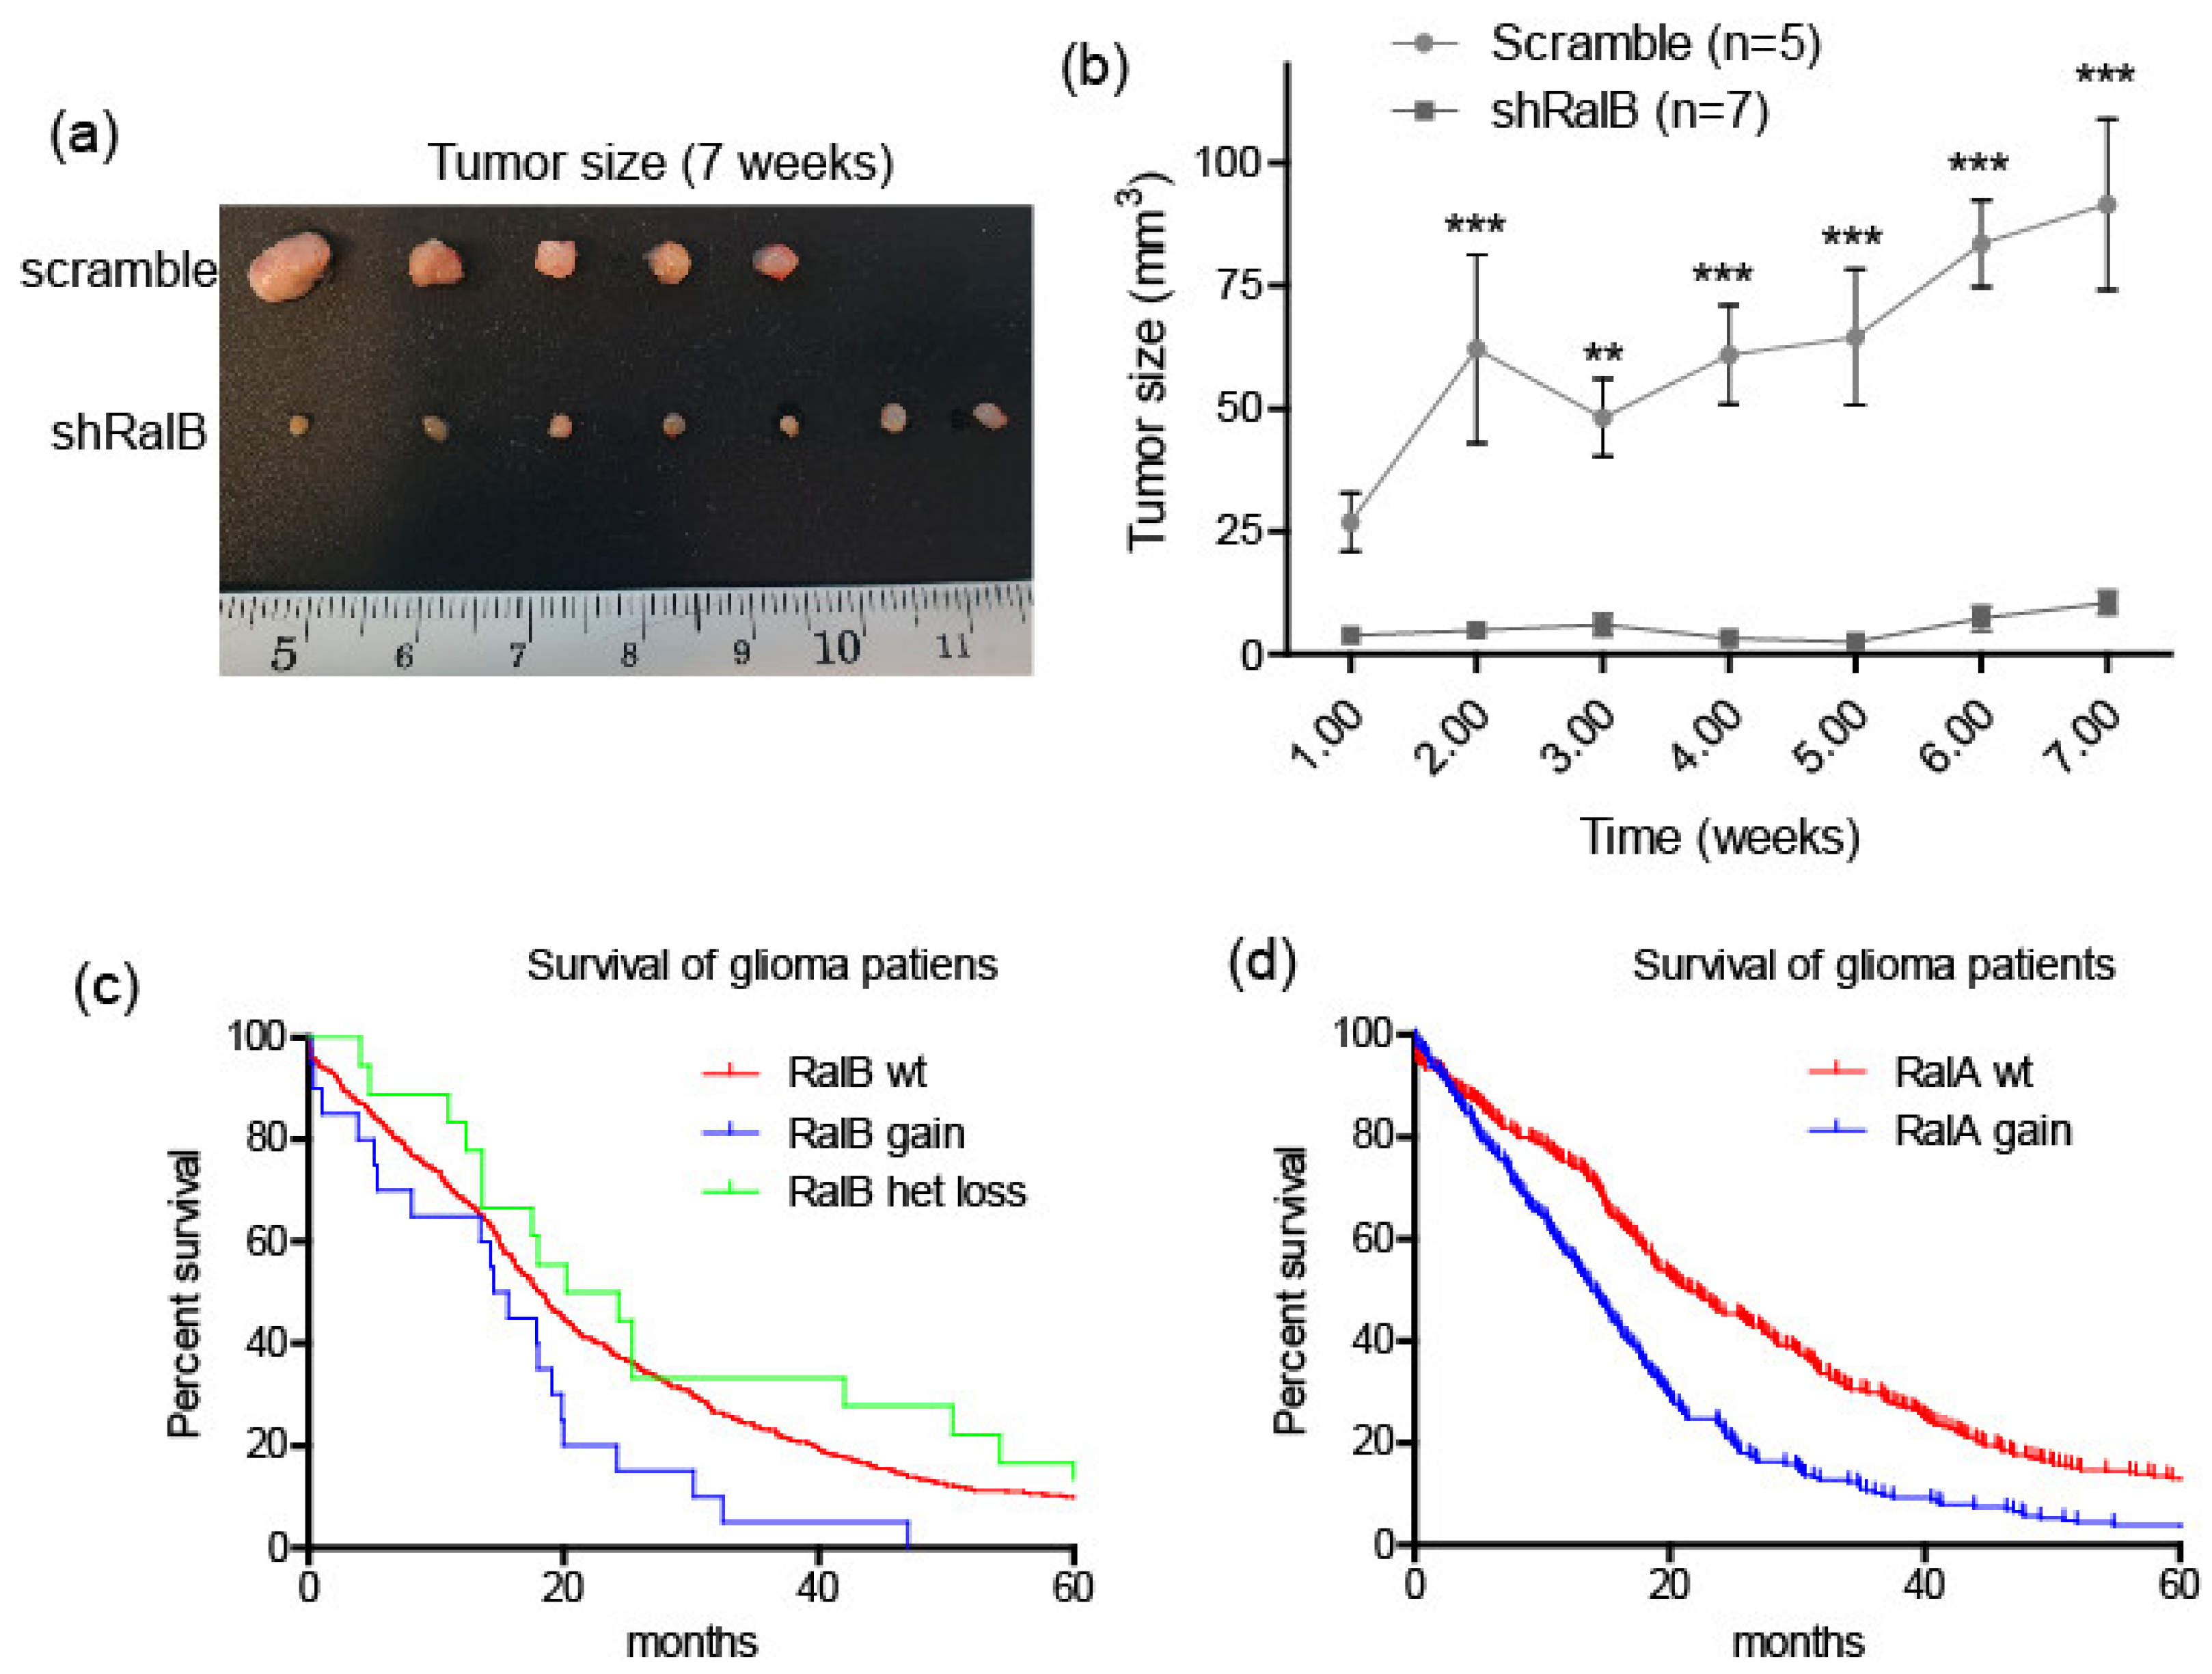
2.5. Ral-GTPases as Therapeutic Targets to Treat Glioblastoma
3. Discussion
4. Materials and Methods
4.1. Cell Culture and Expression Vectors
4.2. Analysis of Expression by Immunoblotting
4.3. Ral Pull-Down Assay
4.4. Proliferation and Viability Assays
4.5. Clonogenic Assays
4.6. Senescence-Associated β-Galactosidase Assay
4.7. BrdU Incorporation
4.8. Immunofluorescence, Immunochemsitry and DNA Content Analysis
4.9. Tumorsphere Formation and Analysis
4.10. TCGA Data Analyses
4.11. Mouse Models
5. Conclusions
Supplementary Materials
Author Contributions
Funding
Institutional Review Board Statement
Informed Consent Statement
Data Availability Statement
Acknowledgments
Conflicts of Interest
References
- Zhu, Y.; Parada, L.F. The Molecular and Genetic Basis of Neurological Tumours. Nat. Rev. Cancer 2002, 2, 616–626. [Google Scholar] [CrossRef] [PubMed]
- Weller, M.; Wick, W.; Aldape, K.; Brada, M.; Berger, M.; Pfister, S.M.; Nishikawa, R.; Rosenthal, M.; Wen, P.Y.; Stupp, R.; et al. Glioma. Nat. Rev. Dis. Primer. 2015, 1, 1–18. [Google Scholar] [CrossRef]
- Zong, H.; Verhaak, R.G.W.; Canolk, P. The Cellular Origin for Malignant Glioma and Prospects for Clinical Advancements. Expert Rev. Mol. Diagn. 2012, 12, 383–394. [Google Scholar] [CrossRef]
- Verhaak, R.G.W.; Hoadley, K.A.; Purdom, E.; Wang, V.; Qi, Y.; Wilkerson, M.D.; Miller, C.R.; Ding, L.; Golub, T.; Mesirov, J.P.; et al. Integrated Genomic Analysis Identifies Clinically Relevant Subtypes of Glioblastoma Characterized by Abnormalities in PDGFRA, IDH1, EGFR, and NF1. Cancer Cell 2010, 17, 98–110. [Google Scholar] [CrossRef]
- Verhaak, R.G.W. Moving the Needle: Optimizing Classification for Glioma. Sci. Transl. Med. 2016, 8, 350fs14. [Google Scholar] [CrossRef]
- Blumenthal, D.T.; Dvir, A.; Lossos, A.; Tzuk-Shina, T.; Lior, T.; Limon, D.; Yust-Katz, S.; Lokiec, A.; Ram, Z.; Ross, J.S.; et al. Clinical Utility and Treatment Outcome of Comprehensive Genomic Profiling in High Grade Glioma Patients. J. Neurooncol. 2016, 130, 211–219. [Google Scholar] [CrossRef] [PubMed]
- Chen, J.; McKay, R.M.; Parada, L.F. Malignant Glioma: Lessons from Genomics, Mouse Models, and Stem Cells. Cell 2012, 149, 36–47. [Google Scholar] [CrossRef]
- Gilbertson, R.J.; Rich, J.N. Making a Tumour’s Bed: Glioblastoma Stem Cells and the Vascular Niche. Nat. Rev. Cancer 2007, 7, 733–736. [Google Scholar] [CrossRef] [PubMed]
- Morokoff, A.; Ng, W.; Gogos, A.; Kaye, A. Molecular Subtypes, Stem Cells and Heterogeneity: Implications for Personalised Therapy in Glioma. J. Clin. Neurosci. 2015, 22, 1219–1226. [Google Scholar] [CrossRef] [PubMed]
- Prager, B.C.; Bhargava, S.; Mahadev, V.; Hubert, C.G.; Rich, J.N. Glioblastoma Stem Cells: Driving Resilience through Chaos. Trends Cancer 2020, 6, 223–235. [Google Scholar] [CrossRef] [PubMed]
- Wick, W.; Platten, M.; Meisner, C.; Felsberg, J.; Tabatabai, G.; Simon, M.; Nikkhah, G.; Papsdorf, K.; Steinbach, J.P.; Sabel, M.; et al. Temozolomide Chemotherapy Alone versus Radiotherapy Alone for Malignant Astrocytoma in the Elderly: The NOA-08 Randomised, Phase 3 Trial. Lancet Oncol. 2012, 13, 707–715. [Google Scholar] [CrossRef]
- Feig, L.A.; Urano, T.; Cantor, S. Evidence for a Ras/Ral Signaling Cascade. Trends Biochem. Sci. 1996, 21, 438–441. [Google Scholar] [CrossRef]
- Rosse, C.; Hatzoglou, A.; Parrini, M.-C.; White, M.A.; Chavrier, P.; Camonis, J. RalB Mobilizes the Exocyst To Drive Cell Migration. Mol. Cell. Biol. 2006, 26, 727–734. [Google Scholar] [CrossRef] [PubMed]
- Spiczka, K.S.; Yeaman, C. Ral-Regulated Interaction between Sec5 and Paxillin Targets Exocyst to Focal Complexes during Cell Migration. J. Cell Sci. 2008, 121, 2880–2891. [Google Scholar] [CrossRef]
- Chen, X.-W.; Inoue, M.; Hsu, S.C.; Saltiel, A.R. RalA-Exocyst-Dependent Recycling Endosome Trafficking Is Required for the Completion of Cytokinesis. J. Biol. Chem. 2006, 281, 38609–38616. [Google Scholar] [CrossRef] [PubMed]
- Hamad, N.M.; Elconin, J.H.; Karnoub, A.E.; Bai, W.; Rich, J.N.; Abraham, R.T.; Der, C.J.; Counter, C.M. Distinct Requirements for Ras Oncogenesis in Human versus Mouse Cells. Genes Dev. 2002, 16, 2045–2057. [Google Scholar] [CrossRef]
- Yan, C.; Theodorescu, D. RAL GTPases: Biology and Potential as Therapeutic Targets in Cancer. Pharmacol. Rev. 2018, 70, 1–11. [Google Scholar] [CrossRef]
- Martin, T.D.; Samuel, J.C.; Routh, E.D.; Der, C.J.; Yeh, J.J. Activation and Involvement of Ral GTPases in Colorectal Cancer. Cancer Res. 2011, 71, 206–2015. [Google Scholar] [CrossRef] [PubMed]
- Chien, Y.; Kim, S.; Bumeister, R.; Loo, Y.M.; Kwon, S.W.; Johnson, C.L.; Balakireva, M.G.; Romeo, Y.; Kopelovich, L.; Gale, M.; et al. RalB GTPase-Mediated Activation of the IκB Family Kinase TBK1 Couples Innate Immune Signaling to Tumor Cell Survival. Cell 2006, 127, 157–170. [Google Scholar] [CrossRef] [PubMed]
- Song, X.; Hua, L.; Xu, Y.; Fang, Z.; Wang, Y.; Gao, J.; Shi, Q.; Zhou, X.; Yu, R. Involvement of RalB in the Effect of Geranylgeranyltransferase I on Glioma Cell Migration and Invasion. Clin. Transl. Oncol. 2015, 17, 477–485. [Google Scholar] [CrossRef] [PubMed]
- Wang, Q.; Wang, J.-Y.; Zhang, X.-P.; Lv, Z.-W.; Fu, D.; Lu, Y.-C.; Hu, G.-H.; Luo, C.; Chen, J.-X. RLIP76 Is Overexpressed in Human Glioblastomas and Is Required for Proliferation, Tumorigenesis and Suppression of Apoptosis. Carcinogenesis 2013, 34, 916–926. [Google Scholar] [CrossRef] [PubMed]
- Wang, Q.; Qian, J.; Wang, J.; Luo, C.; Chen, J.; Hu, G.; Lu, Y. Knockdown of RLIP76 Expression by RNA Interference Inhibits Invasion, Induces Cell Cycle Arrest, and Increases Chemosensitivity to the Anticancer Drug Temozolomide in Glioma Cells. J. Neurooncol. 2013, 112, 73–82. [Google Scholar] [CrossRef] [PubMed]
- Zhang, C.; Cai, Z.; Liang, Q.; Wang, Q.; Lu, Y.; Hu, L.; Hu, G. RLIP76 Depletion Enhances Autophagic Flux in U251 Cells. Cell. Mol. Neurobiol. 2017, 37, 555–562. [Google Scholar] [CrossRef]
- Cemeli, T.; Guasch-Vallés, M.; Nàger, M.; Felip, I.; Cambray, S.; Santacana, M.; Gatius, S.; Pedraza, N.; Dolcet, X.; Ferrezuelo, F.; et al. Cytoplasmic Cyclin D1 Regulates Glioblastoma Dissemination. J. Pathol. 2019, 248, 501–513. [Google Scholar] [CrossRef] [PubMed]
- Hernandez-Segura, A.; Brandenburg, S.; Demaria, M. Induction and Validation of Cellular Senescence in Primary Human Cells. J. Vis. Exp. 2018, 136, e57782. [Google Scholar] [CrossRef] [PubMed]
- Johmura, Y.; Shimada, M.; Misaki, T.; Naiki-Ito, A.; Miyoshi, H.; Motoyama, N.; Ohtani, N.; Hara, E.; Nakamura, M.; Morita, A.; et al. Necessary and Sufficient Role for a Mitosis Skip in Senescence Induction. Mol. Cell 2014, 55, 73–84. [Google Scholar] [CrossRef]
- Villalonga-Planells, R.; Coll-Mulet, L.; Martínez-Soler, F.; Castaño, E.; Acebes, J.-J.; Giménez-Bonafé, P.; Gil, J.; Tortosa, A. Activation of P53 by Nutlin-3a Induces Apoptosis and Cellular Senescence in Human Glioblastoma Multiforme. PLoS ONE 2011, 6, e18588. [Google Scholar] [CrossRef] [PubMed]
- Tecleab, A.; Zhang, X.; Sebti, S.M. Ral GTPase Down-Regulation Stabilizes and Reactivates P53 to Inhibit Malignant Transformation. J. Biol. Chem. 2014, 289, 31296–31309. [Google Scholar] [CrossRef] [PubMed]
- Alza, L.; Nàger, M.; Visa, A.; Cantí, C.; Herreros, J. FAK Inhibition Induces Glioblastoma Cell Senescence-like State through P62 and P27. Cancers 2020, 12, 1086. [Google Scholar] [CrossRef]
- Von Kobbe, C. Cellular Senescence: A View throughout Organismal Life. Cell. Mol. Life Sci. 2018, 75, 3553–3567. [Google Scholar] [CrossRef] [PubMed]
- Bartkova, J.; Hamerlik, P.; Stockhausen, M.-T.; Ehrmann, J.; Hlobilkova, A.; Laursen, H.; Kalita, O.; Kolar, Z.; Poulsen, H.S.; Broholm, H.; et al. Replication Stress and Oxidative Damage Contribute to Aberrant Constitutive Activation of DNA Damage Signalling in Human Gliomas. Oncogene 2010, 29, 5095–5102. [Google Scholar] [CrossRef] [PubMed]
- Leontieva, O.V.; Blagosklonny, M.V. M(o)TOR of Pseudo-Hypoxic State in Aging: Rapamycin to the Rescue. Cell Cycle Georget. Tex 2014, 13, 509–515. [Google Scholar] [CrossRef] [PubMed]
- Ignatova, T.N.; Kukekov, V.G.; Laywell, E.D.; Suslov, O.N.; Vrionis, F.D.; Steindler, D.A. Human Cortical Glial Tumors Contain Neural Stem-like Cells Expressing Astroglial and Neuronal Markers in Vitro. GLIA 2002, 39, 193–206. [Google Scholar] [CrossRef]
- Singh, S.K.; Clarke, I.D.; Terasaki, M.; Bonn, V.E.; Hawkins, C.; Squire, J.; Dirks, P.B. Identification of a Cancer Stem Cell in Human Brain Tumors. Cancer Res. 2003, 63, 5821–5828. [Google Scholar]
- Singh, S.K.; Hawkins, C.; Clarke, I.D.; Squire, J.A.; Bayani, J.; Hide, T.; Henkelman, R.M.; Cusimano, M.D.; Dirks, P.B. Identification of Human Brain Tumour Initiating Cells. Nature 2004, 432, 396–401. [Google Scholar] [CrossRef]
- Chen, J.; Li, Y.; Yu, T.S.; McKay, R.M.; Burns, D.K.; Kernie, S.G.; Parada, L.F. A Restricted Cell Population Propagates Glioblastoma Growth after Chemotherapy. Nature 2012, 488, 522–526. [Google Scholar] [CrossRef] [PubMed]
- Bowman, R.L.; Wang, Q.; Carro, A.; Verhaak, R.G.W.; Squatrito, M. GlioVis Data Portal for Visualization and Analysis of Brain Tumor Expression Datasets. Neuro-Oncology 2017, 19, 139–141. [Google Scholar] [CrossRef]
- Peschard, P.; McCarthy, A.; Leblanc-Dominguez, V.; Yeo, M.; Guichard, S.; Stamp, G.; Marshall, C.J. Genetic Deletion of RALA and RALB Small GTPases Reveals Redundant Functions in Development and Tumorigenesis. Curr. Biol. 2012, 22, 2063–2068. [Google Scholar] [CrossRef]
- Lim, K.-H.; O’Hayer, K.; Adam, S.J.; Kendall, S.D.; Campbell, P.M.; Der, C.J.; Counter, C.M. Divergent Roles for RalA and RalB in Malignant Growth of Human Pancreatic Carcinoma Cells. Curr. Biol. 2006, 16, 2385–2394. [Google Scholar] [CrossRef]
- Chien, Y.; White, M.A. RAL GTPases Are Linchpin Modulators of Human Tumour-Cell Proliferation and Survival. EMBO Rep. 2003, 4, 800–806. [Google Scholar] [CrossRef]
- Oxford, G.; Owens, C.R.; Titus, B.J.; Foreman, T.L.; Herlevsen, M.C.; Smith, S.C.; Theodorescu, D. RalA and RalB: Antagonistic Relatives in Cancer Cell Migration. Cancer Res. 2005, 65, 7111–7120. [Google Scholar] [CrossRef] [PubMed]
- Falsetti, S.C.; Wang, D.-A.; Peng, H.; Carrico, D.; Cox, A.D.; Der, C.J.; Hamilton, A.D.; Sebti, S.M. Geranylgeranyltransferase I Inhibitors Target RalB To Inhibit Anchorage-Dependent Growth and Induce Apoptosis and RalA To Inhibit Anchorage-Independent Growth. Mol. Cell. Biol. 2007, 27, 8003–8014. [Google Scholar] [CrossRef] [PubMed]
- Brennan, C.W.; Verhaak, R.G.W.; McKenna, A.; Campos, B.; Noushmehr, H.; Salama, S.R.; Zheng, S.; Chakravarty, D.; Sanborn, J.Z.; Berman, S.H.; et al. The Somatic Genomic Landscape of Glioblastoma. Cell 2013, 155, 462–477. [Google Scholar] [CrossRef] [PubMed]
- Zipfel, P.A.; Brady, D.C.; Kashatus, D.F.; Ancrile, B.D.; Tyler, D.S.; Counter, C.M. Ral Activation Promotes Melanomagenesis. Oncogene 2010, 29, 4859–4864. [Google Scholar] [CrossRef] [PubMed]
- Saito, R.; Shirakawa, R.; Nishiyama, H.; Kobayashi, T.; Kawato, M.; Kanno, T.; Nishizawa, K.; Matsui, Y.; Ohbayashi, T.; Horiguchi, M.; et al. Downregulation of Ral GTPase-Activating Protein Promotes Tumor Invasion and Metastasis of Bladder Cancer. Oncogene 2013, 32, 894–902. [Google Scholar] [CrossRef] [PubMed]
- Wang, Q.; Zhang, L.; Cui, Y.; Zhang, C.; Chen, H.; Gu, J.; Qian, J.; Luo, C. Increased RLIP76 Expression in IDH1 Wild-Type Glioblastoma Multiforme Is Associated with Worse Prognosis. Oncol. Rep. 2020, 43, 188–200. [Google Scholar] [CrossRef] [PubMed]
- Nardella, C.; Clohessy, J.G.; Alimonti, A.; Pandolfi, P.P. Pro-Senescence Therapy for Cancer Treatment. Nat. Rev. Cancer 2011, 11, 503–511. [Google Scholar] [CrossRef]
- Patki, M.; McFall, T.; Rosati, R.; Huang, Y.; Malysa, A.; Polin, L.; Fielder, A.; Wilson, M.R.; Lonardo, F.; Back, J.; et al. Chronic P27Kip1 Induction by Dexamethasone Causes Senescence Phenotype and Permanent Cell Cycle Blockade in Lung Adenocarcinoma Cells Over-Expressing Glucocorticoid Receptor. Sci. Rep. 2018, 8, 16006. [Google Scholar] [CrossRef]
- Luo, Y.; Yang, Y.; Liu, M.; Wang, D.; Wang, F.; Bi, Y.; Ji, J.; Li, S.; Liu, Y.; Chen, R.; et al. Oncogenic KRAS Reduces Expression of FGF21 in Acinar Cells to Promote Pancreatic Tumorigenesis in Mice on a High-Fat Diet. Gastroenterology 2019, 157, 1413.e11–1428.e11. [Google Scholar] [CrossRef]
- Kwan, S.-Y.; Sheel, A.; Song, C.-Q.; Zhang, X.-O.; Jiang, T.; Dang, H.; Cao, Y.; Ozata, D.M.; Mou, H.; Yin, H.; et al. Depletion of TRRAP Induces P53-Independent Senescence in Liver Cancer by Downregulating Mitotic Genes. Hepatology 2020, 71, 275–290. [Google Scholar] [CrossRef]
- Yan, C.; Liu, D.; Li, L.; Wempe, M.F.; Guin, S.; Khanna, M.; Meier, J.; Hoffman, B.; Owens, C.; Wysoczynski, C.L.; et al. Discovery and Characterization of Small Molecules That Target the GTPase Ral. Nature 2014, 515, 443–447. [Google Scholar] [CrossRef] [PubMed]
- Nàger, M.; Sallán, M.C.; Visa, A.; Pushparaj, C.; Santacana, M.; Macià, A.; Yeramian, A.; Cantí, C.; Herreros, J. Inhibition of WNT-CTNNB1 Signaling Upregulates SQSTM1 and Sensitizes Glioblastoma Cells to Autophagy Blockers. Autophagy 2018, 14, 619–636. [Google Scholar] [CrossRef] [PubMed]


Publisher’s Note: MDPI stays neutral with regard to jurisdictional claims in published maps and institutional affiliations. |
© 2022 by the authors. Licensee MDPI, Basel, Switzerland. This article is an open access article distributed under the terms and conditions of the Creative Commons Attribution (CC BY) license (https://creativecommons.org/licenses/by/4.0/).
Share and Cite
Cemeli, T.; Guasch-Vallés, M.; Ribes-Santolaria, M.; Ibars, E.; Navaridas, R.; Dolcet, X.; Pedraza, N.; Colomina, N.; Torres-Rosell, J.; Ferrezuelo, F.; et al. Antitumor Effects of Ral-GTPases Downregulation in Glioblastoma. Int. J. Mol. Sci. 2022, 23, 8199. https://doi.org/10.3390/ijms23158199
Cemeli T, Guasch-Vallés M, Ribes-Santolaria M, Ibars E, Navaridas R, Dolcet X, Pedraza N, Colomina N, Torres-Rosell J, Ferrezuelo F, et al. Antitumor Effects of Ral-GTPases Downregulation in Glioblastoma. International Journal of Molecular Sciences. 2022; 23(15):8199. https://doi.org/10.3390/ijms23158199
Chicago/Turabian StyleCemeli, Tània, Marta Guasch-Vallés, Marina Ribes-Santolaria, Eva Ibars, Raúl Navaridas, Xavier Dolcet, Neus Pedraza, Neus Colomina, Jordi Torres-Rosell, Francisco Ferrezuelo, and et al. 2022. "Antitumor Effects of Ral-GTPases Downregulation in Glioblastoma" International Journal of Molecular Sciences 23, no. 15: 8199. https://doi.org/10.3390/ijms23158199
APA StyleCemeli, T., Guasch-Vallés, M., Ribes-Santolaria, M., Ibars, E., Navaridas, R., Dolcet, X., Pedraza, N., Colomina, N., Torres-Rosell, J., Ferrezuelo, F., Herreros, J., & Garí, E. (2022). Antitumor Effects of Ral-GTPases Downregulation in Glioblastoma. International Journal of Molecular Sciences, 23(15), 8199. https://doi.org/10.3390/ijms23158199