
Drought Stress Pre-Treatment Triggers Thermotolerance Acquisition in Durum Wheat


 ,
,  ,
,  and
and
Abstract
:1. Introduction
2. Results
2.1. Physiological Analyses
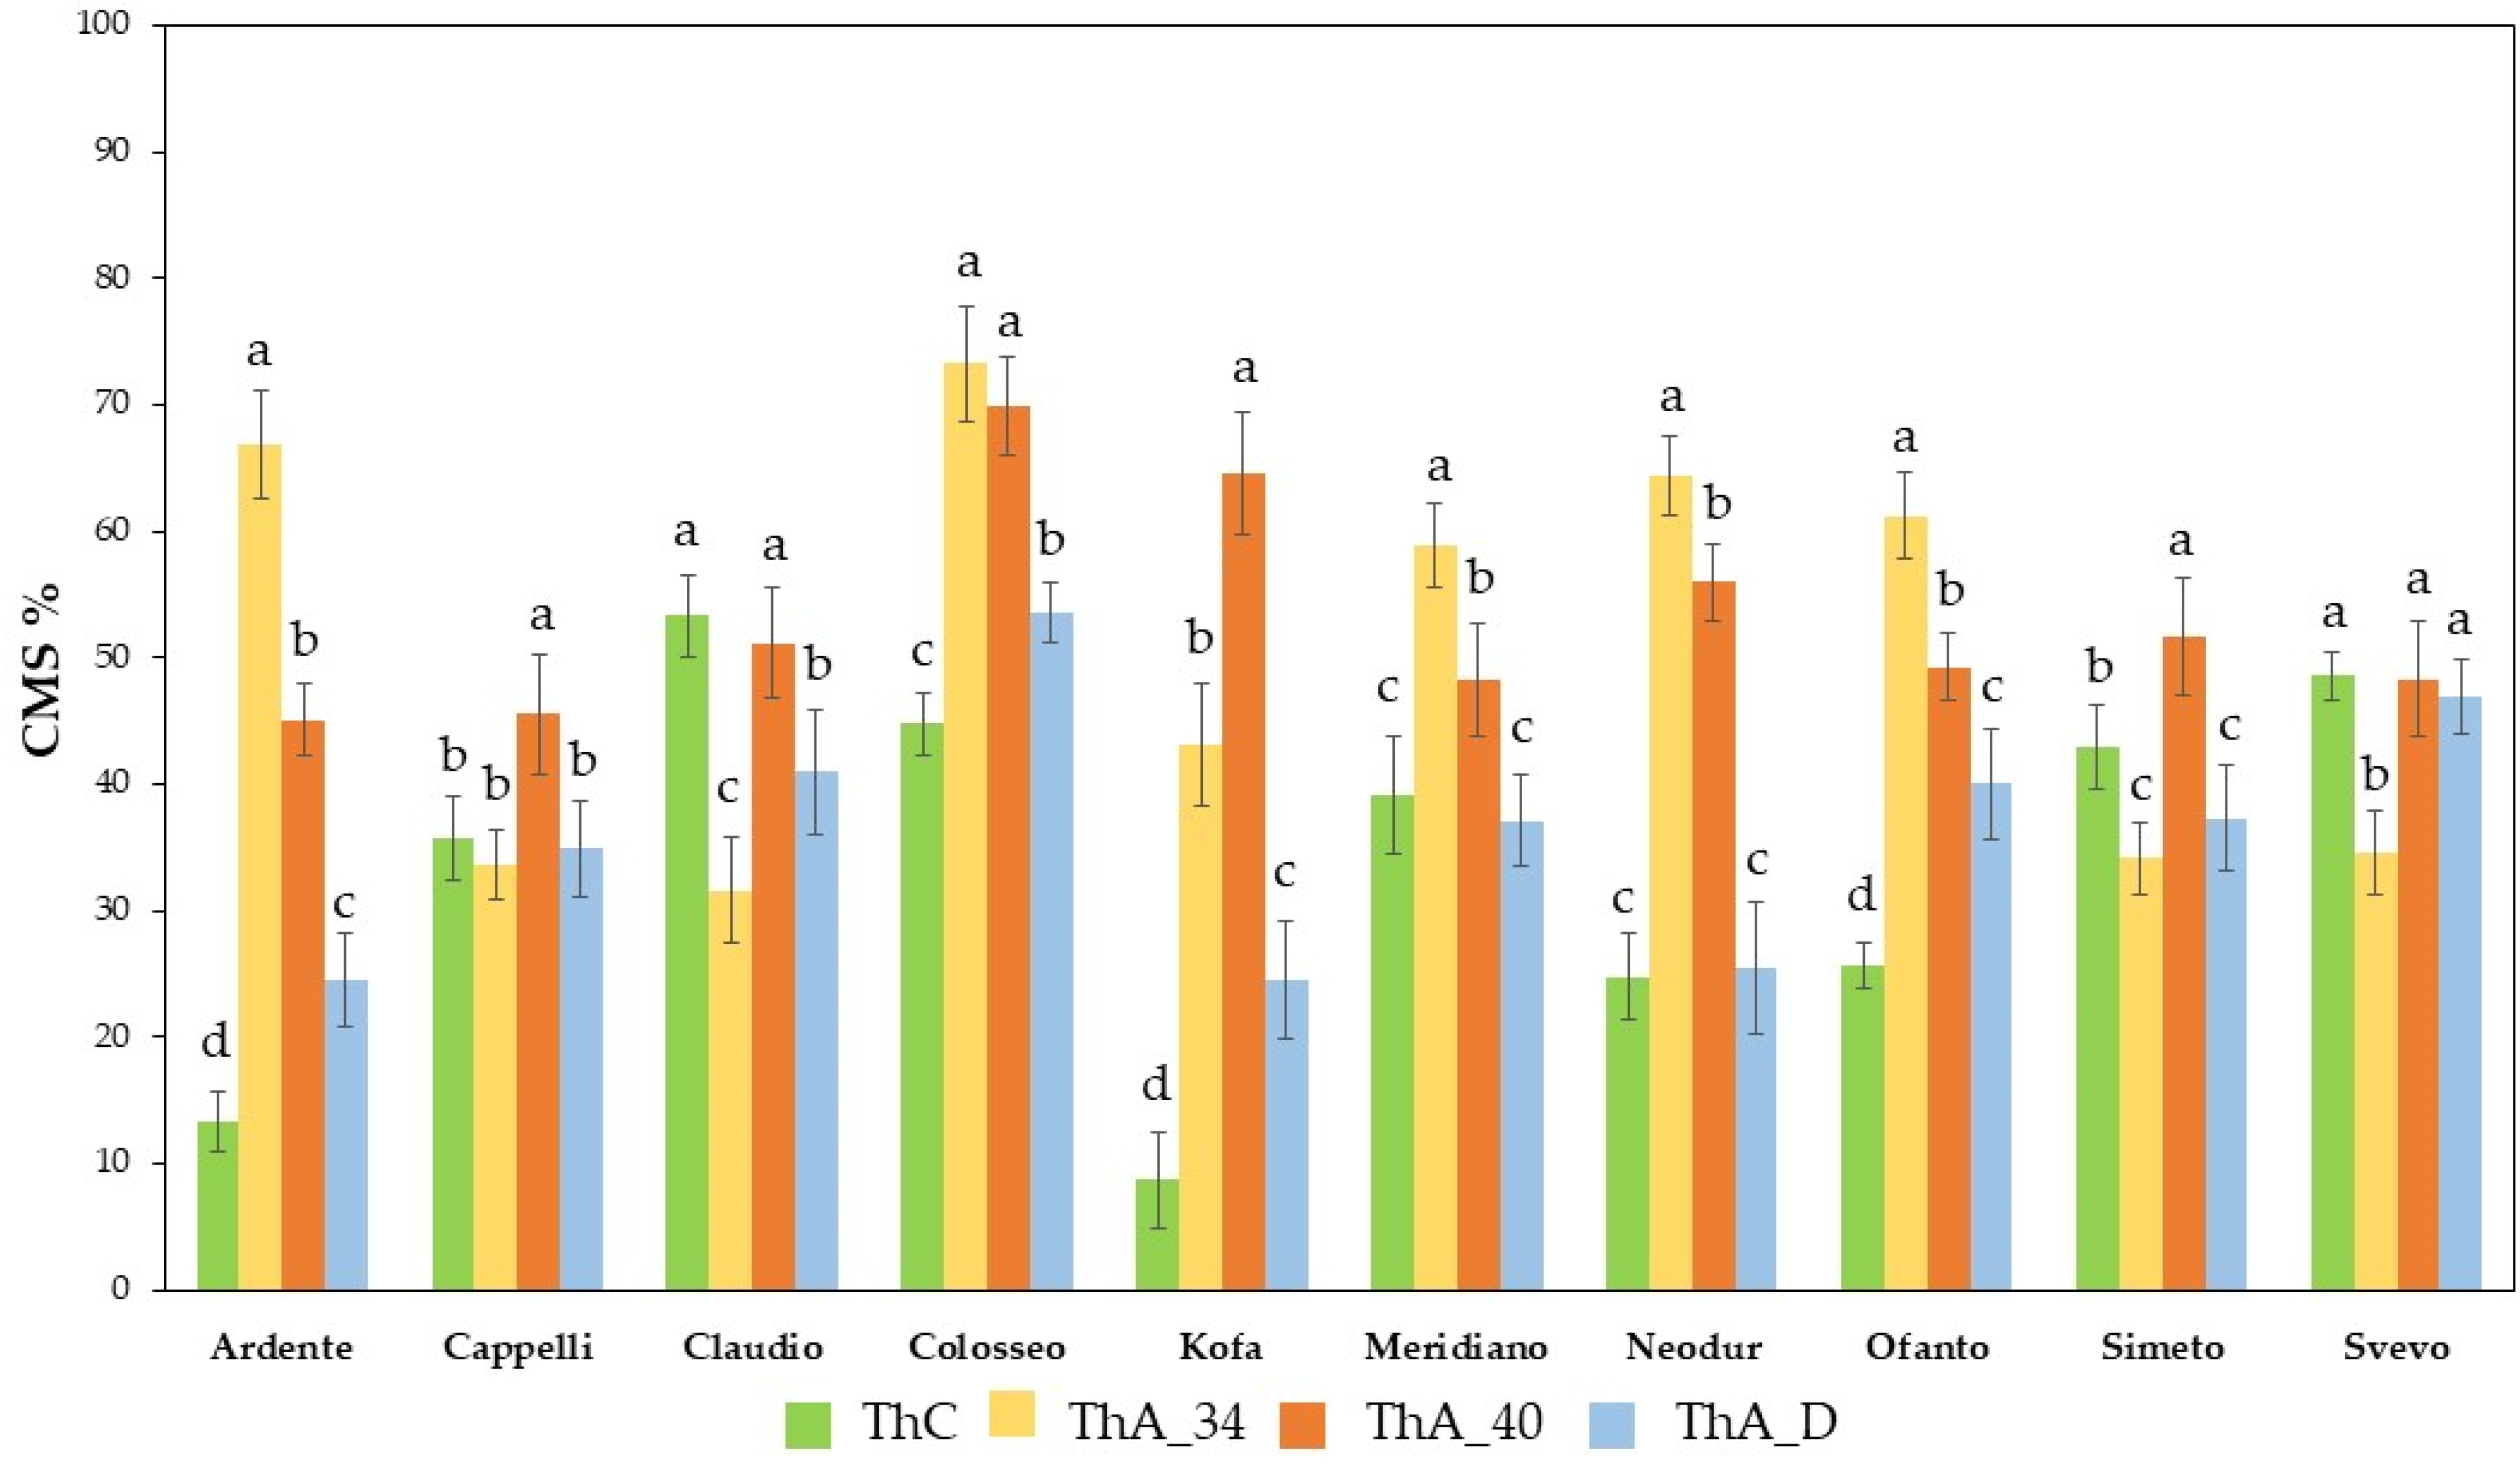
2.1.1. Cell Membrane Stability (CMS) Evaluation
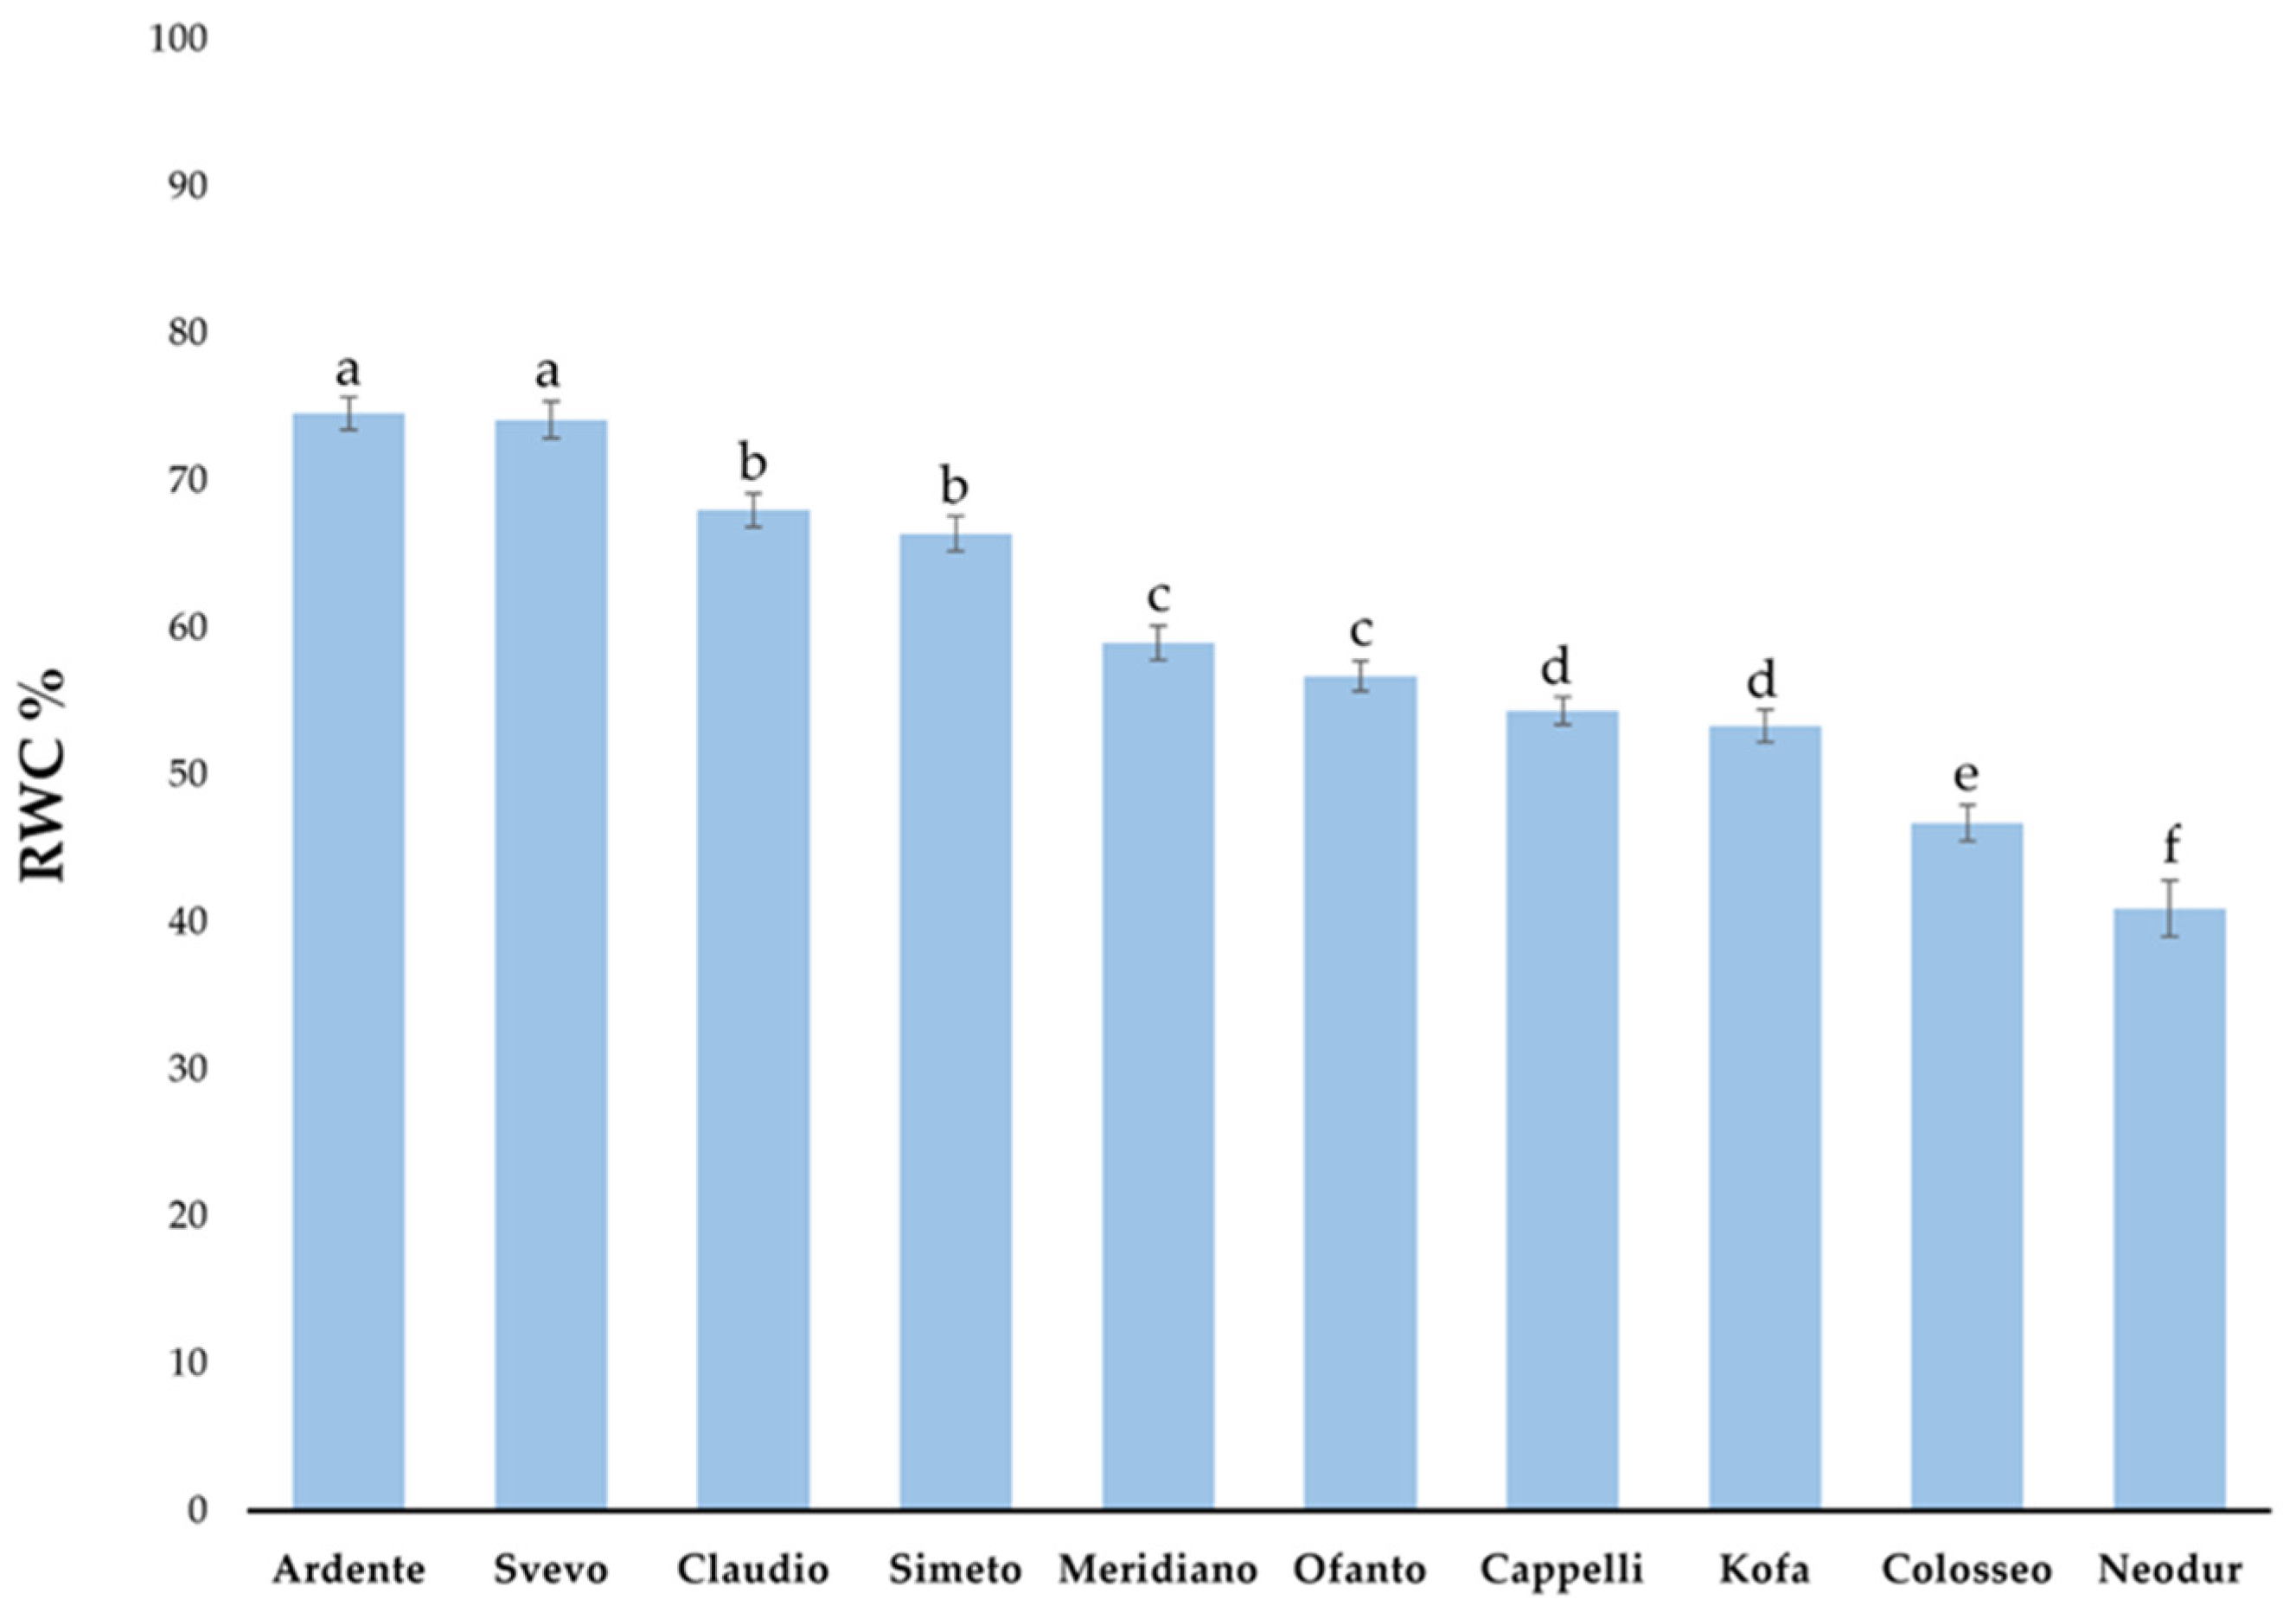
2.1.2. Relative Water Content (RWC) Evaluation
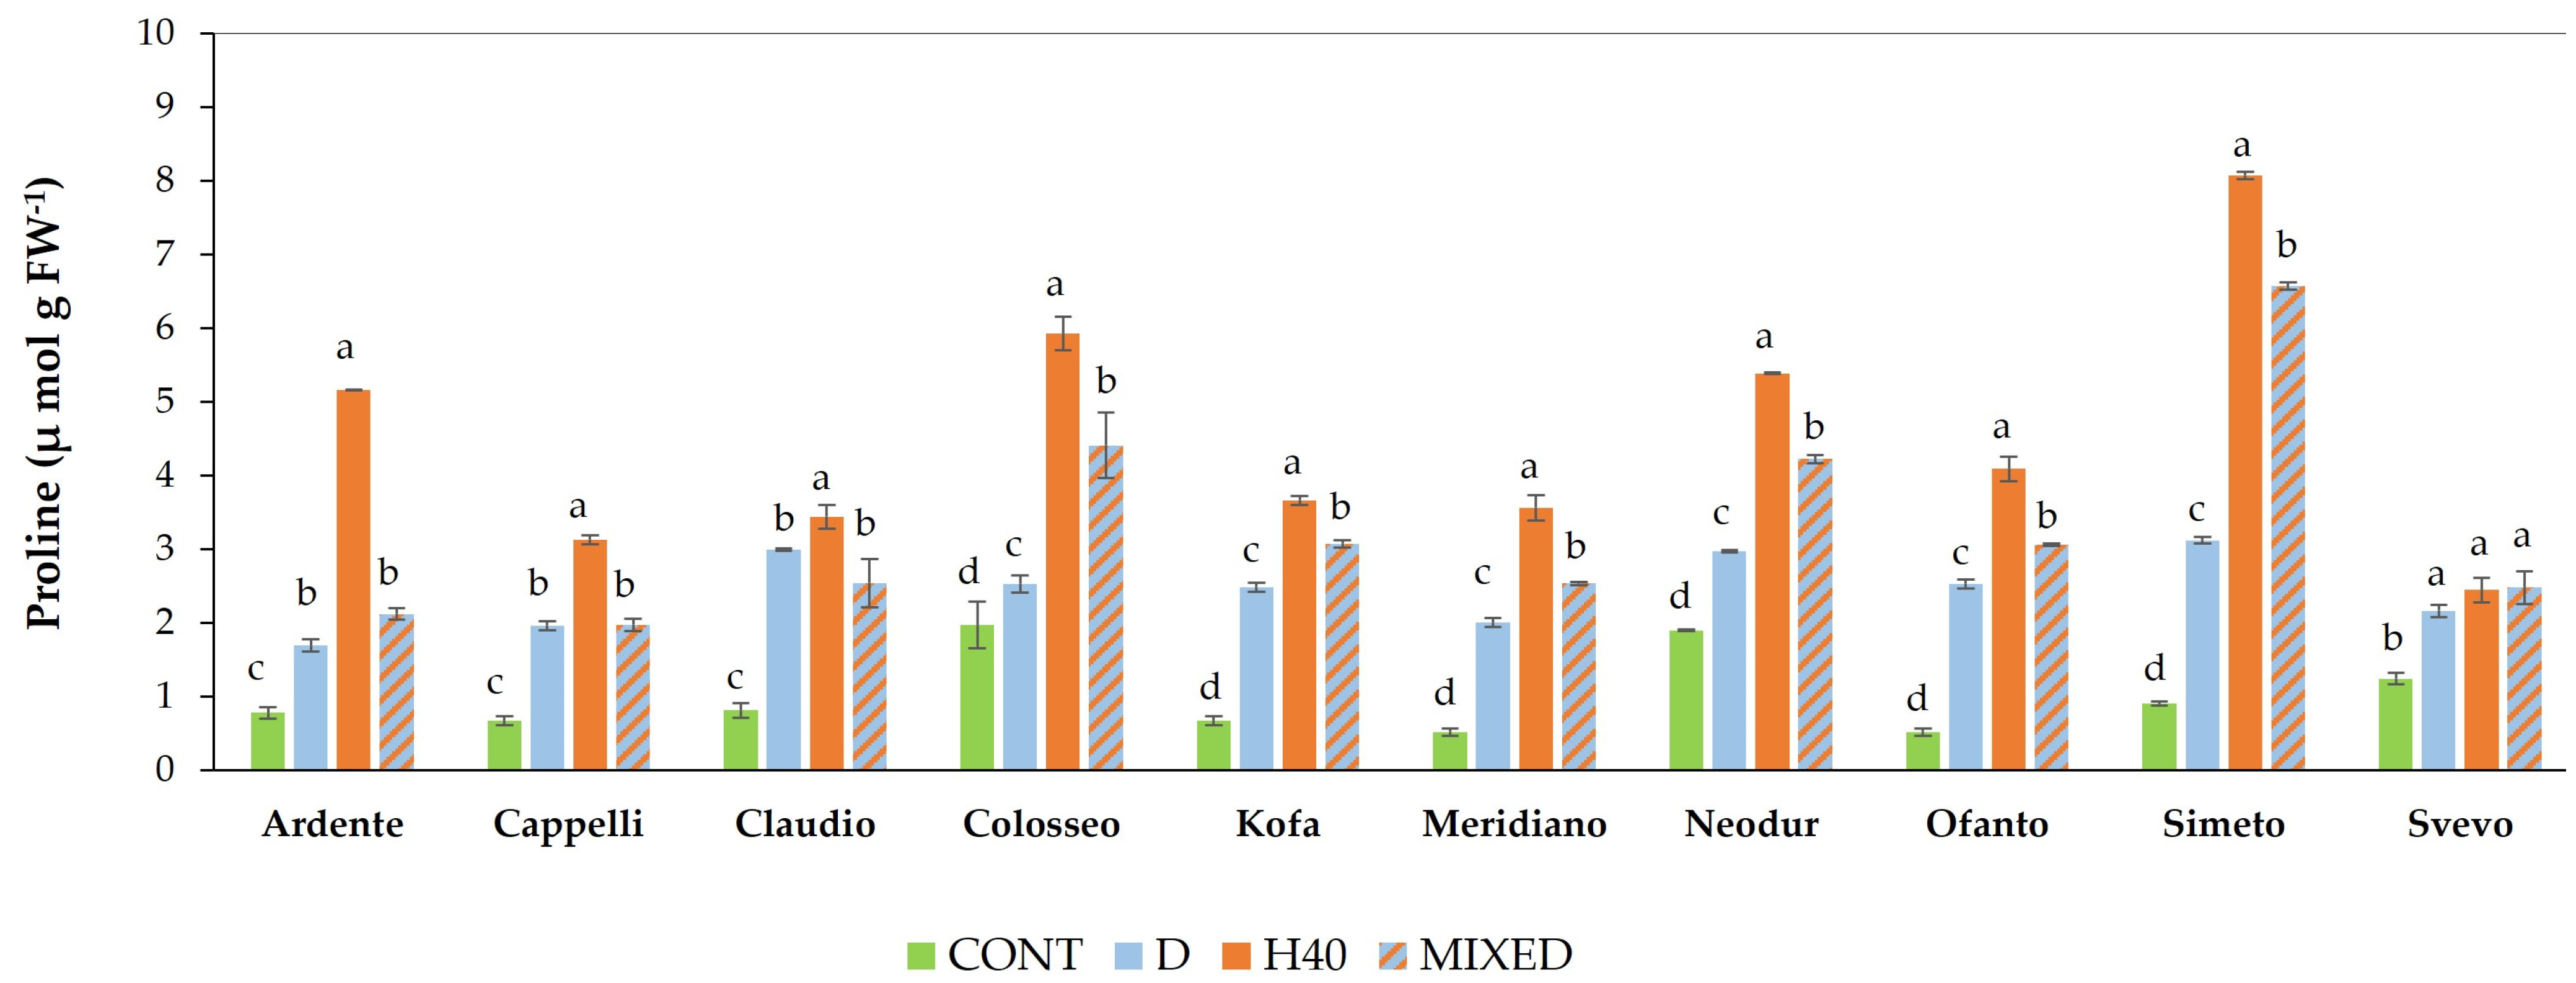
2.1.3. Free Proline Content Evaluation
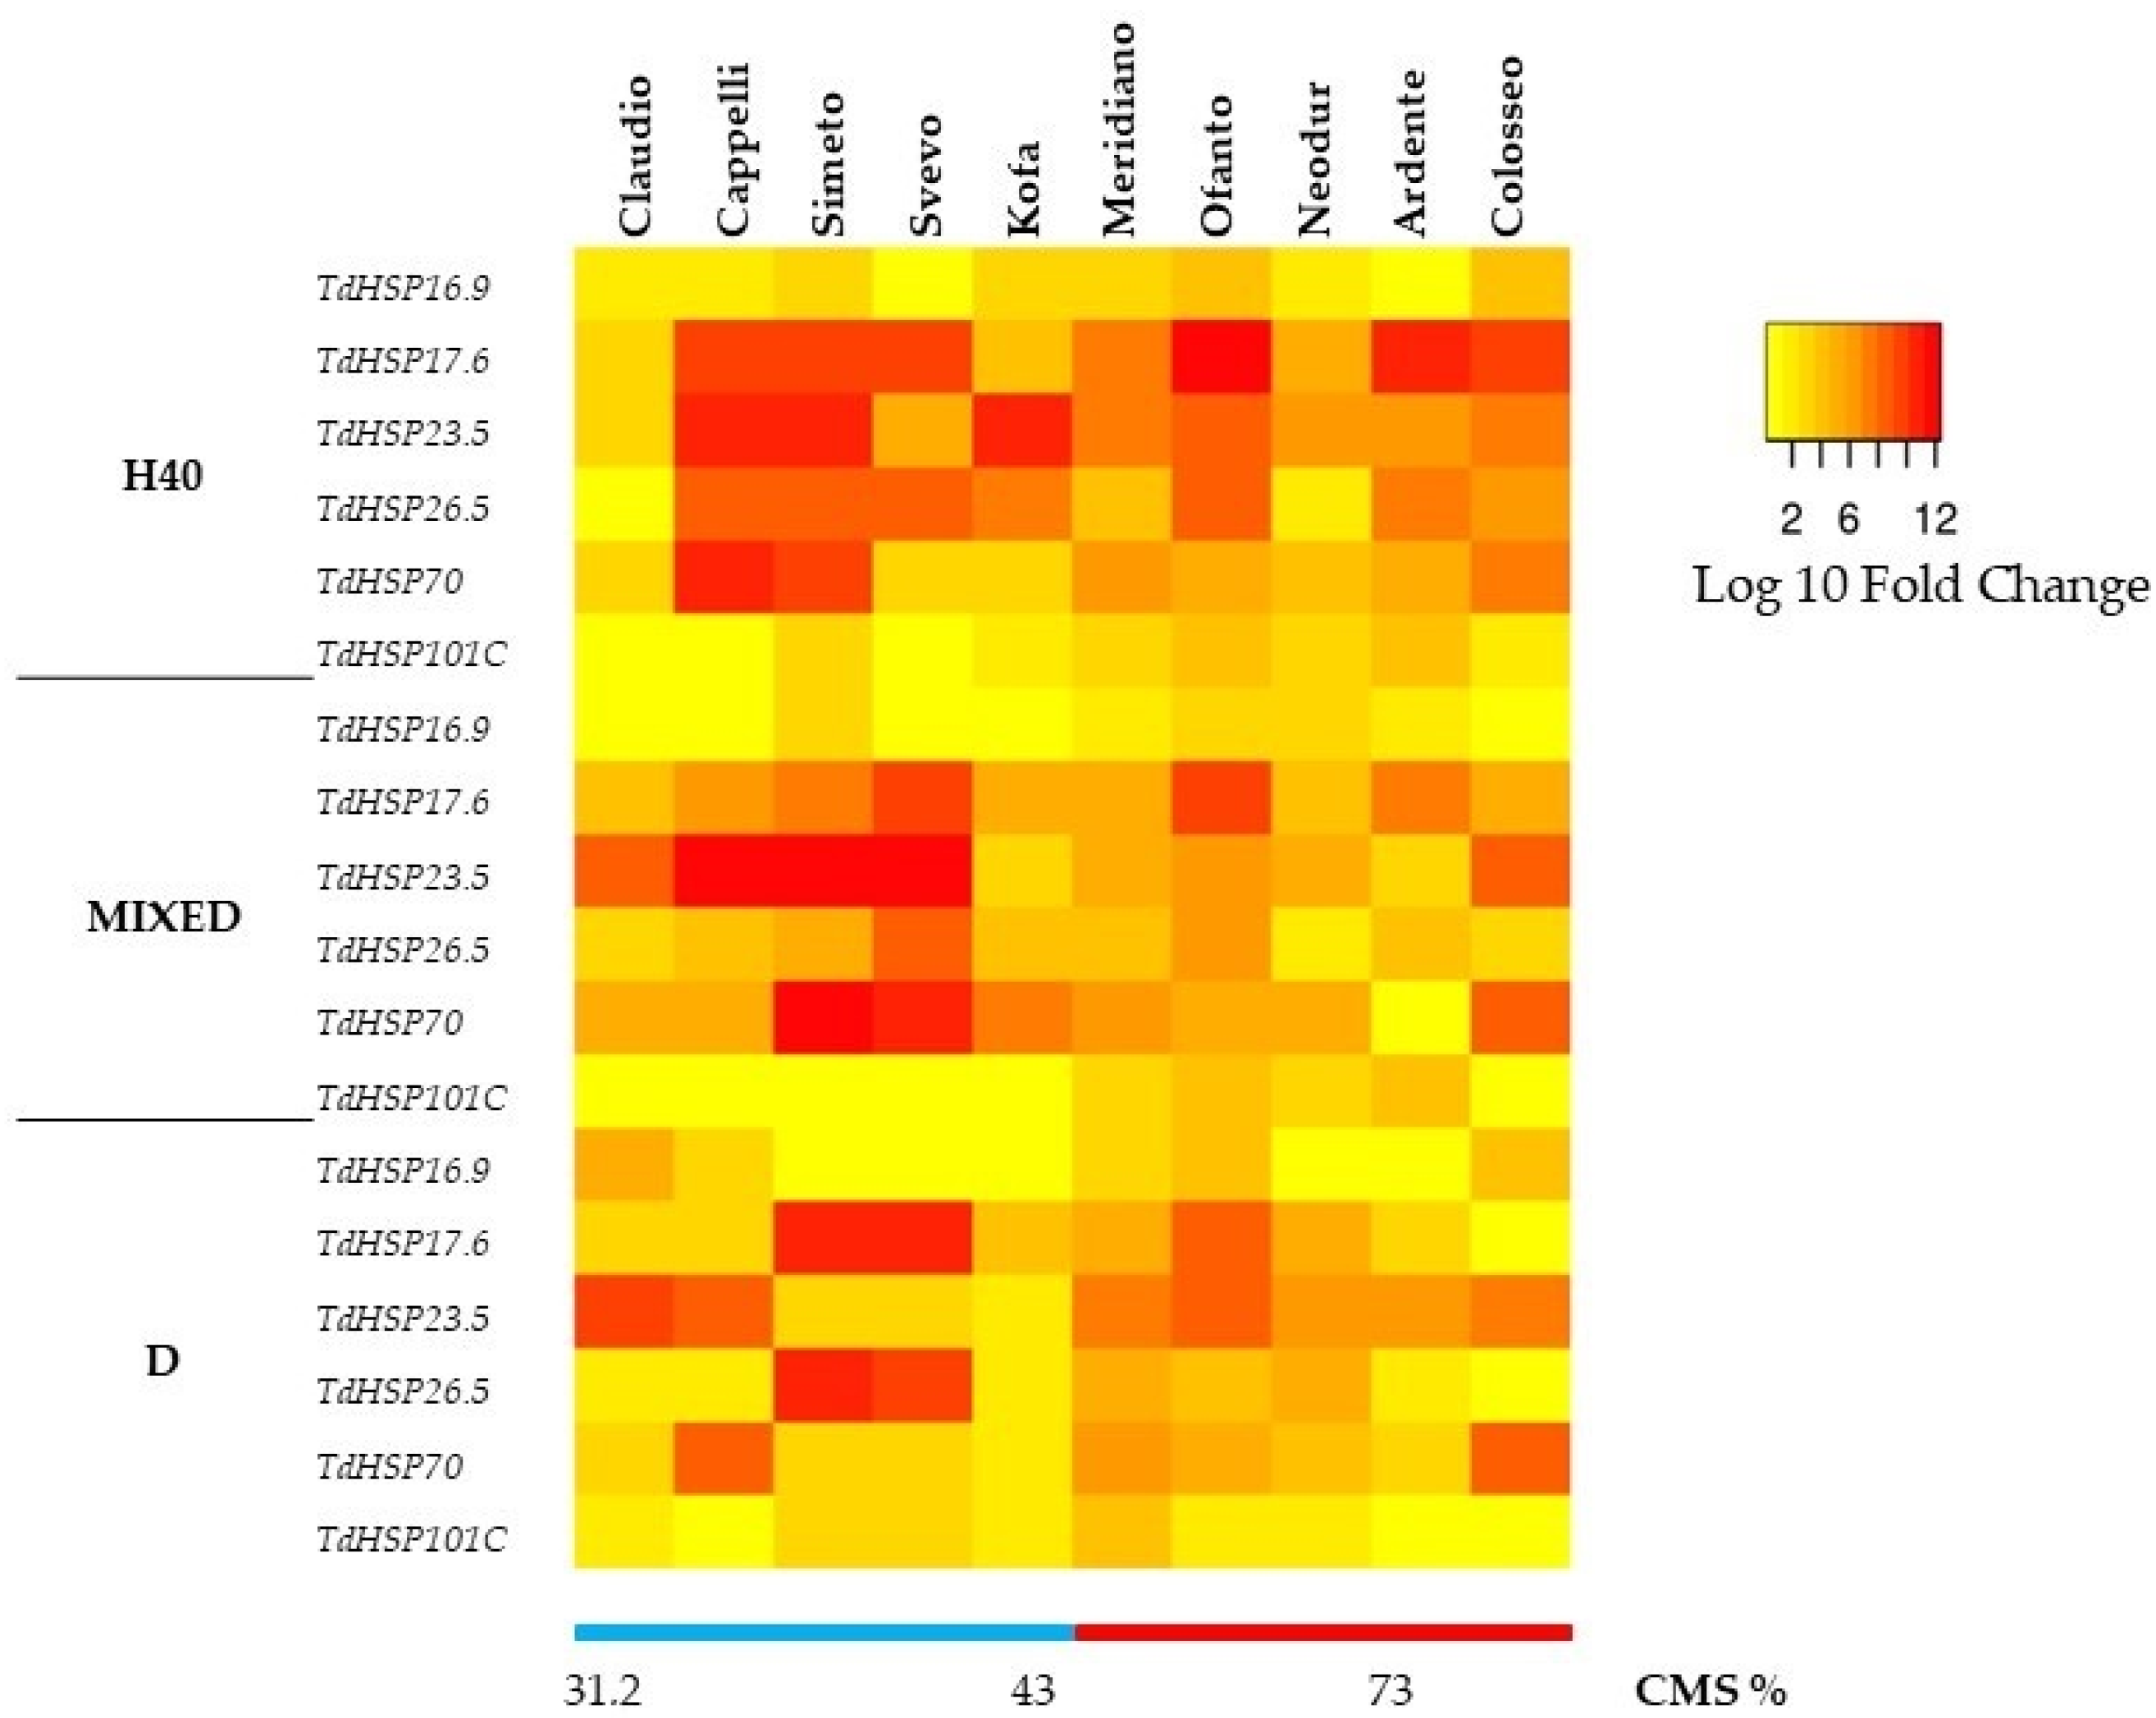
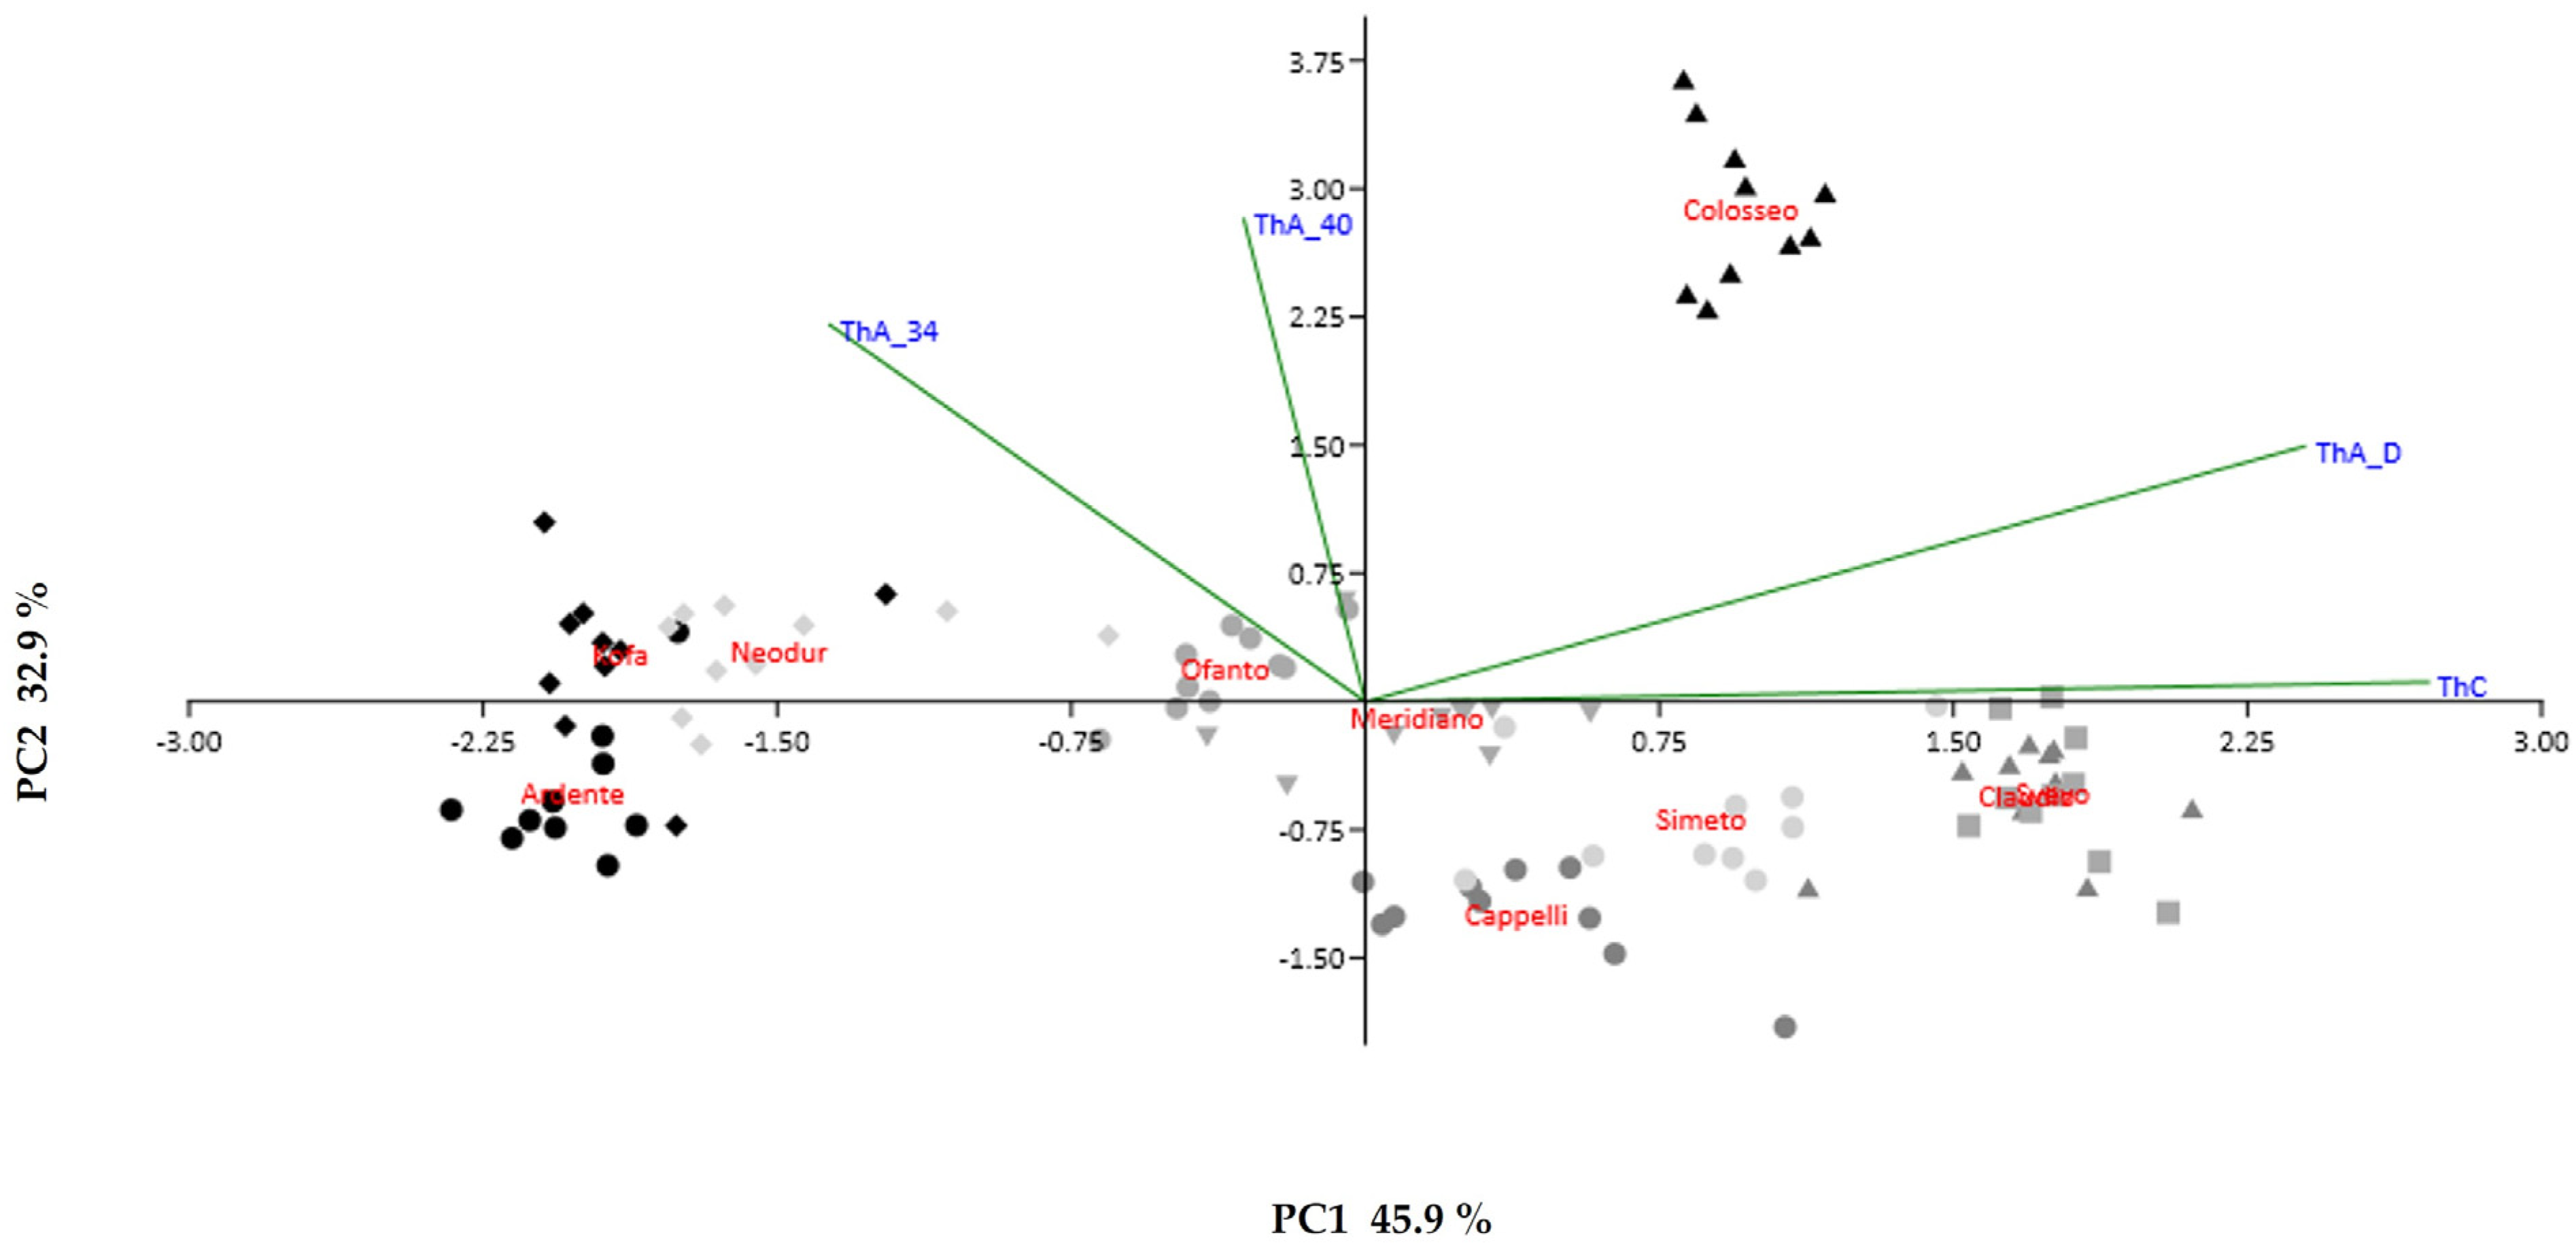
2.2. Molecular Analysis
3. Discussion
4. Materials and Methods
4.1. Plant Materials and Stress Treatments
4.2. Evaluation of Cell Membrane Stability
4.3. Measurement of RWC
4.4. Free proline Determination
4.5. RNA Extraction, cDNA Synthesis and Quantitative RT-PCR
4.6. Statistical Analysis
5. Conclusions
Supplementary Materials
Author Contributions
Funding
Institutional Review Board Statement
Informed Consent Statement
Data Availability Statement
Acknowledgments
Conflicts of Interest
References
- Farooq, M.; Hussain, M.; Wahid, A.; Siddique, K.H.M. Drought Stress in Plants: An Overview. In Plant Responses to Drought Stress: From Morphological to Molecular Features; Aroca, R., Ed.; Springer: Berlin/Heidelberg, Germany, 2012; Volume 1, pp. 1–33. [Google Scholar]
- Teuling, A.J. A hot future for European droughts. Nat. Clim. Chang. 2018, 8, 364–365. [Google Scholar] [CrossRef]
- Janni, M.; Gullì, M.; Maestri, E.; Marmiroli, M.; Valliyodan, B.; Nguyen, H.T.; Marmiroli, N. Molecular and genetic bases of heat stress responses in crop plants and breeding for increased resilience and productivity. J. Exp. Bot. 2020, 71, 3780–3802. [Google Scholar] [CrossRef]
- Bezner Kerr, R.T.; Hasegawa, R.; Lasco, I.; Bhatt, D.; Deryng, A.; Farrell, H.; Gurney-Smith, H.; Ju, S.; Lluch-Cota, F.; Meza, G.; et al. Food, Fibre, and Other Ecosystem Products. Climate Change 2022: Impacts, Adaptation, and Vulnerability. Contribution of Working Group II to the Sixth Assessment Report of the Intergovernmental Panel on Climate Change, Pörtner, H.O., Roberts, D.C., Tignor, M., Poloczanska, E.S., Mintenbeck, K., Alegría, A., Craig, M., Langsdorf, S., Löschke, S., Möller, V., et al., Eds.; Cambridge University Press: Cambridge, UK, 2022; In press. [Google Scholar]
- Hossain, M.A.; Li, Z.-G.; Hoque, T.S.; Burrit, D.J.; Fujita, M.; Munné-Bosh, S. Heat or cold priming-induced cross-tolerance to abiotic stresses in plants: Key regulators and possible mechanisms. Protoplasma 2018, 255, 399–412. [Google Scholar] [CrossRef]
- Sharma, M.; Kumar, P.; Verma, V.; Sharma, R.; Bhargava, B.; Irfan, M. Understanding plant stress memory response for abiotic stress resilience: Molecular insights and prospects. Plant Physiol. Biochem. 2022, 179, 10–24. [Google Scholar] [CrossRef]
- Mauch-Mani, B.; Baccelli, I.; Luna, E.; Flors, V. Defense priming: An adaptive part of induced resistance. Annu. Rev. Plant Biol. 2017, 68, 485–512. [Google Scholar] [CrossRef] [Green Version]
- Walter, J.; Jentsch, A.; Beierkuhulein, C.; Kreyling, J. Ecological stress memory and cross stress tolenance in plants in the fact of climate extremes. Environ. Exp. Bot. 2013, 94, 3–8. [Google Scholar] [CrossRef]
- Perez, I.B.; Broun, P.J. The role of ROS signaling in cross-tolerance: From model to crop. Front. Plant Sci. 2014, 5, 754. [Google Scholar] [CrossRef]
- Aroca, R.; Irigoyen, J.J.; Sánchez-Díaz, M. Drought enhances maize chilling tolerance. II. Photosynthetic traits and protective mechanisms against oxidative stress. Physiol. Plant 2003, 117, 540–549. [Google Scholar] [CrossRef]
- Harb, A.; Krishnan, A.; Ambavaram, M.M.; Pereira, A. Molecular and Physiological Analysis of Drought Stress in Arabidopsis Reveals Early Responses Leading to Acclimation in Plant Growth. Plant Physiol. 2010, 154, 1254–1271. [Google Scholar] [CrossRef] [Green Version]
- Peng, Y.; Xu, C.; Xu, L.; Huang, B. Improved Heat Tolerance through Drought Preconditioning Associated with Changes in Lipid Composition, Antioxidant Enzymes, and Protein Expression in Kentucky Bluegrass. Crop. Sci. 2012, 52, 807–817. [Google Scholar] [CrossRef]
- Wang, X.; Vignjevic, M.; Jiang, D.; Jacobsen, S.; Wollenweber, B. Improved tolerance to drought stress after anthesis due to priming before anthesis in wheat (Triticum aestivum L.) var. Vinjett. J. Exp. Bot. 2014, 65, 6441–6456. [Google Scholar] [CrossRef] [Green Version]
- Brás, T.A.; Seixas, J.; Carvalhais, N.; Jägermeyr, J. Severity of drought and heatwave crop losses tripled over the last five decades in Europe. Environ. Res. Lett. 2021, 16, 065012. [Google Scholar] [CrossRef]
- Porter, J.R.; Semenov, M.A. Crop responses to climatic variation. Philosoph. Trans. R. Soc. B Biol. Sci. 2005, 360, 2021–2035. [Google Scholar] [CrossRef]
- García del Moral, L.F.; Rharrabti, Y.; Villegas, D.; Royo, C. Evaluation of Grain Yield and Its Components in Durum Wheat under Mediterranean Conditions: An Onthogenic Approach. Agron. J. 2003, 95, 266–274. [Google Scholar]
- Venkatesh, K.; Senthilkumar, K.M.; Mamrutha, H.M.; Singh, G.; Singh, G.P. High-temperature stress in wheat under climate change scenario, effects and mitigation strategies. In Climate Change and Crop Stress; Shanker, A.K., Shanker, C., Anand, A., Maheswari, M., Eds.; Academic Press: Cambridge, MA, USA, 2022; pp. 209–229. [Google Scholar]
- Gibelin, A.L.; Déqué, M. Anthropogenic climate change over the Mediterranean region simulated by a global variable resolution model. Clim. Dyn. 2003, 20, 327–339. [Google Scholar] [CrossRef]
- IPCC. Climate Change 2022: Impacts, Adaptation, and Vulnerability. Contribution of Working Group II to the Sixth Assessment Report of the Intergovernmental Panel on Climate Change, Pörtner, H.-O., Roberts, D.C., Tignor, M., Poloczanska, E.S., Mintenbeck, K., Alegría, A., Craig, M., Langsdorf, S., Löschke, S., Möller, V., et al., Eds.; Cambridge University Press: Cambridge, UK, 2022; In press.
- Prasad, P.V.V.; Staggemborg, S.; Ristic, Z. Impacts of Drought and/or Heat Stress on Physiological, Developmental, Growth, and Yield Processes of Crop Plants. In Response of Crops to Limited Water: Understanding and Modeling Water Stress Effects on Plant Growth Processes; Ahuja, L.R., Reddy, V.R., Saseendran, S.A., Yu, O., Eds.; American Society of Agronomy Inc.: Madison, WI, USA; Crop Science Society of America, Inc.: Fitchburg, WI, USA; Soil Science Society of America, Inc.: Madison, WI, USA, 2008; pp. 301–355. [Google Scholar]
- Fokar, M.; Blum, A.; Nguyen, H.T. Heat tolerance in Spring wheat II. Grain filling. Euphytica 1998, 104, 9–15. [Google Scholar] [CrossRef]
- Senthil-Kumar, M.; Kumar, G.; Srikanthbabu, V.; Udayakumar, M. Assessment of variability in acquired thermotolerance: Potential option to study genotypic response and the relevance of stress genes. J. Plant Physiol. 2007, 164, 111–125. [Google Scholar] [CrossRef]
- Rampino, P.; Mita, G.; Pataleo, S.; De Pascali, M.; Di Fonzo, N.; Perrotta, C. Acquisition of thermotolerance and HSP gene expression in durum wheat (Triticum durum Desf) cultivars. Environ. Exp. Bot. 2009, 66, 257–264. [Google Scholar] [CrossRef]
- Blum, A. Plant Breeding for Stress Environments, 1st ed.; CRC Press: Boca Raton, FL, USA, 2018. [Google Scholar]
- Rampino, P.; Gulli, M.; De Pascali, M.; De Caroli, M.; Marmiroli, N.; Perrotta, C. Wild and cultivated Triticum species differ in thermotolerant habit and HSP gene expression. Plant Biosyst. 2019, 153, 337–343. [Google Scholar] [CrossRef]
- Bokszczanin, K.L.; Solanaceae Pollen Thermotolerance Initial Training Network (SPOT-ITN) Consortium; Fragkostefanakis, S. Perspectives on deciphering mechanisms underlying plant heat stress response and thermotolerance. Front. Plant Sci. 2013, 4, 315. [Google Scholar] [CrossRef]
- Swindell, W.R.; Huebner, M.; Weber, A.P. Transcriptional profiling of Arabidopsis heat shock proteins and transcription factors reveals extensive overlap between heat and non-heat stress response pathways. BMC Genom. 2007, 8, 125. [Google Scholar] [CrossRef] [Green Version]
- Cho, E.K.; Choi, Y.J. A nuclear-localized HSP70 confers thermoprotective activity and drought-stress tolerance on plants. Biotechnol. Lett. 2009, 31, 597–606. [Google Scholar] [CrossRef]
- Iurlaro, A.; De Caroli, M.; Sabella, E.; De Pascali, M.; Rampino, P.; De Bellis, L.; Perrotta, C.; Dalessandro, G.; Piro, G.; Fry, S.C.; et al. Drought and Heat Differentially Affect XTH Expression and XET Activity and Action in 3-Day-Old Seedlings of Durum Wheat Cultivars with Different Stress Susceptibility. Front. Plant Sci. 2016, 7, 1686. [Google Scholar] [CrossRef] [Green Version]
- Zhang, H.; Zhu, J.; Gong, Z.; Zhu, J.-K. Abiotic stress responses in plants. Nat. Rev. Genet. 2022, 23, 104–119. [Google Scholar] [CrossRef]
- Zhang, X.; Wang, X.; Zhong, J.; Zhou, Q.; Wang, W.; Cai, J.; Dai, T.; Cao, W.; Jiang, D. Drought priming induces thermo-tolerance to post-anthesis high-temperature in offspring of winter wheat. Environ. Exp. Bot. 2016, 127, 26–36. [Google Scholar] [CrossRef]
- Kuznetsov, V.V.; Rakitin, V.Y.; Zholkevich, V.N. Effect of preliminary heat-shock treatment on accumulation of osmolytes and drought resistance in cotton plants during water deficiency. Physiol. Plant. 1999, 107, 399–406. [Google Scholar] [CrossRef]
- Song, S.Q.; Lei, Y.B.; Tian, X.R. Proline Metabolism and Cross-Tolerance to Salinity and Heat Stress in Germinating Wheat Seeds. Russ. J. Plant Physiol. 2005, 52, 793–800. [Google Scholar] [CrossRef]
- Kocsy, G.; Laurie, R.; Szalai, G.; Szilágyi, V.; Simon-Sarkadi, L.; Galiba, G.; De Ronde, J.A. Genetic manipulation of proline levels affects antioxidants in soybean subjected to simultaneous drought and heat stresses. Physiol. Plant. 2005, 124, 227–235. [Google Scholar] [CrossRef]
- Szabados, L.; Savouré, A. Proline: A multifunctional amino acid. Trends Plant Sci. 2010, 15, 89–97. [Google Scholar] [CrossRef]
- Grigorova, B.; Vaseva, I.I.; Demirevska, K.; Feller, U. expression of selected heat shock proteins after individually applied and combined drought and heat stress. Acta Physiol. Plant. 2011, 33, 2041–2049. [Google Scholar] [CrossRef]
- Wang, W.; Vinocur, B.; Shoseyov, O.; Altman, A. Role of plant heat-shock proteins and molecular chaperones in the abiotic stress response. Trends Plant Sci. 2004, 9, 244–252. [Google Scholar] [CrossRef]
- Wu, J.; Gao, T.; Hu, J.; Zhao, L.; Yu, C.; Ma, F. Research advances in function and regulation mechanisms of plant small heat shock proteins (sHSPs) under environmental stresses. Sci. Total Environ. 2022, 825, 154054. [Google Scholar] [CrossRef]
- Masand, S.; Yadav, S.K. Overexpression of MuHSP70 gene from Macrotyloma uniflorum confers multiple abiotic stress tolerance in transgenic Arabidopsis thaliana. Mol Biol. Rep. 2016, 43, 53–64. [Google Scholar] [CrossRef]
- Wan, X.; Yang, J.; Li, X.; Zhou, Q.; Guo, C.; Bao, M.-Z.; Zhang, J.-W. Overexpression of PmHSP17.9 in transgenic Arabidopsis thaliana confers thermotolerance. Plant Mol. Biol. Rep. 2016, 34, 899–908. [Google Scholar] [CrossRef]
- Khurana, N.; Chauhan, H.; Khurana, P. Wheat Chloroplast Targeted sHSP26 Promoter Confers Heat and Abiotic Stress Inducible Expression in Transgenic Arabidopsis Plants. PLoS ONE 2013, 8, e54418. [Google Scholar] [CrossRef] [Green Version]
- Batra, G.; Singh Chauan, V.; Singh, A.; SarKar, N.K.; Grover, A. Complexity of rice HSP100 gene family: Lesson from rice genome sequence data. J. Biosci. 2007, 32, 611–619. [Google Scholar] [CrossRef]
- Gullì, M.; Corradi, M.; Rampino, P.; Marmiroli, N.; Perrotta, C. Four members of the HSP101 gene family are differently regulated in Triticum durum Desf. FEBS Lett. 2007, 581, 4841–4849. [Google Scholar] [CrossRef] [Green Version]
- Zandalinas, S.I.; Mittler, R. Plant responses to multifactorial stress combination. New Phytol. 2022, 234, 1161–1167. [Google Scholar] [CrossRef]
- Bates, L.S.; Waldren, R.P.; Teare, I.D. Rapid determination of free proline for water-stress studies. Plant Soil 1973, 39, 205–207. [Google Scholar] [CrossRef]
- Schmittgen, T.D.; Livak, K.J. Analyzing real-time PCR data by the comparative C(T) method. Nat. Protoc. 2008, 3, 1101–1108. [Google Scholar] [CrossRef]
- Hammer, Ø.; Harper, D.A.; Ryan, P.D. PAST: Paleontological statistics software package for education and data analysis. Palaeontol. Electron. 2001, 4, 9. [Google Scholar]
- Babicki, S.; Arndt, D.; Marcu, A.; Liang, Y.; Grant, J.R.; Maciejewski, A.; Wishart, D.S. Heatmapper: Web-enabled heat mapping for all. Nucleic Acids Res. 2016, 44, W147–W153. [Google Scholar] [CrossRef]


| Proline | CMS | RWC | |
|---|---|---|---|
| Proline | 0.010961 | 0.0076678 | |
| CMS | 0.51416 | 0.12543 | |
| RWC | −0.53064 | −0.3739 |
Publisher’s Note: MDPI stays neutral with regard to jurisdictional claims in published maps and institutional affiliations. |
© 2022 by the authors. Licensee MDPI, Basel, Switzerland. This article is an open access article distributed under the terms and conditions of the Creative Commons Attribution (CC BY) license (https://creativecommons.org/licenses/by/4.0/).
Share and Cite
De Pascali, M.; De Caroli, M.; Aprile, A.; Miceli, A.; Perrotta, C.; Gullì, M.; Rampino, P. Drought Stress Pre-Treatment Triggers Thermotolerance Acquisition in Durum Wheat. Int. J. Mol. Sci. 2022, 23, 7988. https://doi.org/10.3390/ijms23147988
De Pascali M, De Caroli M, Aprile A, Miceli A, Perrotta C, Gullì M, Rampino P. Drought Stress Pre-Treatment Triggers Thermotolerance Acquisition in Durum Wheat. International Journal of Molecular Sciences. 2022; 23(14):7988. https://doi.org/10.3390/ijms23147988
Chicago/Turabian StyleDe Pascali, Mariarosaria, Monica De Caroli, Alessio Aprile, Antonio Miceli, Carla Perrotta, Mariolina Gullì, and Patrizia Rampino. 2022. "Drought Stress Pre-Treatment Triggers Thermotolerance Acquisition in Durum Wheat" International Journal of Molecular Sciences 23, no. 14: 7988. https://doi.org/10.3390/ijms23147988
APA StyleDe Pascali, M., De Caroli, M., Aprile, A., Miceli, A., Perrotta, C., Gullì, M., & Rampino, P. (2022). Drought Stress Pre-Treatment Triggers Thermotolerance Acquisition in Durum Wheat. International Journal of Molecular Sciences, 23(14), 7988. https://doi.org/10.3390/ijms23147988