Article

Nutrient Supply Is Essential for Shifting Tree Peony Reflowering Ahead in Autumn and Sugar Signaling Is Involved

1
Beijing Key Laboratory of Ornamental Germplasm Innovation and Molecular Breeding, China National Engineering Research Center for Floriculture, College of Landscape Architecture, Beijing Forestry University, Beijing 100083, China
2
Key Laboratory of Biology and Genetic Improvement of Horticultural Crops, Ministry of Agriculture and Rural Affairs, Institute of Vegetables and Flowers, Chinese Academy of Agricultural Sciences, Beijing 100081, China
*
Authors to whom correspondence should be addressed.
These authors contributed equally to this work.
Int. J. Mol. Sci. 2022, 23(14), 7703; https://doi.org/10.3390/ijms23147703
Submission received: 6 June 2022 / Revised: 4 July 2022 / Accepted: 11 July 2022 / Published: 12 July 2022
(This article belongs to the Special Issue Recent Advances in Plant Molecular Science in China 2022)

Abstract

:
The flowering time of tree peony is short and concentrated in spring, which limits the development of its industry. We previously achieved tree peony reflowering in autumn. Here, we further shifted its reflowering time ahead through proper gibberellin (GA) treatment plus nutrient supply. GA treatment alone initiated bud differentiation, but it aborted later, whereas GA plus nutrient (G + N) treatment completed the opening process 38 days before the control group. Through microstructural observation of bud differentiation and starch grains, we concluded that GA plays a triggering role in flowering induction, whereas the nutriment supply ensured the continuous developing for final opening, and both are necessary. We further determined the expression of five floral induction pathway genes and found that PsSOC1 and PsLFY probably played key integral roles in flowering induction and nutrient supply, respectively. Considering the GA signaling, PsGA2ox may be mainly involved in GA regulation, whereas PsGAI may regulate further flower formation after nutrient application. Furthermore, G + N treatment, but not GA alone, inhibited the expression of PsTPS1, a key restricting enzyme in sugar signaling, at the early stage, indicating that sugar signaling is also involved in this process; in addition, GA treatment induced high expression of PsSnRK1, a major nutrient insufficiency indicator, and the induction of PsHXK1, a rate-limiting enzyme for synthesis of sugar signaling substances, further confirmed the nutrient shortage. In short, besides GA application, exogenous nutrient supply is essential to shift tree peony reflowering ahead in autumn under current forcing culture technologies.

1. Introduction

Tree peony (Paeonia sect. Moutan) is a traditional woody plant and the candidate national flower of China, which is generally attracting people worldwide because of its abundant flower types and gorgeous colors. All nine wild-tree peony species are native to China, with ornamental, cultural, and economic value. Take Heze, one of the main tree peony producing cities in China as an example, its total output value of tree peony industry exceeded CNY 9 billion (about USD 1.4 billion) in 2020 [1]. However, the short flowering period and single-season flowering seriously limited its current industrialized production. Prolonging the flowering period or achieving multi-season flowering is a hot spot in tree peony research. In our previous studies, we achieved tree peony reflowering in autumn and winter through variety selection and forcing cultivation improvements [2,3]. Based on these works, most tree peony cultivars showed good reflowering performance in winter, but the reflowering in autumn still showed strict variety specificity, and further shifting the reflowering time is also very difficult [2,4]. The full differentiation and formation of flower buds in plants is the key step for flowering, and determining this process in tree peony will be helpful for understanding its reflowering mechanism.
In order to reveal the molecular mechanism of the flowering process in higher plants, scientists isolated a large number of early and late-flowering mutants from Arabidopsis and some other plants, and identified a serious of flowering-regulation genes. Based on these studies, the overall flowering pathways can be classified into three categories: photoperiod pathways, including light quality, light intensity and circadian clock; plant internal signaling pathways, including plant hormones, such as gibberellins (GAs), nutrients, such as sugars, nitrogenous compounds, etc., and aging; other pathways, including autonomic, vernalization, and ambient temperature pathways [5,6,7,8,9,10]. Among them, FLOWERING LOCUS T (FT), SUPPERSSOR OF CONSTANS OF OVEREXPRESSION1 (SOC1), and LEAFY (LFY) have been proven to be integration factors in various flowering pathways [11]. These genes were also confirmed to be involved in the regulation of tree peony reflowering in autumn according to our previous work [12]. Furthermore, APETALA1 (AP1), which functions downstream in the floral regulation pathway, regulates both the transformation of inflorescence meristems to floral meristems and the morphological development of floral organs [13], which is activated by the combined action of FT and LFY in Arabidopsis [14]. Besides positive regulation, some genes are also reported to inhibit floral formation, such as SHORT VEGETATIVE PHASE (SVP), which plays an important role in the ambient temperature flower-forming pathway for the vegetative growth phase [15].
Flowering is adaptable to environmental conditions, and it is completed under a complex floral regulation network formed by a variety of exogenous and endogenous signals. As one of the most important endogenous signals, plant hormones, including GA, play an important role in the process of flower formation. The GA pathway is one of the earliest-discovered flower formation pathways, and with regarding to transcriptional level, GA INSENSITIVE DWARF 1 (GID1), GA20 Oxidase (GA20ox), GA3 Oxidase (GA3ox), GA2 Oxidase (GA2ox), and GA INSENSITIVE (GAI) are considered as major regulatory factors [16]. In rice, GID1 is the only GA receptor discovered to date. When the self-synthesized endogenous GAs or exogenous GAs are combined with GID1, they can jointly degrade the DELLA protein through the ubiquitination pathway, thereby regulating downstream genes [17,18]. As one of the DELLA genes, GAI mediates the transduction of the GA signal [19]. The pathways of GA biosynthesis and metabolism are catalyzed by three enzymes, namely, GA20ox, GA3ox, and GA2ox [16]. Under the regulation of these three enzymes, the dynamic balance of active gibberellin is well maintained.
In addition to plant hormones, sugar is an important signal compound in many plants. In the sugar signal pathway, trehalose-6-phosphate (T6P) is considered as the most critical signal molecules in the process of plant growth and development, participating in flower induction and floral organ development, and trehalose-6-phosphate synthase (TPS) is a key enzyme that restricts T6P biosynthesis [20]. Sucrose non-fermenting-1-related kinase 1 (SnRK1), another key signal component in the sugar signal pathway, responds to changes in nutrient levels in many plants, such as Arabidopsis [21], tomato [22] as well as tree peony, as we reported previously [3]. SnRK1 is active at low nutrient levels, and mainly inhibits the biosynthesis process and plant growth [23]. Hexokinase1 (HXK1), as another key factor in the sugar signal pathway, converts glucose into glucose-6 phosphate and participates in the process of intracellular sugar signal transduction [24].
Tree peony ‘Qiu Fa No. 1’ is one of our previously selected cultivars with good autumn-reflowering characteristics, and GA treatment induced its bud development in autumn, but the bud failed to bloom [2]. We speculated this may be due to nutritional deficiency; thus, in this study, we used tree peony ‘Qiu Fa No. 1’ as the material and treated it with GA and a water-soluble fertilizer as the nutrient supply in autumn, but earlier than before (detailed in Materials and Methods), to further shift the flowering time under current forcing culture conditions [4]. We observed the morphological and microstructural changes in buds, determined GA3 content and the expression of genes related to floral induction, GA signaling, and the sugar signal pathway. This work may provide a theoretical reference for improving current tree peony forcing culture technology to achieve annual flowering with better quality.

2. Results

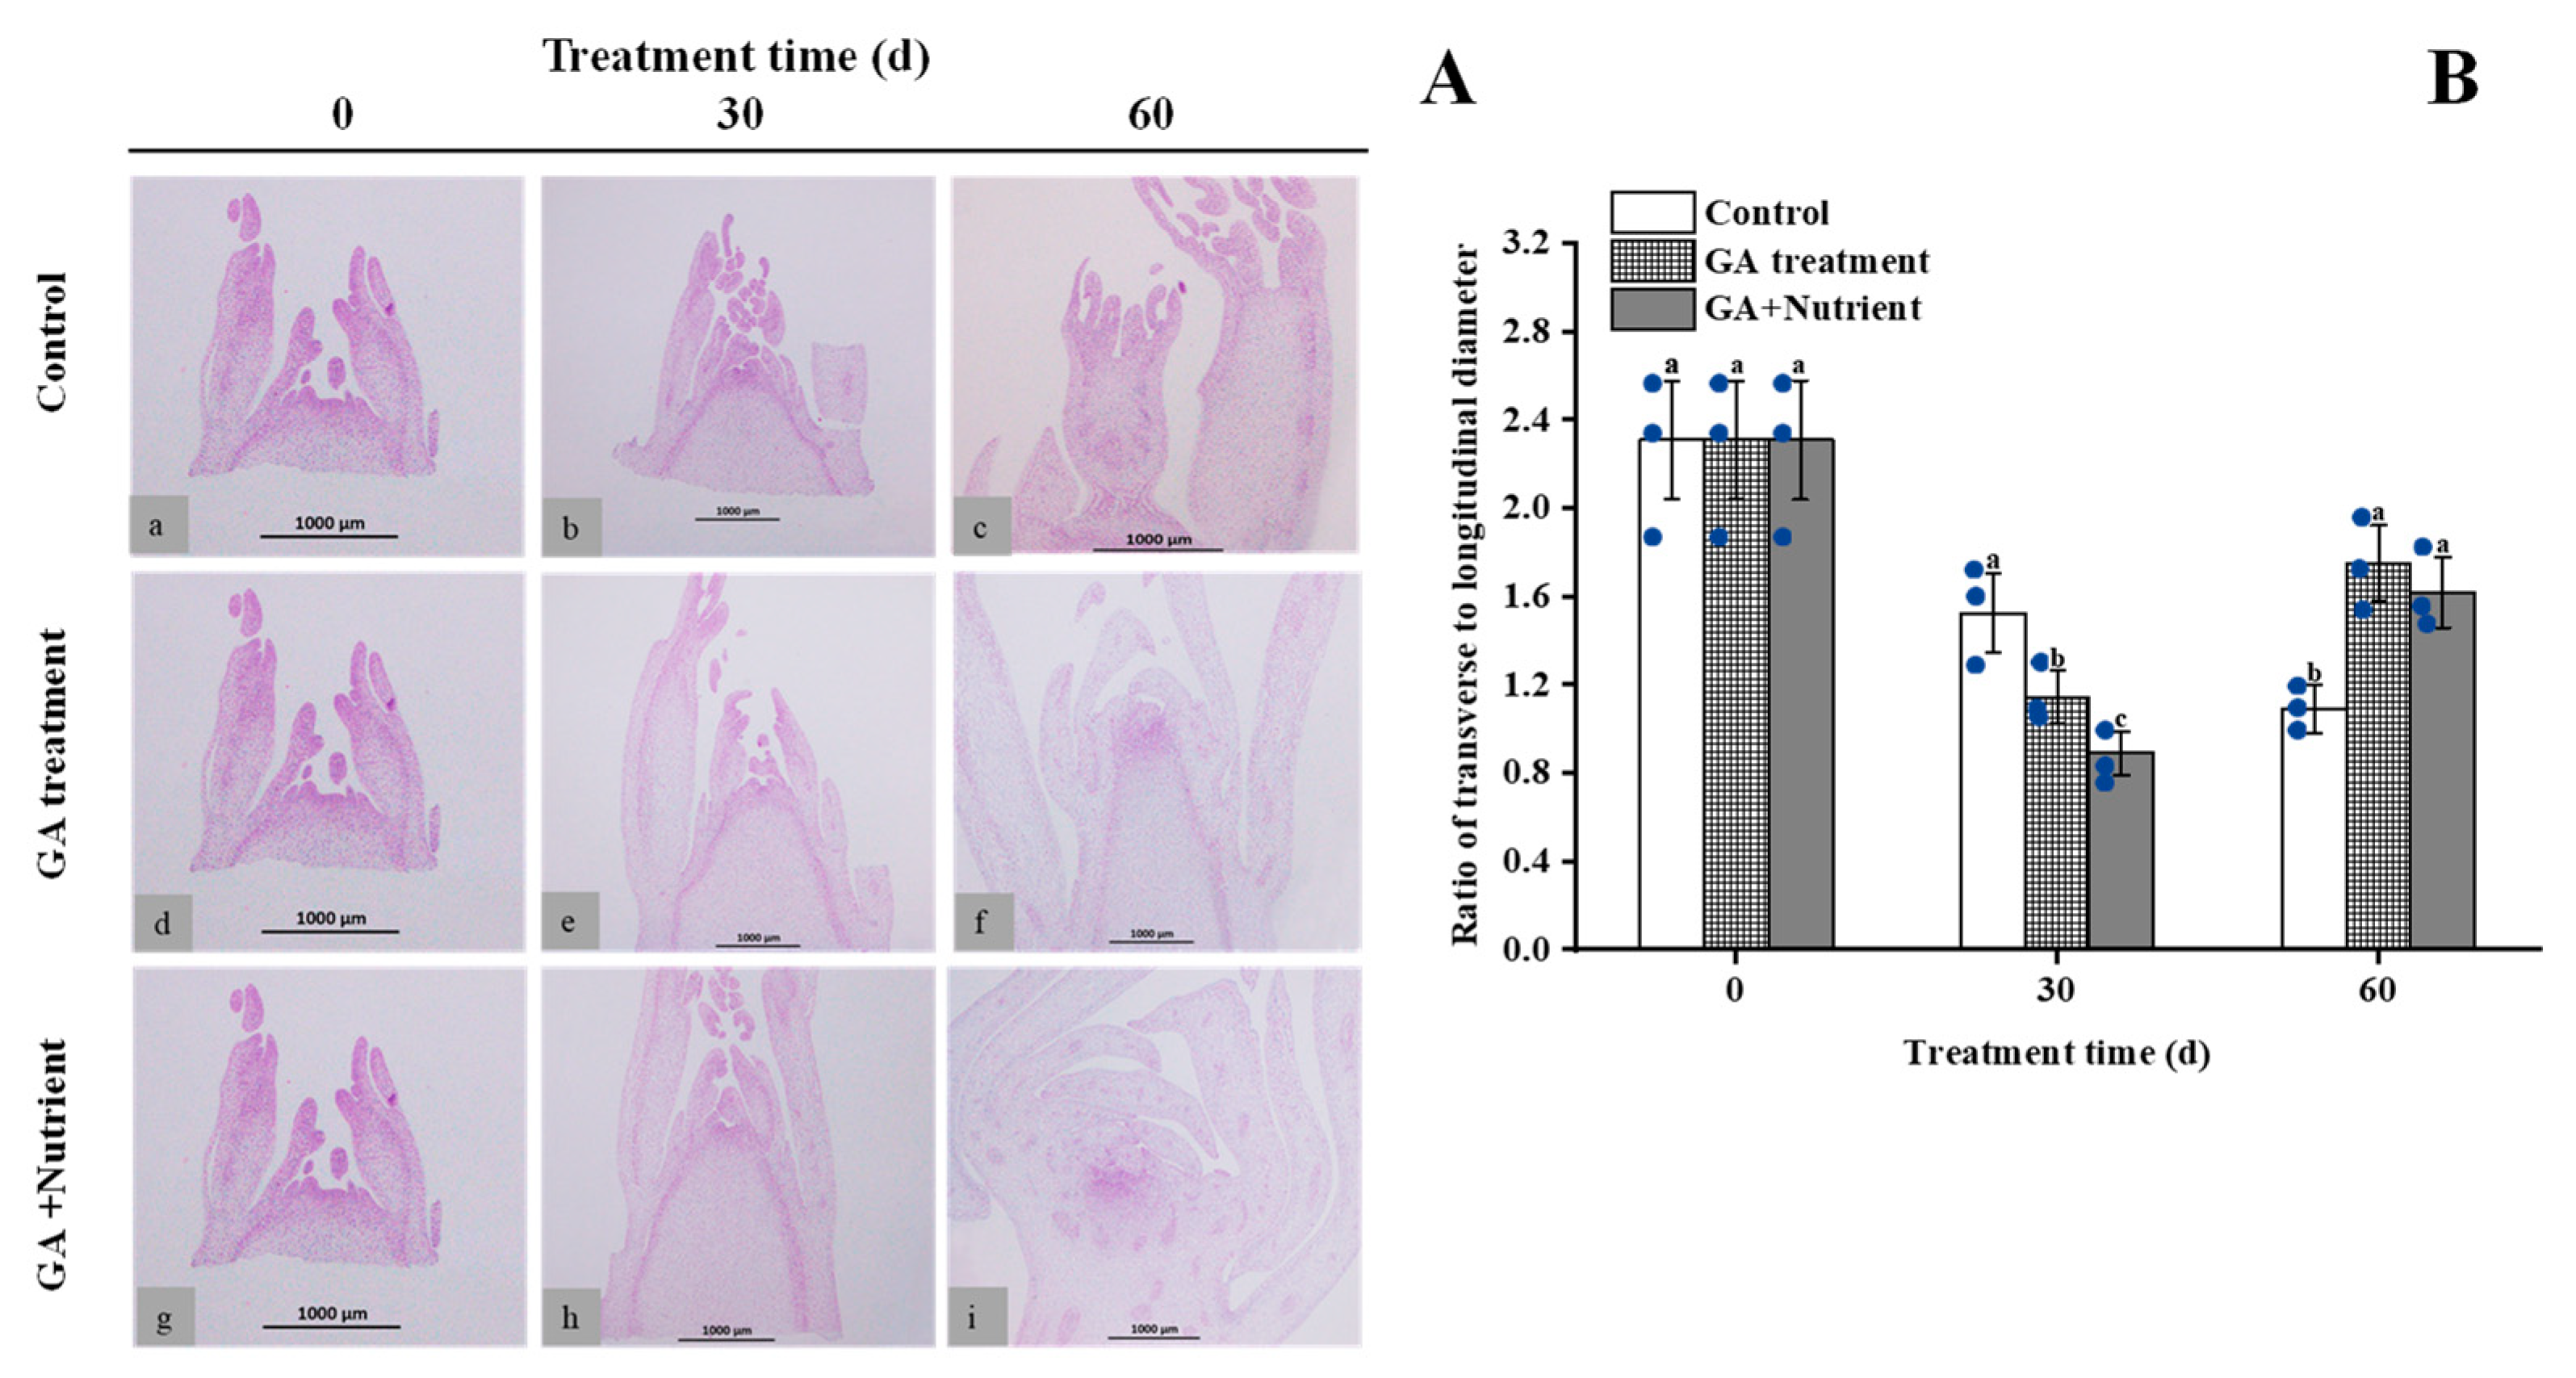
2.1. Effects of Different Treatments on the Morphological Changes in Tree Peony Flower Buds during Growth and Development

In this study, we first determined the monthly environmental parameters in the nursery during the experimental period, including temperature, light, and humidity (Figure S1). Then, we recorded the effects of different treatments on the morphological changes in flower buds from 0 to 90 d. The results showed that in the control group, the flower buds increased slowly from 0 to 60 d and formed a hard bud at 90 d. In the GA treatment group, the flower buds were significantly enlarged at 30 d, especially the horizontal diameter, and germinated at 45 d. The buds developed into small-sized budlets at 60 d but eventually aborted at 90 d. In the G + N treatment group, the bud development showed a similar trend to the GA treatment group during the first 45 d, continuously enlarged until 60 d, and finally flowered at 90 d, which was 38 d earlier than the control with the flowering rate of 62.6% (Figure 1 and Table S1).
We then observed the internal microstructure of buds through paraffin sections. The results showed that in the control group, the buds underwent continuous growth and development from 0 to 60 d, from undifferentiated to the bract primordium stage. After GA treatment, the bud growth accelerated, and reached the sepal primordial stage at 60 d. The G + N treatment also promoted bud differentiation, the buds developed into pistil primordial stage at 60 d, and the entire bud differentiation was completed (Figure 2A). We also statistically analyzed the ratio of the transverse to the longitudinal diameter of the buds. In the control group, this ratio decreased consistently, from 2.3 at 0 d to 1.1 at 60 d; in both the GA and G + N groups, this decrease was significantly slower by 60 d, with average ratios of 1.8 and 1.6, respectively (Figure 2B).

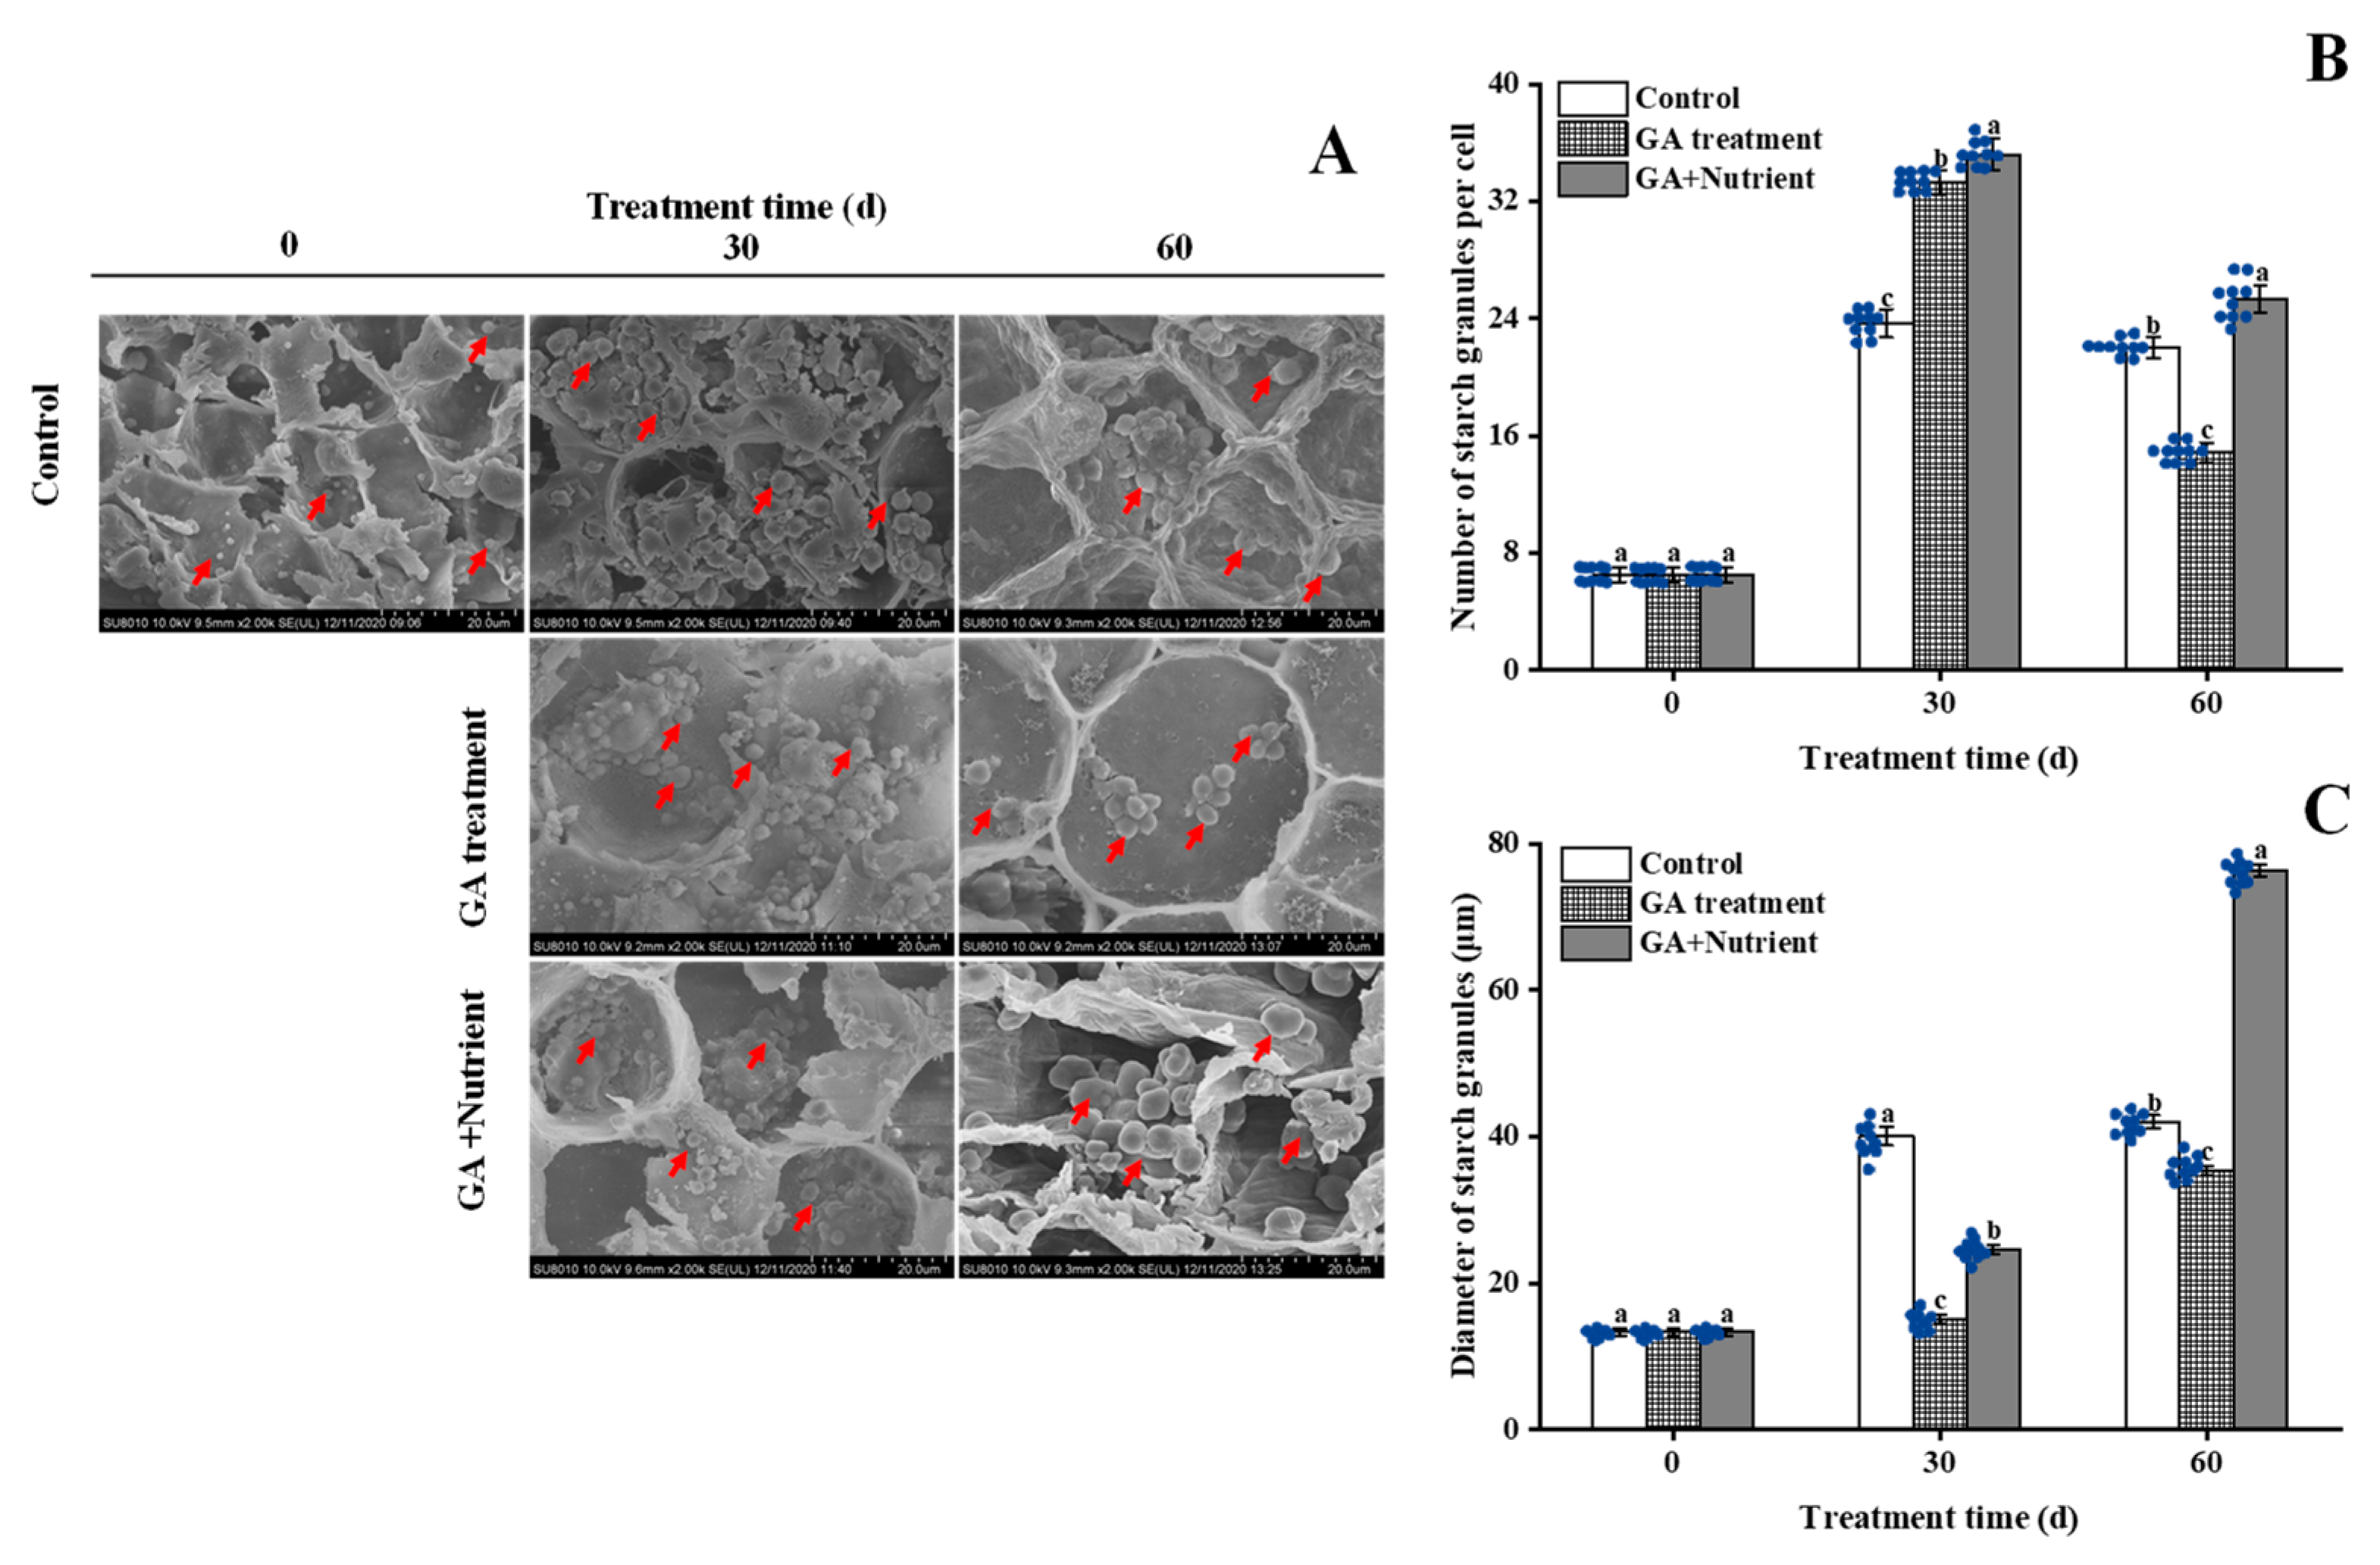
2.2. Effects of Different Treatments on the Starch Metabolism in Tree Peony Buds

In our previous study, we found that under the forcing culture conditions in autumn, flower buds need to continuously consume starch stored in cells during the dormancy release process [4]. In the present study, the starch granule number significantly increased in all three groups at 30 d, with the higher numbers in the GA and G + N treatment groups; after that, the starch granule number in both the GA and G + N treatment groups decreased at 60 d, especially in the GA treatment group, whereas in the G + N group, this number was still greater than that in the control group (Figure 3A,B). The size of the starch granules increased 3.1 times in the control group at 30 d and remained constant at 60 d; this increase was delayed in both the GA and G + N treatment groups, and in the G + N group, the starch granule diameter sharply increased to 76.3 μm, which far exceeded that of the other two groups (Figure 3C).

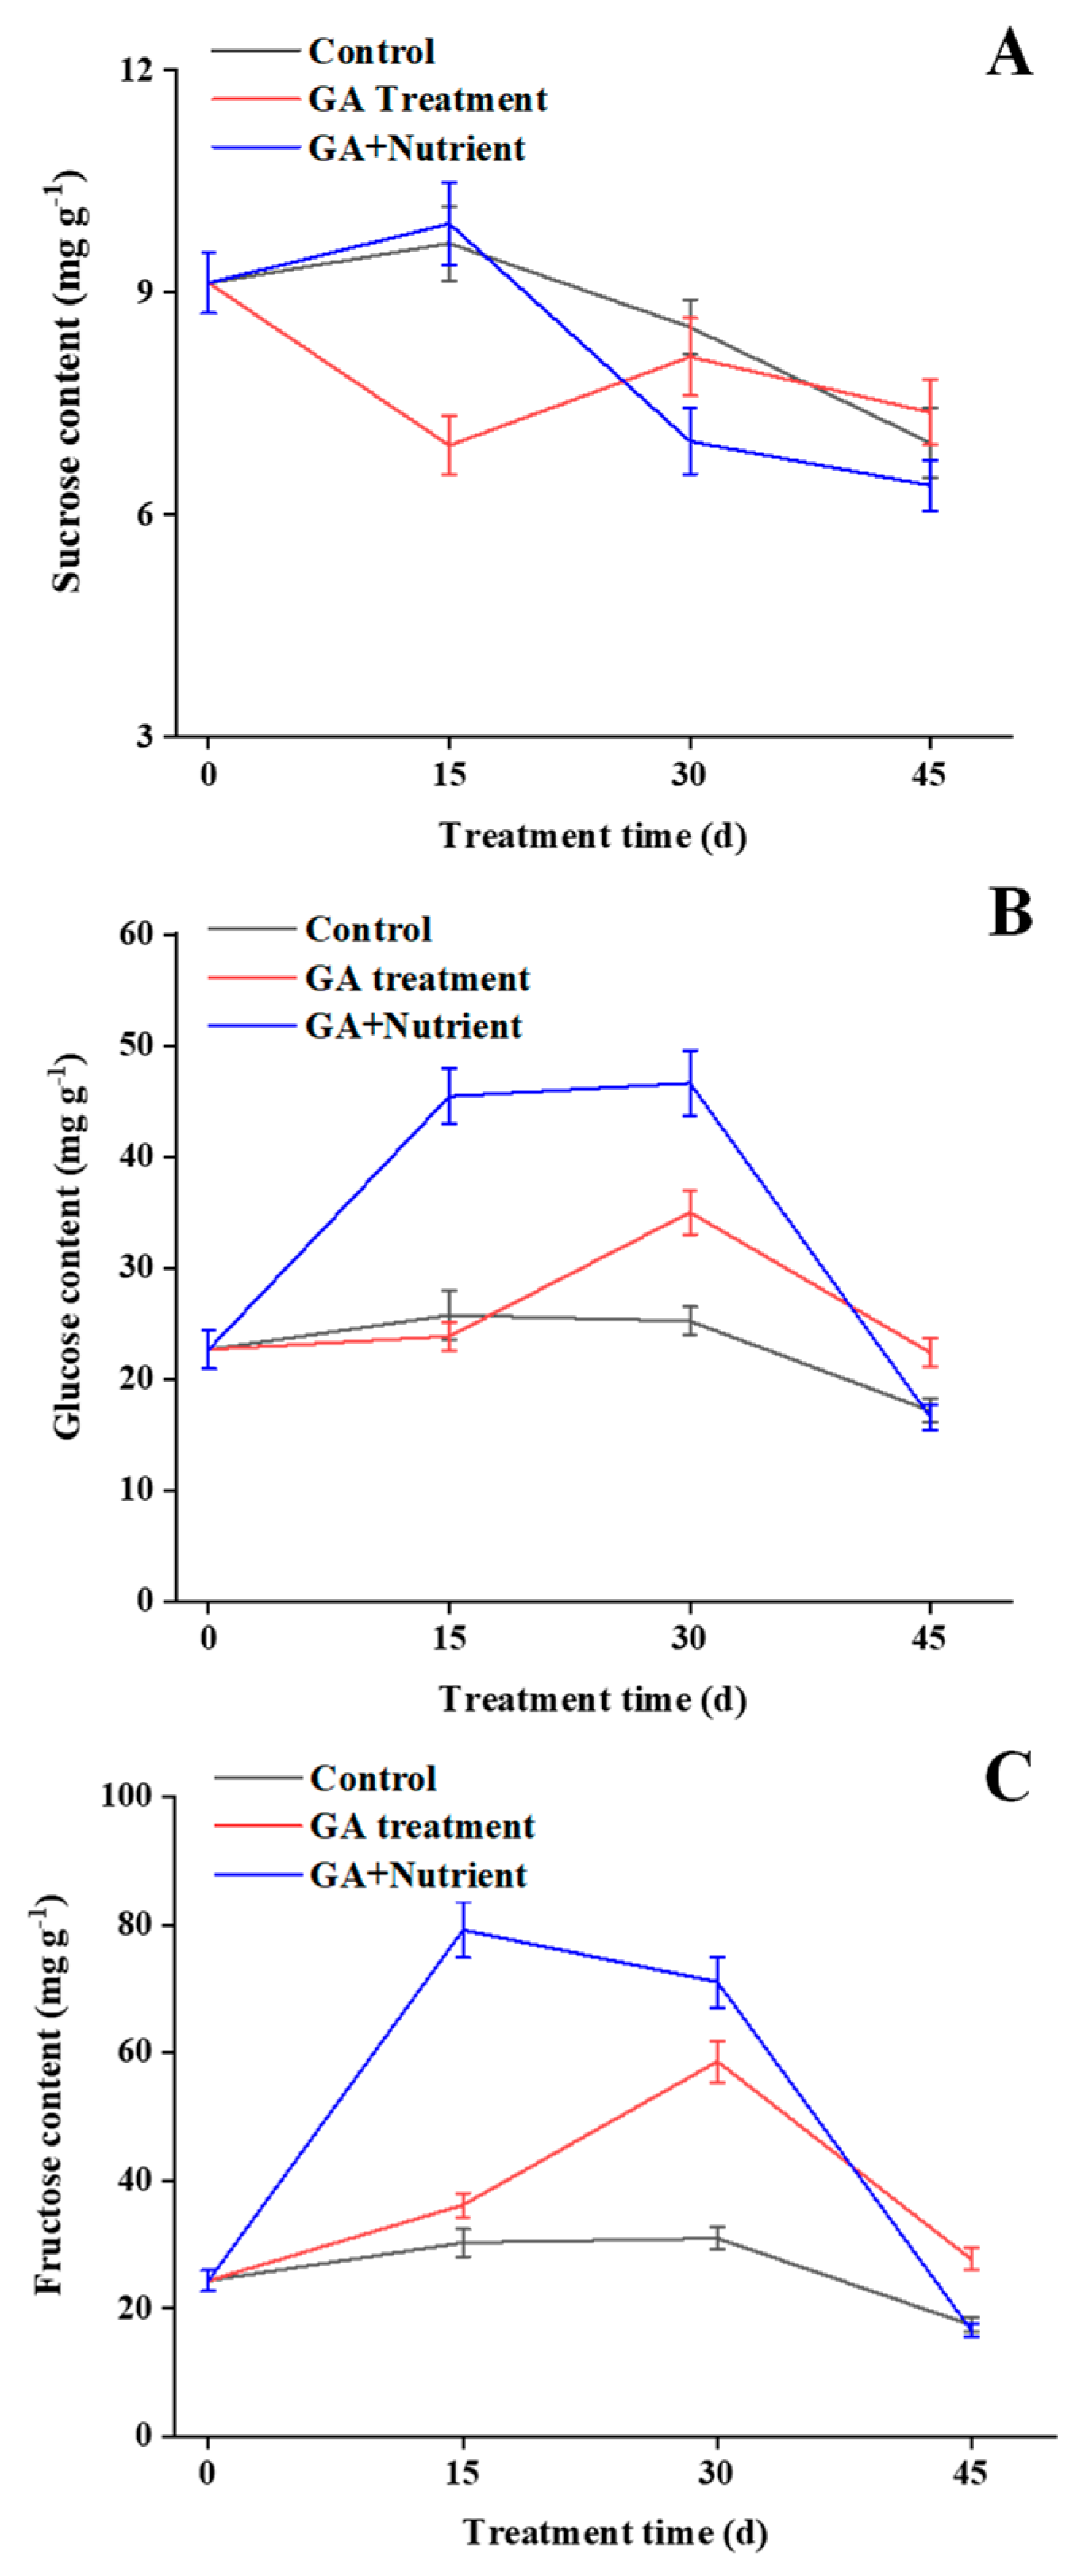
2.3. Effects of Different Treatments on Soluble Sugar Content in Tree Peony Buds

The sucrose content in the control group increased at 15 d, and then declined after that; in the GA treatment group, its level decreased at 15 d, and then slight recovered; the G + N group showed a similar trend to that of the control group, with the lower level at 30 d (Figure 4A). The glucose and fructose content showed a similar trend: in the control group, their content remained relatively stable in the first 45 d, and had a slight drop after that; GA treatment dramatically induced their content at 30 d, whereas in the G + N group, this inducing advanced their content to 15 d, with a higher level (Figure 4B,C).

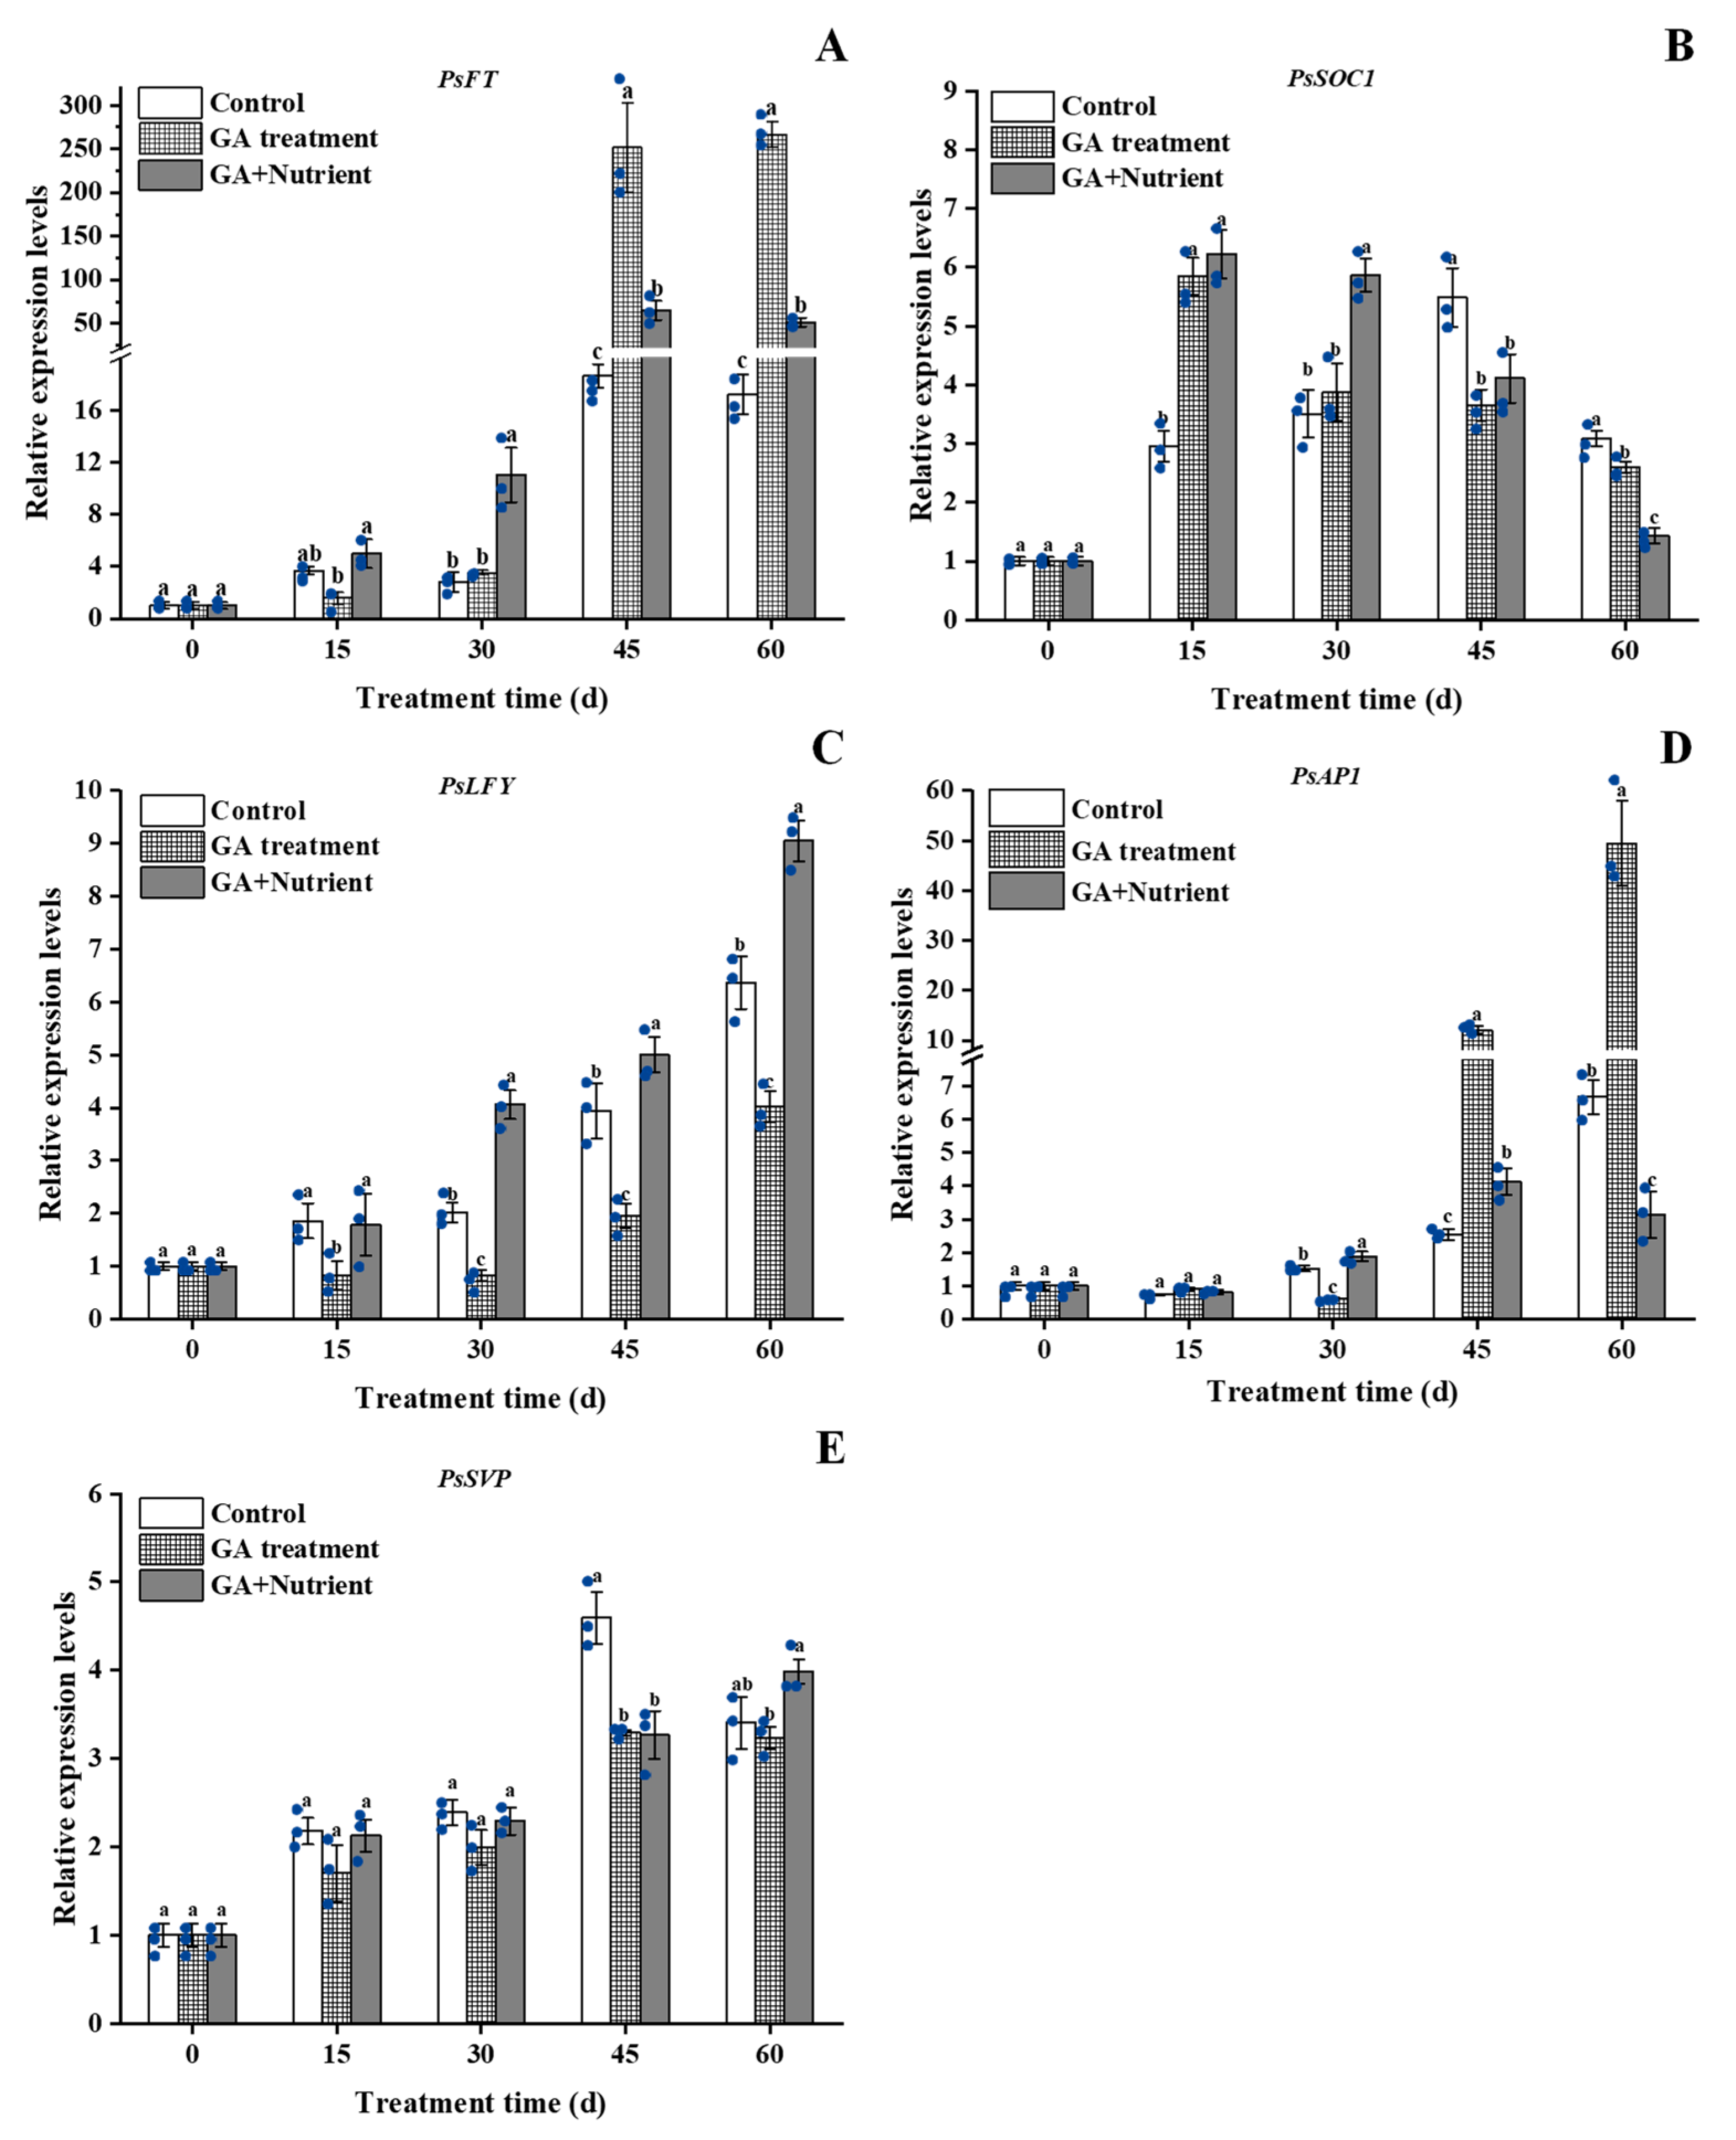
2.4. Effects of Different Treatments on the Expression of Related Genes in Tree Peony Flower Buds during Growth and Development

2.4.1. Floral Pathway-Related Genes

In this study, the expression of PsFT in the control group was relatively low in the first 30 d, then significantly increased from 45 d onward. This increase was dramatically enhanced in the GA treatment at 45 d, at 13.5 times that of the control group. In the G + N treatment, this increase was advanced to 30 d, although the expression of PsFT was lower than that in the GA treatment group at 45 and 60 d (Figure 5A). The expression of PsSOC1 showed a single-peak trend in the control and peaked at 45 d; both the GA and G + N treatment groups advanced this peak to 15 d, and this level was maintained to 30 d in the G + N group (Figure 5B). In contrast, the expression of PsLFY continuously increased in all three groups; its expression in the GA treatment group was lower than that in the control group at all the sampled time points, and its level in the G + N group was greater than that in the control from 30 to 60 d (Figure 5C). The expression of PsAP1 slightly increased during the bud growth process, with an obvious increase at 60 d. The GA treatment significantly increased the level of PsAP1 at both 45 and 60 d, especially at 60 d, in which expression was 49.5 times that of the expression at 0 d (Figure 5D). The expression of PsSVP exhibited a single-peak curve in the control group, which reached the maximum at 45 d; both the GA and G + N treatment groups had a lower level at 45 d, and its level continued to increase in the G + N group, which surpassed the control group at 60 d (Figure 5E).

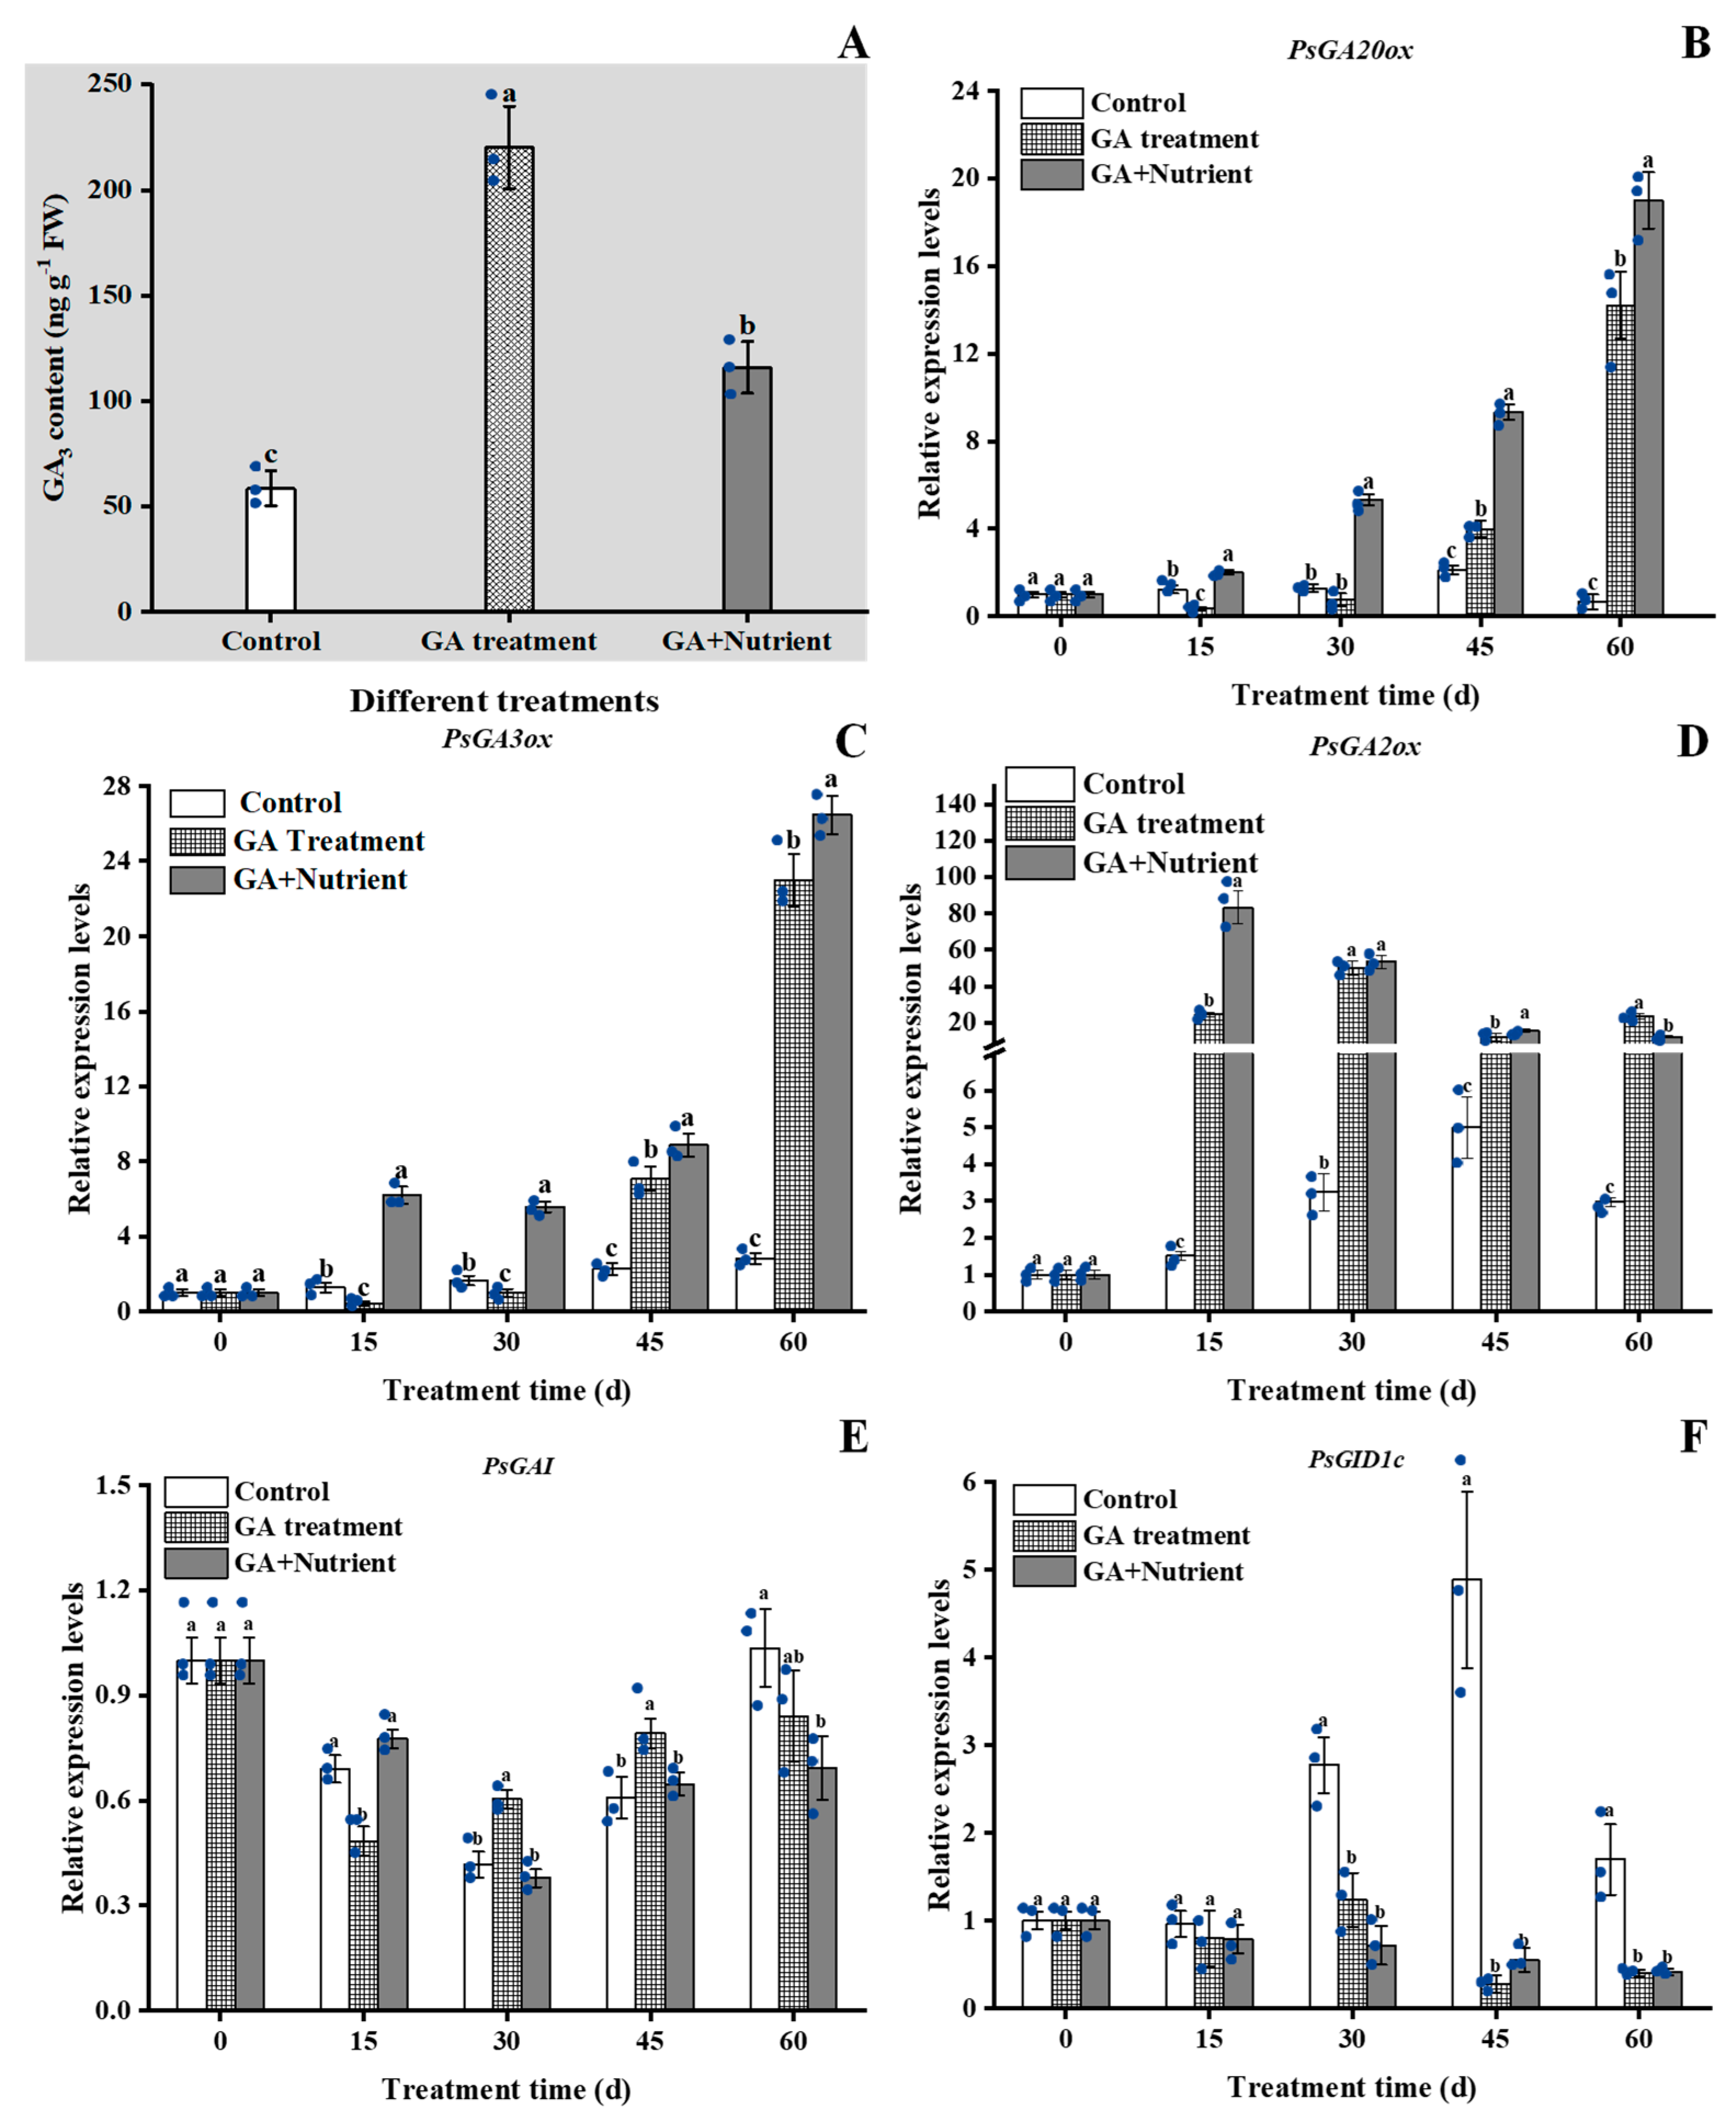
2.4.2. GA Signal Pathway-Related Genes

In order to clarify the effects of different treatments on the expression of GA signal genes, we first measured the GA3 content at 15 d and found that GA treatment and G + N increased it by 3.76 and 1.98 times, respectively (Figure 6A). We then determined the expression of five related genes. As one of the key genes for bioactive GA synthesis, PsGA20ox expression remained low in the control group; in GA treatment group, its expression was significantly induced from 45 d and increased to an extremely high level at 60 d. Similarly, its expression was also induced by G + N, but much earlier from 15 d (Figure 6B). For PsGA3ox, its expression pattern was similar to that of PsGA20ox, whereas the expression in G + N group induced much greater at 15 d (Figure 6C). The expression of PsGA2ox in the control group was also low throughout the process, while the GA and G + N treatments significantly increased its expression at 15 d by 24.4 and 83.3 times, respectively, and the level in the G + N group began to fall, but it remained greater than that of the control until the end of the experiment (Figure 6D). The expression of PsGAI showed a similar trend in all three groups, with the expression level in the GA treatment group greater than that of the other two groups at 30 and 45 d (Figure 6E). The expression of PsGID1c increased from 30 to 45 d in the control group. Both the GA and G + N treatments inhibited this increase, and the expression remained at a similar level during all the sampling periods in both groups (Figure 6F).

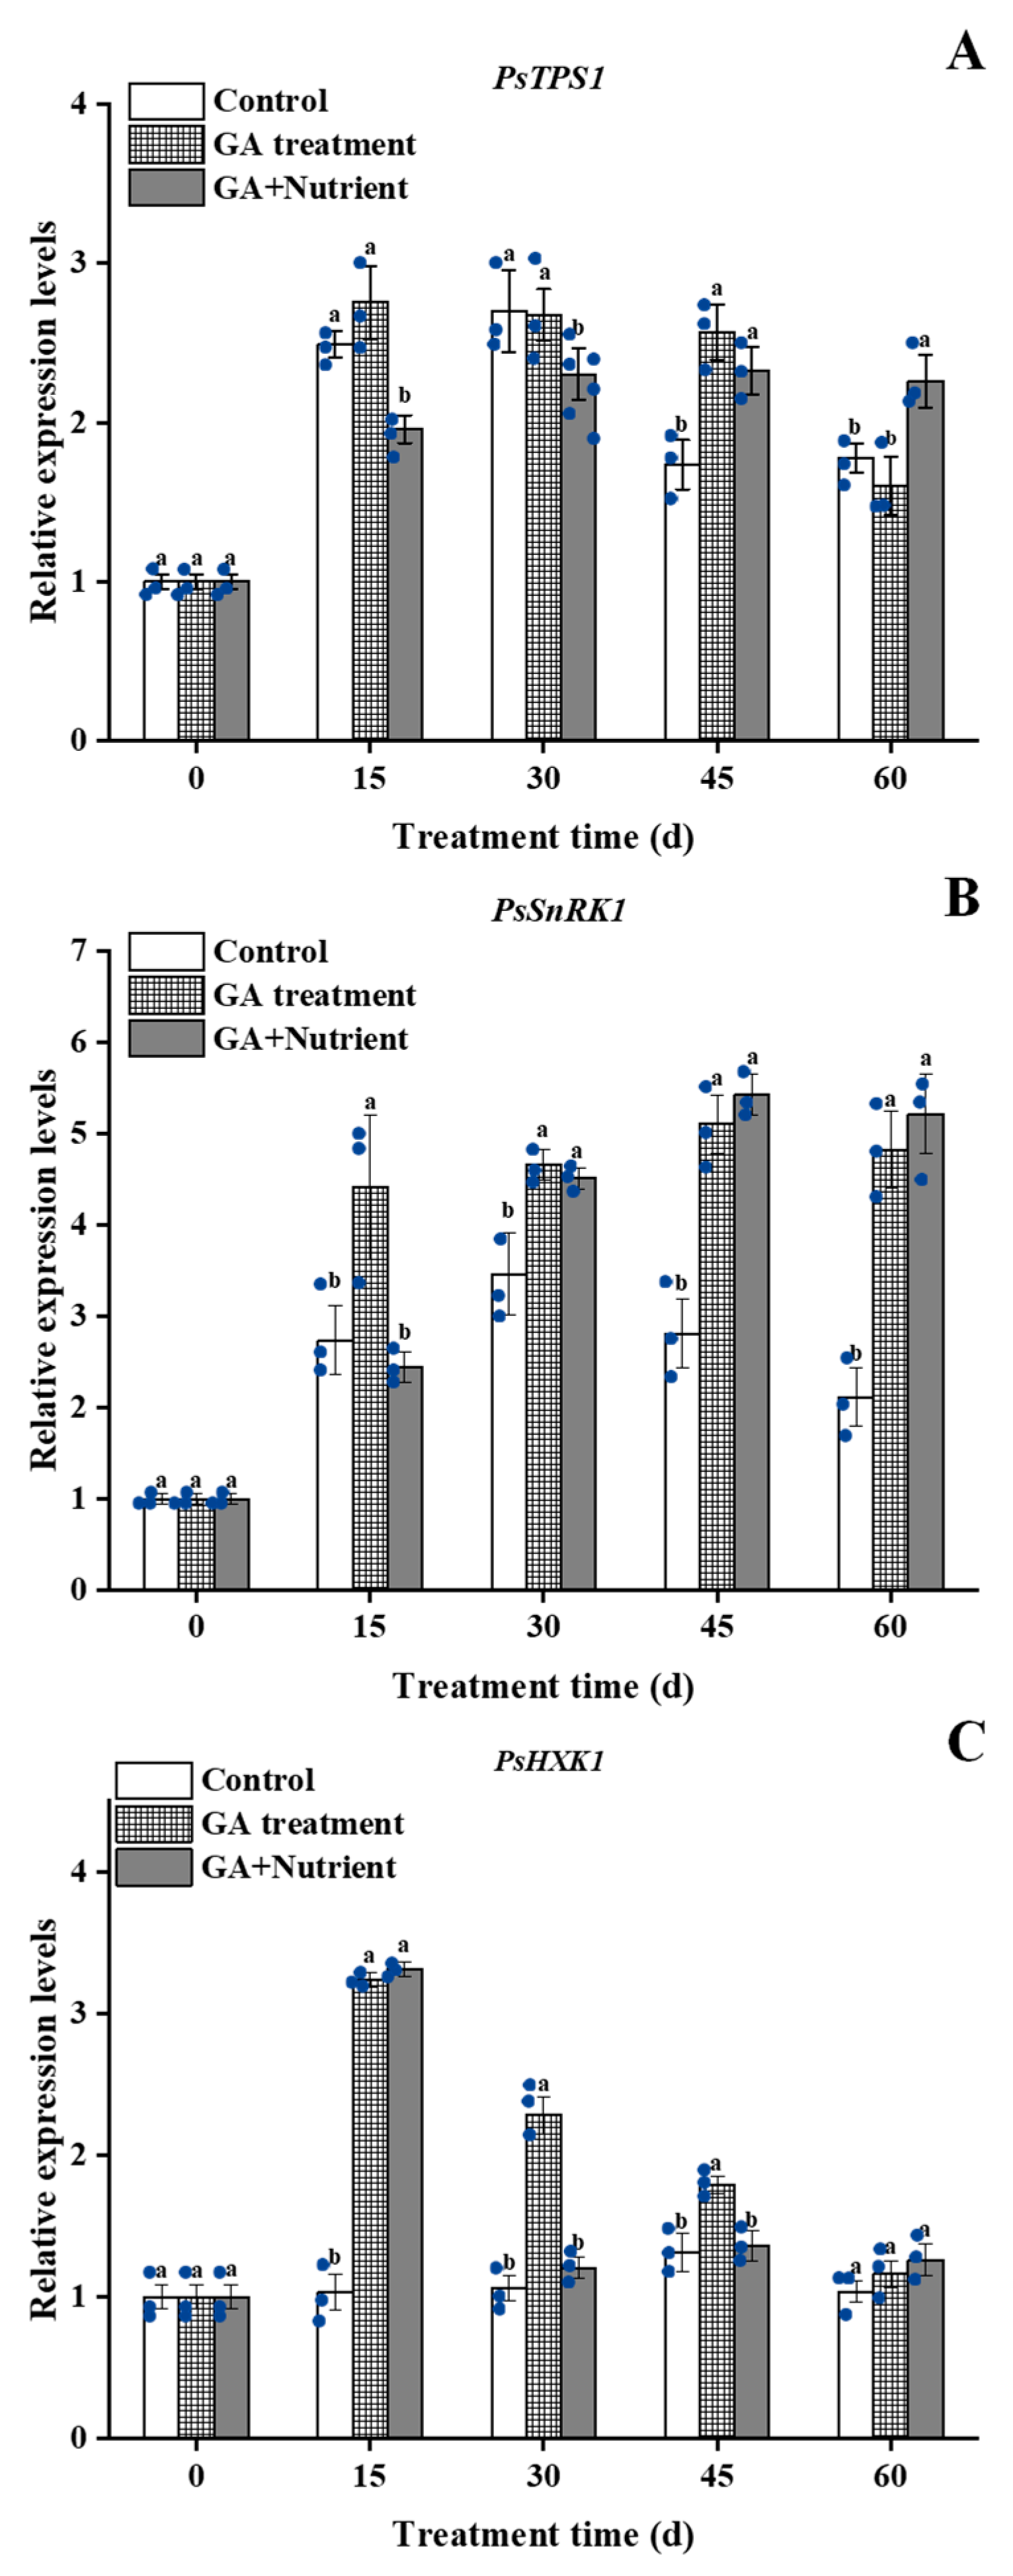
2.4.3. Sugar Signal Pathway-Related Genes

Sugar has been confirmed as a new signal substance in recent years. In this study, we also determined the expression of three signal pathway-related genes. The results showed that the expression of PsTPS1 increased in all three groups from 15 d; this increase began to decline at 45 d and 60 d in the control and GA treatment groups, respectively, whereas no decline occurred in the G + N group (Figure 7A). The expression of PsSnRK1 showed a single-peak curve, and the GA and G + N treatments increased its expression from 15 d and 30 d, respectively (Figure 7B). The expression of PsHXK1 was stable in the control group, whereas both the GA and G + N treatments significantly increased its expression with similar levels at 15 d, and in the G + N group, its expression rapidly declined after that (Figure 7C).

3. Discussion

Tree peony is an important woody ornamental plant that originated in China and has undergone more than 1500 years of artificial cultivation to prolong its flowering period and achieve multi-season flowering. However, there are still some obstacles to achieving tree peony annual flowering under current technologies, such as poor flowering quality and severe cultivar dependence. ‘Qiu Fa No. 1’ is one of our preferred tree peony cultivars for forcing culturing. This cultivar can reflower in late September in north China, but earlier reflowering is still difficult to achieve [2].
GA is an important plant hormone that participates in regulating a variety of growth and development processes, especially flower induction and floral organ development. In woody fruit trees, flower bud differentiation is significantly inhibited when sprayed with GA during the flower induction period [25,26]. In LA lily, GA treatment breaks the bulb’s dormancy and significantly accelerated the flowering process [27]. In rose, spraying different concentrations of GA promotes plant height, flower branch length, and flower stalk length to varying degrees, and caused the plants to bloom earlier [28]. In tree peony, applying GA to help relieve the dormancy of flower buds and promote flowering has become a common method for the off-season regulation of pot flower production [3,29]. In this study, the results showed that GA treatment significantly promoted the differentiation and growth of buds. Since the plant may not have enough nutrients for development after GA treatment, we further applied fertilizer with GA, and this combined treatment achieved the reflowering of tree peony 38 d ahead of the control group (Figure 1A and Table S1). According to the microstructure observation, the application of GA treatment alone induced the differentiation of bract primordium at 15 d (Figure 2A), and the G + N treatment sustained further development to final flowering. These results indicated that GA played a motivating force in flowering induction and that fertilizer supply ensured continuous bud development to flowering. As this is insufficient, our results lack the comparation of nutrient contents in soil between control and G + N treatment, although the initial condition of the soils is exactly the same, which will be studied in detail in our further work.
In higher plants, flower formation is involved in multiple pathways, forming a complex regulatory network. As an important endogenous hormone, GA promotes flowering mainly by relieving the inhibitory effect of some genes. In general, GA promotes the expression of integration genes in the floral pathway, such as SOC1, FT, and LFY, which also inhibit the expression of temperature-sensitive pathway-related genes, of which SVP is a typical example [30]. In Arabidopsis, both FT and SOC1 are significantly induced by GA under short-day growth conditions, and histochemical analysis shows that GA promotes the expression of FT and SOC1 in leaves and stem tips. Furthermore, GA application promotes the expression of LFY under short-day conditions [31], or upregulates LFY through SOC1, which in turn promotes the expression of AP1, and ultimately promotes flowering. In contrast, some studies have shown that GA induces a regulatory mechanism by promoting the expression of LFY, which can reduce the content of active GA and delay the formation of floral organs [32]. In Sinapis alba, SaMADS, the homologous gene of SOC1, begins to express in the shoot tip and gradually increases after 8 h of GA treatment [33]; in ‘Fuji’ apple (Malus domestica Borkh.), the expression of MdSOC1 is induced by GA3 application at 27 d [34]. In our study, among the five flowering pathways-related genes, PsSOC1 was first induced by GA treatment at 15 d, indicating that PsSOC1 probably played a key integration role in GA-induced bud differentiation and development. In the G + N combination treatment, PsFT and PsLFY were induced at 30 d, especially the latter, which not only inhibited the inhibitory expression caused by GA in the later period (60 d), but also exceeded the control during the same period. For the morphological changes, GA treatment alone resulted in the abortion of flower buds, which was consistent with the result in many woody fruit trees [25,26]. In terms of transcriptional expression, GA treatment significantly inhibited the expression of PsLFY, which was consistent with the inhibition of PpLFY by spraying GA during the flowering induction period of peaches [26]; we also found that fertilizer could reverse GA’s inhibition of PsLFY expression. All these results indicated that PsLFY played an important role in the response to fertilizer treatment at the late stage of flower bud development. Interestingly, at 45 and 60 d, we found that G + N contrasted with GA treatment in PsFT and PsAP1 expression. This may be due to AP1 as a downstream gene of FT, whose expression was affected by FT [14], whereas the different developmental stage of buds between them may also be as one of the reasons for their contrasted expression.
In plants, GA regulates growth and development through biosynthesis and signal transduction. In Arabidopsis, GA20ox and GA3ox promote flowering, whereas external application of GA downregulates their expression. In apple, during the induction of flower bud differentiation, the expression levels of all four MdGA2ox genes are upregulated after GA treatment [35]. In LA lily, the expression of GA2ox is significantly induced after spraying exogenous GA, indicating that GA2ox has a positive feedback on GA [27]. In Brassica napus, the expression of BnGID1a is downregulated by GA treatment, showing that BnGID1a may be negatively regulated by GA [36]. In Arabidopsis, GAI, as one of the DELLA genes, mediates the transduction of GA signaling and acts as a negative regulator of GA signaling [37]. To better understand the action mode and regulation mechanism of GA signaling, this study also analyzed the expression of five genes during the process of flower bud differentiation and growth in tree peony. We found that fertilizer reverse the decreasing expression of both PsGA20ox and PsGA3ox by GA treatment. Combined with the results of GA3 content and PsGA2ox expression at 15 d, it could be inferred that GA treatment induced the production of endogenous GA, whereas high expression of PsGA2ox was initiated to maintain the balance of bioactive gibberellin. These results indicated that PsGA2ox may be mainly involved in GA regulation. In addition, GA treatment reduced the expression of both PsGA20ox and PsGA3ox at 15 d and 30 d, which may be viewed as negative feedback. Since the regulation of GA biosynthesis showed us a huge and complete network, some other factors may also be involved in this process, although more direct evidences is still needed. The rapid decrease in the expression of PsGAI caused by GA treatment at 15 d was delayed in the G + N group, indicating that PsGAI may regulate further flower formation after fertilizer application. The expression of PsGID1c was significantly downregulated after 30 d in both GA treatment and G + N groups, which may have a certain relationship with the induction of PsGA2ox and GA3 content with negative feedback. By comparing the gene expression between floral pathway and GA signal pathway, we found that the over-expression of most floral pathway-related genes was later than that of GA signaling-related genes, which might be due to the GA signaling-related genes being on the upstream of the floral pathway related genes according to the flower induction network regulation model [29].
The sugar signal pathway, especially the TP6-SnRK1 interaction model, has an important regulatory role in stress responses and plant life activities [38]. T6P, as both a nutrient substance and a signaling molecule, regulates the formation of flowers, whose biosynthesis is regulated by TPS1 [7]. In Arabidopsis, the high expression of TPS1 increases the content of T6P and promoted flower formation [39]; in addition, the TPS1 also impacts the vegetative phase change in Arabidopsis, and the loss-of-function of TPS1 mutant shows a significant delay in the vegetative phase [40]. In our study, G + N treatment, but not GA treatment alone, inhibited the expression of PsTPS1 at 15 and 30 d, which may give the bud more time to remain in vegetative phase for nutrient accumulation before flowering. Nevertheless, we speculated that fertilizer may play a key role in sugar signaling induction for tree peony reflowering in autumn.
SnRK1 plays an important role in nutrient perception and stress response. It can reduce metabolic activities under adverse conditions and improve environmental adaptability. At the same time, SnRK1 also participates in the coordination of carbohydrates between the ‘source’ and ‘sink’ to ensure the reasonable distribution and utilization of nutrients. Furthermore, SnRK1 is generally considered to be a negative factor regulating growth [41]. In tomato, overexpression of the SnRK1 gene from apple results in the hindrance of carbohydrate utilization, and the growth of the main shoots is obviously inhibited [22]. In peach, to explore the regulatory role of PpSnRK1 during the flowering process, the gene PpSnRK1 overexpression caused a significant delay in the flowering period [42]. In Arabidopsis, silencing the SnRK1.1 and SnRK1.2 genes results in early flowering of the plant [23]. In this study, GA treatment fast-induced a high expression of PsSnRK1 at 15 d, whereas G + N had no such effect, This result indicates GA may cause nutrient deficiency during the triggering of bud sprouting, which may damage its further development. The sugar content at 15 d indicated that GA treatment consumed sucrose but did not increase the content of glucose and fructose, resulting in nutrient deficiency. In response to the stress, it induced PsSnRK1 expression and reduced the nutrient demand. In G + N treatment, the fertilizer provided more nutrients, and as a signal, the expression of PsSnRK1 decreased.
Studies have shown that HXK1, as a sugar transport signal, can inhibit plant growth. In transgenic tomato, overexpression of AtHXK1 significantly inhibits plant growth and development and causes plant senescence and delays flowering [43]. In tree peony, the expression of PsHXK1 is inhibited by defoliation and GA treatment and induced flowering during the progression of spring festival forcing culture [3]. In this study, PsHXK1 responded rapidly to the exogenous GA, and then it maintained at a relative higher level up to 45 d, which further confirmed the nutrient deficiency after GA treatment. In short, a sufficient nutrient supply is necessary to further trigger tree peony reflowering at an earlier date in autumn under current forcing culture technologies (Figure 8).

4. Materials and Methods

4.1. Plant Materials and Treatments

This study was conducted from end of May (one week after the petals withered) to mid-August, 2020. A total of 30 healthy, five-year-old tree peony plants ‘Qiu Fa No. 1’ with similar growth vigor that were free of pests and disease were obtained from the Peony Germplasm Resources Nursery of the Institute of Vegetables and Flowers, Chinese Academy of Agricultural Sciences, Beijing, China (116°15′51″ N, 40°33′32″ E, at 673 m a.s.l.). The plants were randomly divided into three groups for the forcing culture treatments and the first day of these treatments was set as 0 d.
(1) Control group: The plants only received routine maintenance, without any treatment before the forcing culture process.
(2) GA treatment group (G): The leaves of whole plant were sprayed with 200 mg L−1 gibberellic acid (GA3, Sigma-Aldrich, Shanghai, China) between 8:30 am and 9:30 am. The treatment was performed once a week, four times in total. Other processes were the same as the control group.
(3) GA + nutrient (G + N) treatment group: The whole leaves were sprayed with 200 mg L−1 gibberellic acid and 2 g L−1 water soluble fertilizer between 8:30 am and 9:30 am. The selection of fertilizer was based on our previous results with N:P:K = 1:3:2 (Table S2), Mg and other microelements were obtained from the Scotts Company (Marysville, OH, USA). The other processes were the same as the GA group.
On average, an individual plant has 8 branches, each branch has 9 leaves, and each leaf area is about 370 cm2. For all three groups, we further treated them with autumn-flowering treatment from 75 d [4] for flowering observation.

4.2. Paraffin Section and Scanning Electron Microscope Observations

In this study, flower buds sampled at 0, 30, and 60 d were fixed in FAA fixative for 48 h, referring our previous paraffin section operation instructions [2]. Permanent microscope slides were made and observed under an upright microscope (DM5500, Leica, Wetzlar, Germany).
Based on the results of morphological observations, the flower buds sampled at 0, 30, and 60 d fixed in 2.5% glutaraldehyde fixative solution (with 1% osmium acid) were selected for further scanning electron microscope (SEM) observation. The temporary slices were made according to the SEM sample preparation protocols [4], and starch grains at the base of flower buds were observed with SEM (Cold Field-Emission Scanning Electron Microscope, SU-8010, Hitachi Corporation, Tokyo, Japan).

4.3. Soluble Sugar and GA3 Content Measurement

Soluble sugars content, including sucrose, glucose and fructose, were determined according to the method of [4], using a DIONEX ICS-3000 ion chromatography system (Thermo Fisher, Carlsbad, CA, USA). The analysis column was a CArboPac PA10 (4 × 250 mm) column, and an electrochemical detector with pulse ampere detection mode was used.
GAs contents were detected by MetWare (http://www.metware.cn/ (accessed on 5 November 2020)) based on the AB Sciex QTRAP 6500 LC-MS/MS platform.

4.4. Total RNA Extraction and cDNA Synthesis

The total RNA was isolated using an RNA Prep Pure Kit for plants (Aidlab, Beijing, China), following the manufacturer’s instructions. RNA quality and quantity were assessed by 1.0% agarose electrophoresis and a NanoDrop 2000c spectrophotometer (Thermo Scientific, Waltham, MA, USA), respectively. The first-strand cDNA synthesis was performed using a FastQuant RT kit (With gDNase, Tiangen, Beijing, China) according to the operating instructions.

4.5. RT-qPCR

The primers were designed using PrimerPremier 5.0 software and synthesized by Sangon Biotech (Beijing, China). The genes were divided into three categories: (1) the genes in the floral pathway, including PsFT, PsSOC1, PsLFY, PsAP1, and PsSVP; (2) the genes in the GA pathway, including PsGA20ox, PsGA3ox, PsGA2ox, PsGAI, and PsGID1c; (3) the genes related to the sugar signal pathway, including PsTPS1, PsSnRK1, and PsHXK1. The primer and gene information were based on Lv et al. [44] and Sun et al. [45] and detailed in Table S3.
The relative expression levels of different genes were calculated using a double standard curve according to the CFX96 Real-Time system (Bio-Rad, Hercules, CA, USA), and the PCR program was as follows: an initial stage of 30 s at 95 °C; 40 cycles of 5 s at 95 °C, 30 s at 60 °C, and 10 s at 95 °C; Actin was used as the reference gene according to Zhang et al. [46], and the 2−ΔΔCt method was used for relative gene expression data analysis [47].

4.6. Data Analysis

IBM SPSS Statistics 22 and Origin 9.0 software were used for the experimental data analysis. One-way ANOVA with post hoc Tukey’s test was used for the gene expression level analysis, with p-values < 0.05 considered to be significant.

5. Conclusions

In this study, G + N treatment shifted the tree peony reflowering time 38 d ahead in autumn, through forcing culture technologies. In this process, GA triggered the flowering induction, and fertilizer ensured a continuous nutrient supply for further bud development. With regarding to transcriptional levels, PsSOC1 and PsLFY played key integration roles in bud differentiation induced by GA and nutrient supply by fertilizer application, respectively. PsGA2ox was mainly involved in the GA signal pathway, whereas PsGAI may regulate further flower formation after fertilizer application. The sugar signal pathway was also involved in this process, and a sufficient nutrition supply was necessary for earlier GA-induced tree peony reflowering in autumn. Our work may provide a new reference for improving current tree peony forcing culture technologies to achieve its annual flowering with better quality.

Supplementary Materials

The following supporting information can be downloaded at: https://www.mdpi.com/article/10.3390/ijms23147703/s1.

Author Contributions

Y.L. and X.Z. designed the research; Y.X., J.X. and X.R. performed the experiments; C.L., K.S. and L.C. analyzed the data; Y.X. and J.X. wrote the paper. All authors have read and agreed to the published version of the manuscript.

Funding

This research was supported by the National Key R&D Program of China (2018YFD1000401), the National Natural Science Foundation of China (31972440, 31972455), China Agricultural Research System (CARS-21), and Fundamental Research Funds for Chinese Academy of Agricultural Sciences (Y2022XK17, IVF-BRF2022016).

Institutional Review Board Statement

Not applicable.

Informed Consent Statement

Not applicable.

Data Availability Statement

The data used to support the findings of this study are available from the corresponding authors upon request.

Conflicts of Interest

The authors declare that they have no conflict of interest.

References

  1. Chen, G.X. Development status and suggestions of peony industry in Heze city. Agric. Eng. 2021, 11, 141–144. [Google Scholar]
  2. Wang, X.P.; Wang, S.L.; Xue, Y.Q.; Ren, X.X.; Xue, J.Q.; Zhang, X.X. Defoliation, not gibberellin, induces tree peony autumn reflowering regulated by carbon allocation and metabolism in buds and leaves. Plant Physiol. Biochem. 2020, 151, 545–555. [Google Scholar] [CrossRef] [PubMed]
  3. Liu, Z.Y.; Shi, Y.T.; Xue, Y.Q.; Wang, X.P.; Huang, Z.; Xue, J.Q.; Zhang, X.X. Non-structural carbohydrates coordinate tree peony flowering both as energy substrates and as sugar signaling triggers, with the bracts playing an essential role. Plant Physiol. Biochem. 2021, 159, 80–88. [Google Scholar] [CrossRef] [PubMed]
  4. Xue, J.Q.; Li, T.T.; Wang, S.L.; Xue, Y.Q.; Hu, F.R.; Zhang, X.X. Elucidation of the mechanism of reflowering in tree peony (Paeonia suffruticosa) ‘Qiu Fa No.1’ by defoliation and gibberellic acid application. Plant Physiol. Biochem. 2018, 132, 571–578. [Google Scholar] [CrossRef] [PubMed]
  5. Komeda, Y. Genetic regulation of time to flower in Arabidopsis thaliana. Annu. Rev. Plant Biol. 2004, 55, 521–535. [Google Scholar] [CrossRef] [Green Version]
  6. Fornara, F.; de Montaigu, A.; Coupland, G. SnapShot: Control of flowering in Arabidopsis. Cell 2010, 141, 550–550.e2. [Google Scholar] [CrossRef] [Green Version]
  7. Wahl, V.; Ponnu, J.; Schlereth, A.; Arrivault, S.; Langenecker, T.; Franke, A.; Feil, R.; Lunn, J.E.; Stitt, M.; Schmid, M. Regulation of flowering by trehalose-6-phosphate signaling in Arabidopsis thaliana. Science 2013, 339, 704–707. [Google Scholar] [CrossRef]
  8. Wang, J.W. Regulation of flowering time by the miR156-mediated age pathway. J. Exp. Bot. 2014, 65, 4723–4730. [Google Scholar] [CrossRef] [Green Version]
  9. Fukazawa, J.; Ohashi, Y.; Takahashi, R.; Nakai, K.; Takahashi, Y. DELLA degradation by gibberellin promotes flowering via GAF1-TPR-dependent repression of floral repressors in Arabidopsis. Plant Cell 2021, 33, 2258–2272. [Google Scholar] [CrossRef]
  10. Xu, G.K.; Tao, Z.; He, Y.H. Embryonic reactivation of FLOWRING LOCUS C by ABACISIC ACID-INSENSITIVE 3 establishes the vernalization rrequirement in each Arabidopsis generation. Plant Cell 2022, 34, 2205–2221. [Google Scholar] [CrossRef]
  11. Lee, J.; Lee, I. Regulation and function of SOC1, a flowering pathway integrator. J. Exp. Bot. 2010, 61, 2247–2254. [Google Scholar] [CrossRef] [PubMed] [Green Version]
  12. Wang, S.L.; Gao, J.; Xue, J.Q.; Xue, Y.Q.; Li, D.D.; Guan, Y.Y.; Zhang, X.X. De novo sequencing of tree peony (Paeonia suffruticosa) transcriptome to identify critical genes involved in flowering and floral organ development. BMC Genom. 2019, 20, 572. [Google Scholar] [CrossRef] [PubMed]
  13. Mandel, M.A.; Gustafson-Brown, C.; Savidge, B.; Yanofsky, M.F. Molecular characterization of the Arabidopsis floral homeotic gene APETALA1. Nature 1992, 360, 273–277. [Google Scholar] [CrossRef] [PubMed]
  14. Wigge, P.A.; Kim, M.C.; Jaeger, K.E.; Busch, W.; Schmid, M.; Lohmann, J.U.; Weigel, D. Integration of spatial and temporal information during floral induction in Arabidopsis. Science 2005, 309, 1056–1059. [Google Scholar] [CrossRef]
  15. Wang, S.L.; Xue, J.Q.; Ahmadi, N.; Holloway, P.; Zhu, F.Y.; Ren, X.X.; Zhang, X.X. Molecular characterization and expression patterns of PsSVP genes reveal distinct roles in flowering bud abortion and flowering in tree peony (Paeonia Suffruticosa). Can. J. Plant Sci. 2014, 94, 1181–1193. [Google Scholar] [CrossRef] [Green Version]
  16. Hedden, P.; Thomas, S.G. Gibberellin biosynthesis and its regulation. Biochem. J. 2012, 444, 11–25. [Google Scholar] [CrossRef] [Green Version]
  17. Ueguchi-Tanaka, M.; Ashikari, M.; Nakajima, M.; Itoh, H.; Katoh, E.; Kobayashi, M.; Chow, T.Y.; Hsing, Y.I.; Kitano, H.; Yamaguchi, I.; et al. GIBBERELLIN INSENSITIVE DWARF1 encodes a soluble receptor for gibberellin. Nature 2005, 437, 693–698. [Google Scholar] [CrossRef]
  18. Murase, K.; Hirano, Y.; Sun, T.P.; Hakoshima, T. Gibberellin-induced DELLA recognition by the gibberellin receptor GID1. Nature 2008, 456, 459–463. [Google Scholar] [CrossRef]
  19. Santner, A.; Estelle, M. Recent advances and emerging trends in plant hormone signalling. Nature 2009, 459, 1071–1078. [Google Scholar] [CrossRef]
  20. Du, L.S.; Qi, S.Y.; Ma, J.J.; Xing, L.B.; Fan, S.; Zhang, S.W.; Li, Y.M.; Shen, Y.W.; Zhang, D.; Han, M.Y. Identification of TPS family members in apple (Malus X Domestica Borkh.) and the effect of sucrose sprays on TPS expression and floral induction. Plant Physiol. Biochem. 2007, 120, 10–23. [Google Scholar] [CrossRef]
  21. Sanagi, M.; Shoki, A.; Akio, K.; Yu, L.; Yasutake, S.; Shogo, I.; Mitsutomo, A.; Nobutaka, M.; Masaru, O.T.; Takatoshi, K.; et al. Low nitrogen conditions accelerate flowering by modulating the phosphorylation state of FLOWEING BHLH4 in Arabidopsis. Proc. Natl. Acad. Sci. USA 2021, 118, e2022942118. [Google Scholar] [CrossRef] [PubMed]
  22. Li, G.J.; Peng, F.T.; Zhang, L.; Shi, X.Z.; Wang, Z.Y. Cloning and characterization of a SnRK1-encodinig gene form Malus hupehensis Rehd. and heterologous expression in tomato. Mol. Biol. Rep. 2010, 37, 947–954. [Google Scholar] [CrossRef] [PubMed]
  23. Baena-Gonzalez, E.; Rolland, F.; Thevelein, J.M.; Sheen, J. A central integrator of transcription networks in plant stress and energy signalling. Nature 2007, 448, 938–942. [Google Scholar] [CrossRef] [PubMed]
  24. Claeyssen, E.; Rivoal, J. Isozymes of plant hexokinase: Occurrence, properties and functions. Phytochemistry 2007, 68, 709–731. [Google Scholar] [CrossRef] [PubMed]
  25. Cao, S.Y.; Tang, Y.Z.; Jiang, A.H. Effects of PPP333 and GA3 on the mechanism of flower bud induction in apple tree. Acta Hortic. Sin. 2001, 28, 339–341. [Google Scholar]
  26. An, L.J.; Jin, L.; Yang, C.Q.; Li, T.H. Effect and functional mechanism of the action of exogenous gibberellin on flowering peach. Sci. Agric. Sin. 2009, 42, 1324–1332. [Google Scholar]
  27. Li, W.Q.; Yong, Y.B.; Zhang Yue Lyu, Y.M. Transcriptional regulatory network of GA floral induction pathway in LA Hybrid Lily. Int. J. Mol. Sci. 2019, 20, 2694. [Google Scholar] [CrossRef] [Green Version]
  28. Li, M.F.; Yang, Y.; Wang, H.; Liu, J.S.; Jin, W.M. Effects of gibberellin on growth and development of Rose ‘Carola’. Acta Hortic. Sin. 2019, 46, 749–760. [Google Scholar]
  29. Guan, Y.R.; Xue, J.Q.; Xue, Y.Q.; Yang, R.W.; Wang, S.L.; Zhang, X.X. Effect of exogenous GA3 on flowering quality, endogenous hormones, and hormone- and flowering-associated gene expression in forcing-cultured tree peony (Paeonia suffruticosa). J. Integr. Agric. 2019, 18, 1295–1311. [Google Scholar] [CrossRef]
  30. Hisamatsu, T.; King, R.W. The nature of floral signals in Arabidopsis. II. Roles for FLOWERING LOCUS T (FT) and gibberellin. J. Exp. Bot. 2008, 59, 479–488. [Google Scholar] [CrossRef] [Green Version]
  31. Eriksson, S.; Böhlenius, H.; Moritz, T.; Nilsson, O. GA4 is the active gibberellin in the regulation of LEAFY transcription and Arabidopsis floral initiation. Plant Cell 2006, 18, 2172–2181. [Google Scholar] [CrossRef] [PubMed] [Green Version]
  32. Yamaguchi, N.; Winter, C.M.; Wu, M.F.; Kanno, Y.; Yamaguchi, A.; Seo, M.; Wagner, D. Gibberellin acts positively then negatively to control onset of flower formation in Arabidopsis. Science 2014, 344, 638–641. [Google Scholar] [CrossRef] [PubMed]
  33. Bonhomme, F.; Kurz, B.; Melzer, S.; Bernier, G.; Jacqmard, A. Cytokinin and gibberellin activate SaMADS A, a gene apparently involved in regulation of the floral transition in Sinapis alba. Plant J. 2000, 24, 103–111. [Google Scholar] [CrossRef] [PubMed]
  34. Zhang, S.; Zhang, D.; Fan, S.; Du, L.; Shen, Y.; Xing, L.; Li, Y.; Ma, J.; Han, M. Effect of exogenous GA3 and its inhibitor paclobutrazol on floral formation, endogenous hormones, and flowering-associated genes in ‘Fuji’ apple (Malus domestica Borkh.). Plant Physiol. Biochem. 2016, 107, 178–186. [Google Scholar] [CrossRef]
  35. Dong, F.; Fan, S.; Ma, X.L.; Meng, Y.; Zuo, X.Y.; Liu, X.J.; Li, K.; Liu, Z.; Han, M.Y.; Zhang, D. Genome-wide indentification and expression analysis of GA2ox, GA3ox, and GA20ox in apple. Acta Hortic. Sin. 2018, 45, 613–626. [Google Scholar]
  36. Gao, Y.; Chen, J.M.; Zhao, Y.; Li, T.T.; Wang, M.L. Molecular cloning and expression analysis of a RGA-like gene responsive to plant hormones in Brassica napus. Mol. Biol. Rep. 2012, 39, 1957–1962. [Google Scholar] [CrossRef]
  37. Fukazawa, J.; Teramura, H.; Murakoshi, S.; Nasuno, K.; Nishida, N.; Ito, T.; Yoshida, M.; Kamiya, Y.; Yamaguchi, S.; Takahashi, Y. DELLAs function as coactivators of GAI-ASSOCIATED FACTOR1 in regulation of gibberellin homeostasis and signaling in Arabidopsis. Plant Cell 2014, 26, 2920–2938. [Google Scholar] [CrossRef] [Green Version]
  38. Ramon, M.; Dang, T.V.T.; Broeckx, T.; Hulsmans, S.; Crepin, N.; Sheen, J.; Rolland, F. Default activation and nuclear translocation of the plant cellular energy sensor SnRK1 regulate metabolic stress responses and development. Plant Cell 2019, 31, 1614–1632. [Google Scholar] [CrossRef]
  39. Fichtner, F.; Olas, J.J.; Feil, R.; Watanabe, M.; Krause, U.; Hoefgen, R.; Stitt, M.; Lunn, J.E. Functional features of TREHALOSE-6-PHOSPHATE SYNTHASE1, an essential enzyme in Arabidopsis. Plant Cell 2020, 32, 1949–1972. [Google Scholar] [CrossRef] [Green Version]
  40. Ponnu, J.; Schlereth, A.; Zacharaki, V.; Działo, M.A.; Abel, C.; Feil, R.; Schmid, M.; Wahl, V. The trehalose 6-phosphate pathway impacts vegetative phase change in Arabidopsis thaliana. Plant J. 2020, 104, 768–780. [Google Scholar] [CrossRef]
  41. Baena-Gonzalez, E.; Lunn, J.E. SnRK1 and trehalose 6-phosphate—Two ancient pathways converge to regulate plant metabolism and growth. Curr. Opin. Plant Biol. 2020, 55, 52–59. [Google Scholar] [CrossRef] [PubMed]
  42. Wang, G.F.; Yu, W.; Luo, J.J.; Wang, W.R.; Zhang, S.H.; Xiao, S.Y.; Peng, F.T. Peach PpSnRK1α gene regulates the growth and development processes of plants. Plant Physiol. J. 2018, 54, 1553–1560. [Google Scholar]
  43. Granot, D. Role of tomato hexose kinases. Funct. Plant Biol. 2007, 34, 564–570. [Google Scholar] [CrossRef] [PubMed]
  44. Lv, S.; Cheng, S.; Wang, Z.; Li, S.; Jin, X.; Lan, L.; Yang, B.; Yu, K.; Ni, X.; Li, N.; et al. Draft genome of the famous ornamental plant Paeonia suffruticosa. Ecol. Evol. 2020, 10, 4518–4530. [Google Scholar] [CrossRef] [PubMed]
  45. Sun, K.; Xue, Y.; Prijic, Z.; Wang, S.; Xue, J.; Zhang, X. DNA Demethylation Induces Tree Peony Flowering with a Low Deformity Rate Compared to Gibberellin by Inducing PsFT Expression under Forcing Culture Conditions. Int. J. Mol. Sci. 2022, 23, 6632. [Google Scholar] [CrossRef]
  46. Zhang, Y.X.; Gai, S.P.; Liu, C.Y.; Mu, P.; Zheng, G.S. Selection of control genes in real-time qPCR analyss during bud dormancy release in tree peony (Paeonia suffruticosa). Mol. Plant Breed. 2011, 9, 1052–1056. [Google Scholar]
  47. Livak, K.J.; Schmittgen, T.D. Analysis of relative gene expression data using real-time quantitative PCR and the 2−ΔΔCT method. Methods 2001, 25, 402–408. [Google Scholar] [CrossRef]
Figure 1. Effects of different treatments on the appearance and morphology of tree peony ‘Qiu Fa No. 1’ flower buds. (A) Morphological changes. (B,C) Variation trend of flower bud’s horizontal and longitudinal diameter. Error bars indicate the SD (n = 10).
Ijms 23 07703 g001
Figure 2. Effects of different treatments on the microstructures of tree peony ‘Qiu Fa No. 1’ flower buds during growth and development. (A) Development period of the internal microstructure of flower bud (scale bar = 1000 μm): a, b, d, g: Undifferentiated stage; c, e, h: bract primordium stage; f: sepal primordium stage; i: pistil primordium stage. (B) Histogram of flower bud microstructure ratio of horizontal and longitudinal diameters, error bars indicate the standard deviation (n = 3), and different lowercase letters indicate significant differences (Tukey’s test, α = 0.05). The blue dots indicate the actual data.
Ijms 23 07703 g002
Figure 3. Effects of different treatments on the changes in starch grains at the base of tree peony ‘Qiu Fa No. 1’ flower buds during growth and development. (A) Electron microscope micrographs of starch grains at the base of flower buds in the control and different treatment groups (red arrow indicates the starch grains), magnified 2000 times (scale bar = 20 μm). (B,C) Histogram of the number and diameter of starch granules in a single cell, respectively. Error bars indicate the SD, in each treatment group, five individual plants were used for starch granule number and size analysis with two samples from the same plant (n = 10), and different lowercase letters indicate significant differences (Tukey’s test, α = 0.05). The blue dots indicate the actual data.
Ijms 23 07703 g003
Figure 4. Effects of different treatments on soluble sugar content in buds of tree peony ‘Qiu Fa No. 1’. The content of (A) sucrose, (B) glucose, and (C) fructose during the period of 0–45 d. Error bars indicate the standard deviation (SD; n = 3).
Ijms 23 07703 g004
Figure 5. Effect of GA treatment and GA + Nutrient treatment on the expression of (A) PsFT, (B) PsSOC1, (C) PsLFY, (D) PsAP1, and (E) PsSVP in the buds of tree peony ‘Qiu Fa No. 1’. Error bars indicate the SD (n = 3). Different lowercase letters indicate significant differences (Tukey’s test, α = 0.05), and the blue dots indicate the actual data.
Ijms 23 07703 g005
Figure 6. Effect of GA treatment and GA + Nutrient treatment on the (A) GA3 content (in the shaded area) and expression of (B) PsGA20ox, (C) PsGA3ox, (D) PsGA2ox, (E) PsGAI, and (F) PsGID1c in the buds of tree peony ‘Qiu Fa No. 1’. Error bars indicate the SD (n = 3). Different lowercase letters indicate significant differences (Tukey’s test, α = 0.05), and the blue dots indicate the actual data.
Ijms 23 07703 g006
Figure 7. Effect of GA treatment and GA + Nutrient treatment on the expression of (A) PsTPS1, (B) PsSnRK1, and (C) PsHXK1 in the buds of tree peony ‘Qiu Fa No. 1’. Error bars indicate the SD (n = 3). Different lowercase letters indicate significant differences (Tukey’s test, α = 0.05), and the blue dots indicate the actual data.
Ijms 23 07703 g007
Figure 8. Schematic diagram of regulation mode in gibberellin induced tree peony reflowering in autumn. GA treatment induced reflowering, but led to abortion of the bud finally (red line), probably due to nutritional deficiency. Adding of fertilizer supplied sufficient nutrition (blue line), thus the flower reflowered normally. The initial (15 d or 30 d) inducing or decreasing expression of related genes are signed by the arrows and lines with a bar at the end, respectively.
Ijms 23 07703 g008
Publisher’s Note: MDPI stays neutral with regard to jurisdictional claims in published maps and institutional affiliations.

