4.1. General Methods and Instruments
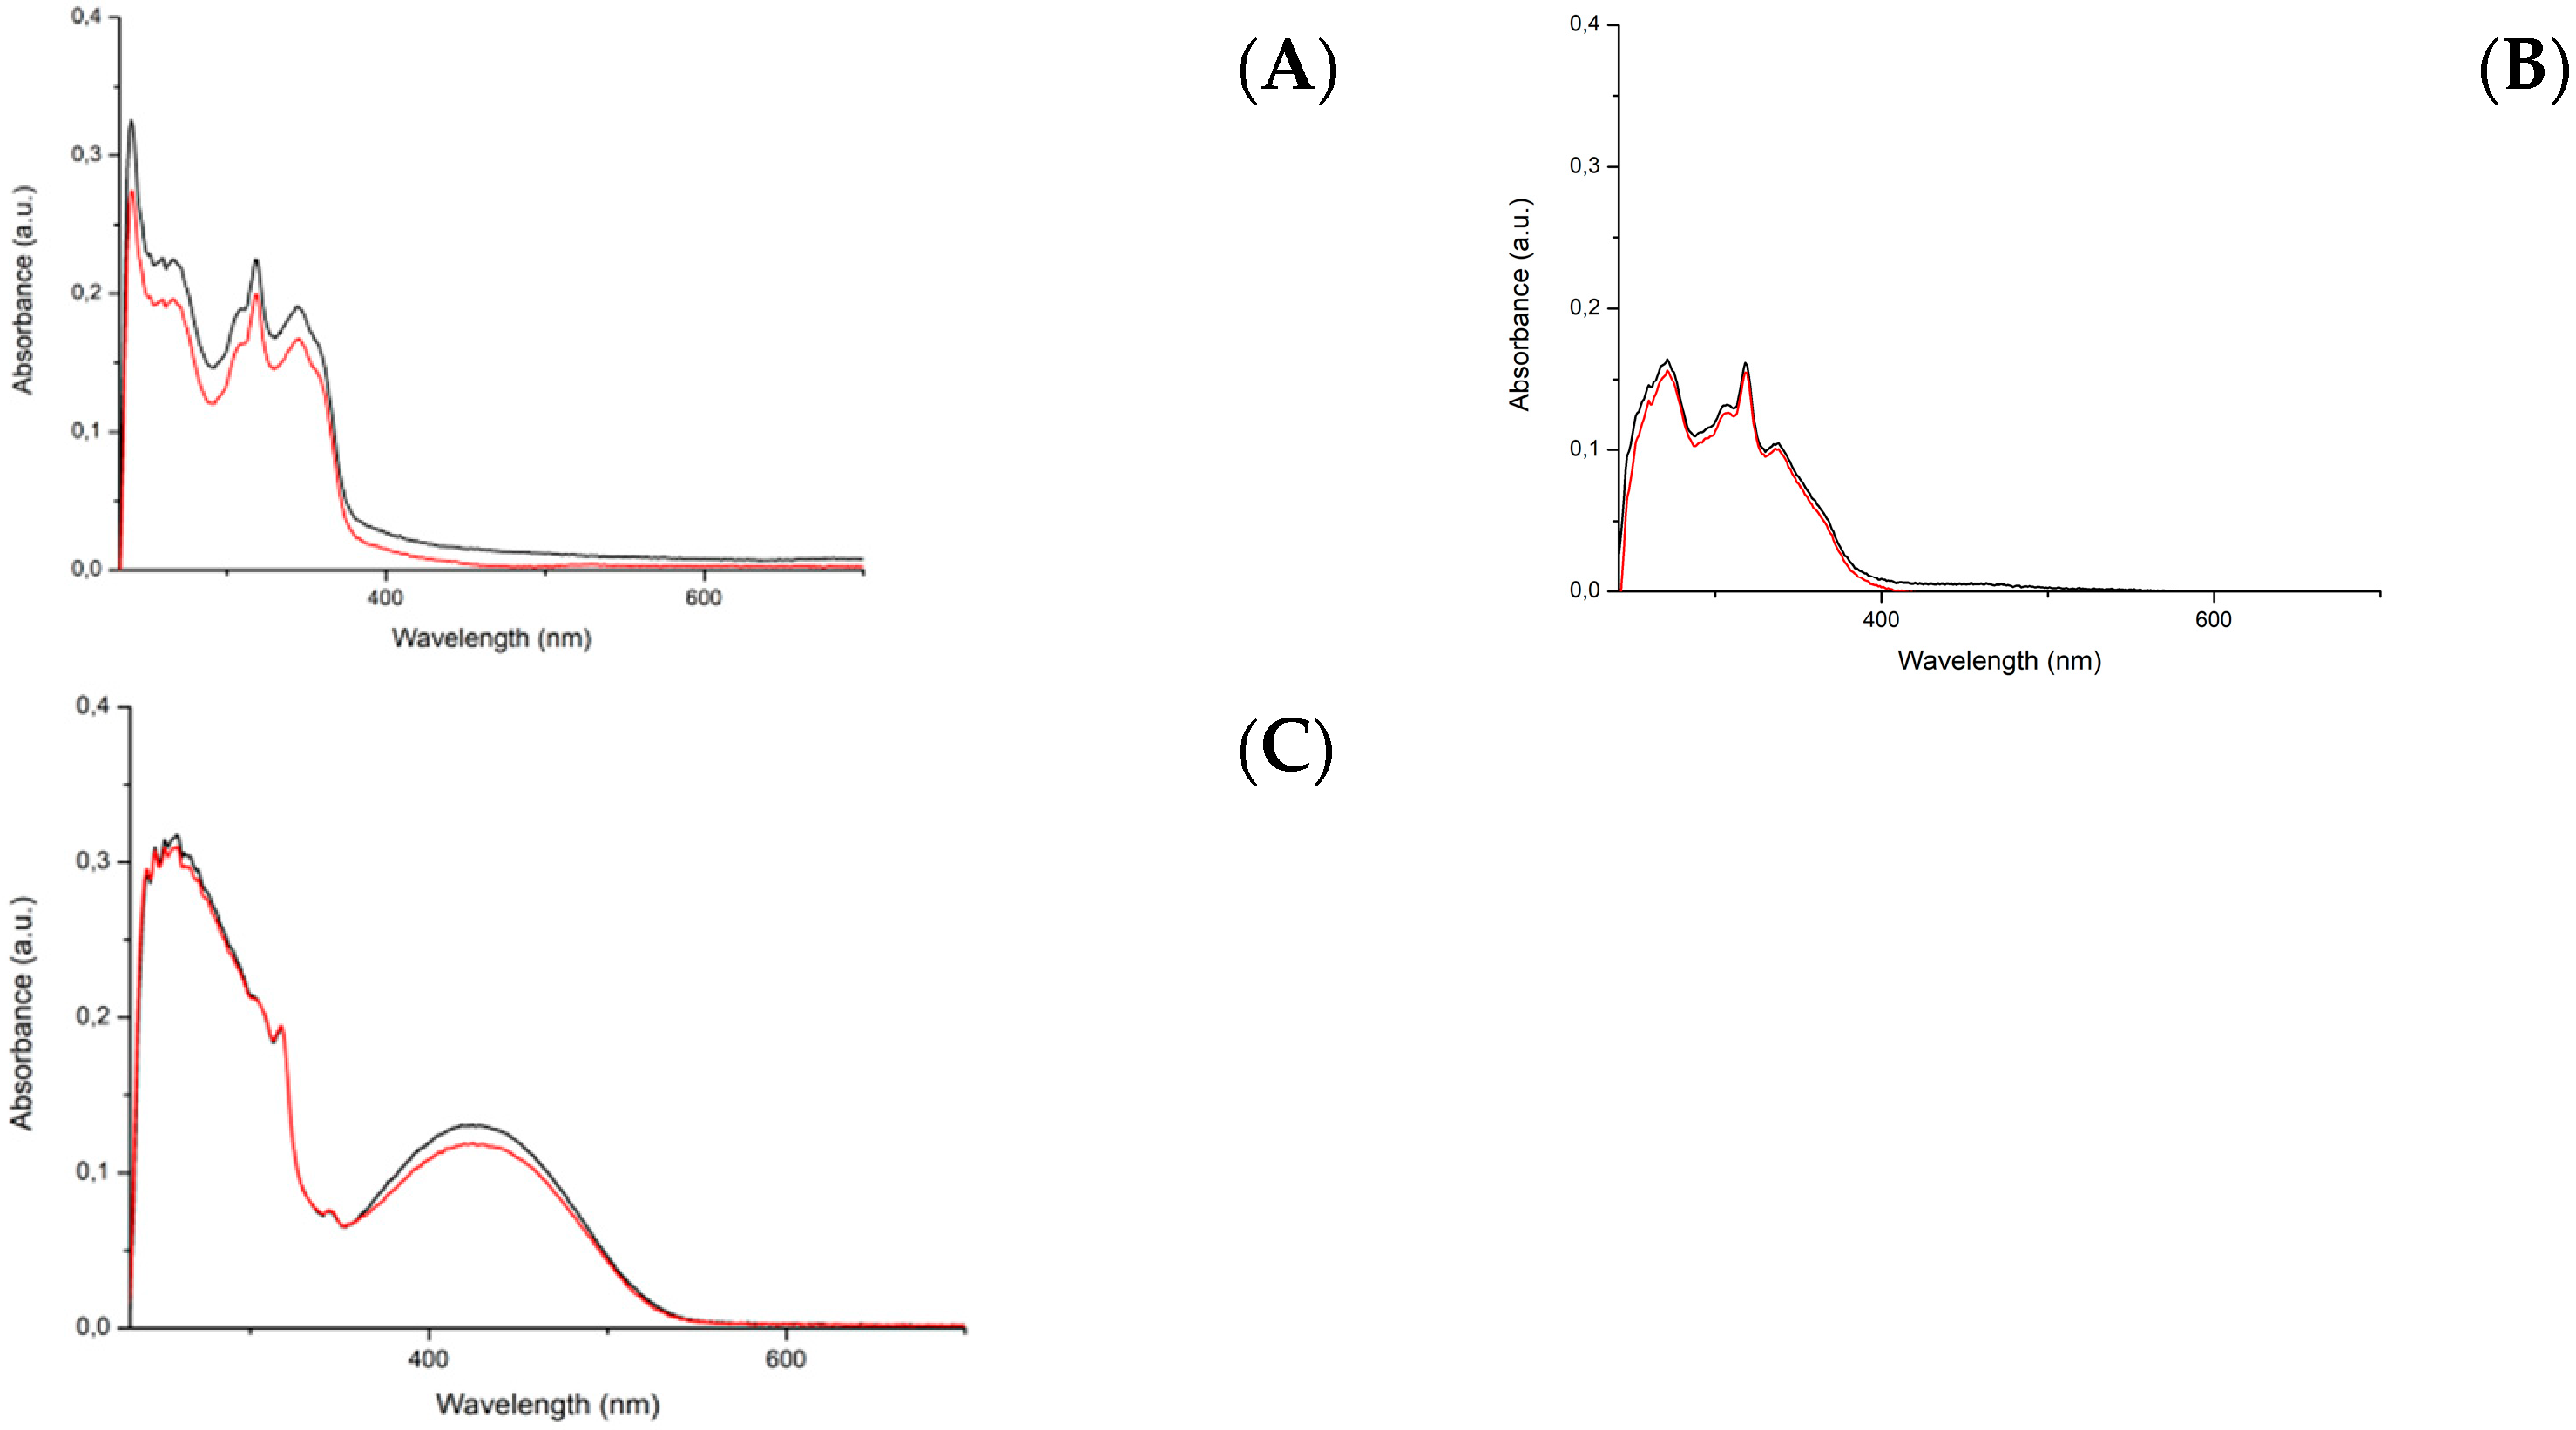
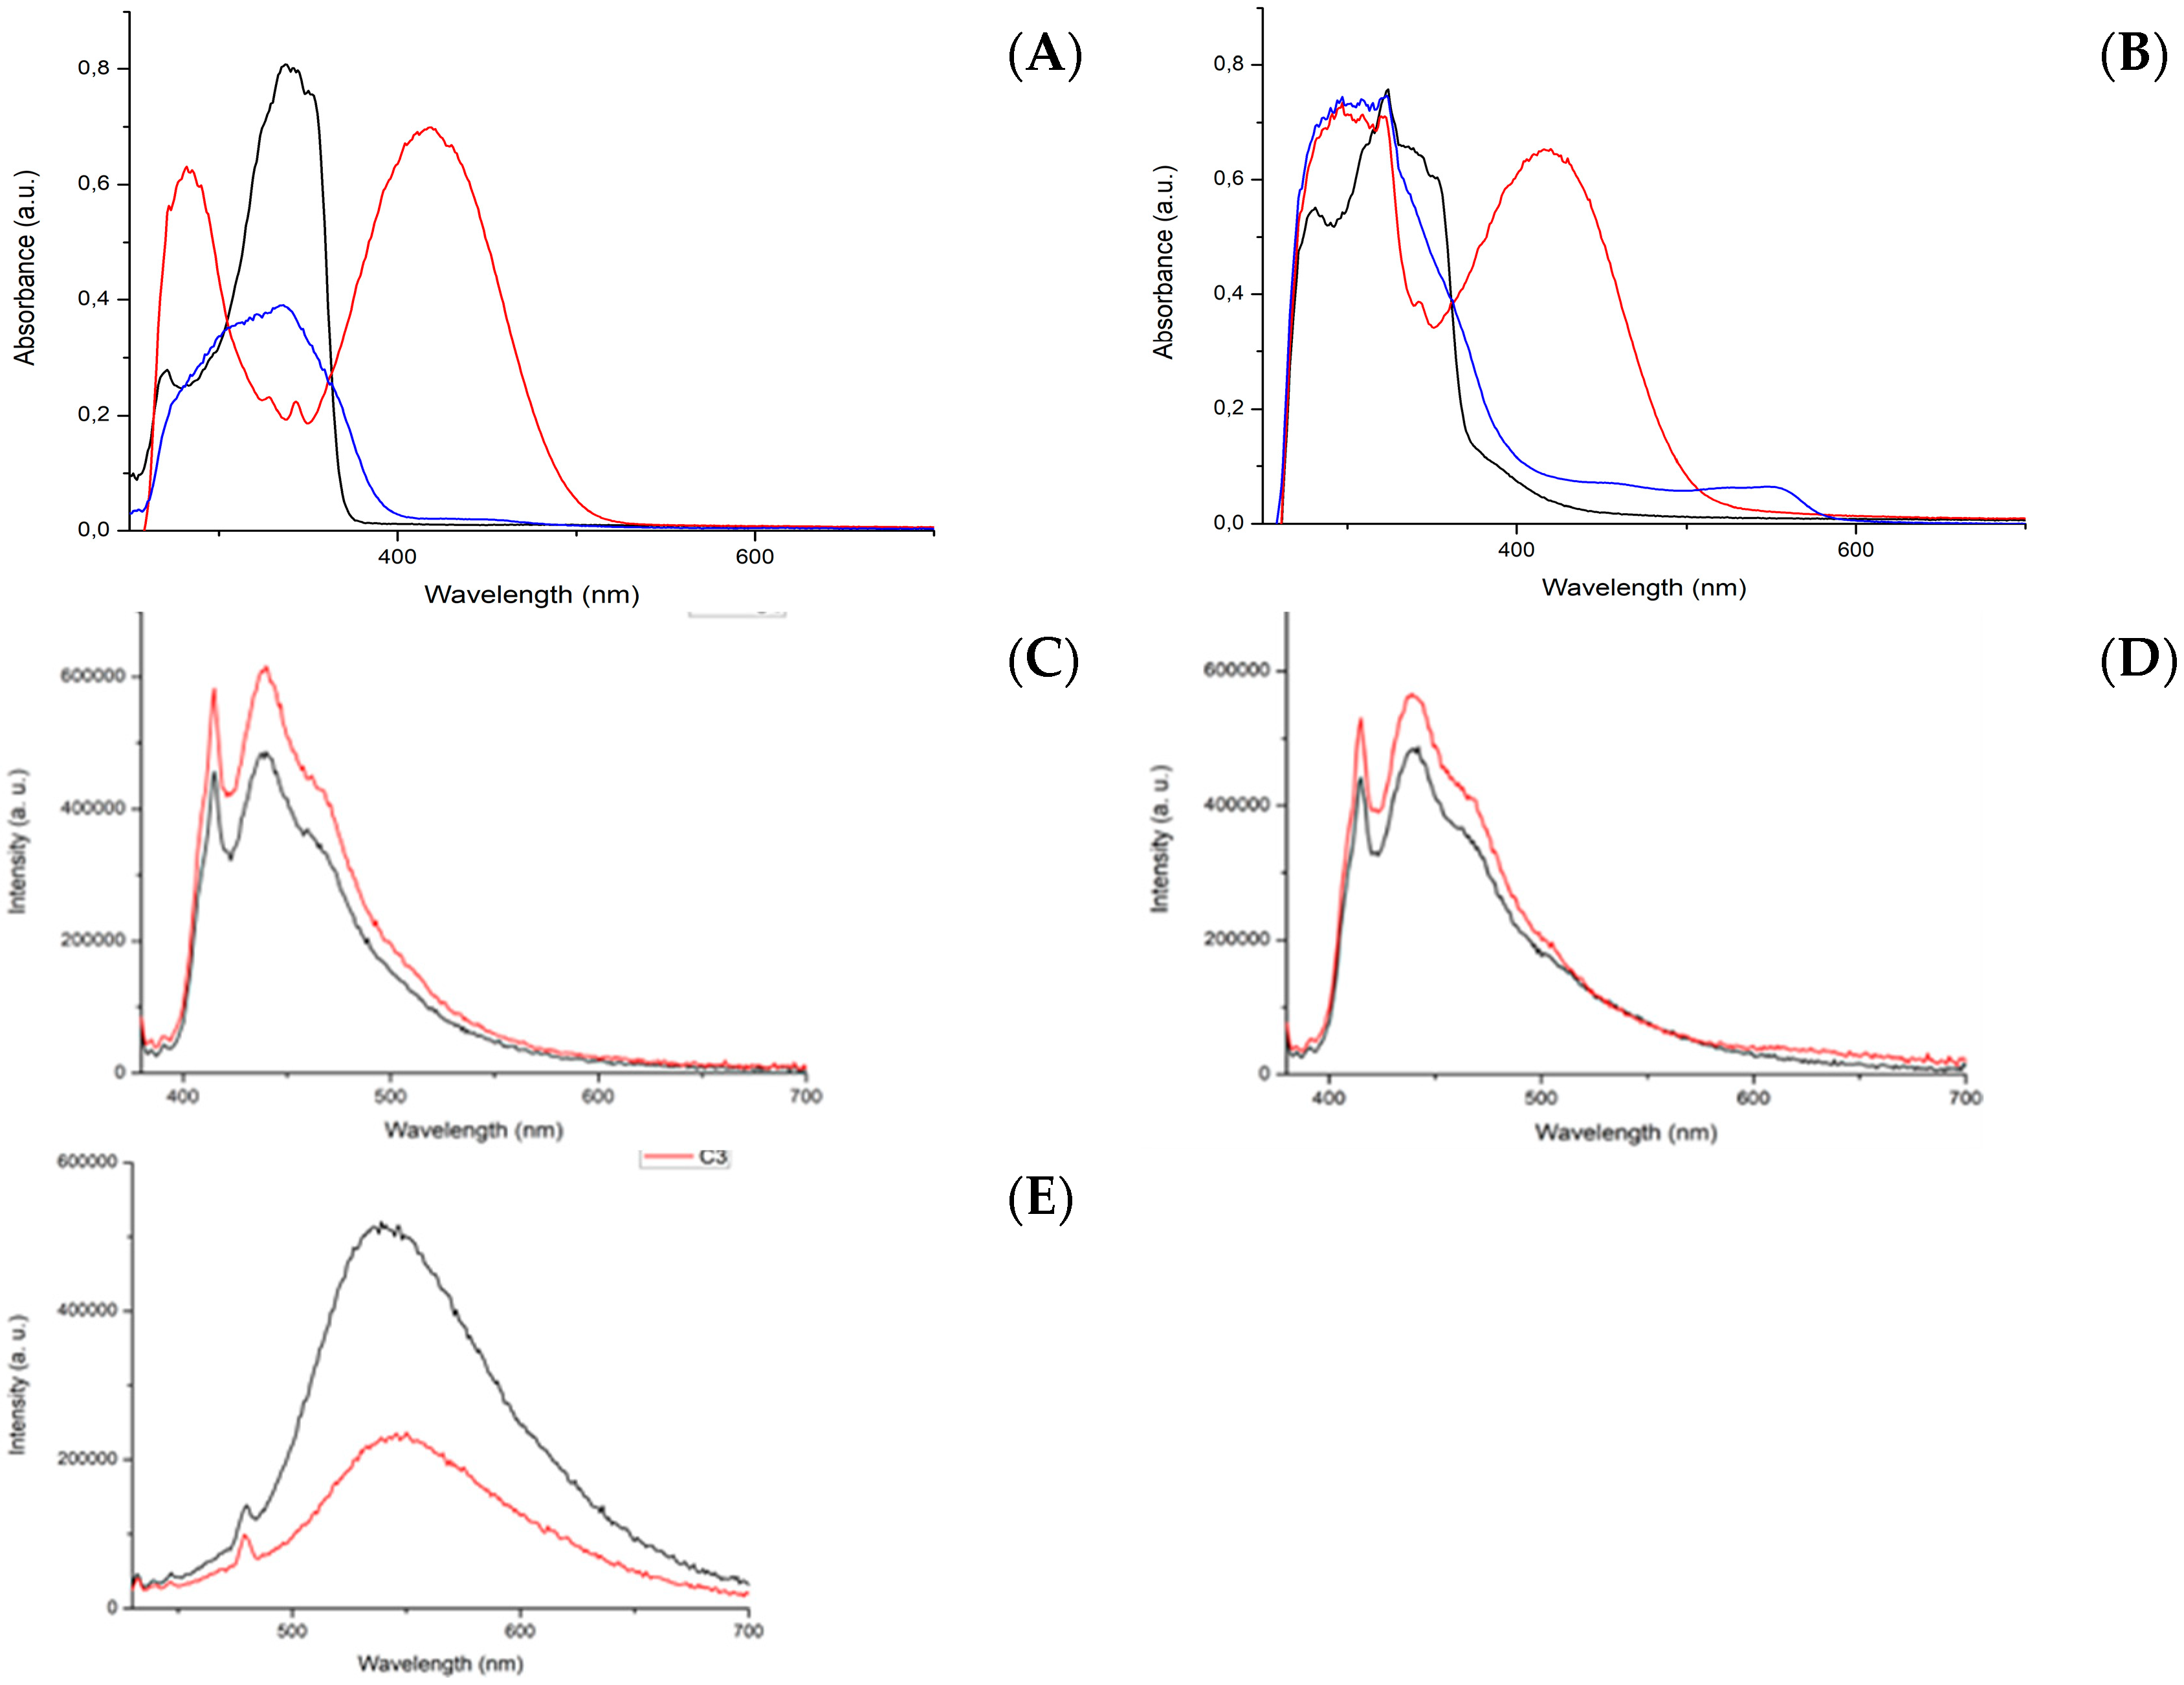
All reactants used were purchased from Sigma Aldrich (Milan, Italy). The 400 MHz 1H NMR and 100 MHz 13C NMR spectra were recorded on a Bruker Anova spectrometer (Billerica, MA, USA). ESI-MS analysis was performed using a Waters Acquity Ultraperformance ESI-MS spectrometer with Single Quadrupole Detector (Sesto San Giovanni, MI, Italy). Elemental analyses were obtained using a CHNS Thermo Fischer (Rodano, MI, Italy). UV–vis spectra were recorded on a Thermo Scientific Evolution 260 Bio instrument (Rodano, MI, Italy). The light intensity measurements at 420 nm were carried out with an Optical Power Meter (Newport 840-C, Monza, Italy) equipped with a Mod. 818-UV detector (active area 1 cm2).
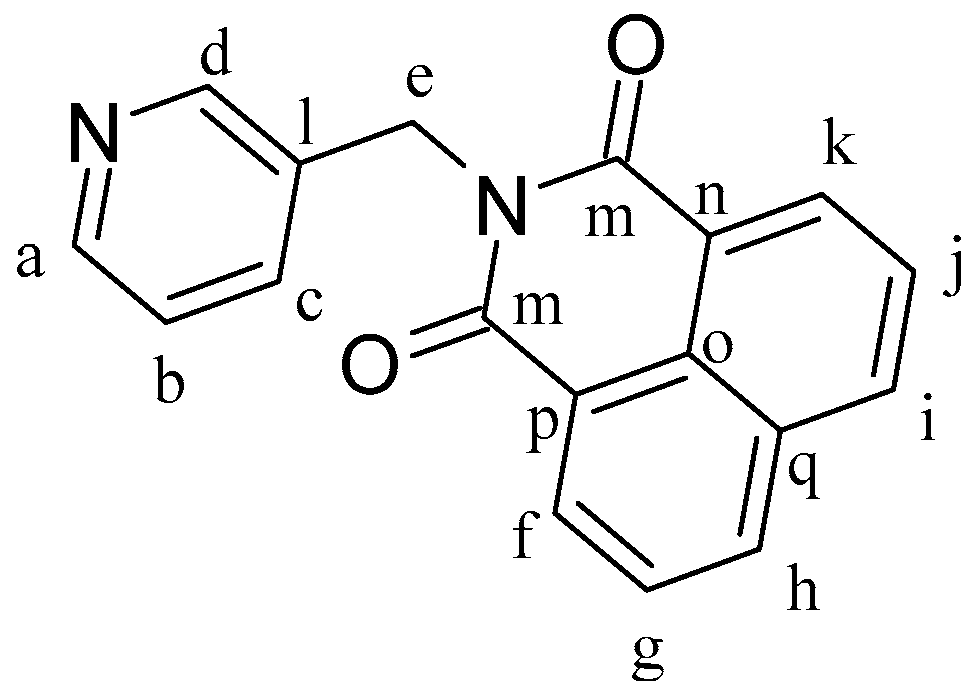
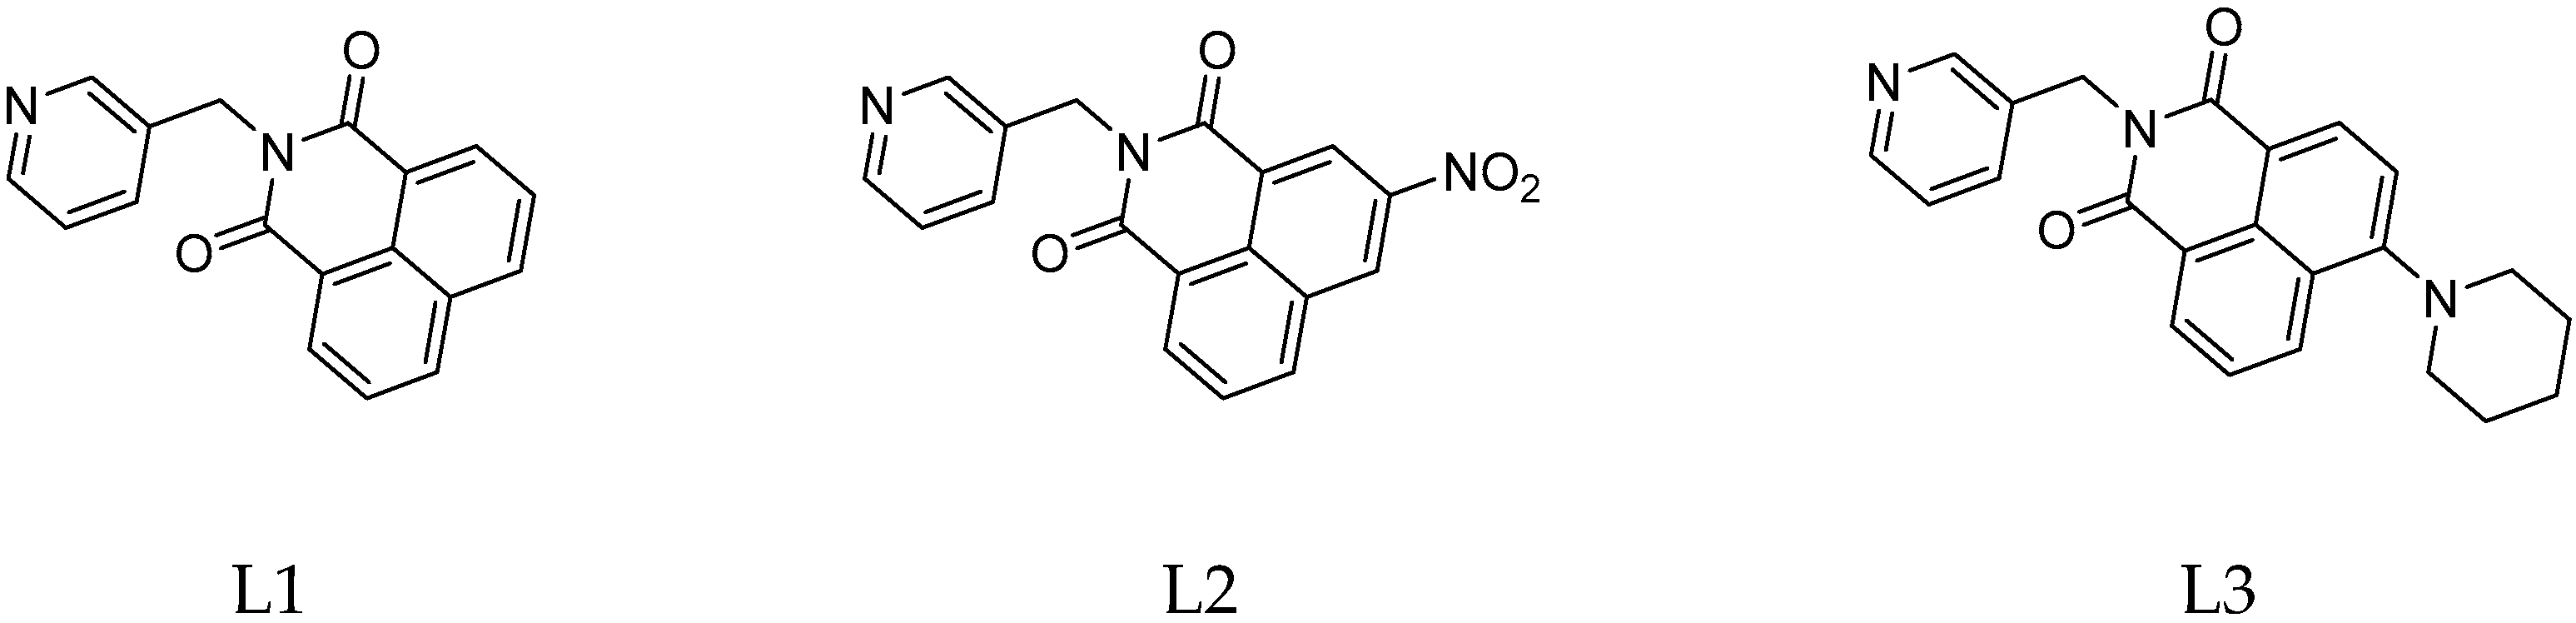
L1 (
Figure 8) was synthesized according to a reported procedure [
5]. 1,8-Naphthalenic anhydride (0.30 g, 1.51 mmol) and 3-picolylamine (0.196 g, 1.81 mmol) were dissolved in 10 mL of DMF, and the mixture was heated at 130 °C for 24 h. The mixture was cooled to room temperature, which yielded a pale yellow microcrystalline solid that was then separated by filtration and dried under vacuum. Yield: 87%.
1H-NMR (δ, ppm, 400 MHz, DMSO-d
6): 8.66 (dd, J = 2.3 Hz, J′ = 0.9 Hz, 1H, H
d), 8.51 (m, 4H, H
f, H
h, H
i, H
k), 8.46 (dd, J = 4.8 Hz, J′ = 1.7 Hz, 1H, H
a), 7.89 (dd, J = 8.3 Hz, J′ = 7.3 Hz, 2H, H
b, H
c), 7.78 (ddd, J = 7.9 Hz, J′ = 2.4 Hz, J′′ = 1.7 Hz, 1H, H
g), 7.33 (ddd, J = 7.9 Hz, J′ = 4.8 Hz, J′′ = 0.9 Hz, 1H, H
j), 5.32 (s, 2H, H
e).
1H-NMR (δ, ppm, 400 MHz, CDCl
3): 8.89 (d, J = 2.1 Hz, 1H, H
d), 8.62 (dd, J = 8.5 Hz, J = 1.0 Hz, 2H, H
f, H
k), 8.54 (dd, J = 5.2 Hz, J = 2.1 Hz, 1H, H
a), 8.24 (dd, J = 8.5 Hz, J = 1.0 Hz, 2H, H
h, H
i), 8.02 (dt, J = 8.0 Hz, J′ = 2.1 Hz, 1H, H
b), 7.76 (t, J = 8.5 Hz, 2H, H
g, H
j), 7.34 (ddd, J = 8.0 Hz, J′ = 5.2 Hz, J′′ = 2.1 Hz, 1H, H
c), 5.43 (s, 2H, H
e).
13C-NMR (δ, ppm, 100 MHz, DMSO-d
6): 164.08 (C
m), 149.75 and 148.83 (C
a,d), 135.97 (C
f), 135.12 (C
g), 133.54 (C
b), 131.84 (C
l), 131.52 (C
h), 128.01 (C
q), 127.78 (C
n), 124.05 (C
o), 122.43 (C
c), and 41.27 (C
e). ESI-MS (+) m/z calc. 289.3, found 288.8. CHN analysis: C
18H
12N
2O
2: calculated: C: 74.99, H: 4.20, N: 9.72. Found: C: 74.93, H: 4.14, N: 9.80.
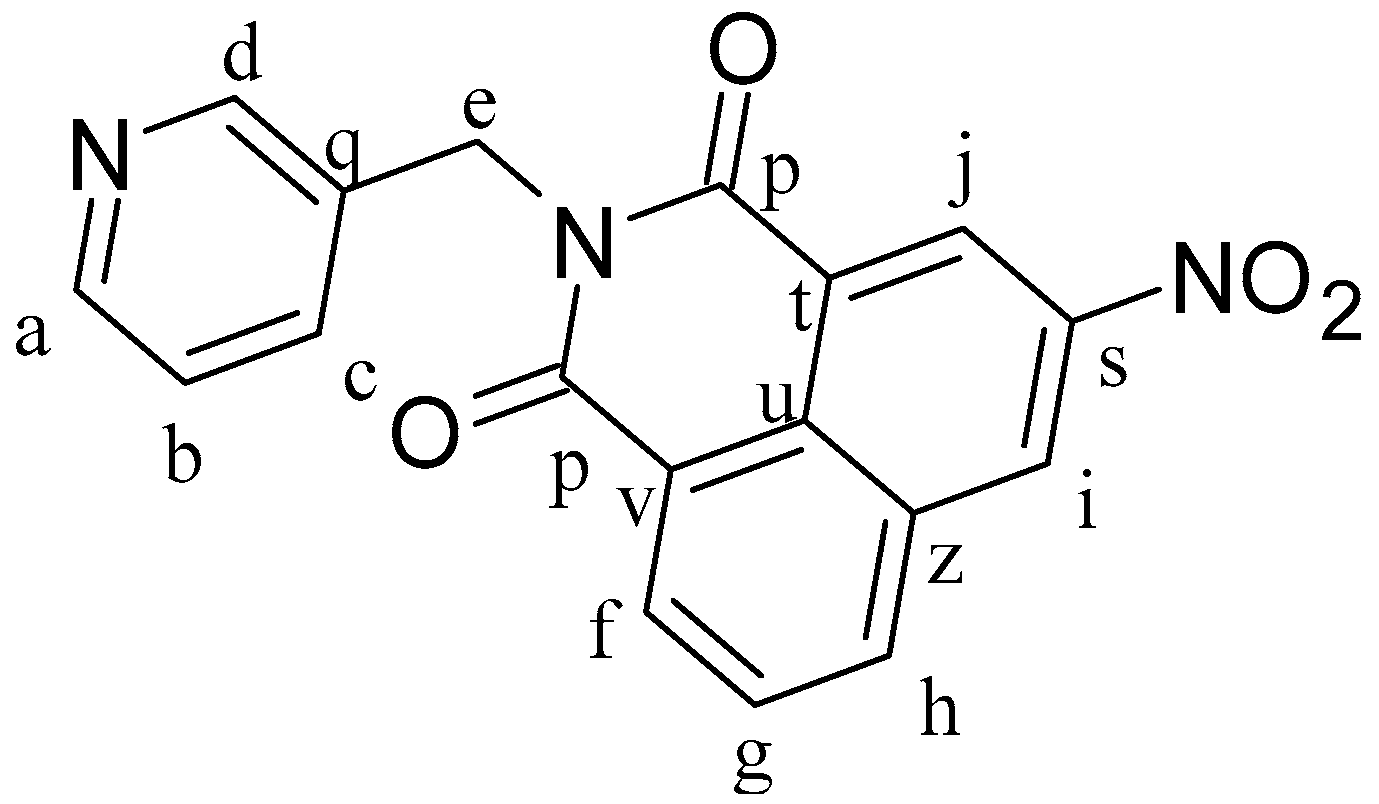
3-Nitro-1,8-naphthalenic anhydride (0.5 g, 2.06 mmol) and 3-picolylamine (0.267 g, 2.47 mmol) were dissolved in 25 mL of ethanol at 80 °C and heated for 24 h. After 1 h of reaction, there was a formation of a solid precipitate. The mixture was cooled to room temperature and a pale brown solid was separated by filtration and dried under vacuum, leading to the formation of L2 (
Figure 9). Yield: 89%.
1H-NMR (δ, ppm, 400 MHz, DMSO-d
6): 9.50 (d, J = 2.3 Hz, 1H, H
j), 8.99 (d, J = 2.3 Hz, 1H, H
i), 8.80 (dd, J = 8.4 Hz, J′ = 1.2 Hz, 1H, H
h), 8.71 (dd, J = 7.3 Hz, J′ = 1.1 Hz, 1H, H
a), 8.67 (d, J = 2.3 Hz, 1H, H
d), 8.47 (dd, J = 4.9 Hz, J′ = 1.6 Hz, 1H, H
f), 8.07 (dd, J = 8.3 Hz, J′ = 7.3 Hz, 1H, H
g), 7.81 (dt, J = 7.9 Hz, J′ = 2.1 Hz, 1H, H
b), 7.34 (m, 1H, H
c), 5.30 (s, 2H, H
e).
1H-NMR (δ, ppm, 400 MHz, CDCl
3): 9.37 (d, J = 2.2 Hz, 1H, H
j), 9.17 (d, J = 2.3 Hz, 1H, H
i), 8.87 (d, J = 2.3 Hz, 1H, H
d), 8.83 (dd, J = 7.3 Hz, J′ = 1.2 Hz, 1H, H
a), 8.55 (dd, J = 4.8 Hz, J′ = 1.7 Hz, 1H, H
f), 8.47 (ddd, J = 8.2 Hz, J′ = 1.2 Hz, J′′ = 0.5 Hz, 1H, H
h), 7.98 (dd, J = 8.3 Hz, J′ = 7.3 Hz, 1H, H
g), 7.93 (m, 1H, H
b), 7.28 (m, 1H, H
c), 5.43 (s, 2H, H
e).
13C-NMR (δ, ppm, 100 MHz, CDCl
3): 163.06 and 162.52 (C
p), 149.49 (C
a), 147.91 (C
s), 146.36 (C
d), 138.45 (C
j), 136.02 (C
i), 134.89 (C
h), 133.11 (C
c), 131.09 (C
q), 130.12 (C
z), 129.36 (C
g), 129.23 (C
f), 124.70 (C
z), 124.43 (C
v), 123.94 (C
t), 122.92 (C
b), and 41.41 (C
e). ESI-MS (+) m/z calc. 334.30, found 334.15. CHN analysis: C
18H
11N
3O
4: calc.: C: 64.87, H: 3.33, N: 12.61. Found: C: 65.08, H: 3.29, N: 12.46.
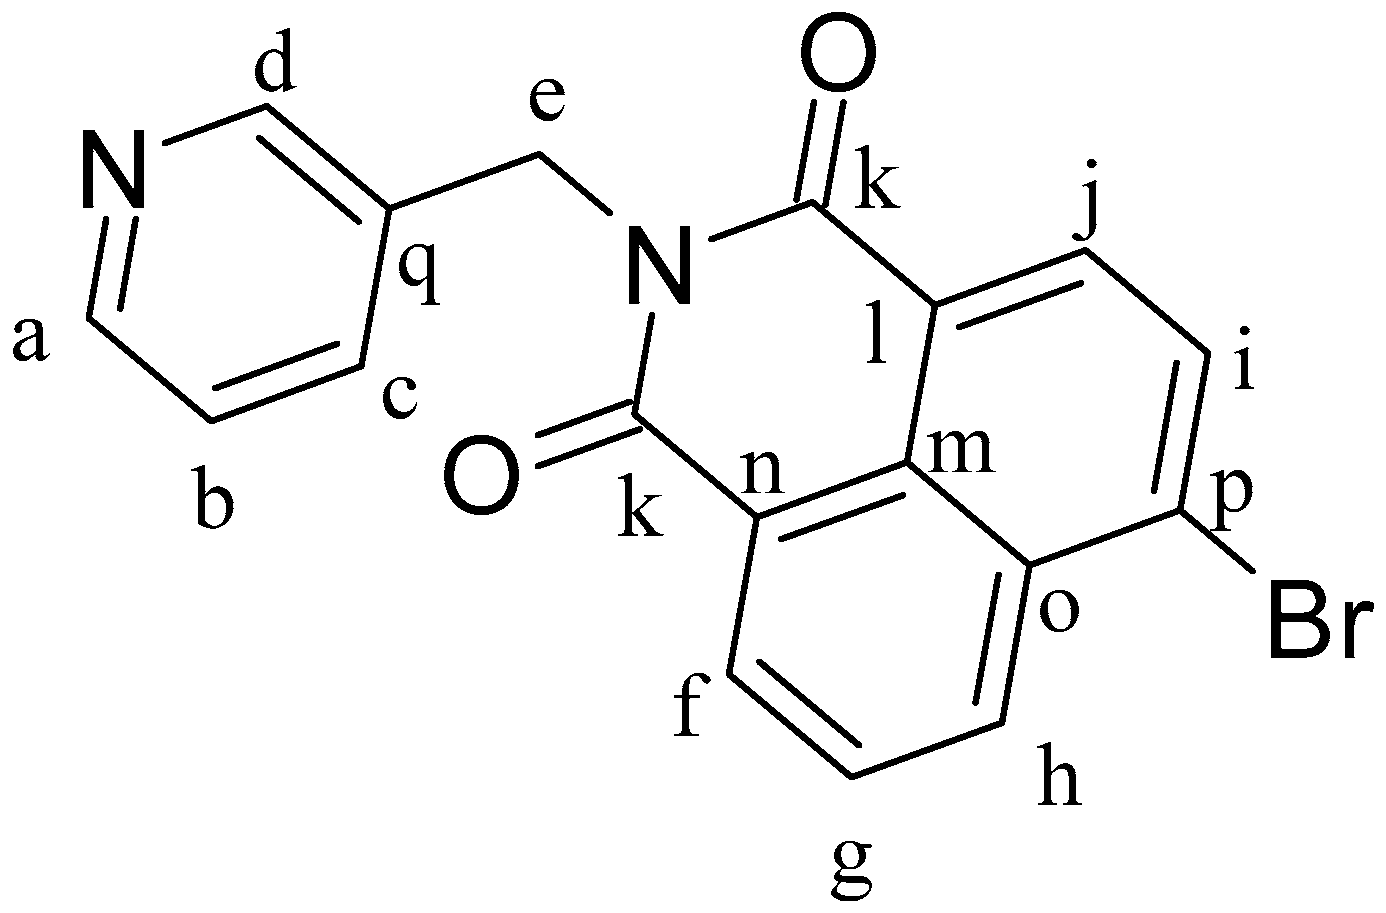
4-Bromo-1,8-naphthalenic anhydride (0.2 g, 0.73 mmol) and 3-picolylamine (0.093 g, 0.86 mmol) were dissolved in 15 mL of ethanol at 80 °C and heated for 24 h. After 1 h of reaction, a precipitate formed. The mixture was cooled to room temperature and the white solid was separated by filtration and dried under vacuum, obtaining L1Br (
Figure 10). Yield: 91%.
1H-NMR (δ, ppm, 400 MHz, CDCl
3): 8.87 (d, J = 2.4 Hz, 1H, H
d), 8.70 (dd, J = 7.3 Hz, J′ = 1.2 Hz, 1H, H
i), 8.62 (dd, J = 8.5 Hz, J′ = 1.2 Hz, 1H, H
j), 8.55 (dd, J = 5.0 Hz, J′ = 1.6 Hz, 1H, H
a), 8.46 (d, J = 7.9 Hz, 1H, H
h), 8.09 (d, J = 7.8 Hz, 1H, H
f), 7.99 (dt, J = 8.0 Hz, J′ = 2.0 Hz, 1H, H
g), 7.89 (dd, J = 8.5 Hz, J′ = 7.3 Hz, 1H, H
b), 7.33 (dd, J = 8.0 Hz, J′ = 4.9 Hz, 1H, H
c), 5.41 Hz (s, 2H, H
e).
13C-NMR (δ, ppm, 100 MHz, CDCl
3): 163.56 (C
k), 150.25 and 148.56 (C
a and C
d), 137.39 (C
f), 133.70 (C
g), 132.94 (C
p), 132.44 (C
b), 131.59 (C
h), 131.22 (C
i), 130.78 (C
q), 130.71 (C
n), 129.02 (C
o), 128.18 (C
c), 123.57 (C
j), 122.79 (C
l), 121.91 (C
m), and 41.24 (C
e). ESI-MS (+) m/z calc. 368.20, found 368.97. CHN analysis: C
18H
11BrN
2O
2: calculated: C: 58.88, H: 3.03, N: 7.63. Found: C: 58.84, H: 3.00, N: 7.88.
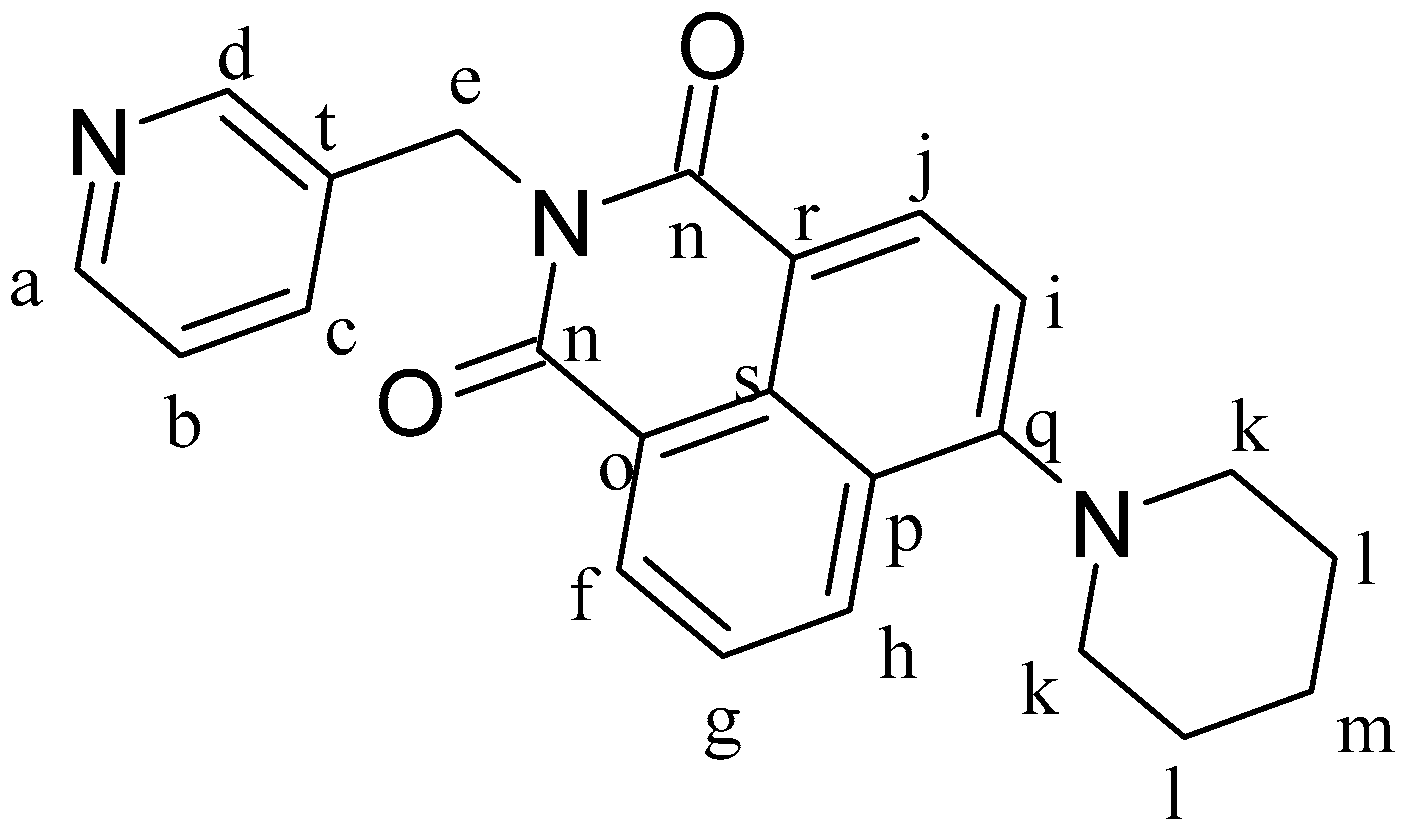
Ligand L3 (
Figure 11) was synthesized following a procedure reported in the literature [
18,
19]. L1Br (0.459 g, 1.25 mmol) was dissolved in 3 mL of piperidine, and the mixture was heated to 110 °C for 2 h. After cooling to room temperature, the excess of piperidine was removed under vacuum. The solid was dissolved in hot ethanol and recrystallized at −4 °C. The product was then collected by filtration, washed with ethanol, and finally dried under vacuum. The process yielded a bright orange solid. Yield: 89%.
1H-NMR (δ, ppm, 400 MHz, DMSO-D
6): 8.63 (d, J = 2.3 Hz, 1H, H
d), 8.50 (dd, J = 7.3 Hz, J′ = 1.1 Hz, 1H, H
f), 8.44 (m, 3H, H
a, H
i, H
j), 7.83 (dd, J = 8.5 Hz, J′ = 7.3 Hz, 1H, H
b), 7.74 (dt, J = 8.0 Hz, J′ = 2.0 Hz, 1H, H
g), 7.33 (dd, J = 8.2 Hz, J′ = 5.4 Hz, 2H, H
h, H
c), 5.27 (s,2H, H
e), 3.23 (d, J = 10.6 Hz, 4H, H
k), 1.83 (bs, 4H, H
l), 1.68 (bs, 2H, H
m).
1H-NMR (δ, ppm, 400 MHz, CDCl
3): 8.86 (d, J = 2 Hz, 1H, H
d), 8.60 (dd, J = 8.4 Hz, J′ = 1.2 Hz, 1H, H
f), 8.53 (dd, J = 8.4 Hz, J′ = 1.6 Hz, 2H, superimposed signals H
a e H
j), 8.42 (d, J = 9.6 Hz, J′ = 1.2 Hz, 1H, H
h), 7.99 (dt, J = 8 Hz, 1H, H
b), 7.70 (dd, J = 16 Hz, J′ = 7.6 Hz, 1H, H
g), 7.32 (dd, J = 12.8 Hz, J′ = 3,2 Hz, 1H, H
c), 7.20 (d, J = 8.2 Hz, 1H, H
i), 5.41 (s, 2H, H
e), 3.26 (bs, 4H, H
k),1.91 (bs, 4H, H
l), and 1.75 (bs, 2H, H
m). ESI-MS (+) m/z calc. 372.44, found 372.78. CHN analysis: C
23H
21N
3O
2: calc.: C: 74.37, H: 5.70, N: 11.31. Found: C: 74.15, H: 5.82, N: 11.24.
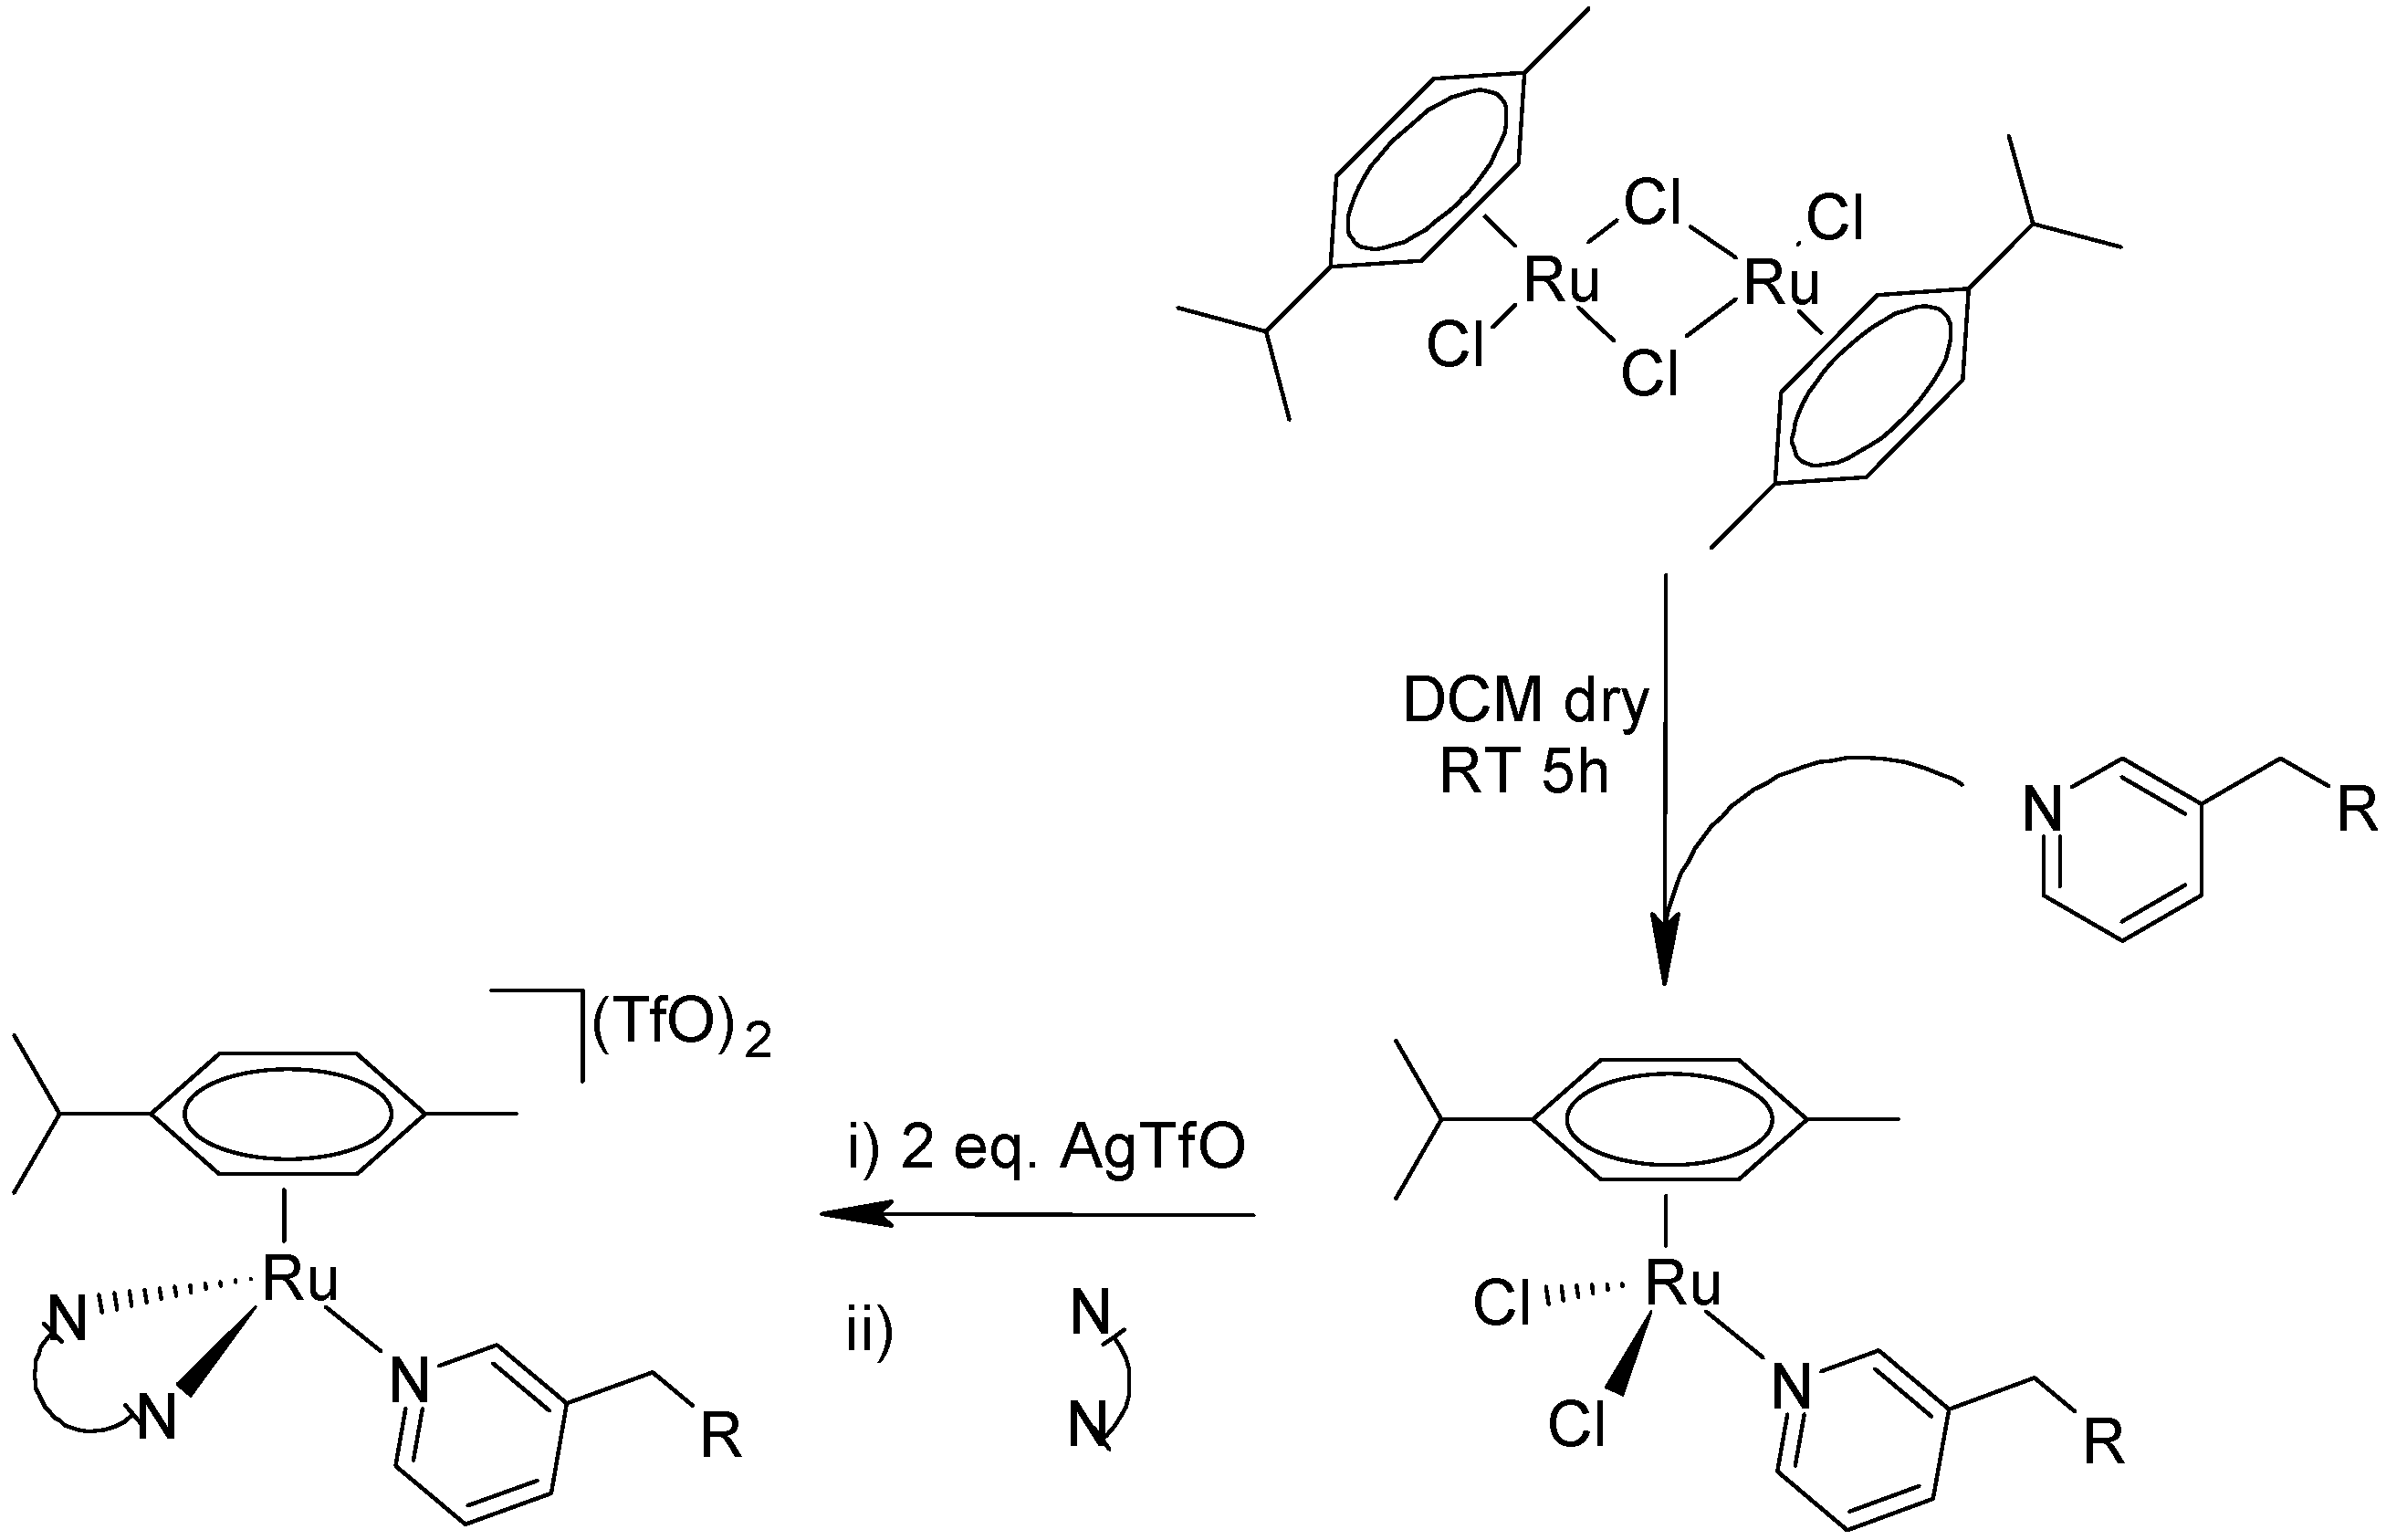
4.2. General Procedure for the Intermediate Complexes IC1, IC2, and IC3
[(η
6-p-cym)RuCl
2]
2 (1 mol eq.) and the ligand (L1, L2, or L3, 2 mol eq.) were dissolved in CH
2Cl
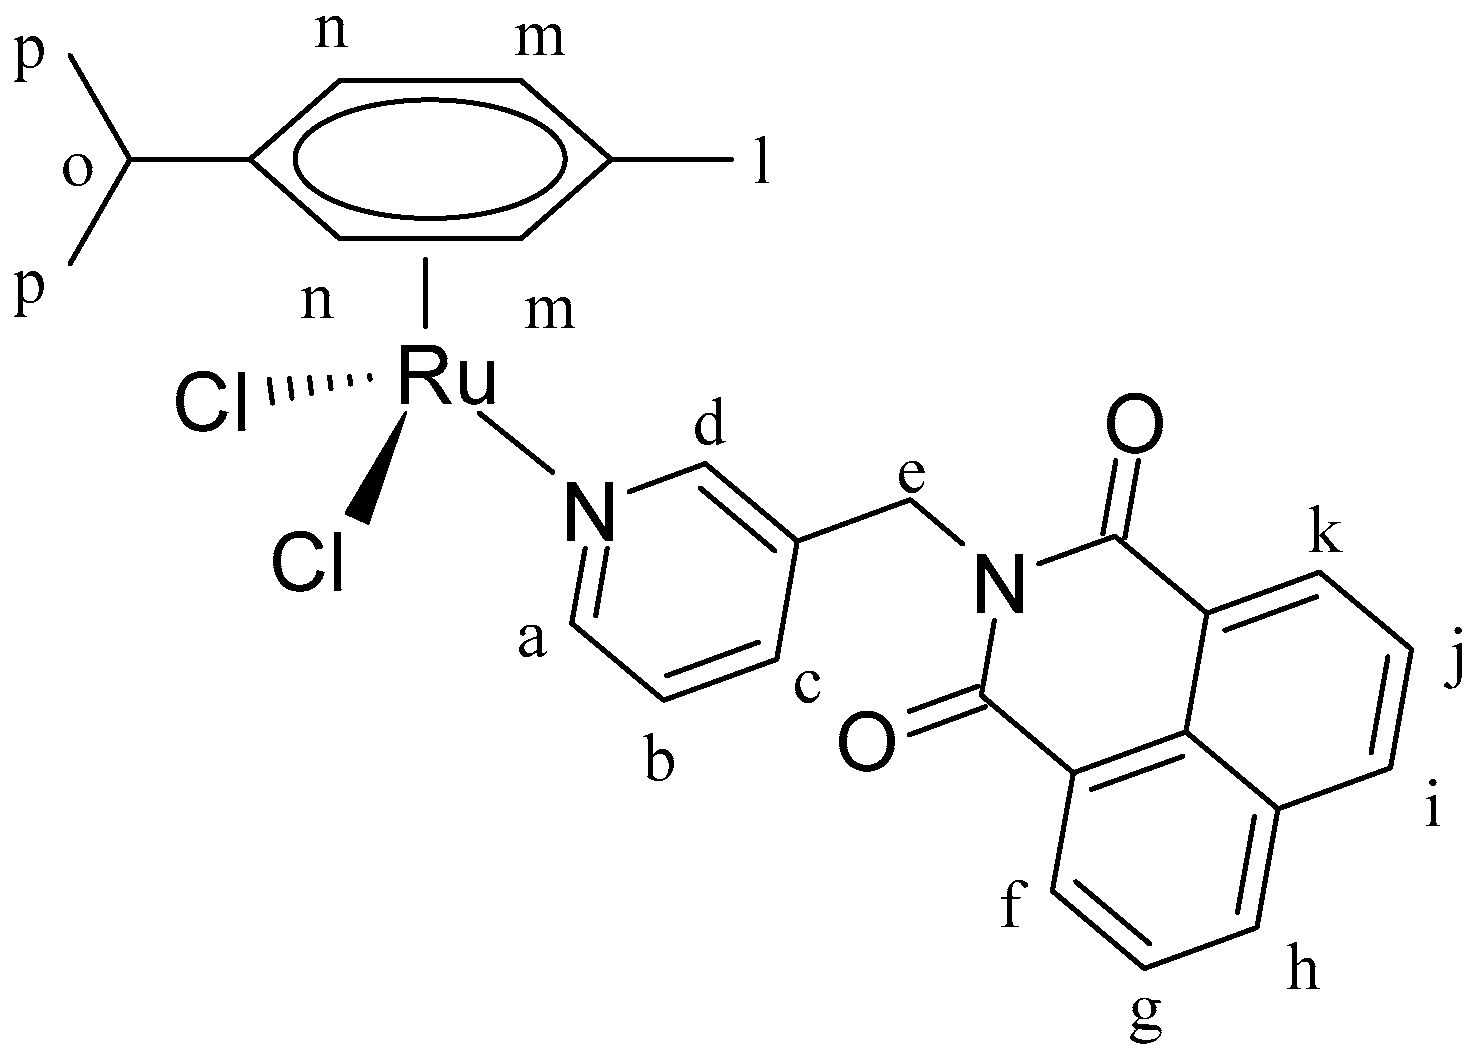
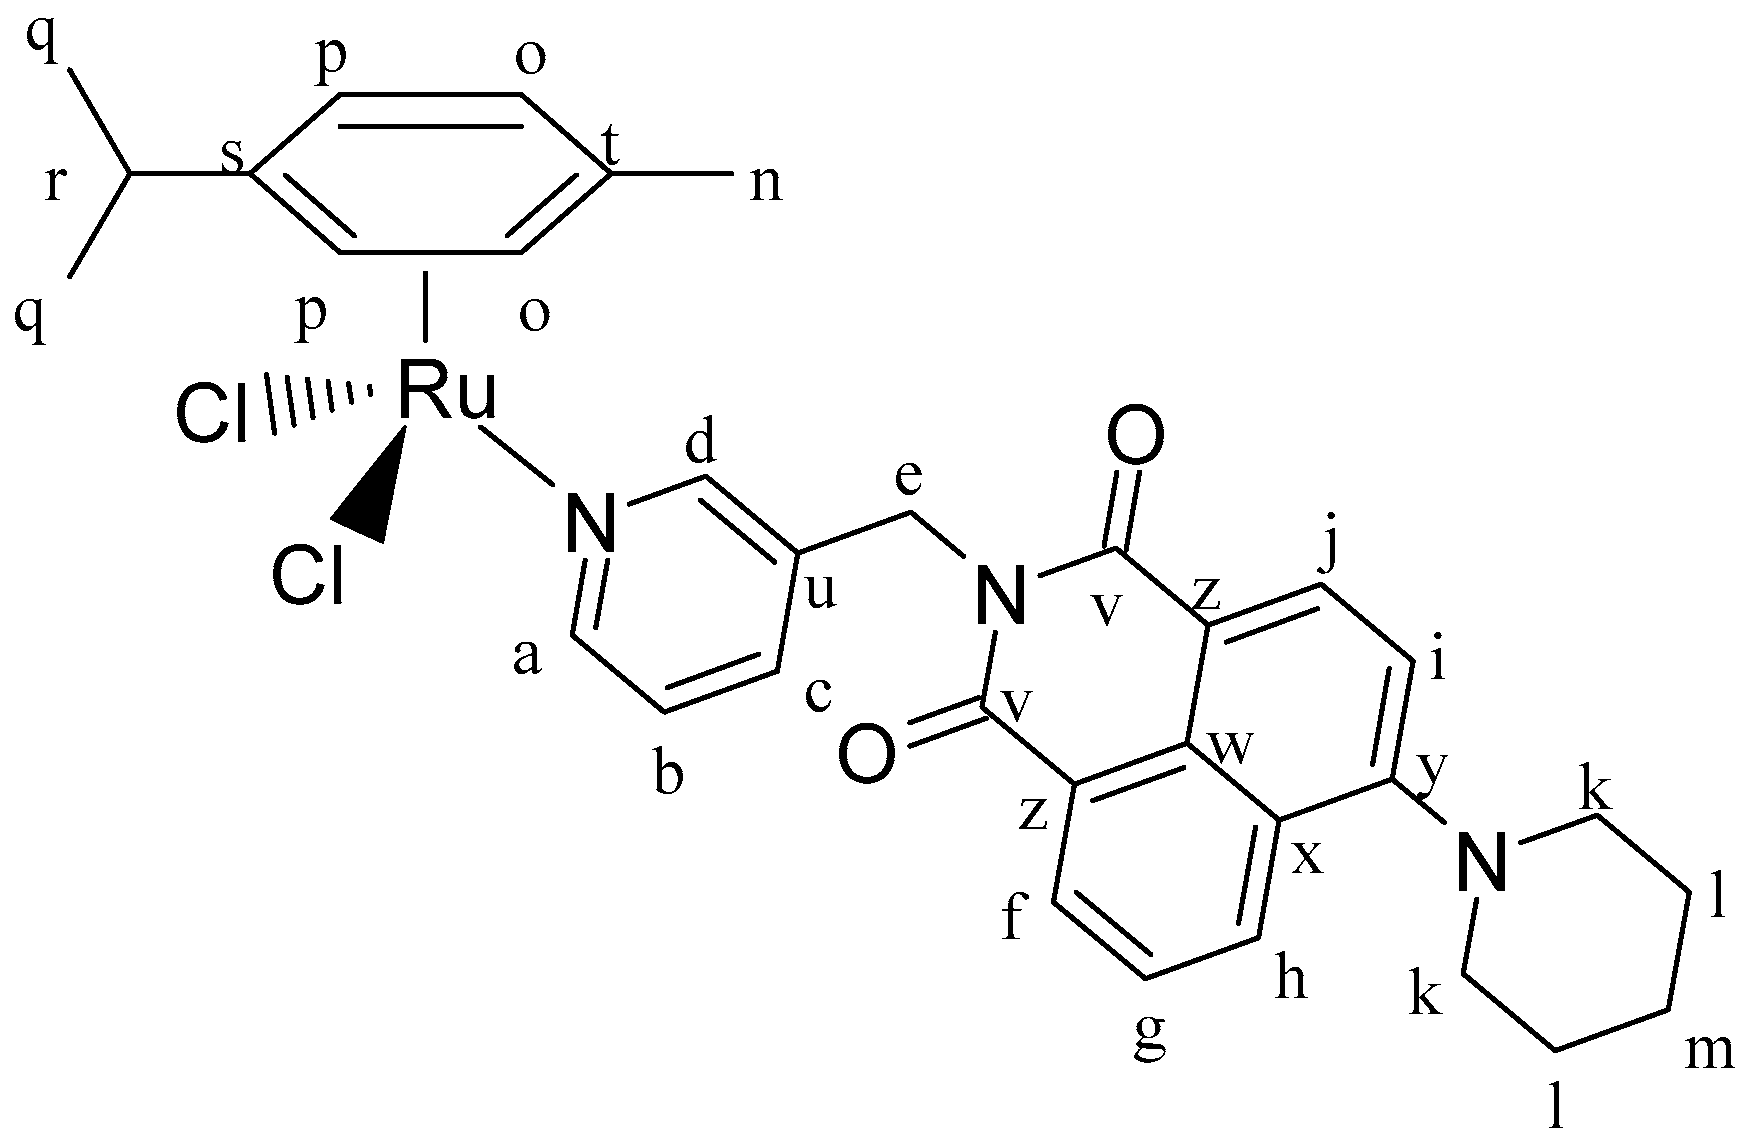
2 dry in a Schlenk flask with nitrogen atmosphere. The mixture was stirred for 5 h, then diethyl ether was added, and the solution was left at −4 °C overnight. The precipitate was collected by filtration, washed with cold diethyl ether, and dried under vacuum, allowing to isolate complexes IC1 (
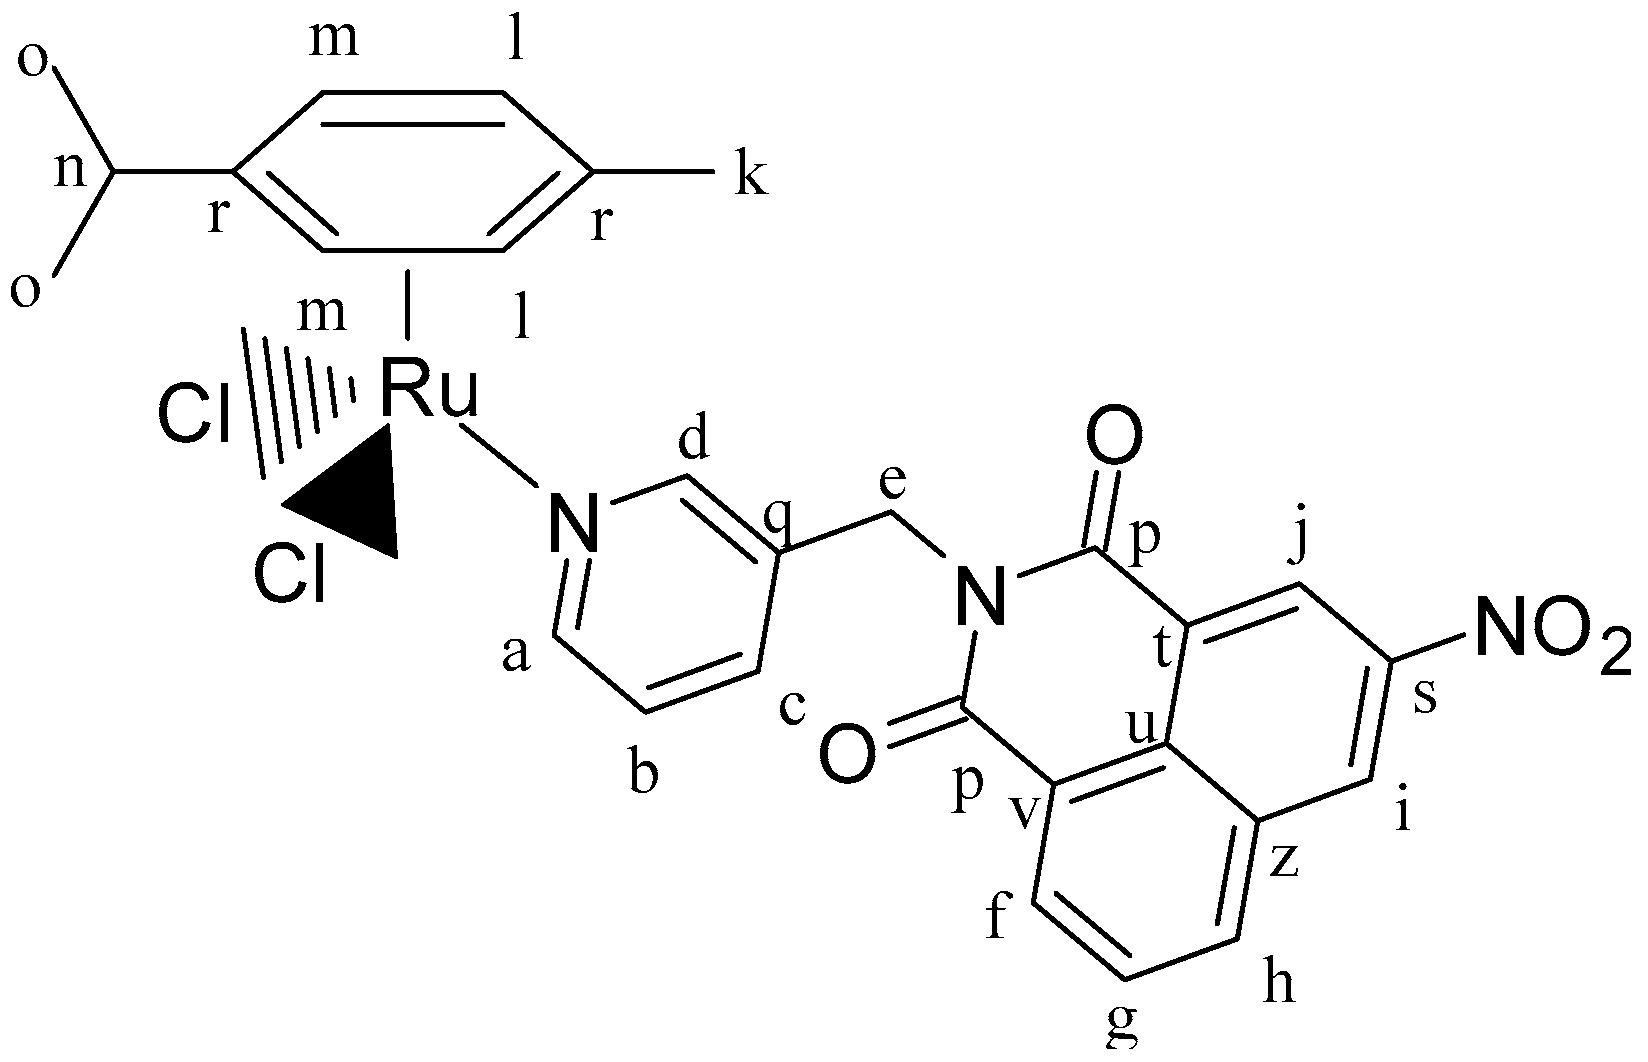
Figure 12), IC2 (
Figure 13) and IC3 (
Figure 14).
[(η6-p-cym)RuCl2]2 (0.36 g, 1.26 mmol), L1 (0.38 g, 0.63 mmol). Yield: 83%. 1H-NMR (δ, ppm, 400 MHz, CDCl3): 9.36 (d, J = 2.0 Hz, 1H, Hd), 8.95 (dd, J = 5.8, J′ = 1.4 Hz, 1H, Ha), 8.66 (dd, J = 7.3, J′ = 1.1 Hz, 2H, Hf, Hk), 8.28 (dd, J = 7.3, J′ = 1.2 Hz, 2H, Hh, Hi), 7.95 (m, 1H, Hb), 7.81 (dd, J = 8.2, J′ = 7.3 Hz, 2H, Hg, Hj), 7.25 (dd, J = 7.9, J′ = 5.7 Hz, 1H, Hc), 5.46 (d, J = 5.9 Hz, 2H, Hn), 5.39 (s, 2H, He), 5.28 (d, J = 5.9 Hz, 2H, Hm), 3.03 (m, 1H, Ho), 2.15 (s, 3H, Hl), 1.31 (d, J = 7.0 Hz, 6H, Hp). 13C-NMR (δ, ppm, 100 MHz, CDCl3): 164.10, 156.83, 153.45, 138.43, 134.56, 134.21, 131.78, 131.72, 128.31, 127.16, 124.19, 122.39,103.77, 97.07, 82.74, 82.67, 53.49, 40.87, 30.68, 22.32, and 18.13. ESI-MS (+) m/z calc. 559.04, found 559.16. CHN analysis: C28H26Cl2N2O2Ru: calc.: C: 56.57, H: 4.41, N: 4.71. Found: C: 56.74, H: 4.30, N: 5.03.
[(η6-p-cym)RuCl2]2 (0.15 g, 0.24 mmol), L2 (0.16 g, 0.48 mmol). Orange solid. Yield: 85%. 1H-NMR (δ, ppm, 400 MHz, CDCl3): 9.35 (d, J = 2.1 Hz, 2H, Hd, Hj), 9.18 (d, J = 2.2 Hz, 1H, Hi), 8.97 (d, J = 5.7 Hz, 1H, Ha), 8.83 (d, J = 5.7 Hz, 1H, Hf), 8.47 (d, J = 8.3 Hz, 1H, Hh), 7.98 (m, 2H, Hb, Hg), 7.26 (s, 1H, Hc), 5.46 (d, J = 5.8 Hz, 2H, Hm), 5.40 (s, 2H, He), 5.28 (d, J = 5.8 Hz, 2H, Hl), 3.03 (m, 1H, Hn), 2.16 (s, 3H, Hk), 1.33 (d, J = 6.9 Hz, 6H, Ho). 13C-NMR (δ, ppm, 100 MHz, CDCl3): 163.25 (Cp), 162.34 (Cp), 156.94 (Ca), 153.43 (Cd), 148.13 (Cs), 138.94 (Cf), 138.35 (Cb), 136.98 (Cg), 134.73 (Ch), 134.52 (Cc), 130.57 (Ct), 129.86 (Cq), 129.12 (Ci), 129.04 (Cj), 124.83 (Cu), 124.21 (Cv), 124.01 (Cz), 103.69 (Cr), 96.99 (Cr), 82.63 (Cm,l), 40.74 (Ce), 30.58 (Ck), 22.26 (Co), and 18.07 (Cn). ESI-MS (+) m/z [M-Cl]+ calc. 604.05, found 604.22. CHN analysis: C28H25Cl2N3O4Ru: calc.: C: 52.59, H: 3.94, N: 6.57. Found: C: 52.26, H: 3.93, N: 6.26.
[(η6-p-cym)RuCl2]2 (0.10 g, 0.16 mmol), L3 (0.12 g, 0.32 mmol). Orange solid. Yield: 89%. 1H-NMR (δ, ppm, 400 MHz, CDCl3): 9.34 (d, J = 1.9 Hz, 1H, Hd), 8.93 (dd, J = 5.6, J′ = 1.4 Hz, 1H, Ha), 8.61 (dd, J = 7.3, J′ = 1.2 Hz, 1H, Hf), 8.53 (d, J = 8.1 Hz, 1H, Hj), 8.43 (dd, J = 8.5, J′ = 1.2 Hz, 1H, Hh), 7.94 (dt, J = 7.9, J′ = 1.7 Hz, 1H, Hb), 7.71 (dd, J = 8.5, J′ = 7.3 Hz, 1H, Hg), 7.22 (m, 2H, Hc, Hi), 5.46 (d, J = 5.9 Hz, 2H, Hp), 5.37 (s, 2H, He), 5.28 (d, J = 5.9 Hz, 2H, Ho), 3.27 (m, 4H, Hk), 3.00 (m, 1H, Hr), 2.13 (s, 3H, Hn), 1.90 (m, 4H, Hl), 1.76 (d, J = 5.8 Hz, 2H, Hm), 1.30 (d, J = 6.9 Hz, 6H, Hq). 13C-NMR (δ, ppm, 100 MHz, CDCl3): 164.48 (Cv), 163.92 (Cv), 157.82 (Cy), 156.79 (Ca), 153.13 (Cd), 138.31 (Cb), 134.47 (Cc), 133.15 (Cw), 131.40 (Cf), 131.23 (Cg), 130.07 (Cu), 126.26 (Cx), 125.44 (Ch), 124.11 (Ci), 122.71 (Cz), 115.23 (Cz), 114.79 (Cj), 103.62 (Cs), 97.03 (Ct), 82.63 (Co,p), 54.56 (Ck), 40.60 (Ce), 30.61 (Cn), 26.21 (Ck,l), 24.32 (Cm), 22.27 (Cq), and 18.07 (Cr). ESI-MS (+) m/z [M-Cl]+ calc. 642.18, found 642.13. CHN analysis: C33H35Cl2N3O2Ru calc.: C: 58.49, H: 5.21, N: 10.46. Found: C: 58.62, H: 5.04, N: 10.26.
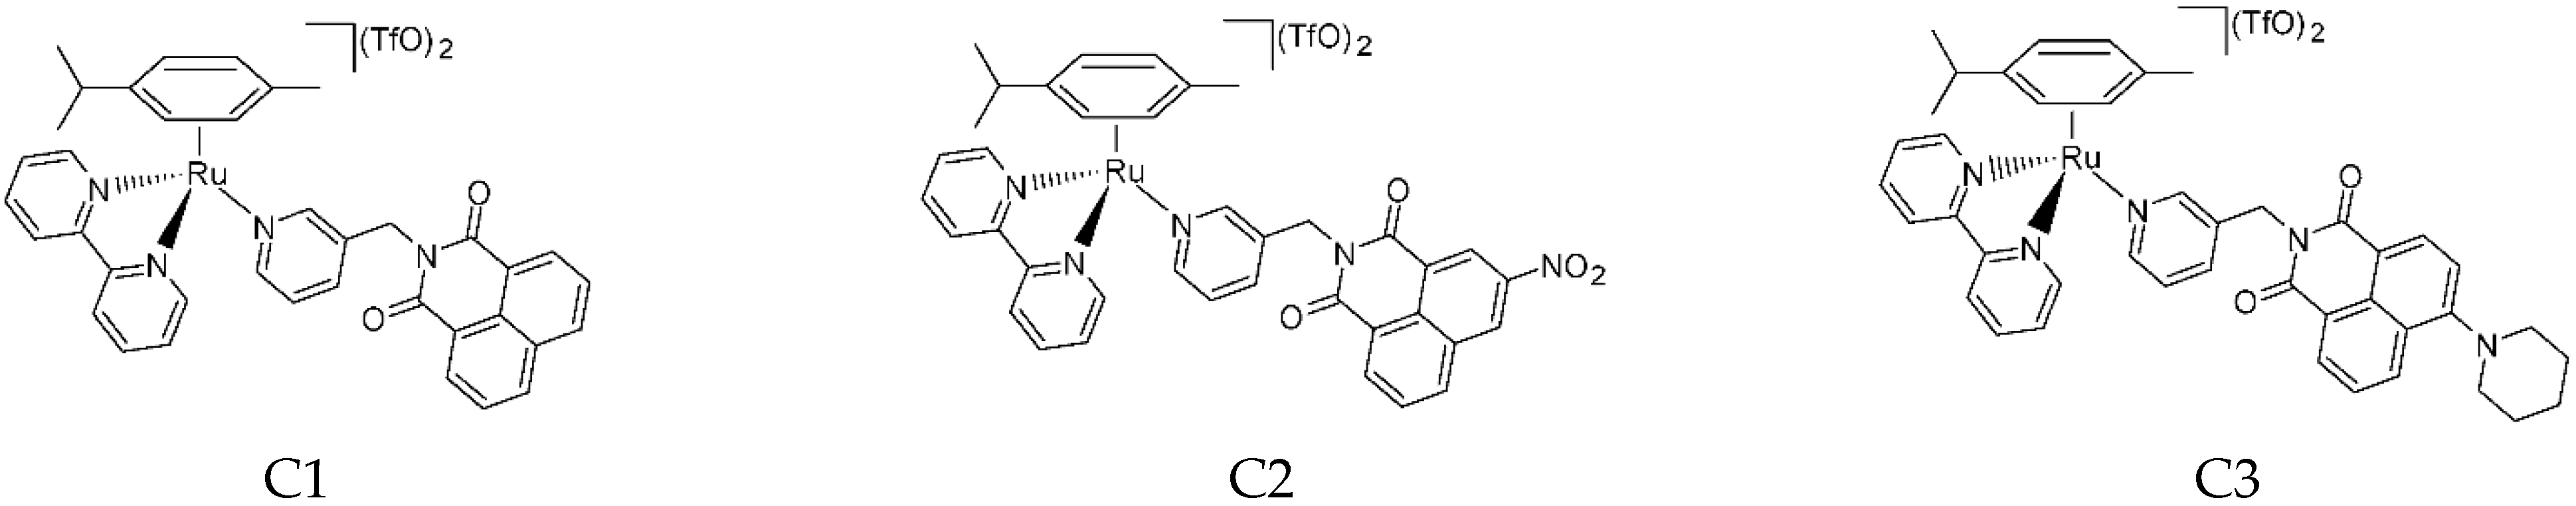
4.3. General Procedure for Synthesis of Complexes C1, C2 and C3
The intermediate complex (IC1, IC2, or IC3, 1 eq.) was dissolved in dry CH
2Cl
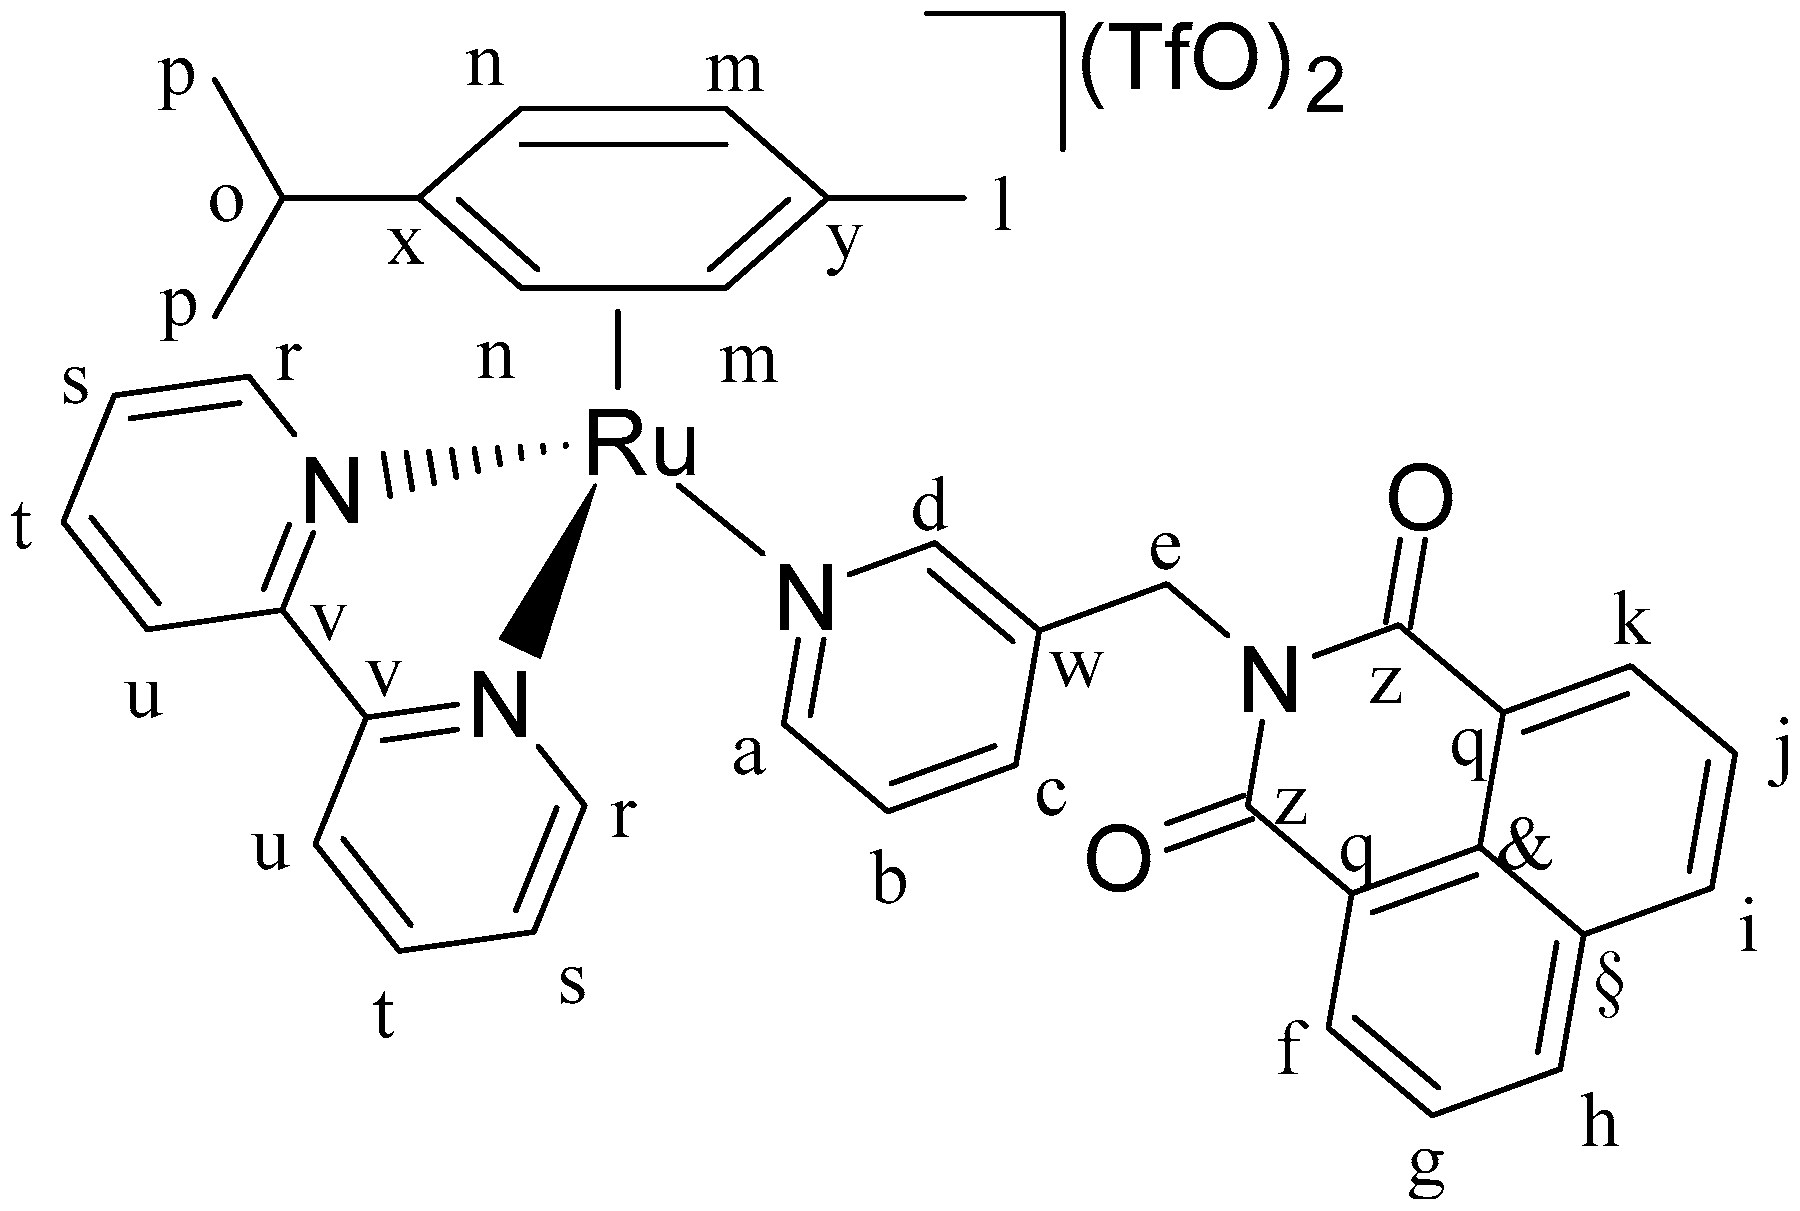
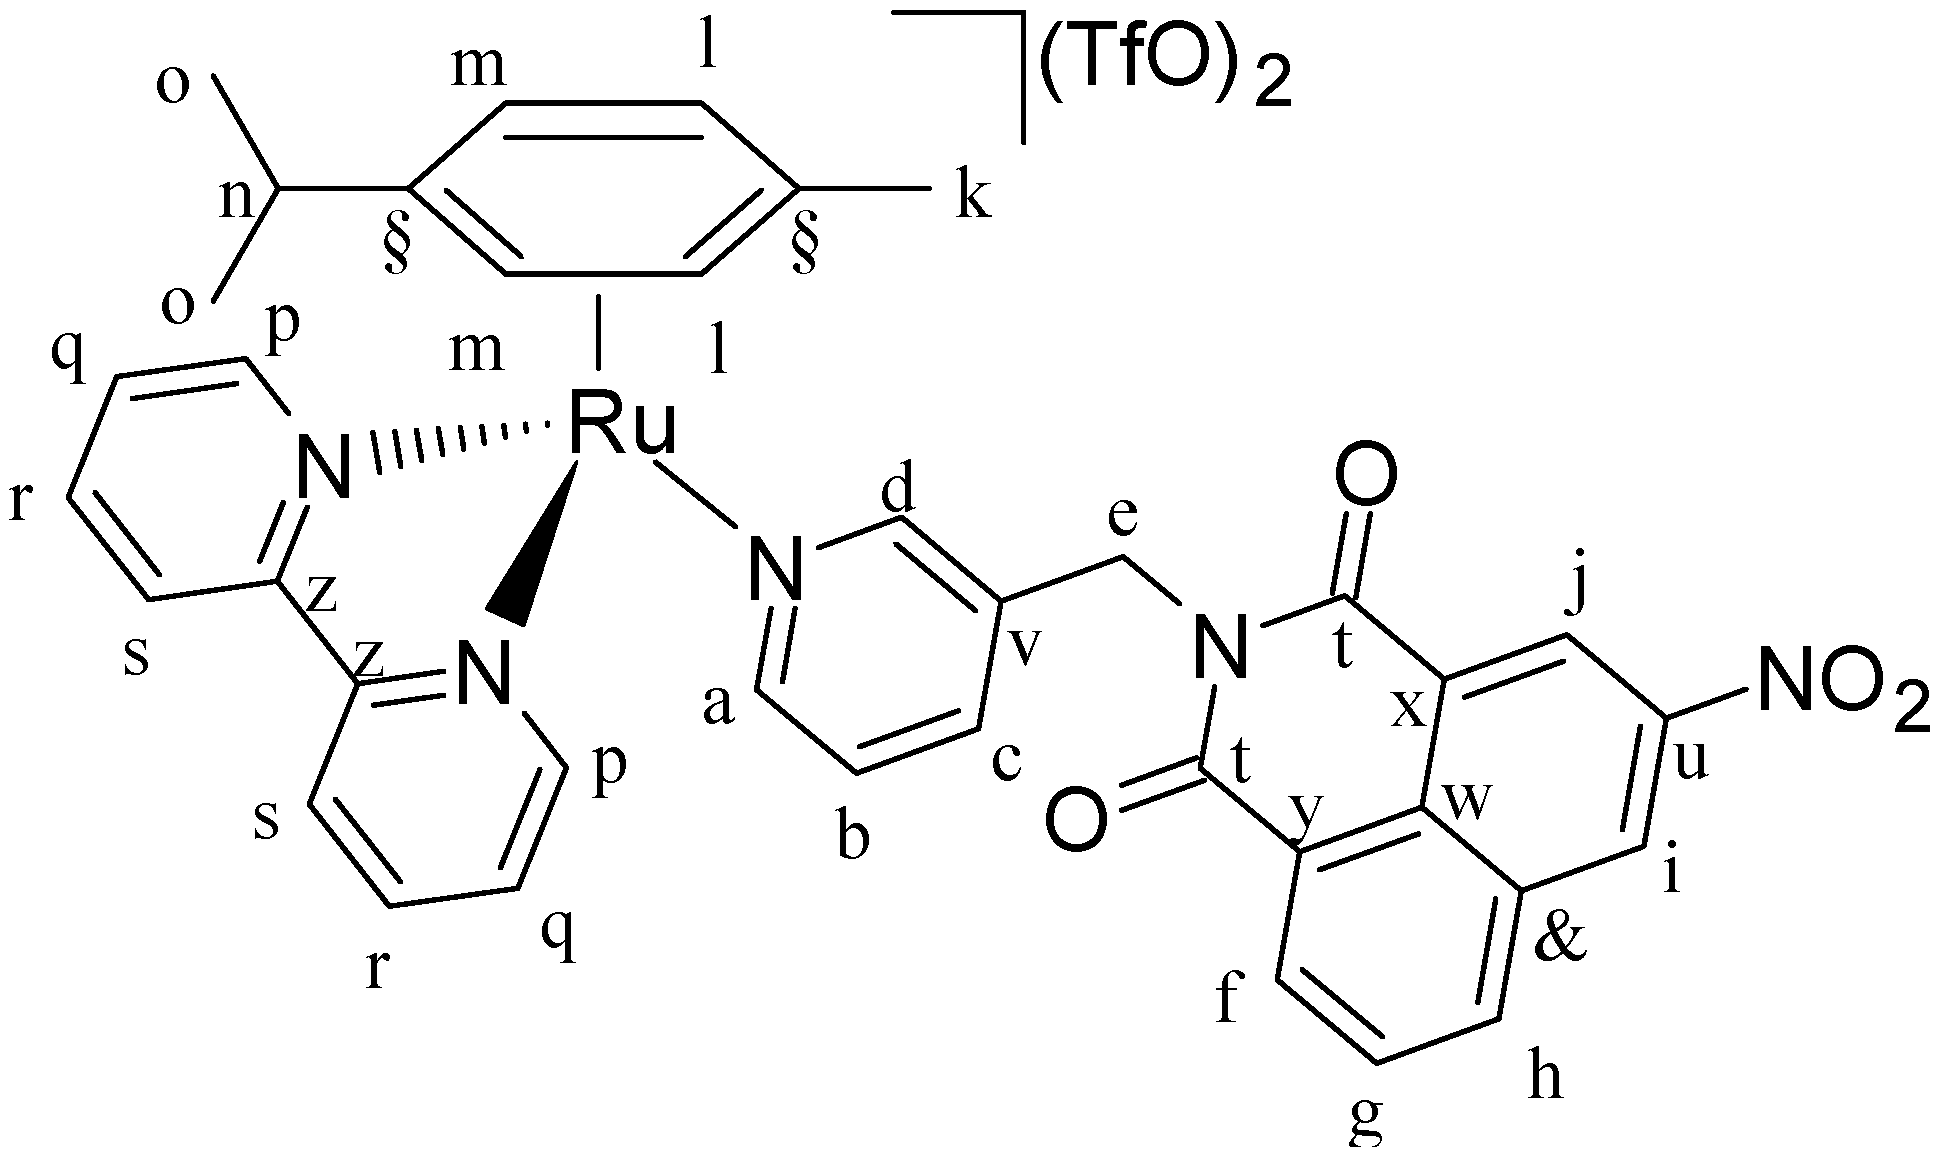
2 in a Schlenk flask with nitrogen atmosphere. AgTfO (TfO = trifluoromethanesulfonate; 2 mol eq.) was dissolved in dry MeOH in nitrogen atmosphere and dropped slowly into the ruthenium complex solution. The solution became turbid immediately. It was stirred for 2 h at room temperature, and the flask was covered with aluminium foil to keep the solution in dark conditions. Then, the AgCl formed was removed by filtering with a Schlenk filter and the clear solution was dropped into a Schlenk flask containing bipyridine (1 mol eq.). The mixture was stirred overnight, always under a nitrogen atmosphere and in a dark environment. Next, diethyl ether was added, and the solution was left at −4 °C overnight. The precipitate was collected by filtration, washed with cold diethyl ether, and dried under vacuum. In this way complexes C1 (
Figure 15), C2 (
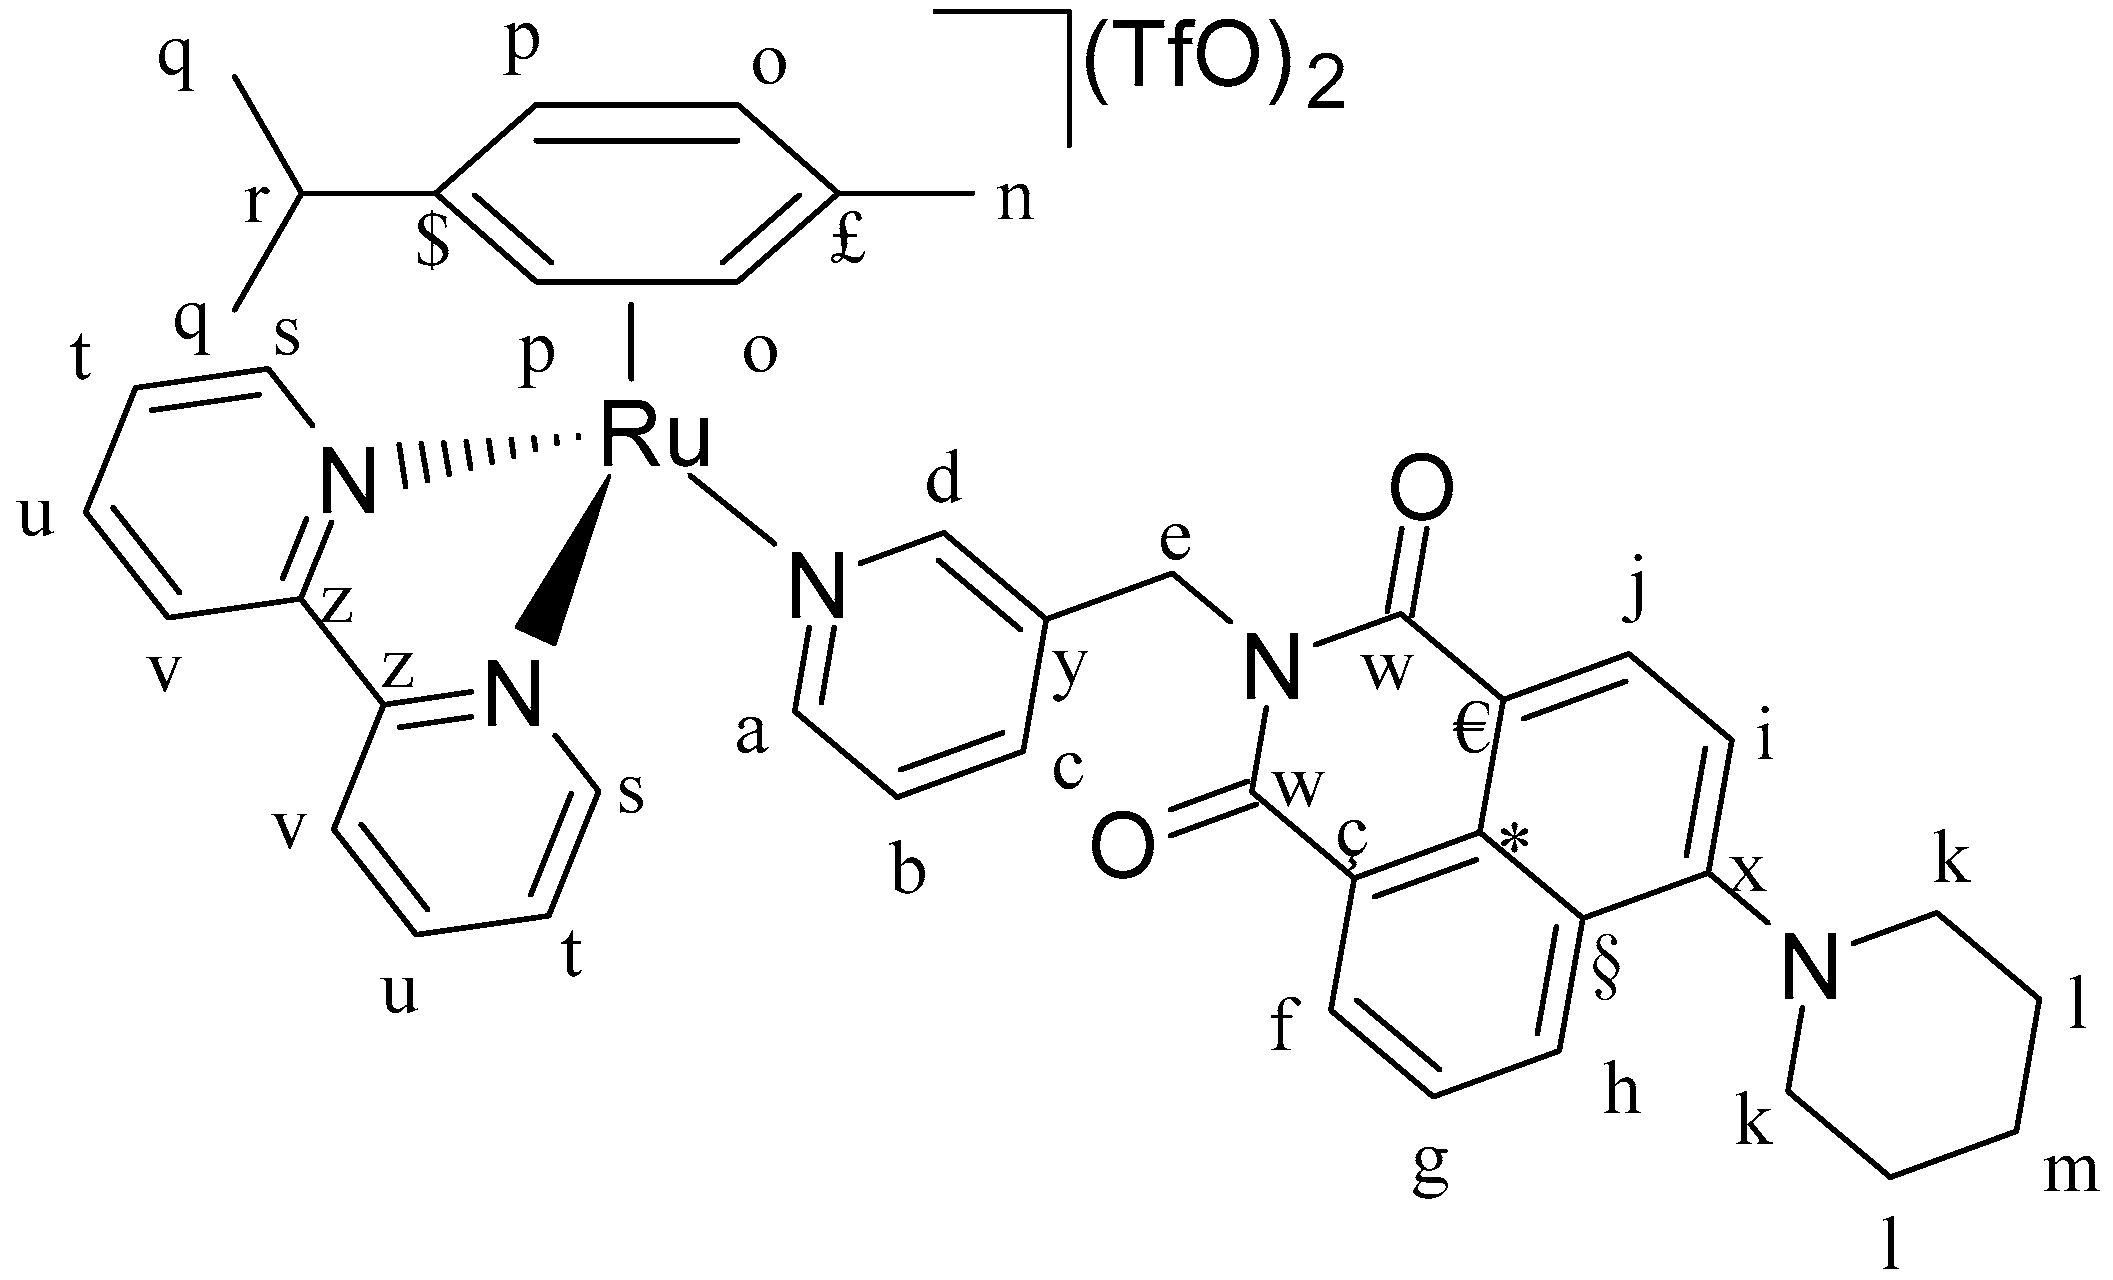
Figure 16) and C3 (
Figure 17) were isolated.
IC1 (0.10 g, 0.17 mmol, 1 eq.), AgTfO (0.09 g, 0.34 mmol, 2 eq.) and 2,2′-bipyridine (0.03 g, 0.17 mmol, 1 eq.). Orange solid. Yield: 77%. 1H-NMR (δ, ppm, 400 MHz, DMSO-d6): 9.88 (dd, J = 5.7, J′ = 1.4 Hz, 2H, Hr), 8.51 (ddd, J = 8.3, J′ = 3.7, J′′ = 1.3 Hz, 5H, Ha, Hu, Hf, Hk), 8.46 (d, J = 1.1 Hz, 1H, Hd), 8.37 (d, J = 5.5 Hz, 1H, Hc), 8.29 (td, J = 7.9, J = 1.4 Hz, 2H, Hs), 7.96 (m, 4H, Hj, Hi, Hh, Hg), 7.91 (dd, J = 8.2, J′ = 7.3 Hz, 2H, Ht), 7.43 (dd, J = 7.9, J′ = 5.7 Hz, 1H, Hb), 6.66 (d, J = 6.3 Hz, 2H, Hm), 6.27 (d, J = 6.3 Hz, 2H, Hn), 5.16 (s, 2H, He), 2.41 (m, 1H, Hn), 1.78 (s, 3H, Hl), 0.82 (d, J = 6.9 Hz, 6H, Hp). 1H-NMR (δ, ppm, 400 MHz, CDCl3): 10.32 (d, J = 5.5 Hz, 2H, Hr), 8.76 (d, J = 5.7 Hz, 1H, Ha), 8.63 (s, 1H, Hd), 8.50 (d, J = 7.2 Hz, 2H, Hu), 8.25 (d, J = 8.4 Hz, 2H, Hk, Hf), 8.21 (t, J = 7.8 Hz, 2H, Hs), 8.11 (m, 4H, Ht, Hh, Hi), 7.93 (d, J = 9.0 Hz, 1H, Hc), 7.79 (t, J = 8 Hz, Hg, Hj), 7.42 (t, J = 7.4 Hz, 1H, Hb), 6.54 (d, J = 6.3 Hz, 2H, Hm), 6.45 (d, J = 6.3 Hz, 2H, Hn), 5.26 (s, 2H, He), 2.42 (m, 1H, Ho), 1.87 (s, 3H, Hl), 0.93 (d, J = 6.8 Hz, 6H, Hp). 13C-NMR (δ, ppm, 100 MHz, CDCl3): 163.71 (Cz), 158.05 (Cr), 156.38 (Cr), 153.18 (Ca,d), 140.63 (Cv), 138.42 (Cb), 134.81 (Cf,k), 133.70 (Cq), 131.86 (Cg,j), 130.62 (Cw), 127.09 (Ch,i), 123.44 (Cc), 121.87 (C§,&), 102.70 (Cx), 92.36 (Cy), 85.16 (Cm,n), 40.30 (Ce), 31.05 (Cl), 22.27 (Cp), and 18.03 (Co). ESI-MS(+) m/z [M-TfO-]+ m/z calc. 829.84 found 829.14. CHNS analysis: C40H34F6N4O8RuS2: calc.: C: 49.13, H: 3.50, N: 5.73, S: 6.56. Found: C: 48.81, H: 3.87, N: 5.75, S: 6.43.
IC2 (0.050 g, 0.078 mmol, 1 eq.), AgTfO (0.040 g, 0.156 mmol, 2 eq.) and 2,2′-bipyridine (0.012 g, 0.078 mmol, 1 eq.). Red solid. Yield: 71%. 1H-NMR (δ, ppm, 400 MHz, DMSO-d6): 9.89 (d, J = 6.2 Hz, 1H, Hp), 9.53 (s, 1H, Hj), 8.89 (s, 1H, Hi), 8.82 (d, J = 8.1 Hz, 1H, Ha), 8.64 (d, J = 7.4 Hz, 1H, Hf), 8.57 (s, 1H, Hd), 8.54 (d, J = 9.0 Hz, 2H, Hs), 8.37 (d, J = 5.5 Hz, 1H, Hc), 8.32 (t, J = 6.2 Hz, 2H, Hq), 8.09 (t, J = 8.1 Hz, 1H, Hg), 8.00 (s, 3H, Hr, Hh), 7.44 (t, J = 7.4 Hz, 1H, Hb), 6.68 (d, J = 6.3 Hz, 2H, Hl), 6.27 (d, J = 6.3 Hz, 2H, Hm), 5.17 (s, 2H, He), 2.45 (m, 1H, Hn), 1.77 (s, 3H, Hk), 0.81 (d, J = 6.8 Hz, 6H, Ho). 1H-NMR (δ, ppm, 400 MHz, CDCl3): 10.40 (d, J = 5.6 Hz, 2H, Hp), 9.14 (s, 1H, Hj), 9.06 (s, 1H, Hi), 8.78 (s, 2H, Hs), 8.72 (d, J = 8.1 Hz, 1H, Ha), 8.45 (d, J = 7.4 Hz, 1H, Hf), 8.27 (t, J = 6.2 Hz, 2H, Hq), 8.18 (t, J = 6.2 Hz, 2H, Hr), 8.12 (d, J = 5.5 Hz, 2H, Hd, Hh), 7.98 (t, J = 8.1 Hz, 1H, Hg), 7.90 (t, J = 5.5 Hz, 1H, Hc), 7.43 (t, J = 7.4 Hz, 1H, Hb), 6.50 (m, 4H, Hl, Hm), 5.34 (s, 2H, He), 2.43 (m, 1H, Hn), 1.90 (s, 3H, Hk), 0.94 (d, J = 6.8 Hz, 6H, Ho). 13C-NMR (δ, ppm, 100 MHz, CDCl3): 162.45 (Ct), 162.15 (Ct), 158.21 (Cp), 154.51 (Ca), 154.01 (Cd), 146.68 (Cu), 140.69 (Cz), 140.09 (Cu), 136.51 (Cf), 136.33 (Cg), 134.87 (Ch), 131.15 (Cb,c), 130.77 (Cw), 130.43 (Cq), 129.48 (Cv), 129.33 (Ci), 127.47 (Cj), 124.24 (Cx), 123.99 (Cy), 123.85 (C&), 123.09 (Cr,s), 103.98 (C§), 92.35 (Cm), 84.85 (Cl), 40.63 (Ce), 31.12 (Ck), 22.36 (Co), 21.93 (Co), and 18.05 (Cn). ESI-MS (+) m/z [M-TfO-]+ m/z calc. 873.85. found 874.23. CHNS analysis: C40H33F6N5O10RuS2: calc.: C: 46.97, H: 3.25, N: 6.85, S: 6.27. Found: C: 46.52, H: 3.41, N: 6.30, S: 6.26.
IC3 (0.12 g, 0.17 mmol, 1 eq.), AgTfO (0.09 g, 0.35 mmol, 2 eq.) and 2,2′-bipyridine (0.03 g, 0.17mmol, 1 eq.). Orange solid. Yield: 91%. 1H-NMR (δ, ppm, 400 MHz, DMSO-d6): 9.87 (d, J = 5.5 Hz, 2H, Hs), 8.51 (m, 3H, Ha, Hd, Hf), 8.44 (dd, J = 7.8, J = 6.4 Hz, 2H, Ht), 8.35 (m, 2H, Hj, Hh), 8.29 (t, J = 7.9 Hz, 2H, Hu), 7.95 (t, J = 7.0 Hz, 3H, Hv, Hc), 7.84 (m, 1H, Hg), 7.43 (m, 1H, Hb), 7.33 (d, J = 8.3 Hz, 1H, Hi), 6.66 (d, J = 6.2 Hz, 2H, Hp), 6.27 (d, J = 6.3 Hz, 2H, Ho), 5.13 (s, 2H, He), 3.24 (s, 4H, Hk), 2.45 (m, 1H, Hr), 1.84 (s, 4H, Hl), 1.78 (s, 3H, Hn), 1.69 (s, 2H, Hm), 0.82 (d, J = 6.9 Hz, 6H, Hq). 1H-NMR (δ, ppm, 400 MHz, CDCl3): 10.24 (d, J = 5.7 Hz, 2H, Hs), 8.76 (d, J = 5.5 Hz, 1H, Ha), 8.56 (s, 1H, Hd), 8.41 (t, J = 6.2 Hz, 2H, Ht), 8.35 (d, J = 8.1 Hz, 1H, Hf), 8.20 (m, 4H, Hv, Hh, Hj), 8.07 (t, J = 6.2 Hz, 2H, Hu), 7.93 (d, J = 7.4 Hz, 1H, Hc), 7.69 (d, J = 8.5, 1H, Hg), 7.40 (t, J = 7.4 Hz, 1H, Hb), 7.24 (d, J = 8.2 Hz, 1H, Hi), 6.52 (d, J = 6.3 Hz, 2H, Ho), 6.42 (d, J = 6.3 Hz, 2H, Hp), 5.20 (s, 2H, He), 3.29 (s, 4H, Hk), 2.41 (m, 1H, Hr), 1.92 (bs, 4H, Hl), 1.86 (s, 3H, Hn), 1.77 (s, 2H, Hm), 0.92 (d, J = 6.8 Hz, 6H, Hq). 13C-NMR (δ, ppm, 100 MHz, CDCl3): 163.91 (Cw), 163.05 (Cw), 157.35 (Cx), 154.78 (Cs), 153.04 (Ca), 140.68 (Cz), 140.39 (Cd), 136.81 (Cb), 133.04 (Cc), 131.55 (Cf), 131.07 (Cg), 130.42 (C€), 130.35 (Ct), 129.47 (Cy), 127.35 (Cu), 125.73 (Cç), 125.31 (Ch), 123.67 (Cv), 122.36 (Ci), 122.11 (C*), 119.26 (C§), 116.00 (Cj), 109.26 (C£), 103.45 (C$), 92.42 (Co), 85.00 (Cp), 55.21 (Ck), 40.23 (Ce), 31.24 (Cn), 25.75 (Cl), 23.66 (Cm), 22.19 (Cq), and 17.94 (Cq). ESI-MS (+) m/z [M-TfO-]+ m/z calc. 911.98. found 912.49. CHNS analysis: C45H43F6N5O8RuS2: calc.: C: 50.94, H: 4.09, N: 6.60, S: 6.04. Found: C: 50.86, H: 4.05, N: 6.34, S: 5.99.


 ,
, 


