Immune Responses to Multi-Frequencies of 1.5 GHz and 4.3 GHz Microwave Exposure in Rats: Transcriptomic and Proteomic Analysis
Abstract
:1. Introduction
2. Results
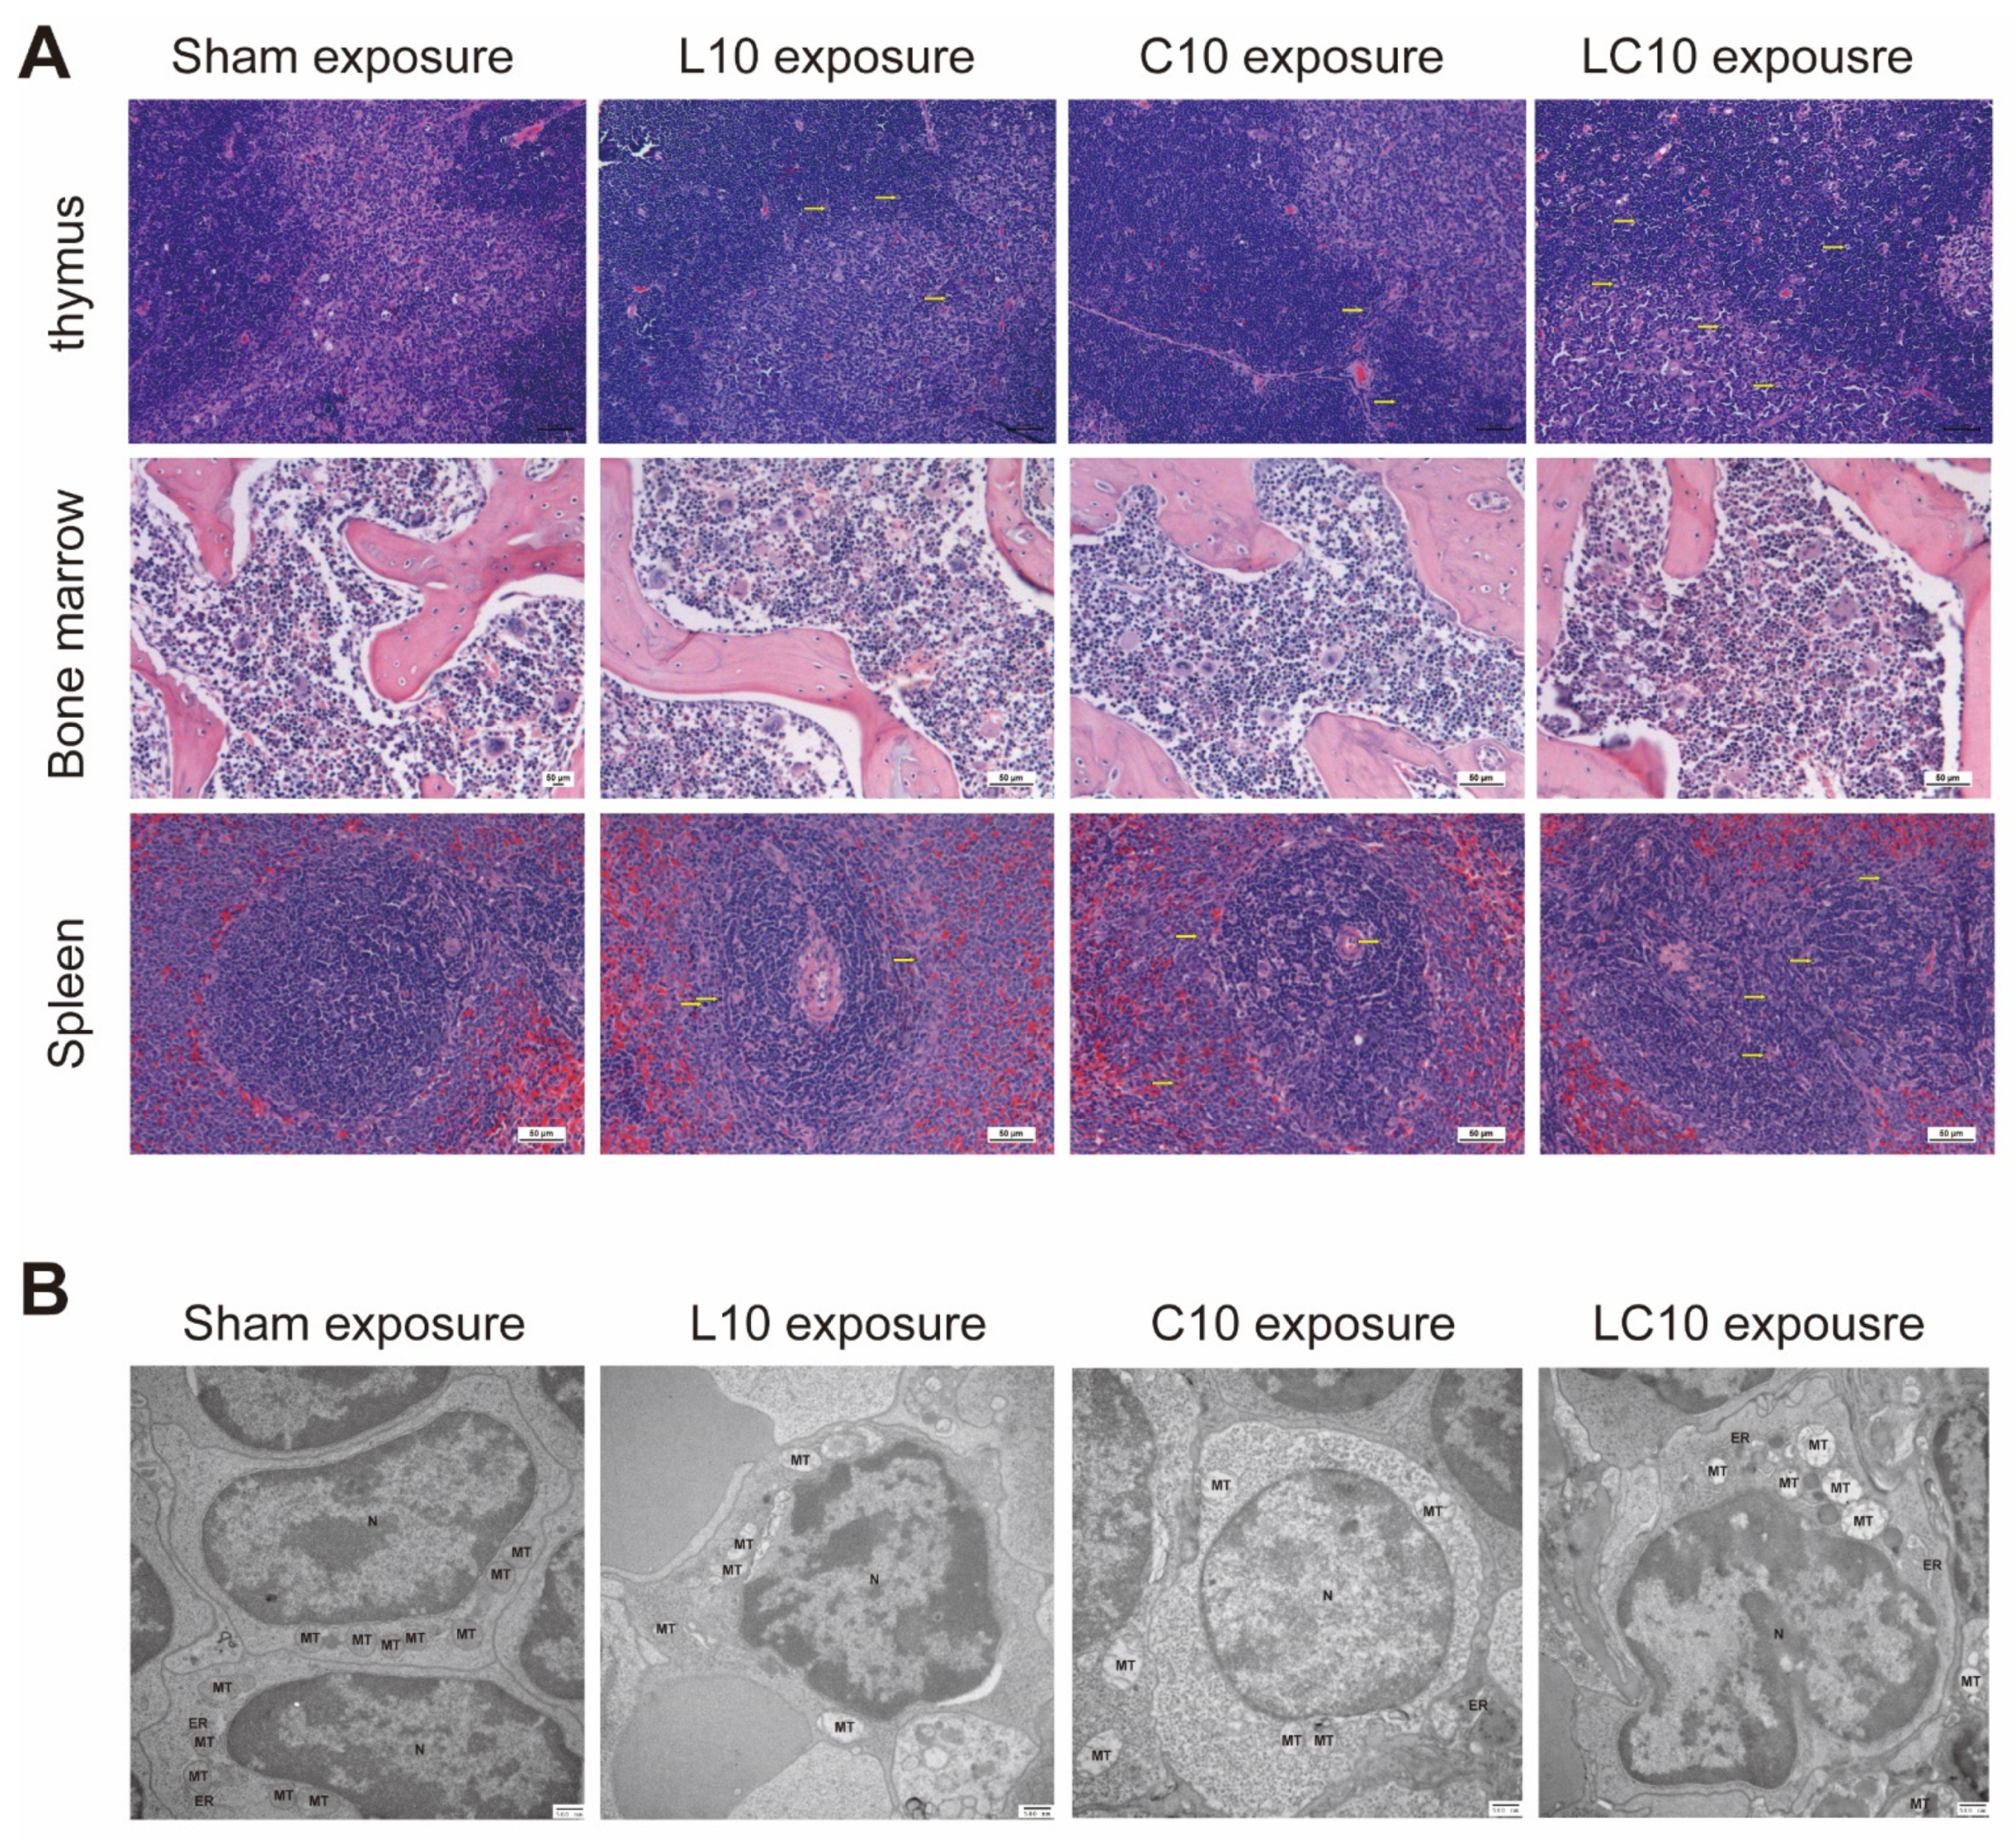
2.1. Multi-Frequency Microwaves Caused Histopathological Injuries to Immune System
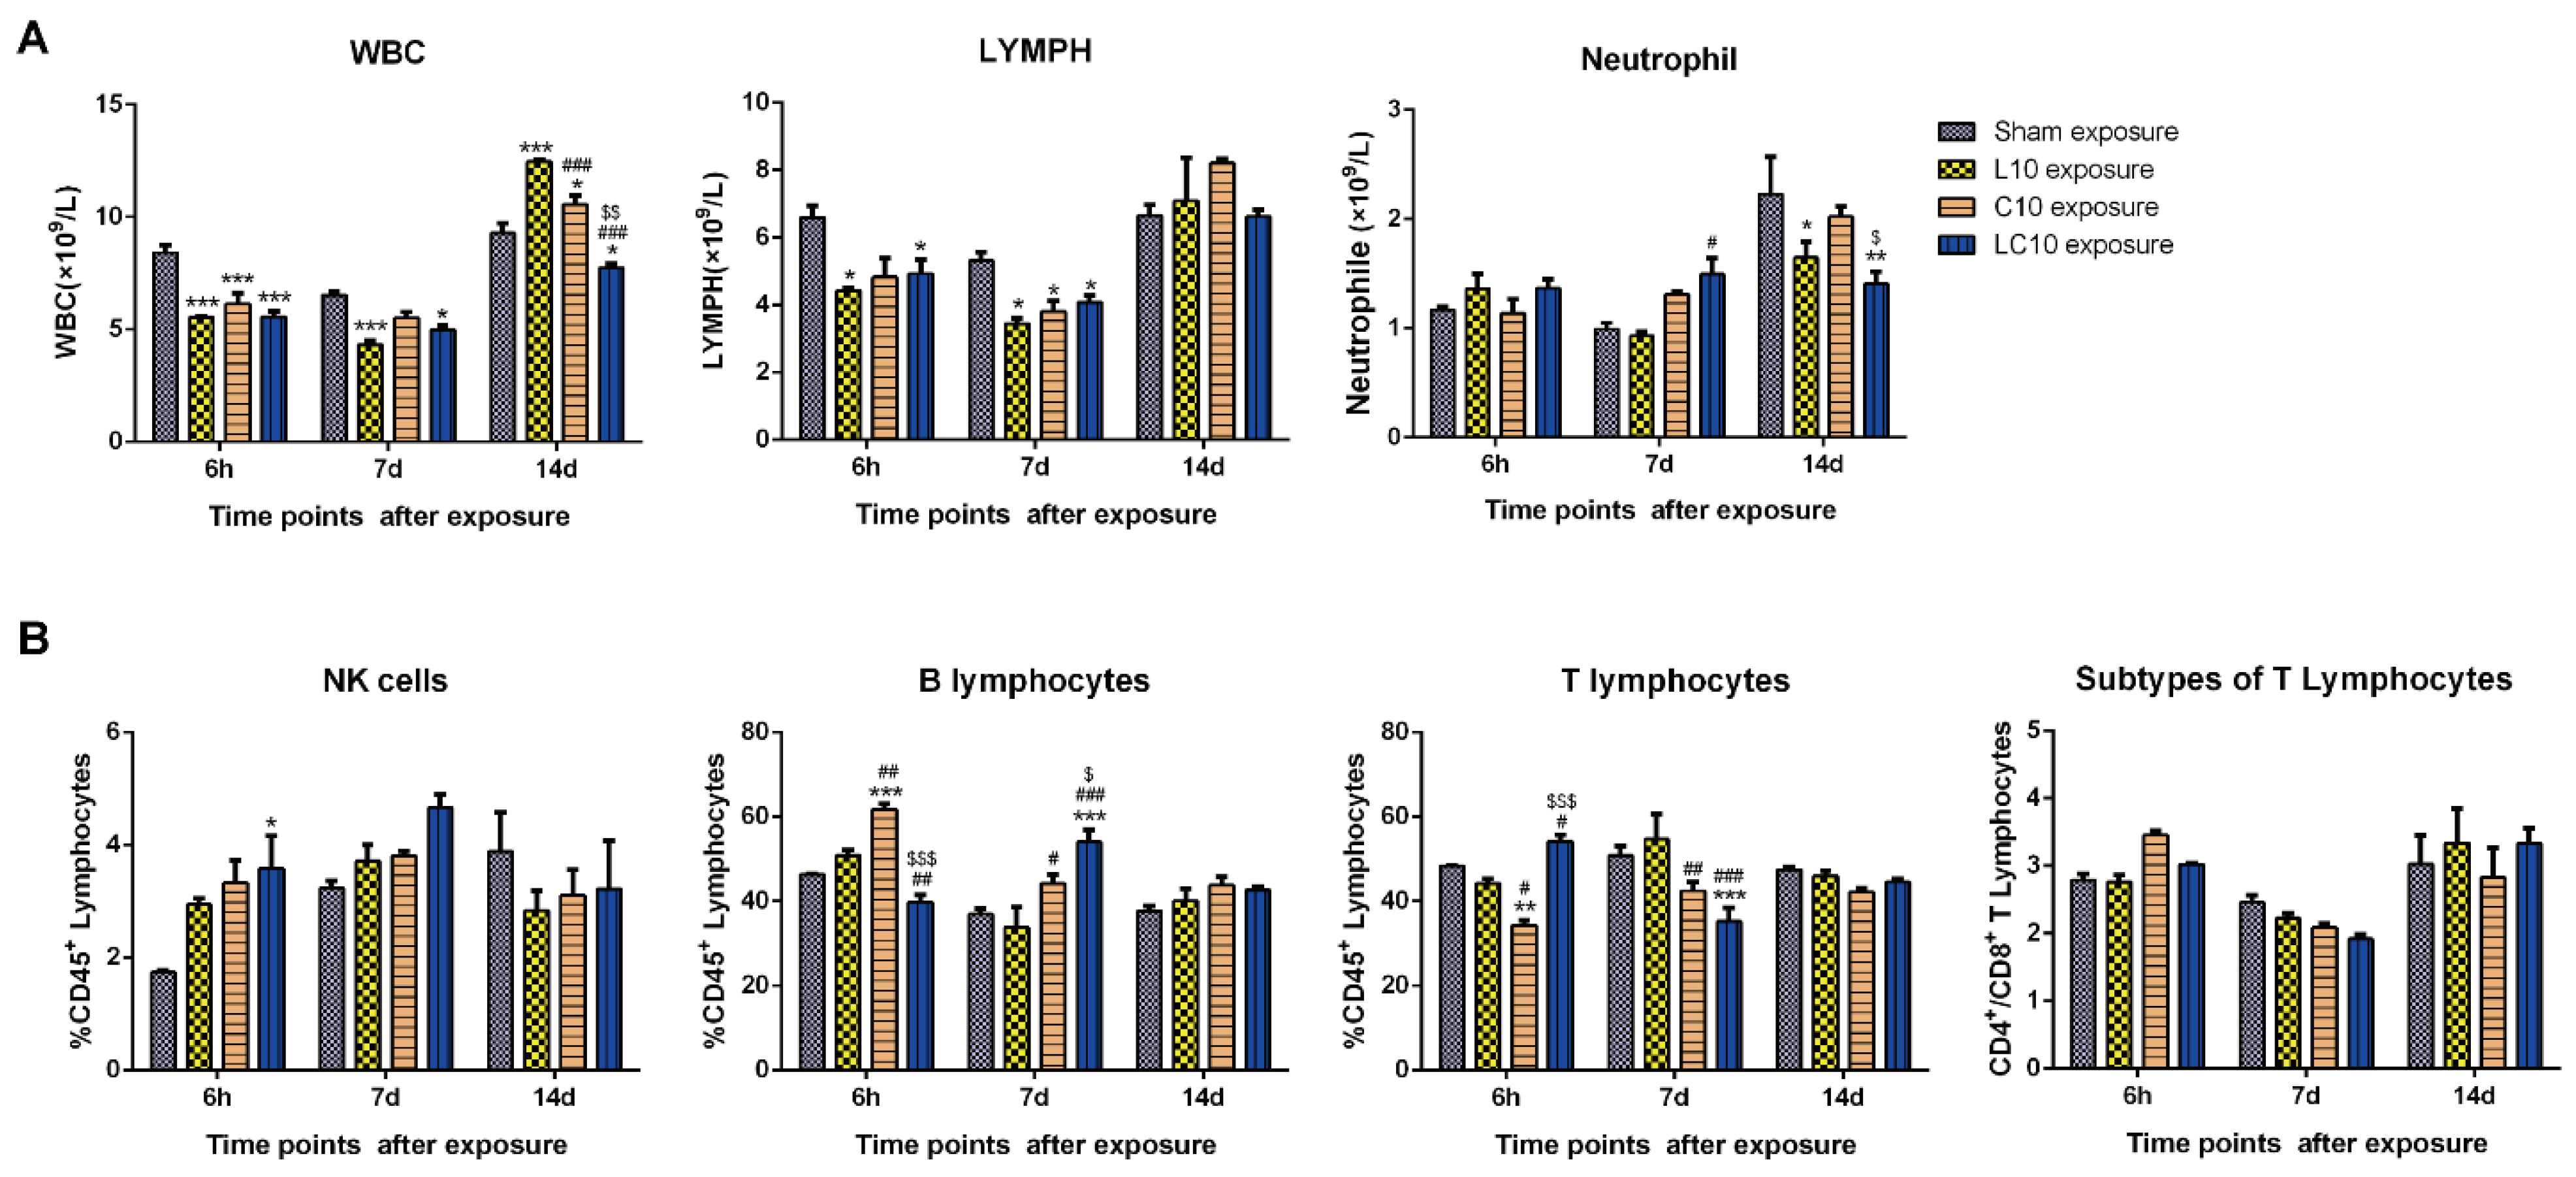
2.2. Multi-Frequency Microwave Induced Immune Suppression in Peripheral Blood
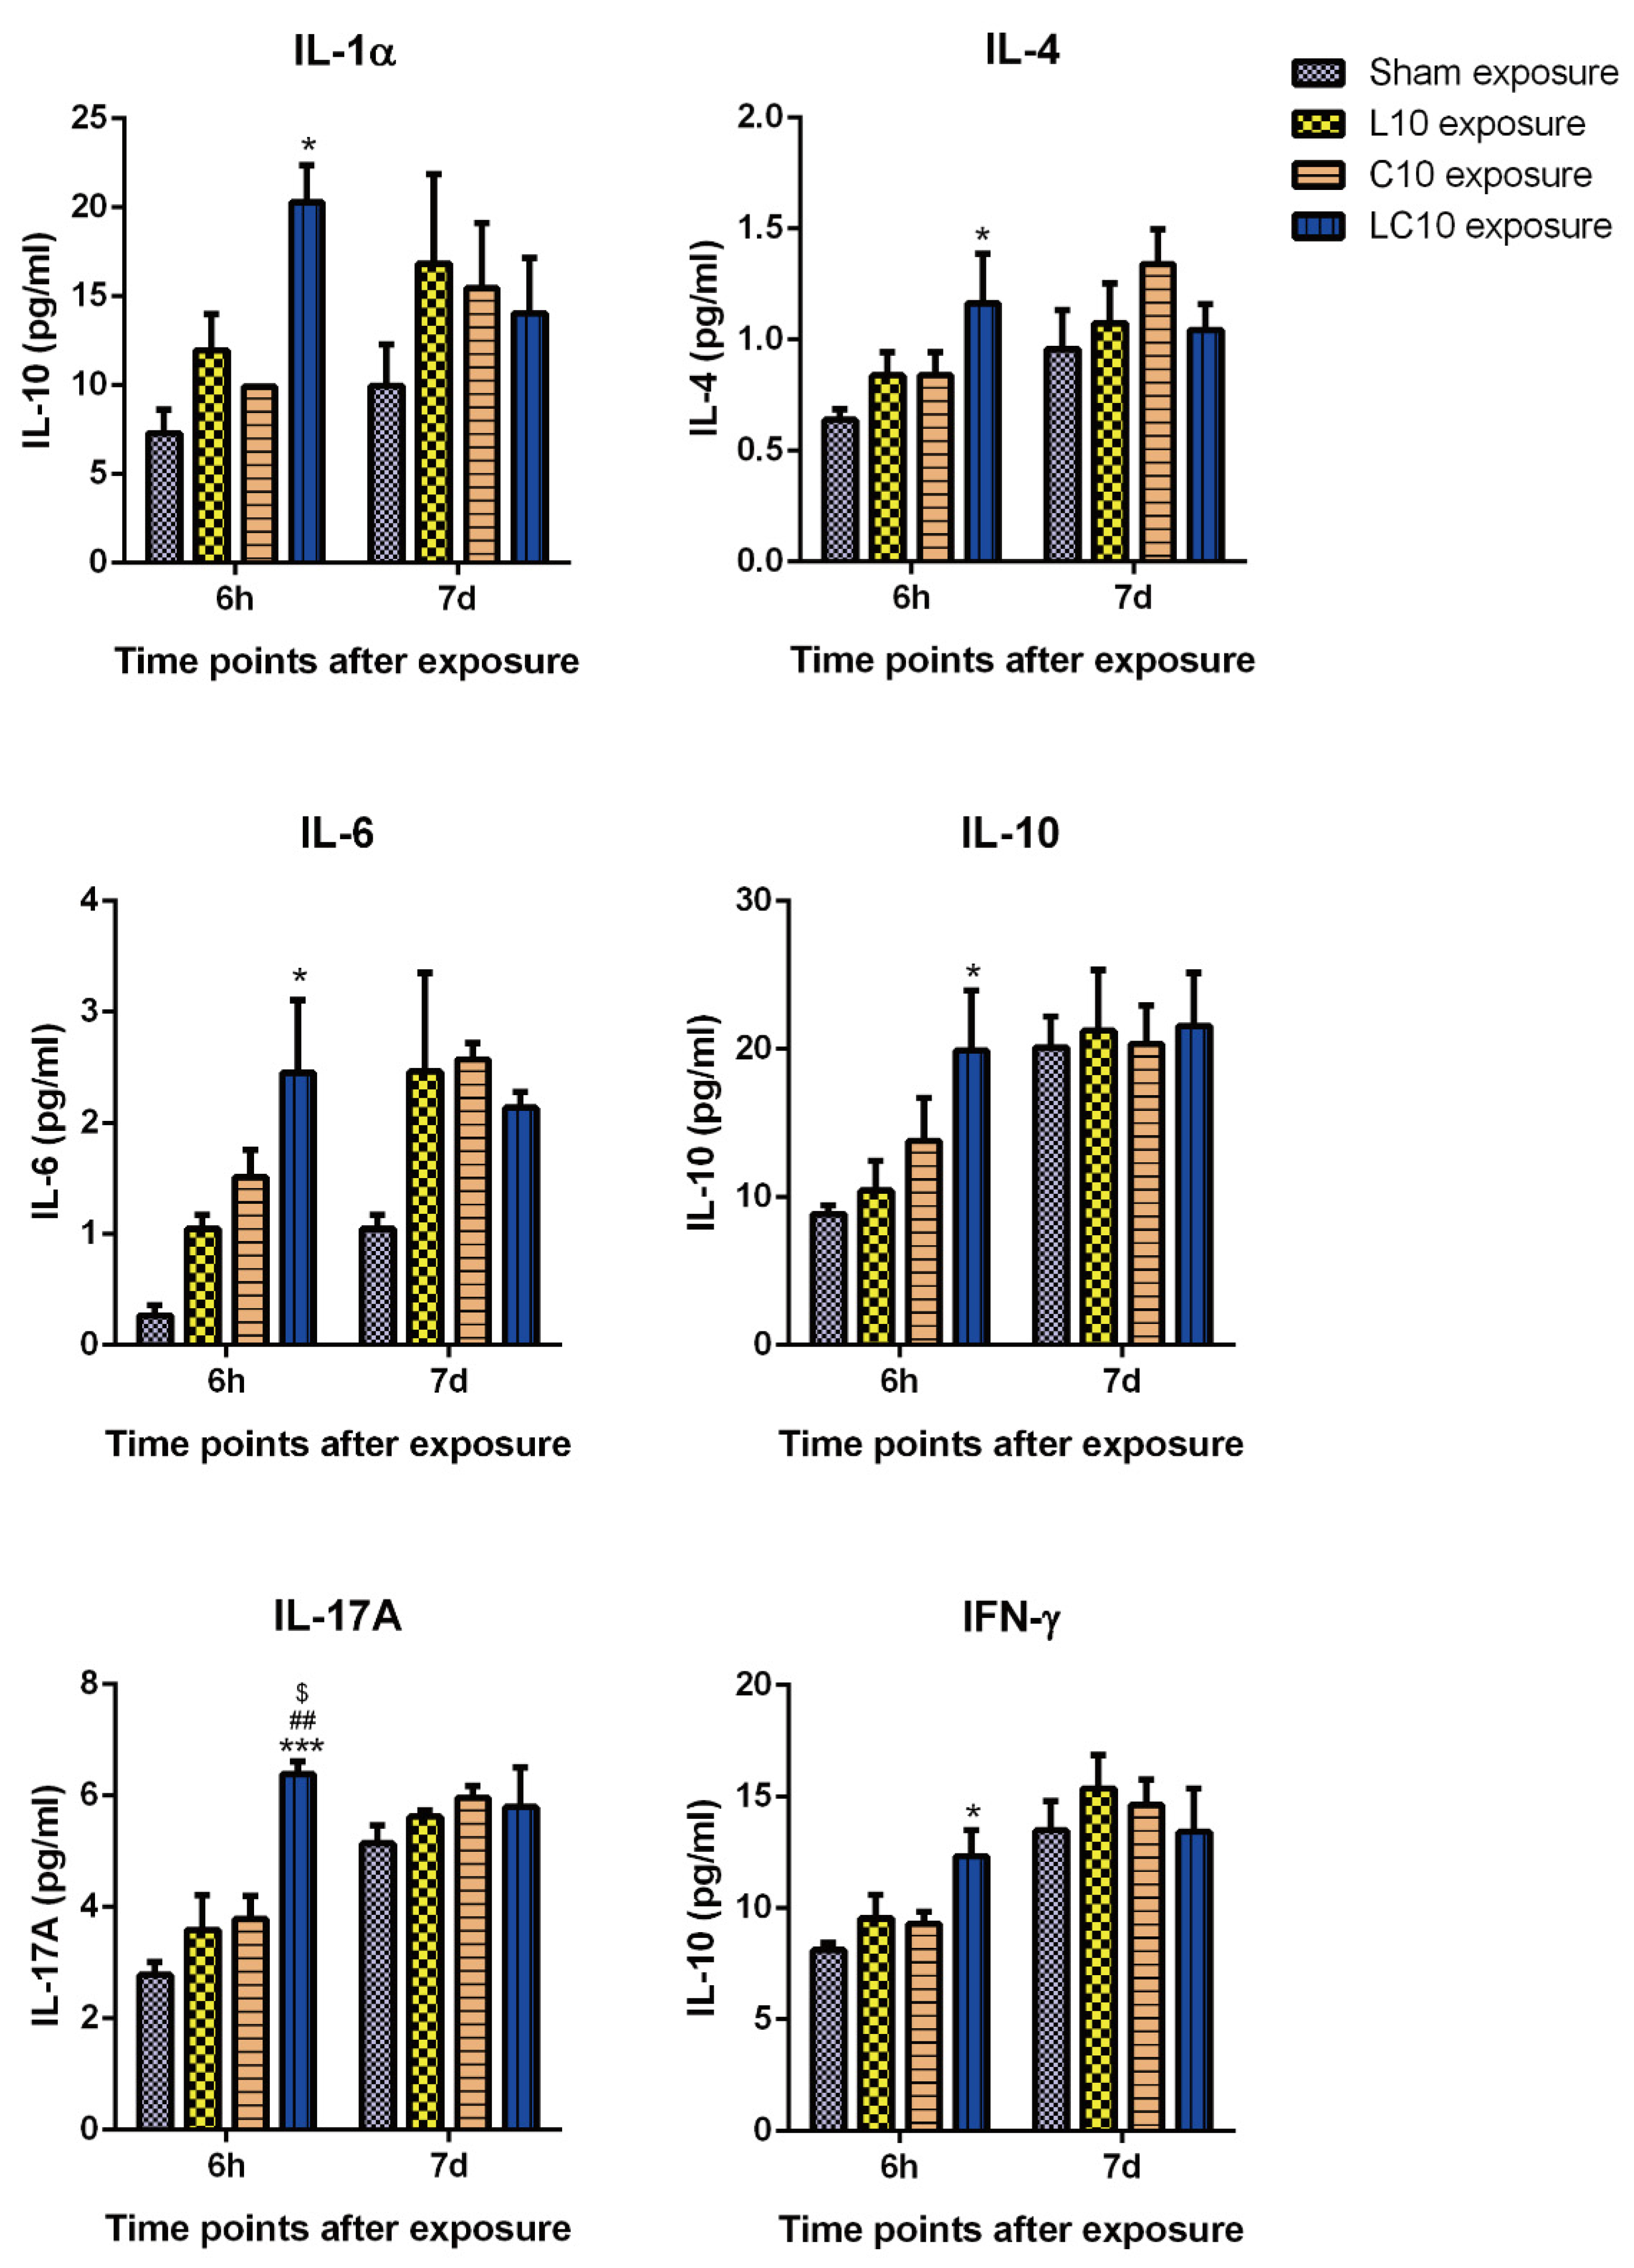
2.3. Multi-Frequency Microwave Transiently Increased Cytokines in Peripheral Blood
2.4. Multi-Frequency Microwave Modulated Numerous Immune Associated Genes on mRNA Level
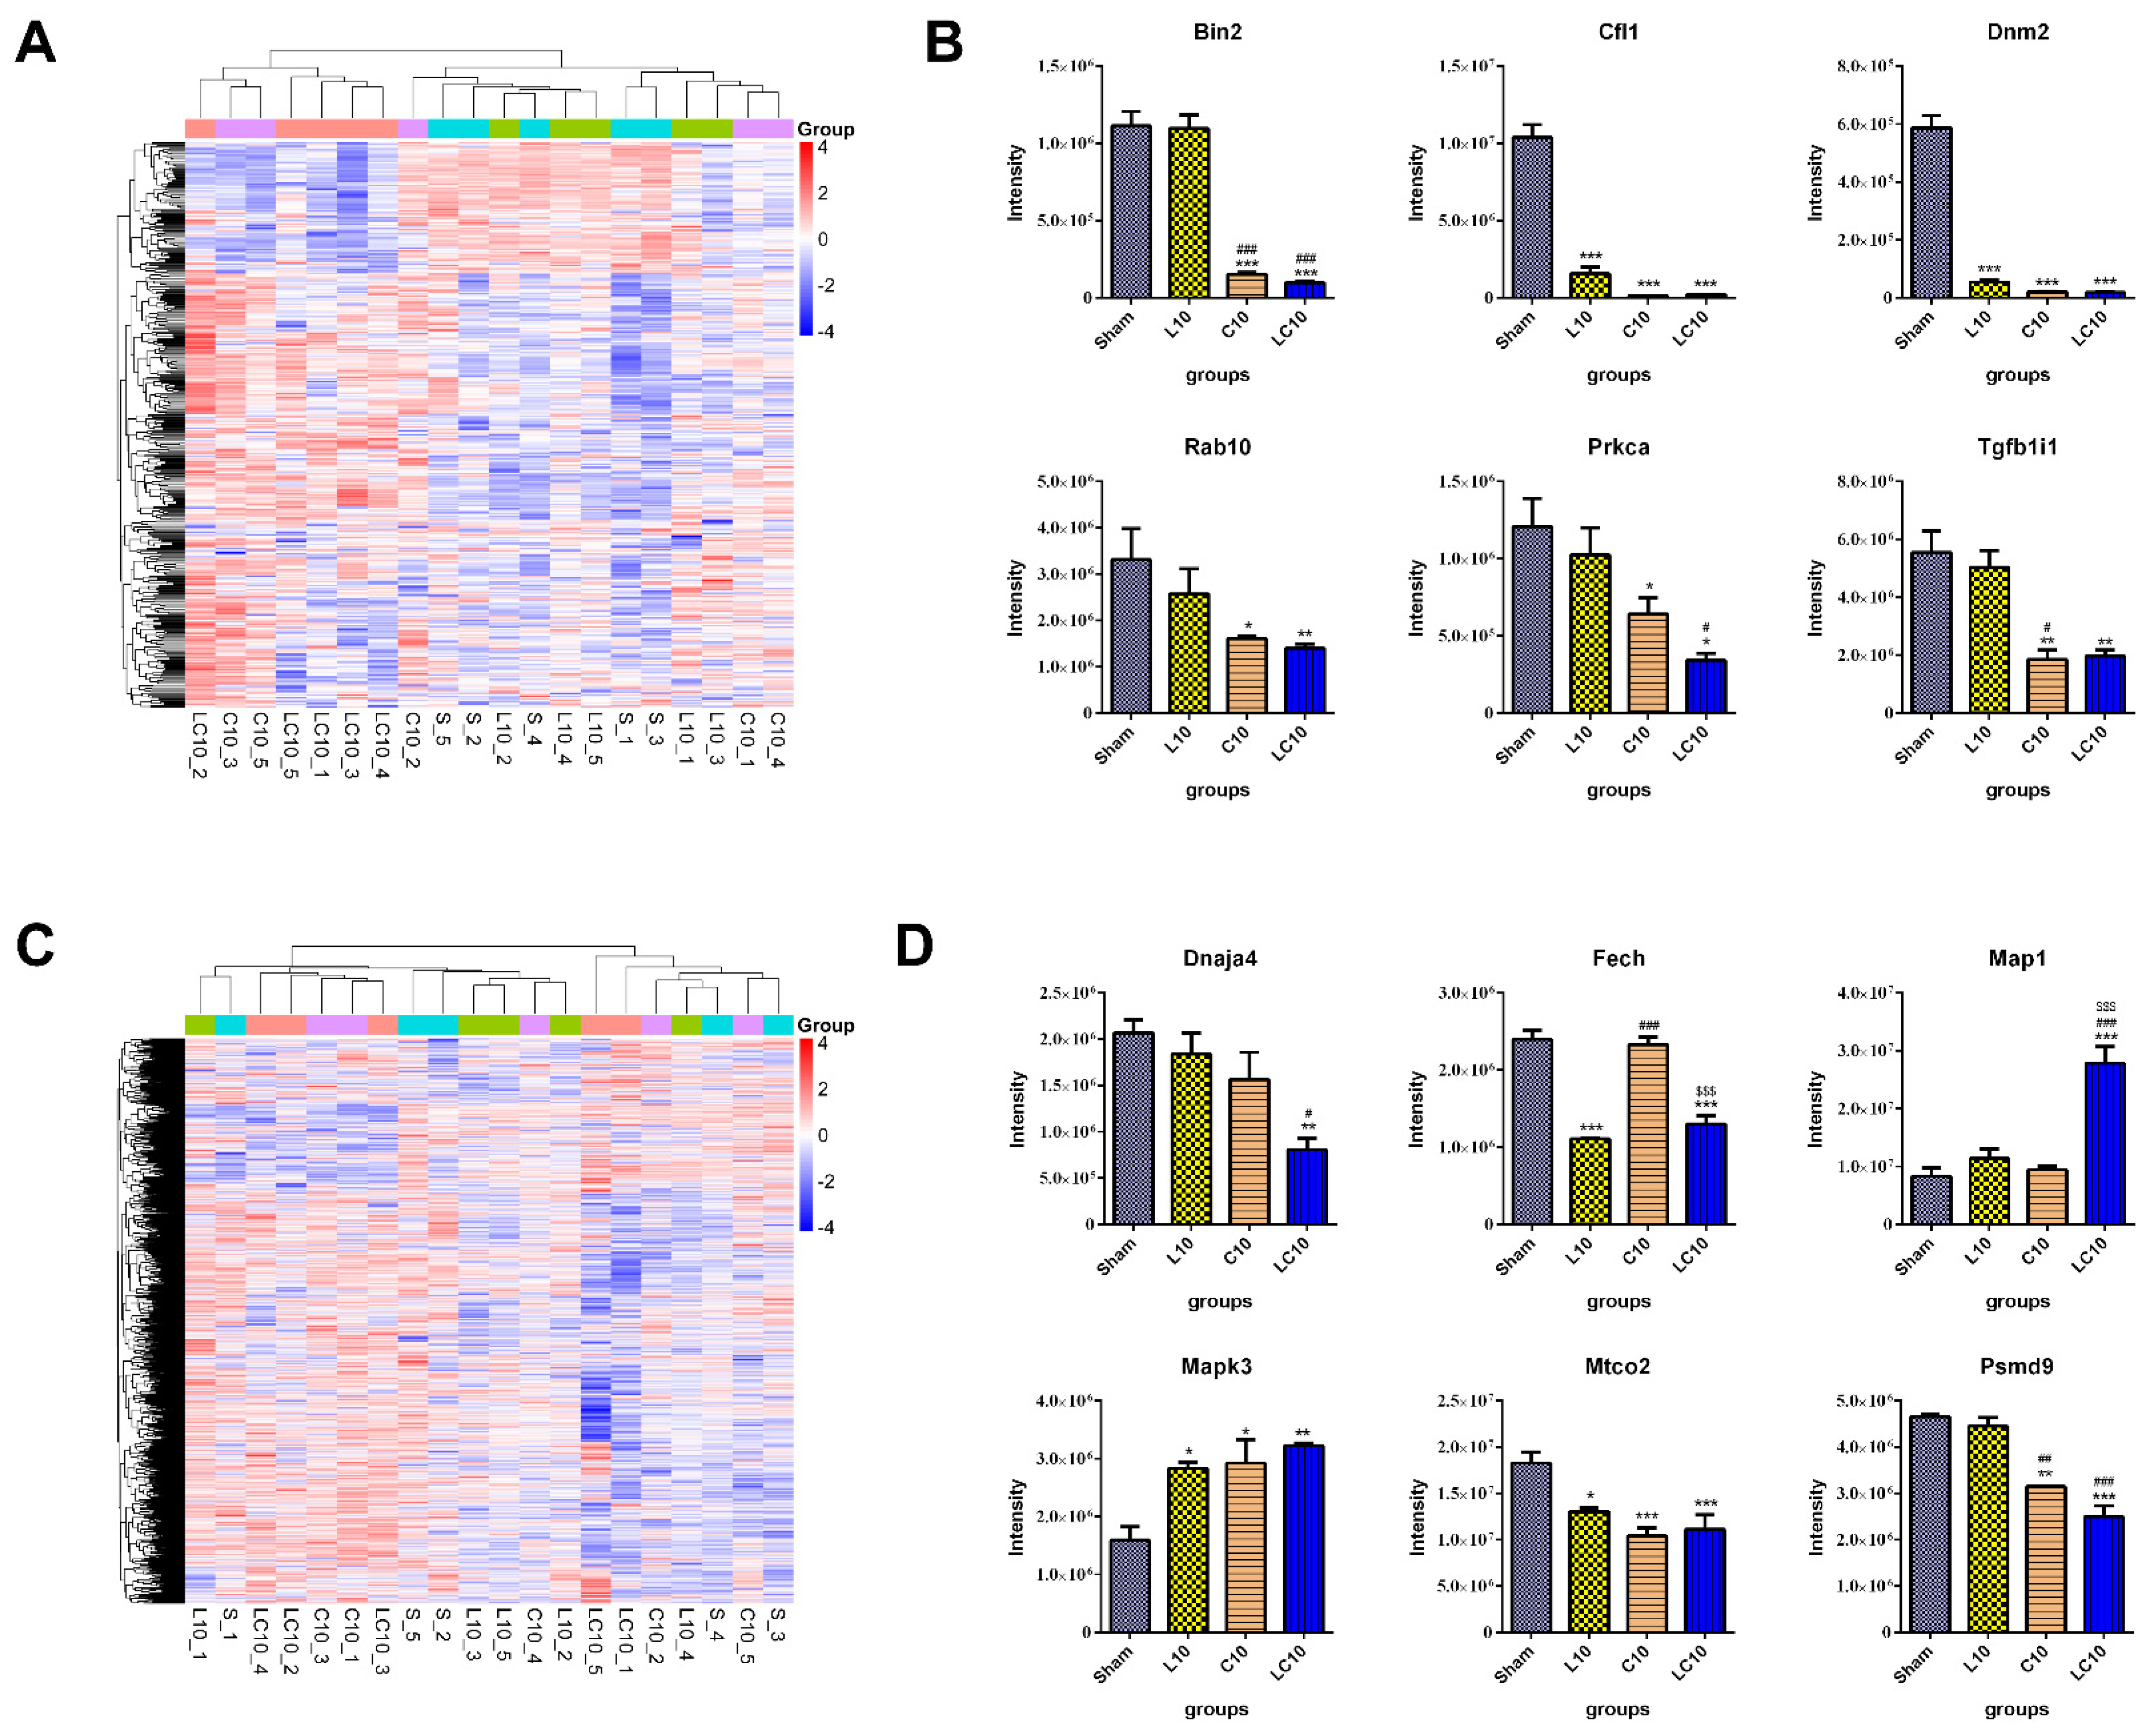
2.5. Multi-Frequency Microwave Modulated Numerous Immune Associated Proteins
3. Discussion
4. Materials and Methods
4.1. Animals
4.2. Microwave Exposure
4.3. Phenotypes of Immune Cells
4.4. Secretion of Cytokines
4.5. Histopathological Analysis
4.6. Transmission Electron Microscopy (TEM)
4.7. Transcriptomics Analysis
4.8. Proteomics Analysis
4.9. Real-Time Reverse Transcription Polymerase Chain Reaction (RT-PCR)
4.10. Mass Spectrometry Analysis
4.11. Statistical Analysis
Supplementary Materials
Author Contributions
Funding
Institutional Review Board Statement
Informed Consent Statement
Data Availability Statement
Acknowledgments
Conflicts of Interest
References
- Arslan, N. Assessment of oil spills using Sentinel 1 C-band SAR and Landsat 8 multispectral sensors. Environ. Monit. Assess. 2018, 190, 637. [Google Scholar] [CrossRef] [PubMed]
- Miller, A.B.; Morgan, L.L.; Udasin, I.; Davis, D.L. Cancer epidemiology update, following the 2011 IARC evaluation of radiofrequency electromagnetic fields (Monograph 102). Environ. Res. 2018, 167, 673–683. [Google Scholar] [CrossRef] [PubMed]
- Oddone, E.; Pernetti, R.; Malagò, G.; Taino, G. Cell phones, radio frequencies (RF) and health: IARC classification and epidemiological updates. G. Ital. Med. Lav. Ergon. 2020, 42, 315–321. [Google Scholar]
- Belpomme, D.; Hardell, L.; Belyaev, I.; Burgio, E.; Carpenter, D.O. Thermal and non-thermal health effects of low intensity non-ionizing radiation: An international perspective. Environ. Pollut. 2018, 242, 643–658. [Google Scholar] [CrossRef] [PubMed]
- Zhu, R.; Wang, H.; Xu, X.; Zhao, L.; Zhang, J.; Dong, J.; Yao, B.; Wang, H.; Zhou, H.; Gao, Y.; et al. Effects of 1.5 and 4.3 GHz microwave radiation on cognitive function and hippocampal tissue structure in Wistar rats. Sci. Rep. 2021, 11, 10061. [Google Scholar] [CrossRef] [PubMed]
- Wang, H.; Tan, S.; Zhao, L.; Dong, J.; Yao, B.; Xu, X.; Zhang, B.; Zhang, J.; Zhou, H.; Peng, R. Protective Role of NMDAR for Microwave-Induced Synaptic Plasticity Injuries in Primary Hippocampal Neurons. Cell Physiol. Biochem. 2018, 51, 97–112. [Google Scholar] [CrossRef]
- Zhang, X.; Gao, Y.; Dong, J.; Wang, S.; Yao, B.; Zhang, J.; Hu, S.; Xu, X.; Zuo, H.; Wang, L.; et al. The compound Chinese medicine “Kang Fu Ling” protects against high power microwave-induced myocardial injury. PLoS ONE 2014, 9, e101532. [Google Scholar] [CrossRef]
- Wang, H.; Peng, R.; Zhou, H.; Wang, S.; Gao, Y.; Wang, L.; Yong, Z.; Zuo, H.; Zhao, L.; Dong, J.; et al. Impairment of long-term potentiation induction is essential for the disruption of spatial memory after microwave exposure. Int. J. Radiat. Biol. 2013, 89, 1100–1107. [Google Scholar] [CrossRef]
- Tan, S.; Wang, H.; Xu, X.; Zhao, L.; Zhang, J.; Dong, J.; Yao, B.; Wang, H.; Hao, Y.; Zhou, H.; et al. Acute effects of 2.856 GHz and 1.5 GHz microwaves on spatial memory abilities and CREB-related pathways. Sci. Rep. 2021, 11, 12348. [Google Scholar] [CrossRef]
- Tan, S.; Wang, H.; Xu, X.; Zhao, L.; Zhang, J.; Dong, J.; Yao, B.; Wang, H.; Zhou, H.; Gao, Y.; et al. Study on dose-dependent, frequency-dependent, and accumulative effects of 1.5 GHz and 2.856 GHz microwave on cognitive functions in Wistar rats. Sci. Rep. 2017, 7, 10781. [Google Scholar] [CrossRef] [Green Version]
- Trošić, I.; Pavičić, I.; Marjanović, A.M.; Bušljeta, I. Non-thermal biomarkers of exposure to radiofrequency/microwave radiation. Arh. Hig. Rada Toksikol. 2012, 63 (Suppl. S1), 67–73. [Google Scholar] [CrossRef] [PubMed]
- Vogl, T.J.; Nour-Eldin, N.A.; Albrecht, M.H.; Kaltenbach, B.; Hohenforst-Schmidt, W.; Lin, H.; Panahi, B.; Eichler, K.; Gruber-Rouh, T.; Roman, A. Thermal Ablation of Lung Tumors: Focus on Microwave Ablation. Rofo 2017, 189, 828–843. [Google Scholar] [CrossRef] [PubMed] [Green Version]
- Meng, M.; Han, X.; Li, W.; Huang, G.; Ni, Y.; Wang, J.; Zhang, T.; Dai, J.; Zou, Z.; Yang, X.; et al. CT-guided microwave ablation in patients with lung metastases from breast cancer. Thorac. Cancer 2021, 12, 3380–3386. [Google Scholar] [CrossRef] [PubMed]
- Paolucci, I.; Ruiter, S.J.S.; Freedman, J.; Candinas, D.; de Jong, K.P.; Weber, S.; Tinguely, P. Volumetric analyses of ablation dimensions in microwave ablation for colorectal liver metastases. Int. J. Hyperth. 2022, 39, 639–648. [Google Scholar] [CrossRef] [PubMed]
- Zhang, H.; Hou, X.; Cai, H.; Zhuang, X. Effects of microwave ablation on T-cell subsets and cytokines of patients with hepatocellular carcinoma. Minim. Invasive Ther. Allied Technol. 2017, 26, 207–211. [Google Scholar] [CrossRef]
- Jauchem, J.R. Effects of low-level radio-frequency (3 kHz to 300 GHz) energy on human cardiovascular, reproductive, immune, and other systems: A review of the recent literature. Int. J. Hyg. Environ. Health 2008, 211, 1–29. [Google Scholar] [CrossRef]
- Ivanov, A.A.; Grigor’ev Iu, G.; Mal’tsev, V.N.; Ulanova, A.M.; Stavrakova, N.M.; Skachkova, V.G.; Grigor’ev, O.A. Autoimmune processes after long-term low-level exposure to electromagnetic fields (the results of an experiment). Part 3. The effect of the long-term non-thermal RF EMF exposure on complement-fixation antibodies against homologenous tissue. Radiats Biol. Radioecol. 2010, 50, 17–21. [Google Scholar]
- Zhao, L.; Li, J.; Hao, Y.H.; Gao, Y.B.; Wang, S.M.; Zhang, J.; Dong, J.; Zhou, H.M.; Liu, S.C.; Peng, R.Y. Microwave-induced apoptosis and cytotoxicity of NK cells through ERK1/2 signaling. Biomed. Environ. Sci. 2017, 30, 323–332. [Google Scholar]
- Tanase, M.A.; Villard, L.; Pitar, D.; Apostol, B.; Petrila, M.; Chivulescu, S.; Leca, S.; Borlaf-Mena, I.; Pascu, I.S.; Dobre, A.C.; et al. Synthetic aperture radar sensitivity to forest changes: A simulations-based study for the Romanian forests. Sci. Total Environ. 2019, 689, 1104–1114. [Google Scholar] [CrossRef]
- Tripathi, A.; Attri, L.; Tiwari, R.K. Spaceborne C-band SAR remote sensing-based flood mapping and runoff estimation for 2019 flood scenario in Rupnagar, Punjab, India. Environ. Monit. Assess. 2021, 193, 110. [Google Scholar] [CrossRef]
- Gulati, S.; Kosik, P.; Durdik, M.; Skorvaga, M.; Jakl, L.; Markova, E.; Belyaev, I. Effects of different mobile phone UMTS signals on DNA, apoptosis and oxidative stress in human lymphocytes. Environ. Pollut. 2020, 267, 115632. [Google Scholar] [CrossRef] [PubMed]
- Arthamin, M.Z.; Sulalah, A.; Resvina, R.; Widodo, C.; Endharti, A.T.; Widjajanto, E.; Juliandhy, T. Exposure of 1800 MHz radiofrequency with SAR 1.6 W/kg caused a significant reduction in CD4+ T cells and release of cytokines in-vitro. Iran. J. Immunol. 2020, 17, 154–166. [Google Scholar] [PubMed]
- Szymanski, L.; Sobiczewska, E.; Cios, A.; Szymanski, P.; Ciepielak, M.; Stankiewicz, W. Immunotropic effects in cultured human blood mononuclear cells exposed to a 900 MHz pulse-modulated microwave field. J. Radiat. Res. 2020, 61, 27–33. [Google Scholar] [CrossRef]
- Odaci, E.; Bas, O.; Kaplan, S. Effects of prenatal exposure to a 900 MHz electromagnetic field on the dentate gyrus of rats: A stereological and histopathological study. Brain Res. 2008, 1238, 224–229. [Google Scholar] [CrossRef]
- Rajkovic, V.; Matavulj, M.; Johansson, O. Combined exposure of peripubertal male rats to the endocrine-disrupting compound atrazine and power-frequency electromagnetic fields causes degranulation of cutaneous mast cells: A new toxic environmental hazard? Arch. Environ. Contam. Toxicol. 2010, 59, 334–341. [Google Scholar] [CrossRef] [PubMed]
- Black, D.R.; Heynick, L.N. Radiofrequency (RF) effects on blood cells, cardiac, endocrine, and immunological functions. Bioelectromagnetics 2003, 24 (Suppl. S6), S187–S195. [Google Scholar] [CrossRef]
- Bruderer, R.; Bernhardt, O.M.; Gandhi, T.; Miladinovic, S.M.; Cheng, L.Y.; Messner, S.; Ehrenberger, T.; Zanotelli, V.; Butscheid, Y.; Escher, C.; et al. Extending the limits of quantitative proteome profiling with data-independent acquisition and application to acetaminophen-treated three-dimensional liver microtissues. Mol. Cell. Proteom. 2015, 14, 1400–1410. [Google Scholar] [CrossRef] [Green Version]


| Groups | Peripheral Blood | Spleen | ||
|---|---|---|---|---|
| Up-Regulated DEGs | Down-Regulated DEGs | Up-Regulated DEGs | Down-Regulated DEGs | |
| L10 vs. Sham | 44 | 41 | 381 | 453 |
| C10 vs. Sham | 47 | 47 | 423 | 521 |
| LC10 vs. Sham | 109 | 76 | 523 | 599 |
| C10 vs. L10 | 31 | 42 | 449 | 425 |
| LC10 vs. L10 | 58 | 63 | 552 | 482 |
| LC10 vs. C10 | 70 | 60 | 393 | 435 |
| Groups | The Number of Categoric Items from GO Analysis | The Number of Categoric Signaling Pathways from KEGG Analysis | ||
|---|---|---|---|---|
| Up-Regulated DEGs | Down-Regulated DEGs | Up-Regulated DEGs | Down-Regulated DEGs | |
| L10 vs. Sham | 32 | 0 | 1 | 0 |
| C10 vs. Sham | 2 | 44 | 1 | 20 |
| LC10 vs. Sham | 277 | 148 | 27 | 14 |
| C10 vs. L10 | 0 | 6 | 0 | 0 |
| LC10 vs. L10 | 97 | 32 | 3 | 7 |
| LC10 vs. C10 | 311 | 139 | 10 | 14 |
| Groups | The Number of Categoric Items from GO Analysis | The Number of Categoric Signaling Pathways from KEGG Analysis | ||
|---|---|---|---|---|
| Up-Regulated DEGs | Down-Regulated DEGs | Up-Regulated DEGs | Down-Regulated DEGs | |
| L10 vs. Sham | 45 | 47 | 6 | 5 |
| C10 vs. Sham | 91 | 221 | 9 | 20 |
| LC10 vs. Sham | 132 | 250 | 28 | 15 |
| C10 vs. L10 | 38 | 44 | 3 | 3 |
| LC10 vs. L10 | 181 | 104 | 25 | 4 |
| LC10 vs. C10 | 61 | 21 | 3 | 22 |
| Groups | Peripheral Blood | Spleen | ||
|---|---|---|---|---|
| Up-Regulated DEPs | Down-Regulated DEPs | Up-Regulated DEPs | Down-Regulated DEPs | |
| L10 vs. Sham | 18 | 28 | 31 | 17 |
| C10 vs. Sham | 86 | 140 | 27 | 24 |
| LC10 vs. Sham | 78 | 155 | 47 | 106 |
| C10 vs. L10 | 59 | 22 | 18 | 29 |
| LC10 vs. L10 | 39 | 100 | 40 | 84 |
| LC10 vs. C10 | 12 | 11 | 27 | 35 |
| Groups | The Number of Categoric Items from GO Analysis | The Number of Categoric Signaling Pathways from KEGG Analysis | ||
|---|---|---|---|---|
| Up-Regulated DEPs | Down-Regulated DEPs | Up-Regulated DEPs | Down-Regulated DEPs | |
| L10 vs. Sham | 44 | 126 | 5 | 5 |
| C10 e vs. Sham | 26 | 151 | 3 | 9 |
| LC10 vs. Sham | 39 | 111 | 5 | 20 |
| C10 vs. L10 | 51 | 77 | 1 | 4 |
| LC10 vs. L10 | 44 | 129 | 4 | 10 |
| LC10 vs. C10 | 28 | 91 | 2 | 7 |
| Groups | The Number of Categoric Items from GO Analysis | The Number of Categoric Signaling Pathways from KEGG Analysis | ||
|---|---|---|---|---|
| Up-Regulated DEPs | Down-Regulated DEPs | Up-Regulated DEPs | Down-Regulated DEPs | |
| L10 vs. Sham | 207 | 177 | 24 | 15 |
| C10 vs. Sham | 179 | 77 | 8 | 7 |
| LC10 vs. Sham | 149 | 164 | 4 | 5 |
| C10 vs. L10 | 108 | 133 | 3 | 0 |
| LC10 vs. L10 | 132 | 190 | 4 | 8 |
| LC10 vs. C10 | 112 | 136 | 5 | 3 |
Publisher’s Note: MDPI stays neutral with regard to jurisdictional claims in published maps and institutional affiliations. |
© 2022 by the authors. Licensee MDPI, Basel, Switzerland. This article is an open access article distributed under the terms and conditions of the Creative Commons Attribution (CC BY) license (https://creativecommons.org/licenses/by/4.0/).
Share and Cite
Zhao, L.; Yao, C.; Wang, H.; Dong, J.; Zhang, J.; Xu, X.; Wang, H.; Yao, B.; Ren, K.; Sun, L.; et al. Immune Responses to Multi-Frequencies of 1.5 GHz and 4.3 GHz Microwave Exposure in Rats: Transcriptomic and Proteomic Analysis. Int. J. Mol. Sci. 2022, 23, 6949. https://doi.org/10.3390/ijms23136949
Zhao L, Yao C, Wang H, Dong J, Zhang J, Xu X, Wang H, Yao B, Ren K, Sun L, et al. Immune Responses to Multi-Frequencies of 1.5 GHz and 4.3 GHz Microwave Exposure in Rats: Transcriptomic and Proteomic Analysis. International Journal of Molecular Sciences. 2022; 23(13):6949. https://doi.org/10.3390/ijms23136949
Chicago/Turabian StyleZhao, Li, Chuanfu Yao, Hui Wang, Ji Dong, Jing Zhang, Xinping Xu, Haoyu Wang, Binwei Yao, Ke Ren, Liu Sun, and et al. 2022. "Immune Responses to Multi-Frequencies of 1.5 GHz and 4.3 GHz Microwave Exposure in Rats: Transcriptomic and Proteomic Analysis" International Journal of Molecular Sciences 23, no. 13: 6949. https://doi.org/10.3390/ijms23136949
APA StyleZhao, L., Yao, C., Wang, H., Dong, J., Zhang, J., Xu, X., Wang, H., Yao, B., Ren, K., Sun, L., & Peng, R. (2022). Immune Responses to Multi-Frequencies of 1.5 GHz and 4.3 GHz Microwave Exposure in Rats: Transcriptomic and Proteomic Analysis. International Journal of Molecular Sciences, 23(13), 6949. https://doi.org/10.3390/ijms23136949


