
In Silico Molecular Dynamics of Griseofulvin and Its Derivatives Revealed Potential Therapeutic Applications for COVID-19


Abstract
:1. Introduction
2. Results and Discussion
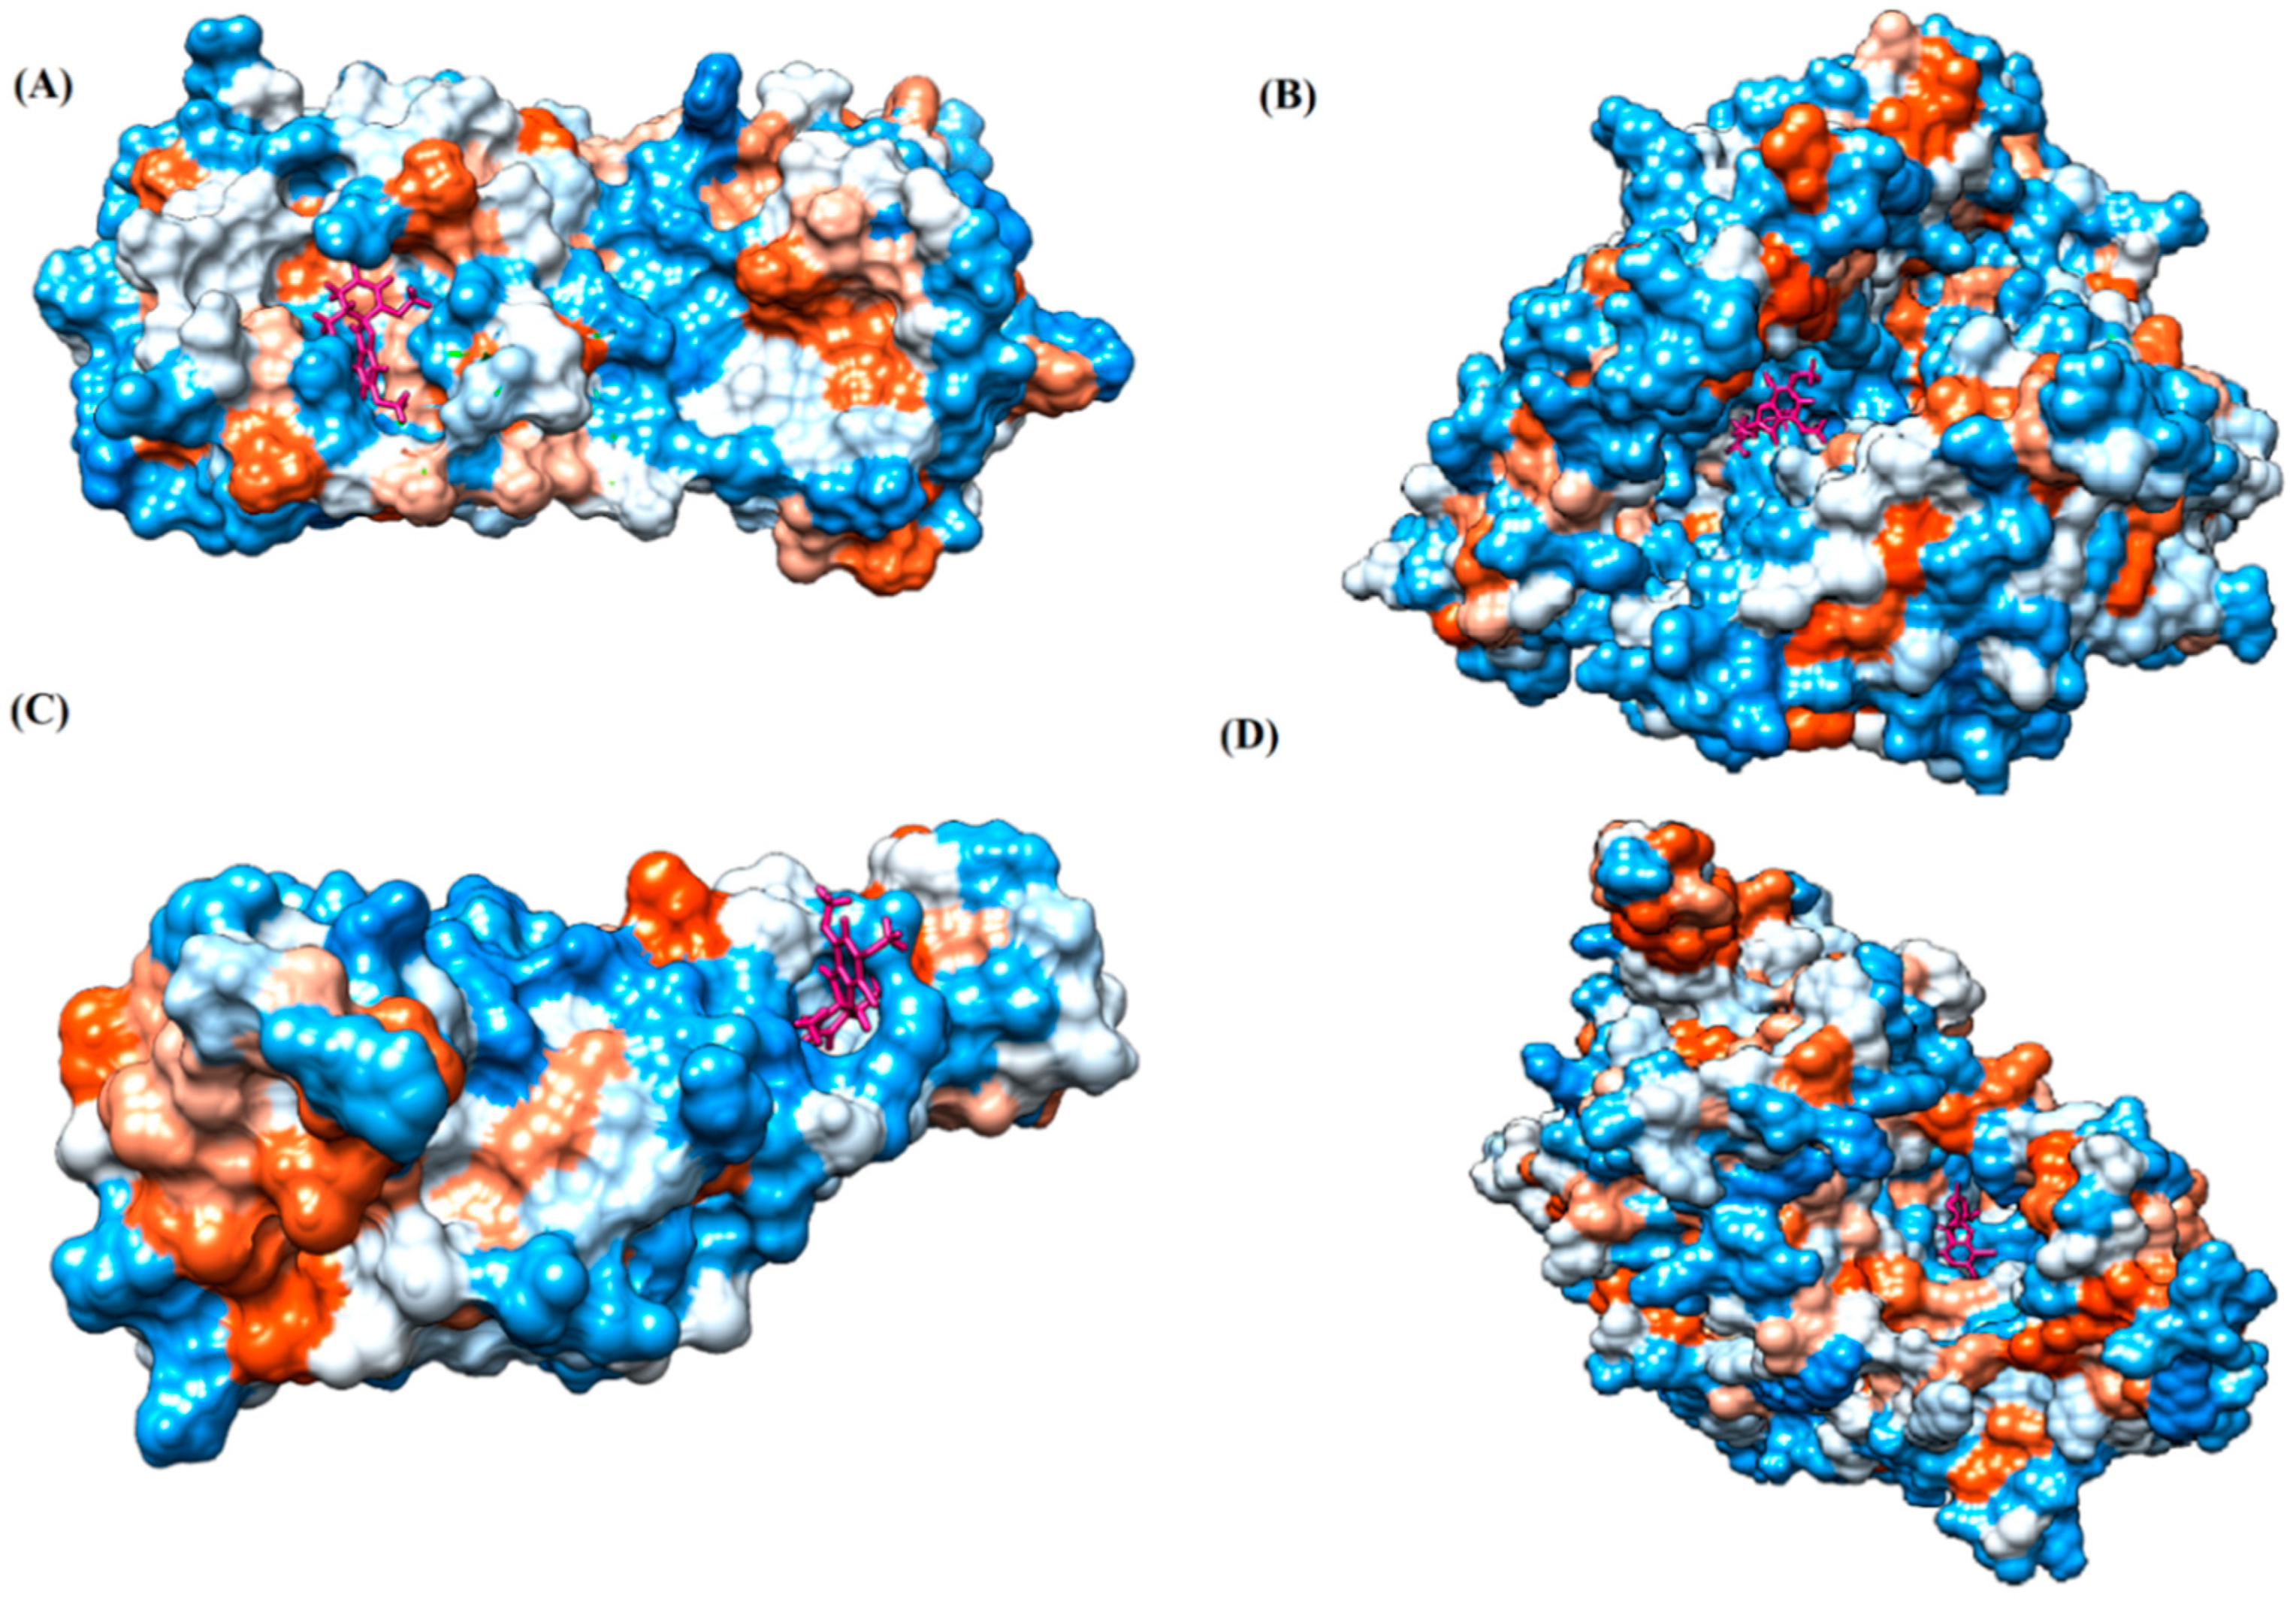
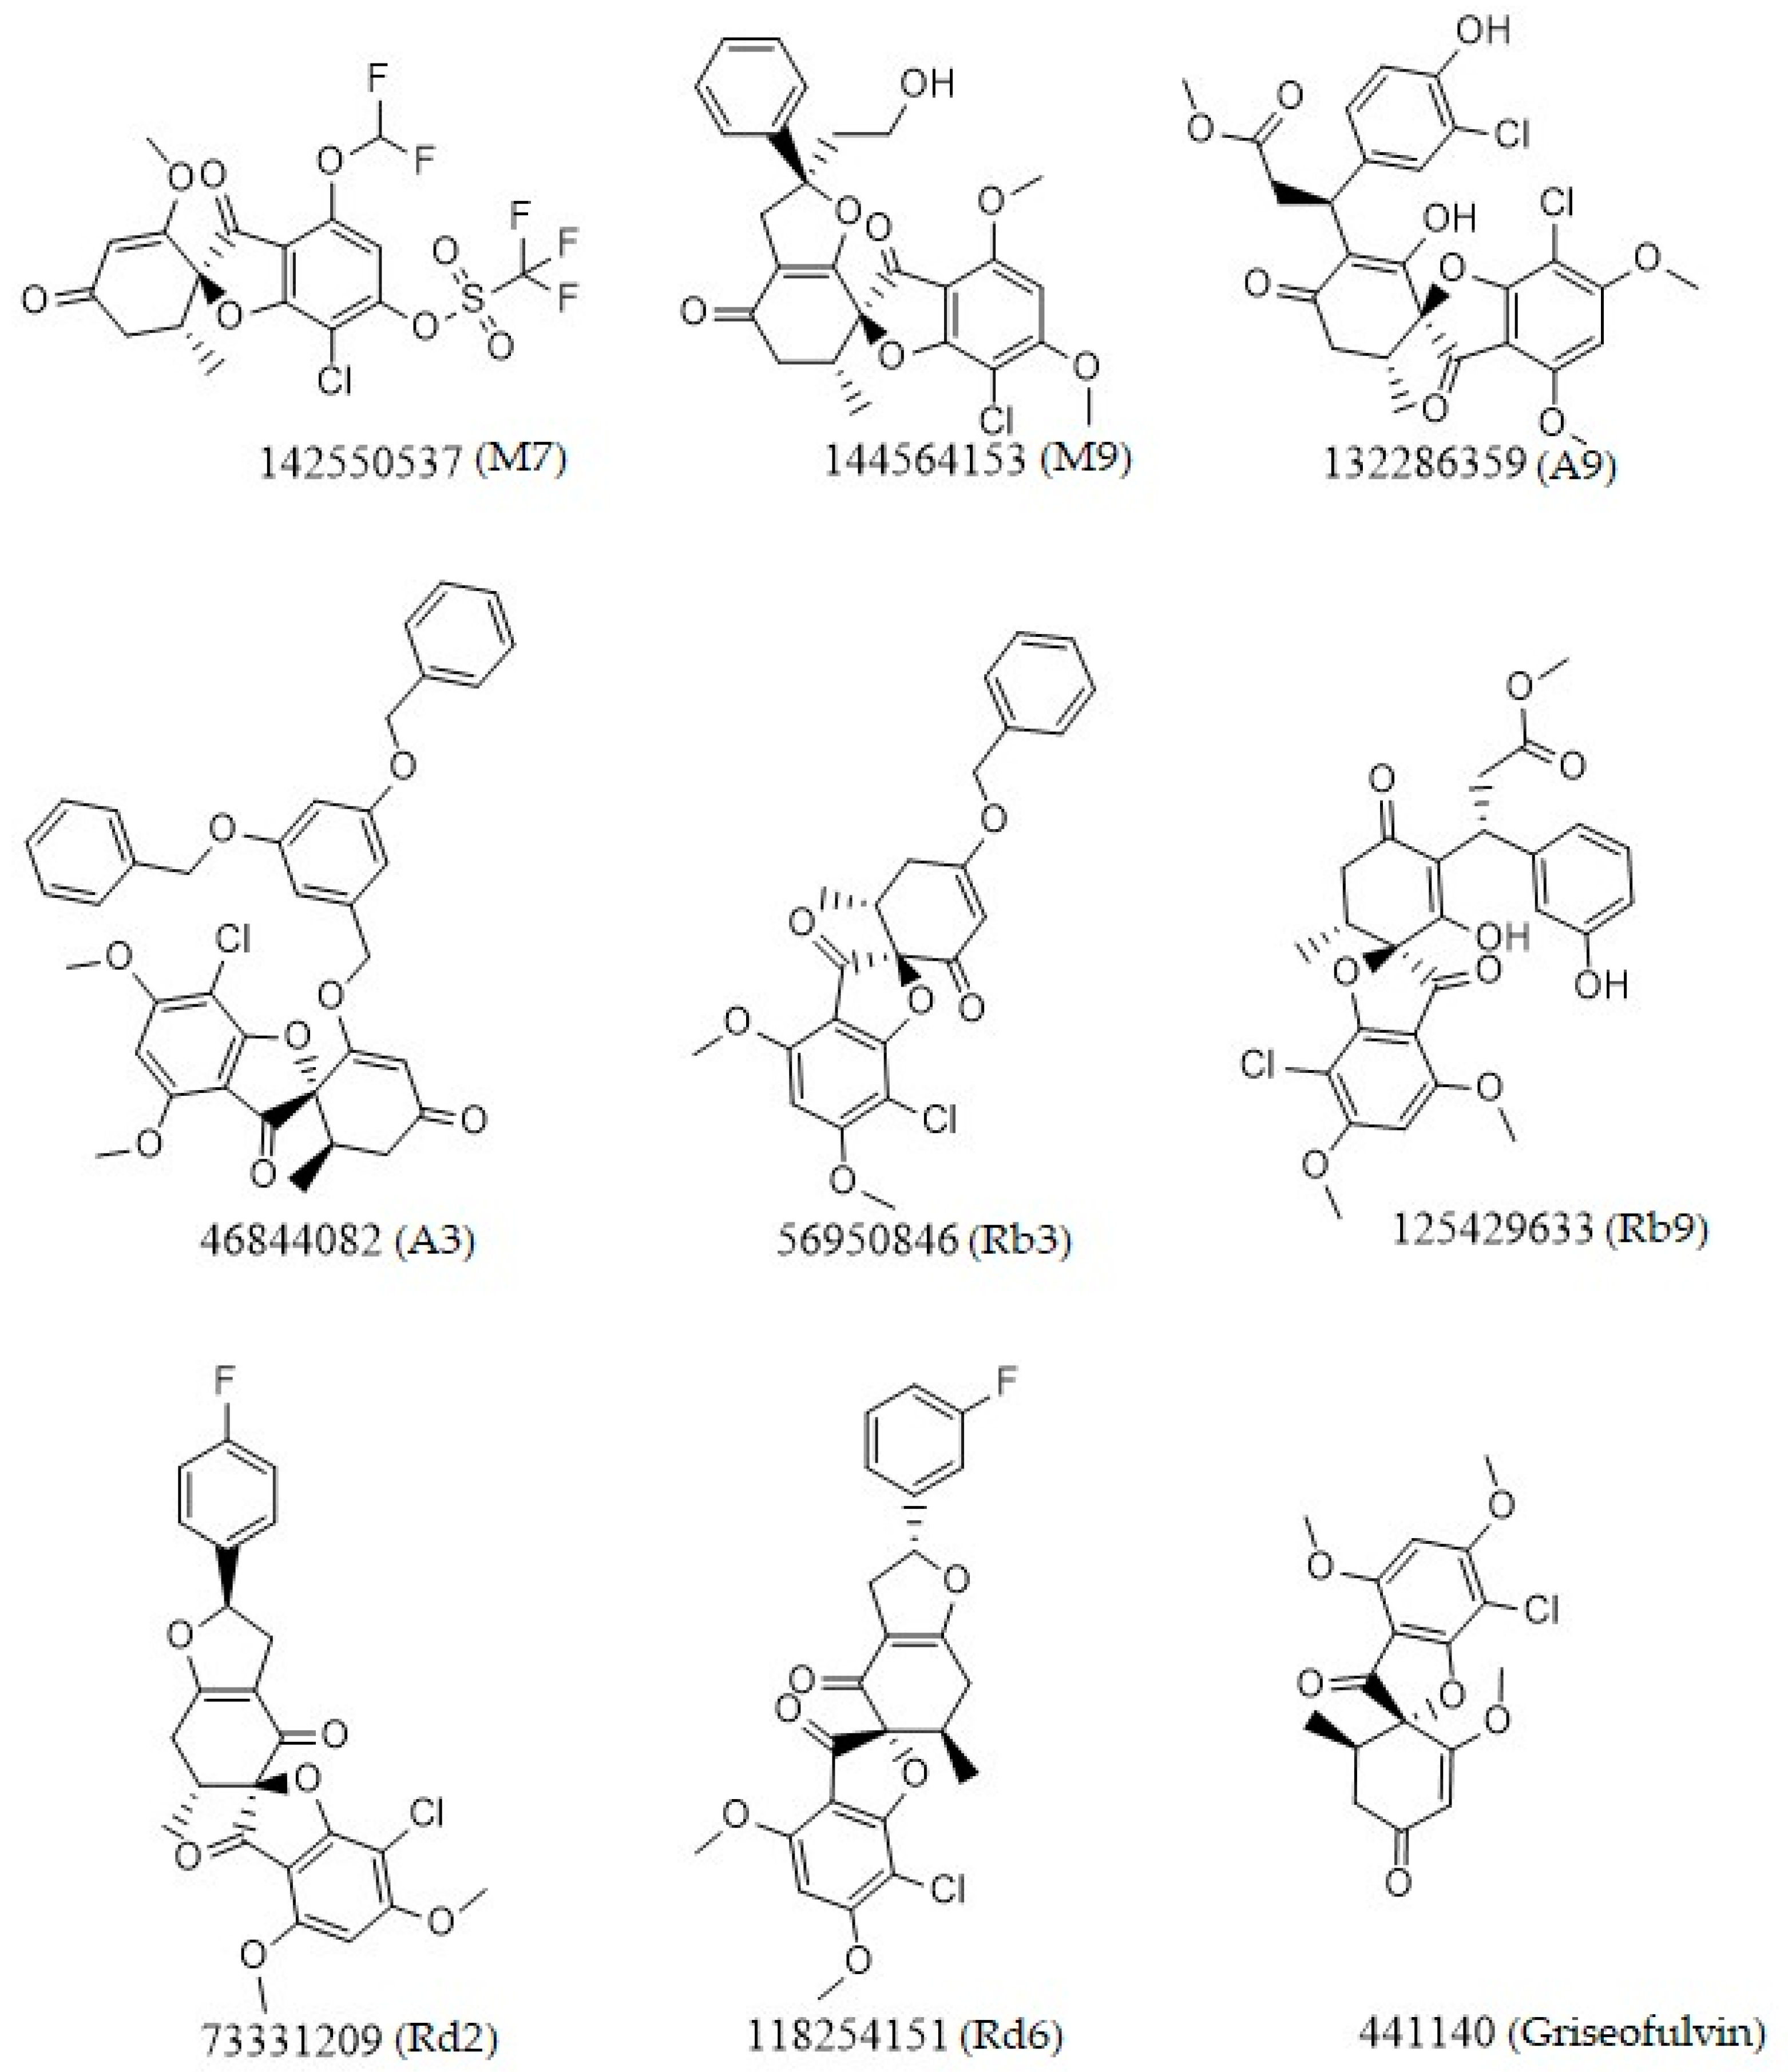
2.1. Virtual Screening and Molecular Docking Studies
2.1.1. Main Protease
2.1.2. ACE2
2.1.3. Spike RBD
2.1.4. RNA Dependent RNA Polymerase (RdRp)
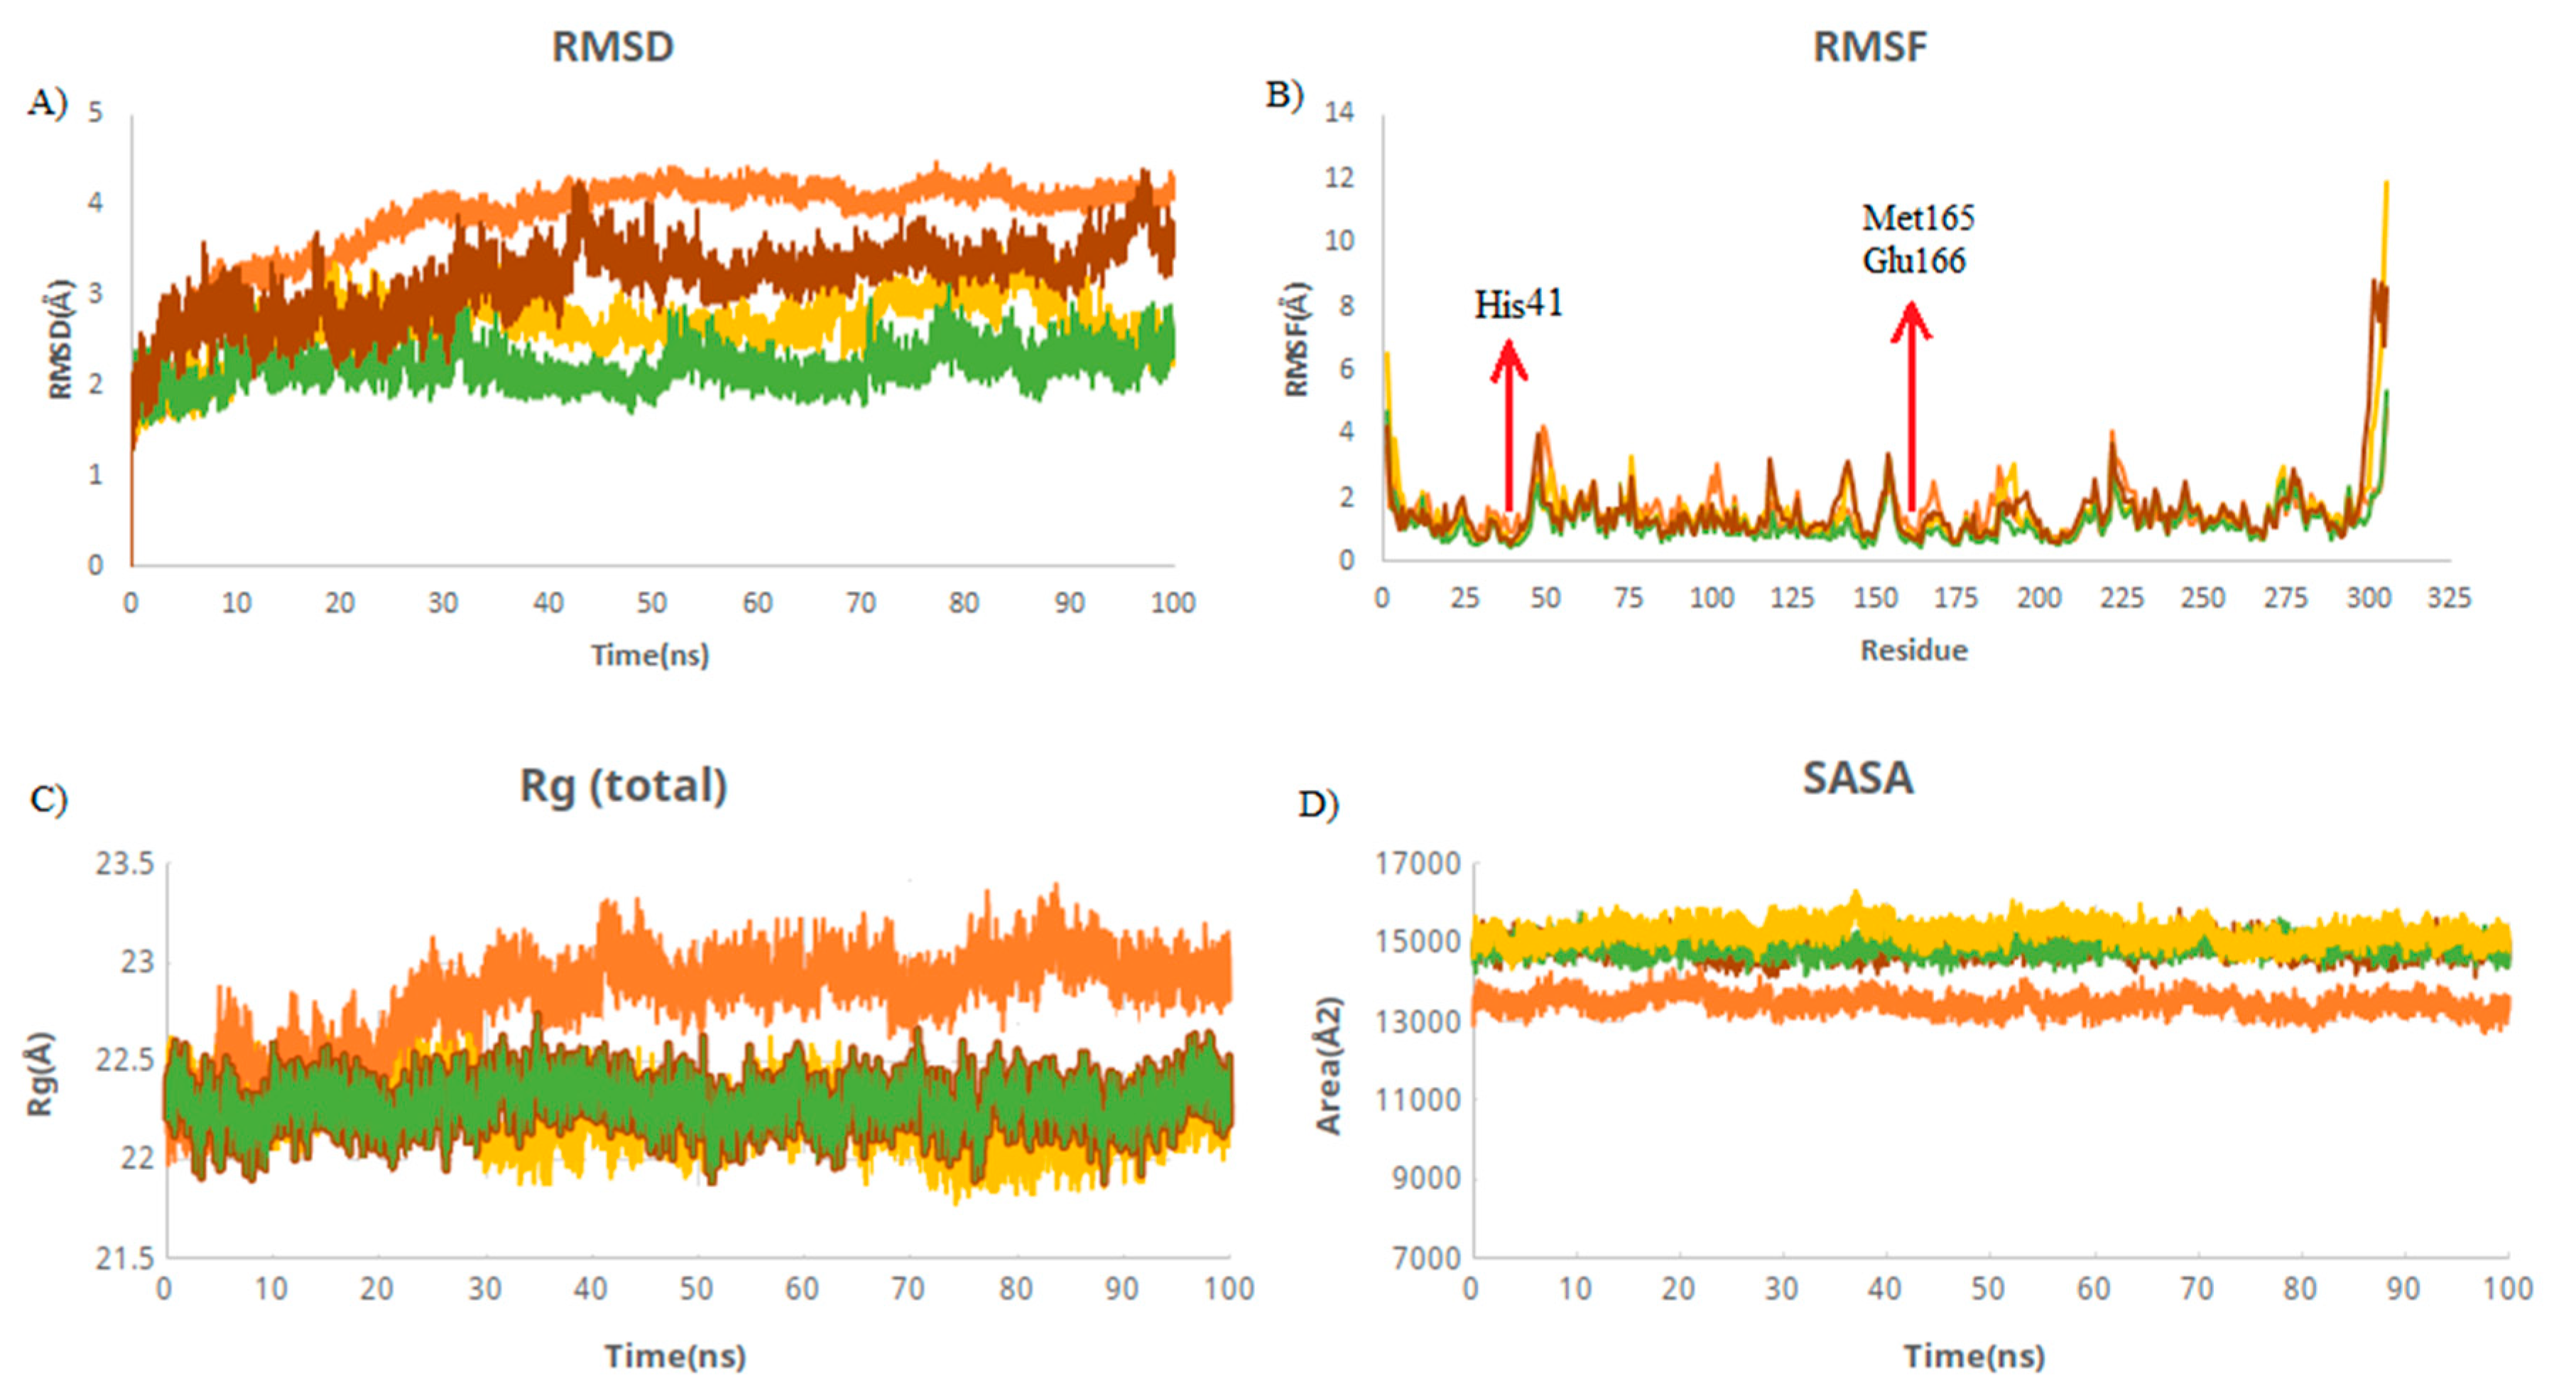
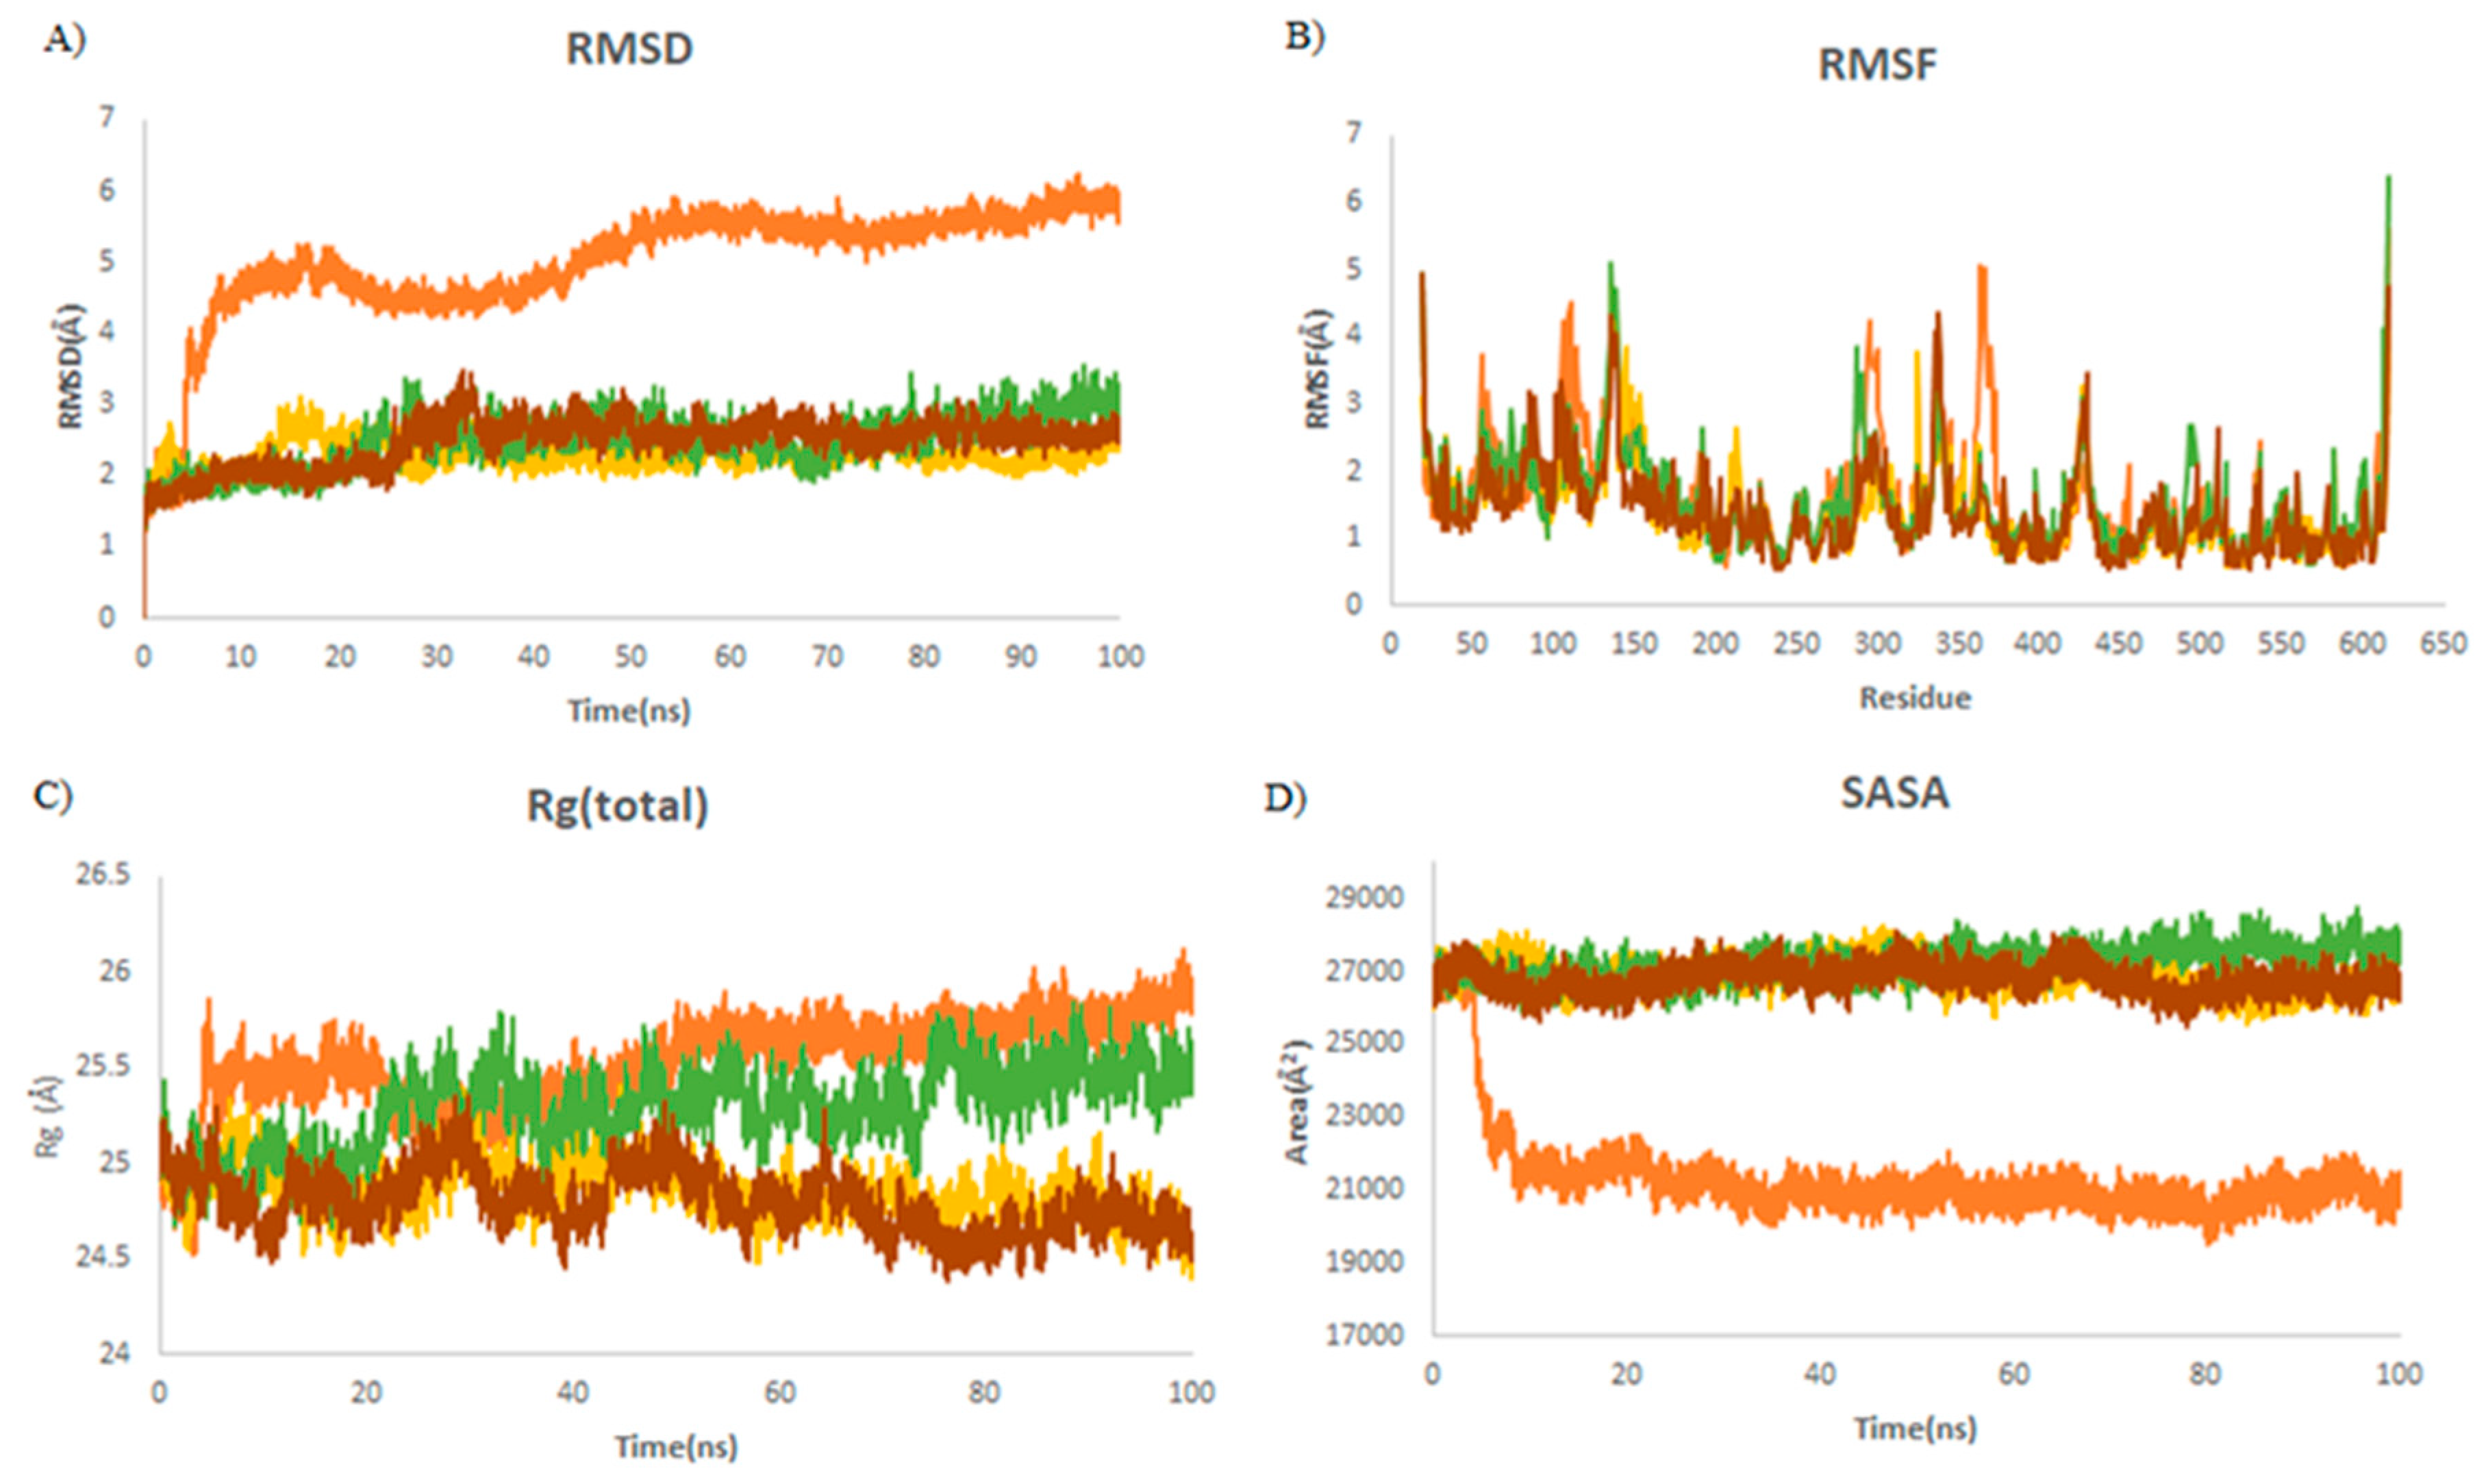
2.2. MD Simulations
2.2.1. Structural Dynamics of M protease
2.2.2. Structural Dynamics of Angiotensin-Converting Enzyme 2 (ACE2)
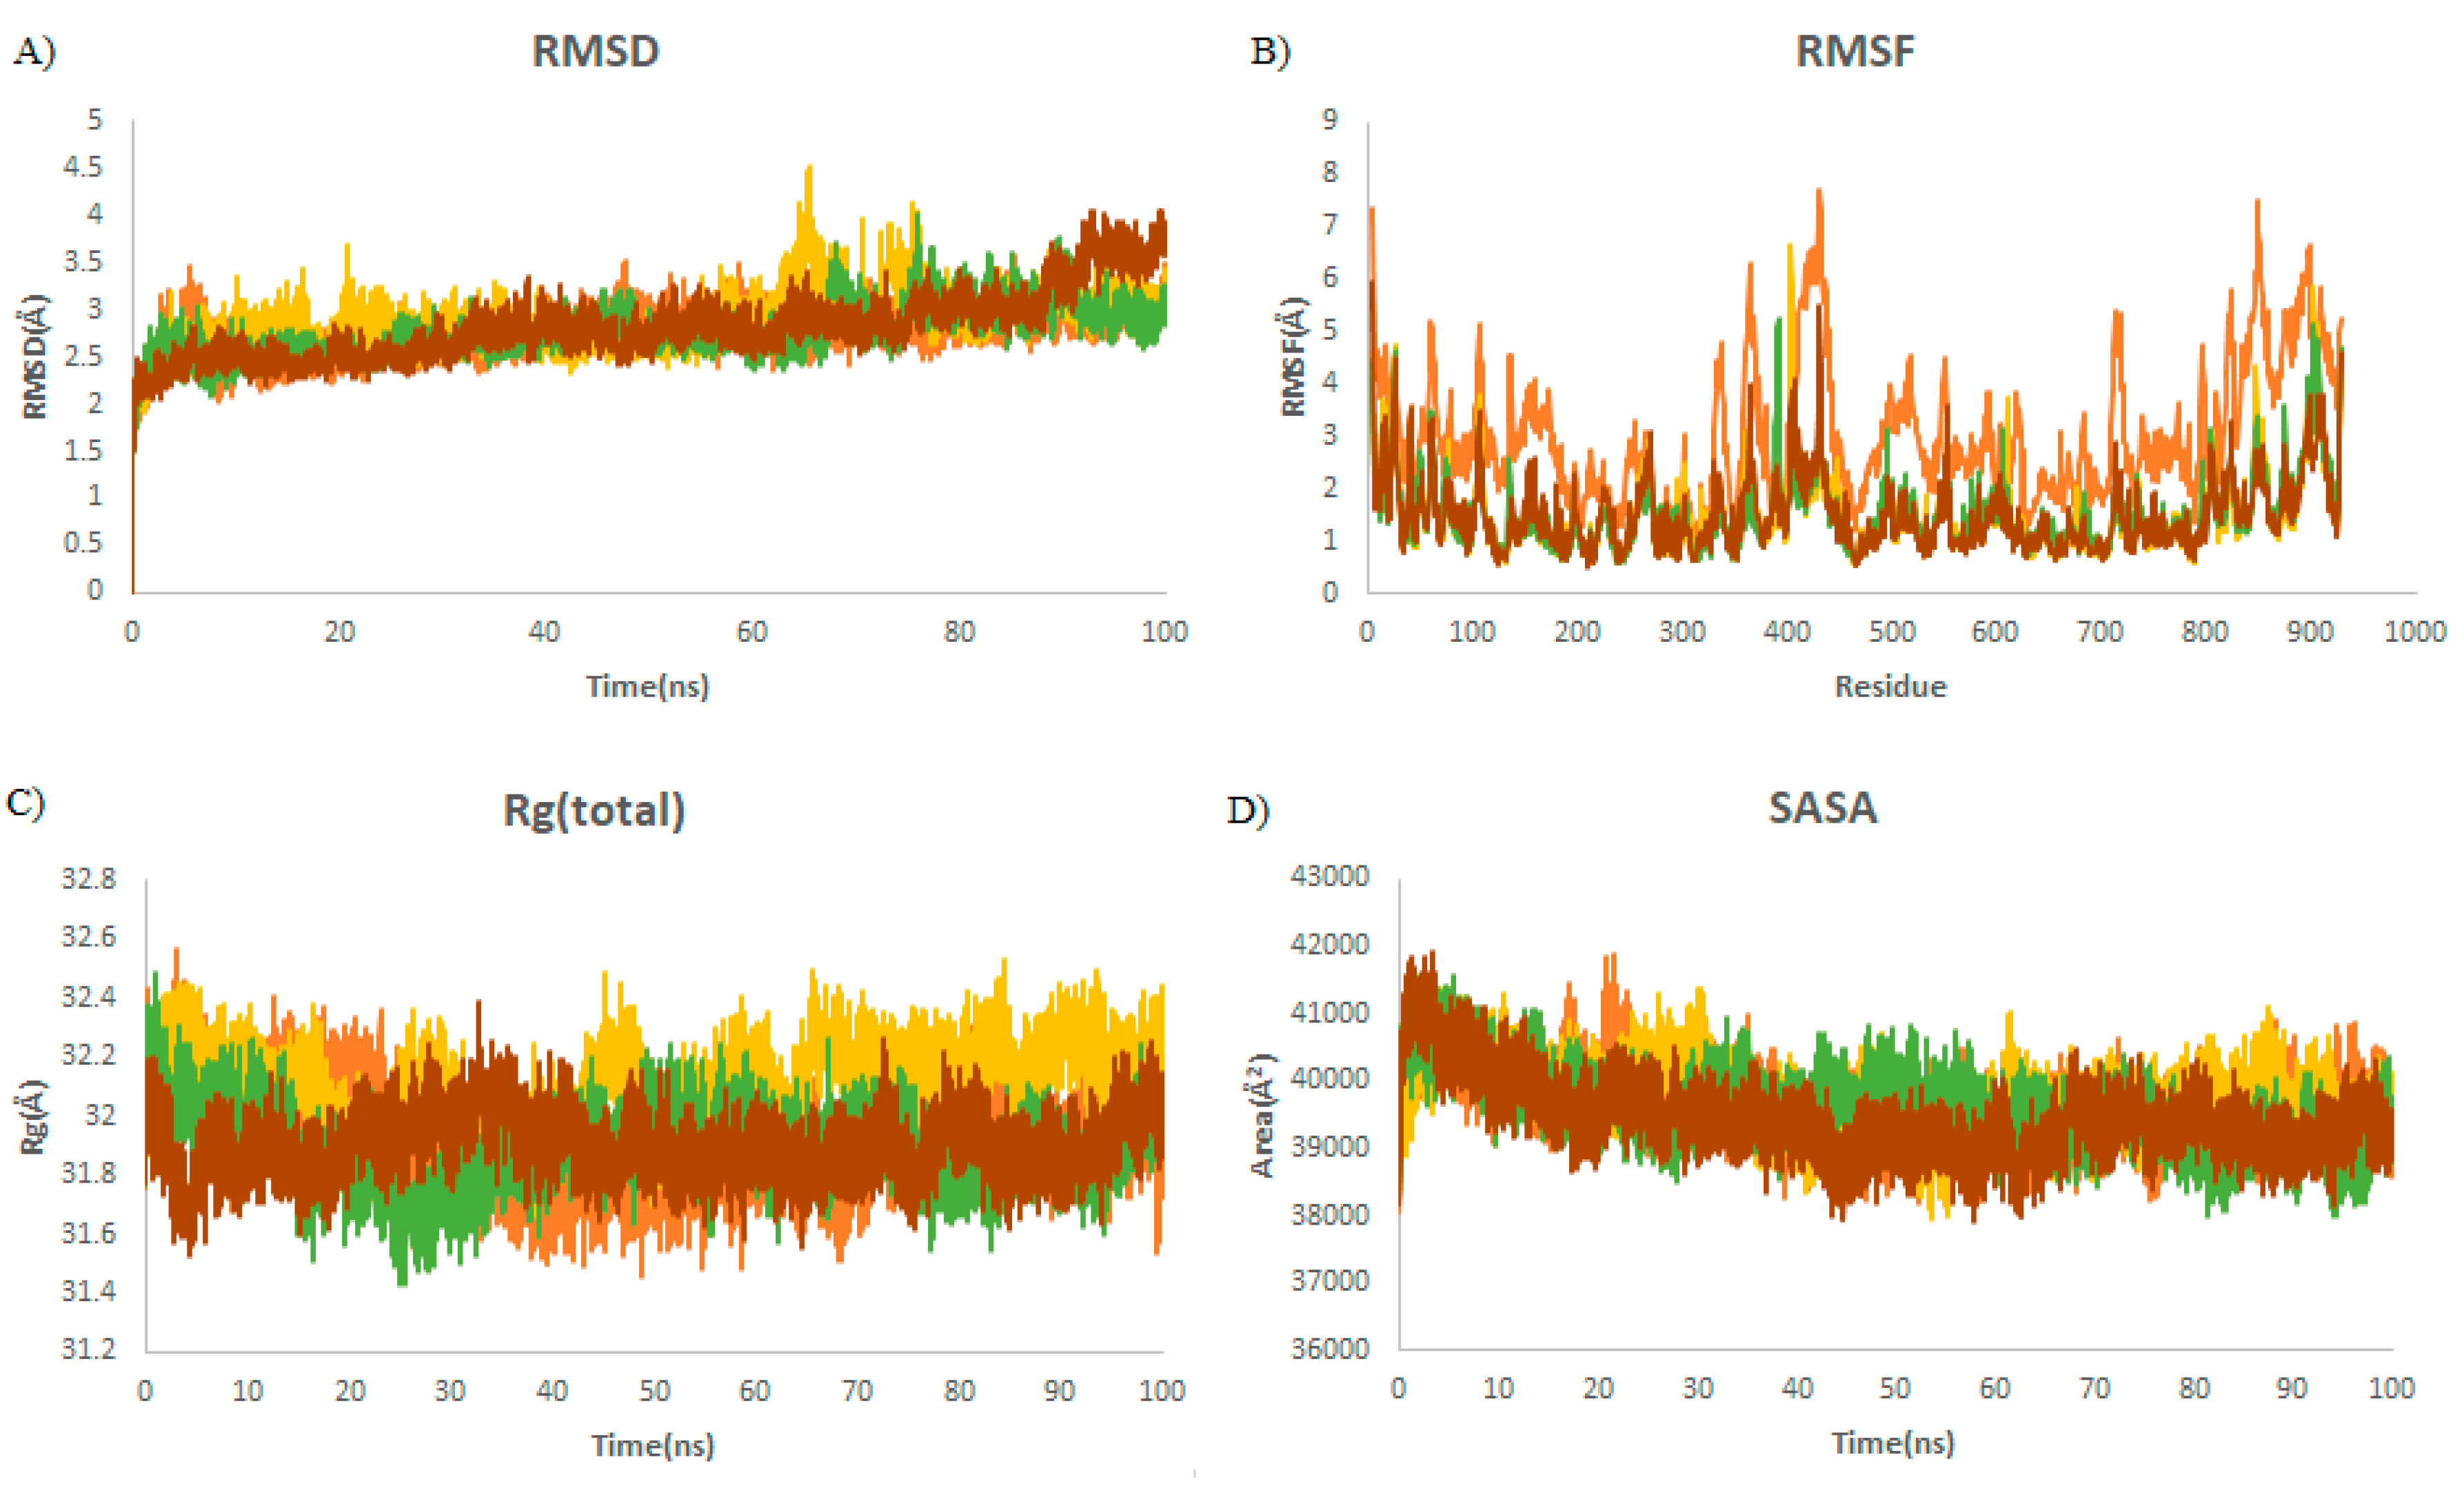
2.2.3. Structural Dynamics of RNA-Dependent RNA Polymerase (RdRp)
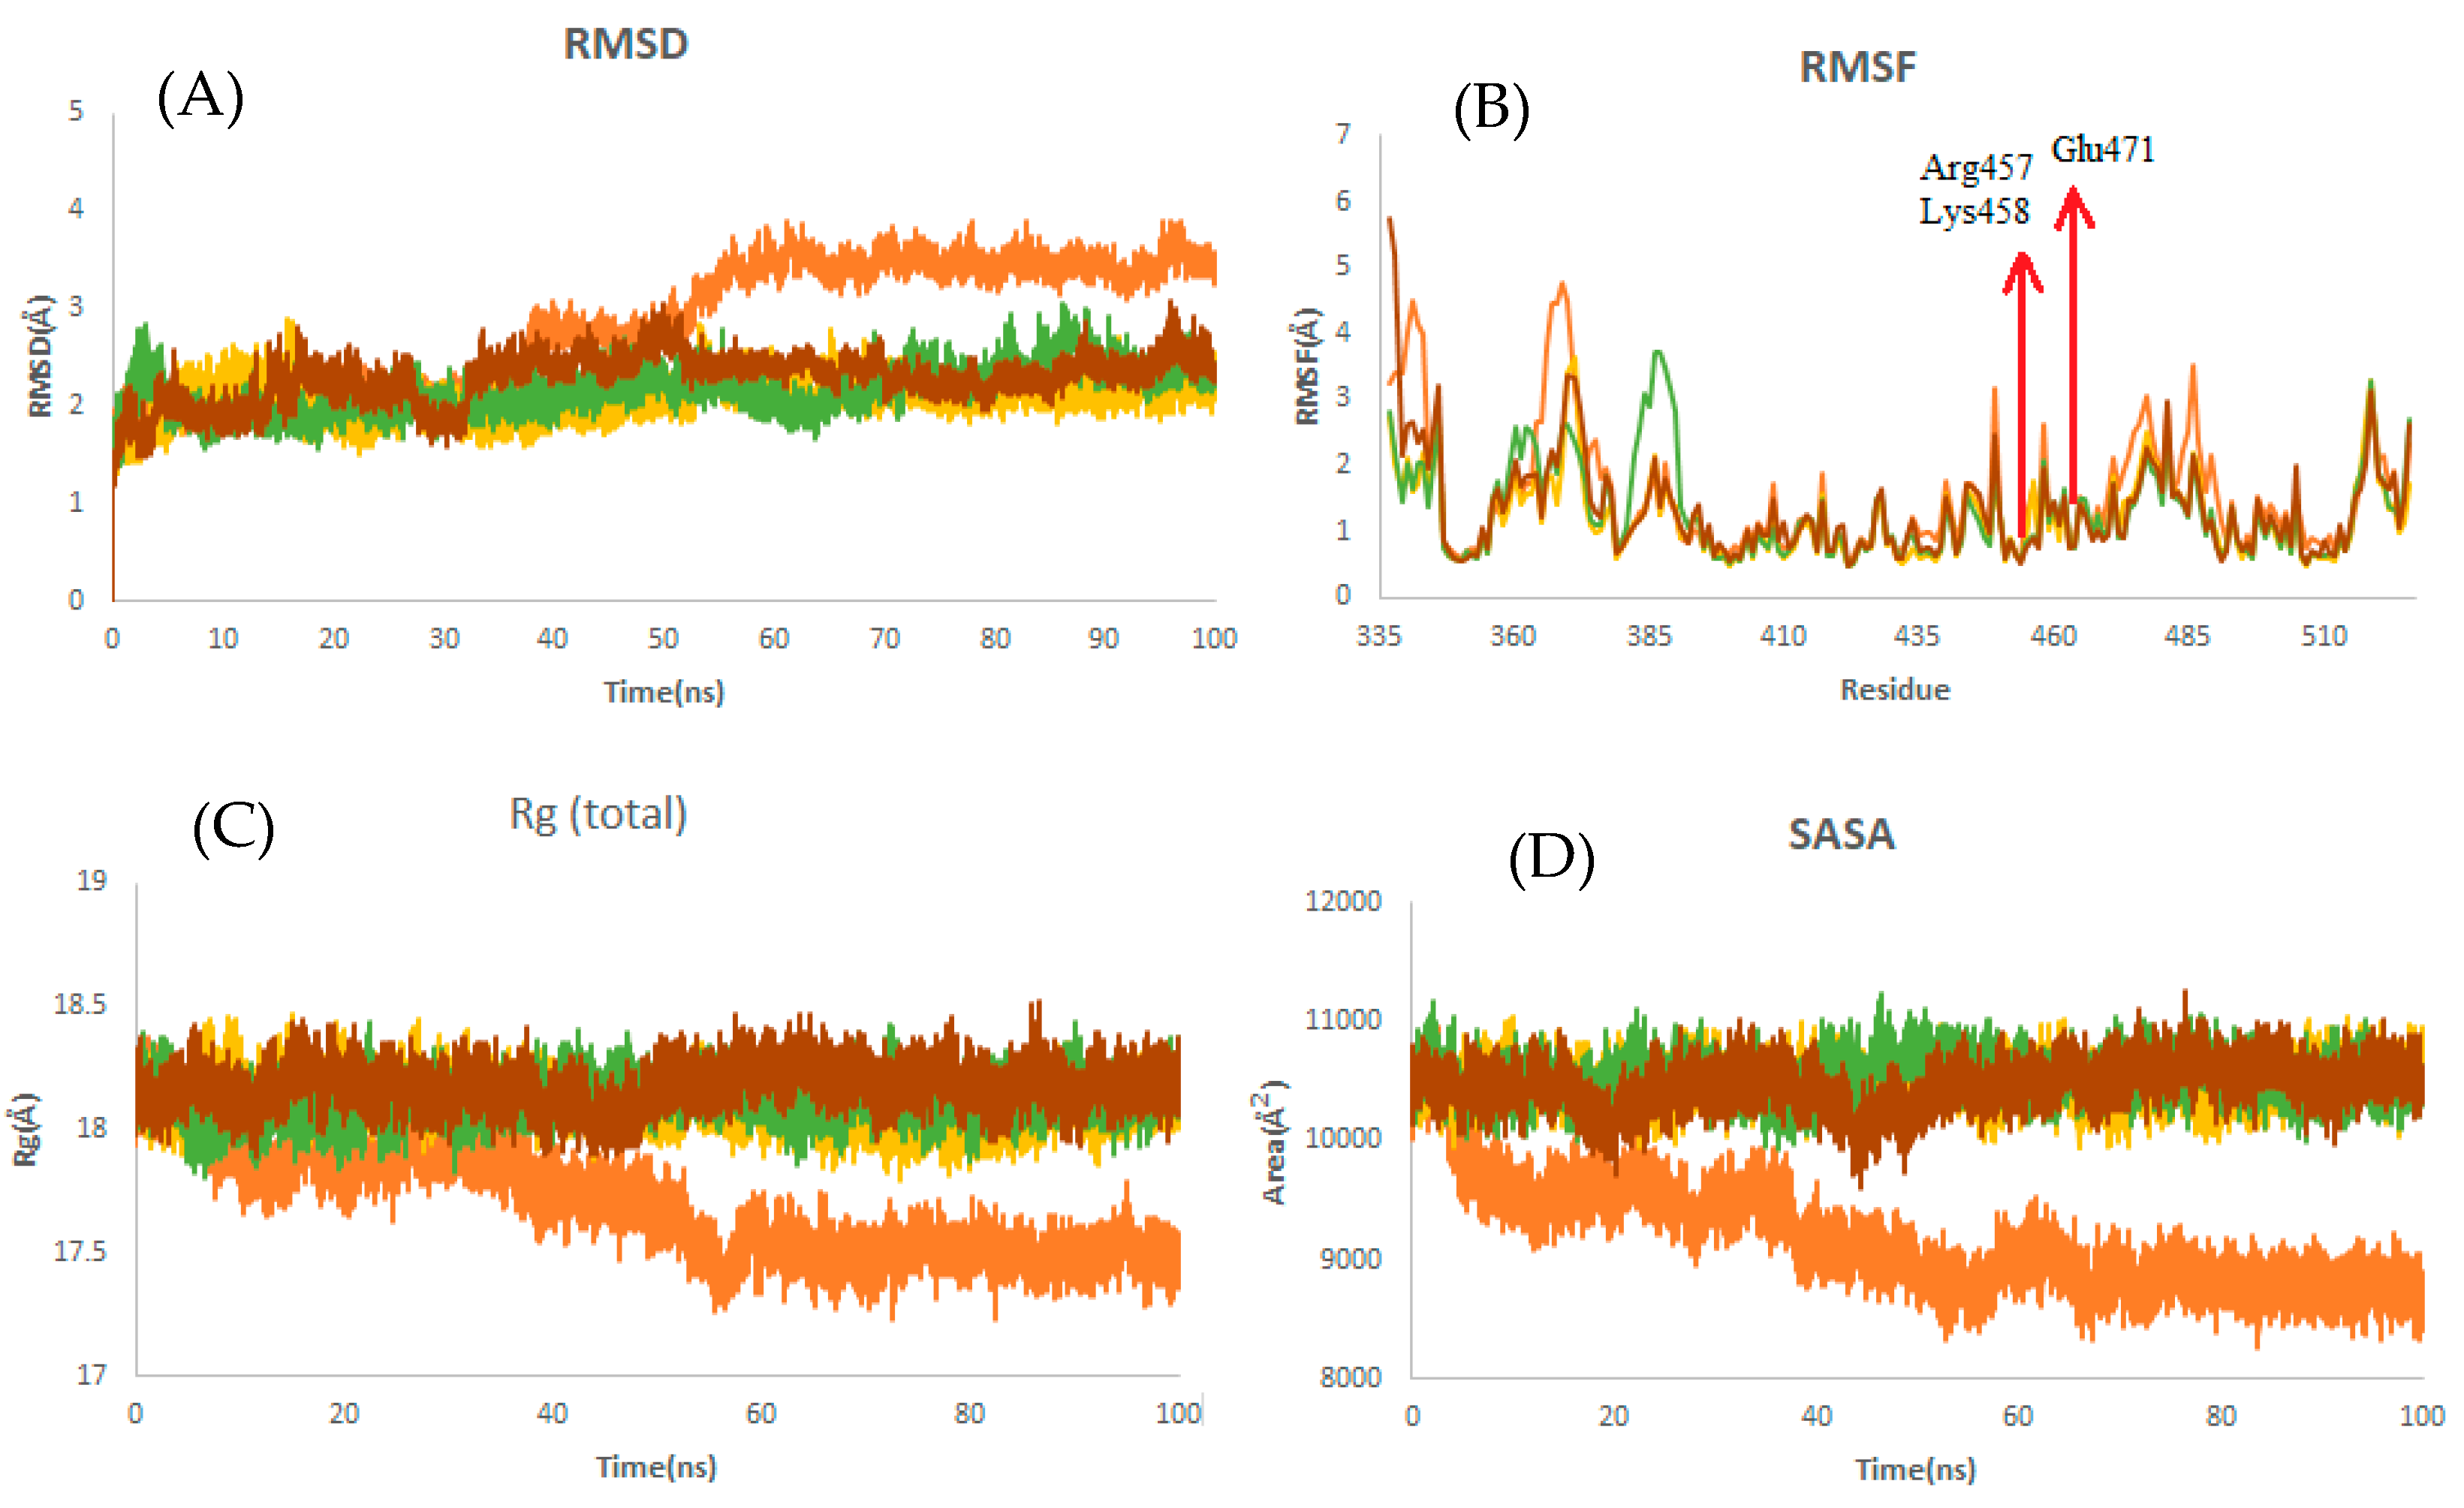
2.2.4. Structural Dynamics of the Receptor-Binding Domain (RBD)
2.2.5. Secondary Structure Changes upon Ligand Binding
2.2.6. Hydrogen Bonding
2.3. Drug-Likeness Evaluation
3. Materials and Methods
3.1. Ligand Preparation
3.2. Receptor Preparation
3.3. Binding Site Prediction
3.4. Virtual Screening and In Silico Molecular Docking
3.5. Molecular Dynamic Simulations
3.6. Drug-Like Properties of the Ligands
4. Conclusions
Supplementary Materials
Author Contributions
Funding
Institutional Review Board Statement
Informed Consent Statement
Data Availability Statement
Acknowledgments
Conflicts of Interest
References
- Cascella, M.; Rajnik, M.; Aleem, A.; Dulebohn, S.C.; Di Napoli, R. Features, Evaluation, and Treatment of Coronavirus (COVID-19). StatPearls 2022. Available online: https://www.ncbi.nlm.nih.gov/books/NBK554776/ (accessed on 4 May 2022).
- Chen, J.; Lu, H. New challenges to fighting COVID-19: Virus variants, potential vaccines, and development of antivirals. Biosci. Trends 2021, 15, 126–128. [Google Scholar] [CrossRef] [PubMed]
- Niknam, Z.; Jafari, A.; Golchin, A.; Danesh Pouya, F.; Nemati, M.; Rezaei-Tavirani, M.; Rasmi, Y. Potential therapeutic options for COVID-19: An update on current evidence. Eur. J. Med. Res. 2022, 27, 1–15. [Google Scholar] [CrossRef] [PubMed]
- Cannalire, R.; Cerchia, C.; Beccari, A.R.; Di Leva, F.S.; Summa, V. Targeting SARS-CoV-2 proteases and polymerase for COVID-19 treatment: State of the art and future opportunities. J. Med. Chem. 2020, 65, 2716–2746. [Google Scholar] [CrossRef]
- Wu, C.; Liu, Y.; Yang, Y.; Zhang, P.; Zhong, W.; Wang, Y.; Wang, Q.; Xu, Y.; Li, M.; Li, X.; et al. Analysis of therapeutic targets for SARS-CoV-2 and discovery of potential drugs by computational methods. Acta Pharm. Sin. B 2020, 10, 766–788. [Google Scholar] [CrossRef]
- Zhang, H.; Penninger, J.M.; Li, Y.; Zhong, N.; Slutsky, A.S. Angiotensin-converting enzyme 2 (ACE2) as a SARS-CoV-2 receptor: Molecular mechanisms and potential therapeutic target. Intensive Care Med. 2020, 46, 586–590. [Google Scholar] [CrossRef] [Green Version]
- Huang, Y.; Yang, C.; Xu, X.; Xu, W.; Liu, S.-W. Structural and functional properties of SARS-CoV-2 spike protein: Potential antivirus drug development for COVID-19. Acta Pharmacol. Sin. 2020, 41, 1141–1149. [Google Scholar] [CrossRef]
- Ashburn, T.T.; Thor, K.B. Drug repositioning: Identifying and developing new uses for existing drugs. Nat. Rev. Drug Discov. 2004, 3, 673–683. [Google Scholar] [CrossRef]
- Rudrapal, M.; Khairnar, S.J.; Jadhav, A.G. Drug repurposing (DR): An emerging approach in drug discovery. Drug Repurposing Hypothesis Mol. Asp. Appl. 2020. [Google Scholar] [CrossRef]
- Oxford, A.E.; Raistrick, H.; Simonart, P. Studies in the biochemistry of micro-organisms: Griseofulvin, C17H17O6Cl, a metabolic product of Penicillium griseo-fulvum Dierckx. Biochem. J. 1939, 33, 240. [Google Scholar] [CrossRef]
- Lambert, D.R.; Siegle, R.J.; Camisa, C. Griseofulvin and ketoconazole in the treatment of dermatophyte infections. Int. J. Dermatol. 1989, 28, 300–3004. [Google Scholar] [CrossRef]
- Rebacz, B.; Larsen, T.O.; Clausen, M.H.; Rønnest, M.H.; Löffler, H.; Ho, A.D.; Krämer, A. Identification of griseofulvin as an inhibitor of centrosomal clustering in a phenotype-based screen. Cancer Res. 2007, 67, 6342–6350. [Google Scholar] [CrossRef] [PubMed] [Green Version]
- Jin, H.; Yamashita, A.; Maekawa, S.; Yang, P.; He, L.; Takayanagi, S.; Wakita, T.; Sakamoto, N.; Enomoto, N.; Ito, M. Griseofulvin, an oral antifungal agent, suppresses hepatitis C virus replication in vitro. Hepatol. Res. 2008, 38, 909–918. [Google Scholar] [PubMed]
- Aris, P.; Yan, L.; Wei, Y.; Chang, Y.; Shi, B.; Xia, X. Conservation of griseofulvin genes in the gsf gene cluster among fungal genomes. G3 2022, 12, jkab399. [Google Scholar] [CrossRef]
- Atlas, S.A. The renin-angiotensin aldosterone system: Pathophysiological role and pharmacologic inhibition. J. Manag. Care Pharm. 2007, 13, 9–20. [Google Scholar] [CrossRef] [PubMed] [Green Version]
- Imai, Y.; Kuba, K.; Rao, S.; Huan, Y.; Guo, F.; Guan, B.; Yang, P.; Sarao, R.; Wada, T.; Leong-Poi, H.; et al. Angiotensin-converting enzyme 2 protects from severe acute lung failure. Nature 2005, 436, 112–116. [Google Scholar] [CrossRef] [PubMed]
- Shirbhate, E.; Pandey, J.; Patel, V.K.; Kamal, M.; Jawaid, T.; Gorain, B.; Kesharwani, P.; Rajak, H. Understanding the role of ACE-2 receptor in pathogenesis of COVID-19 disease: A potential approach for therapeutic intervention. Pharmacol. Rep. 2021, 73, 1539–1550. [Google Scholar] [CrossRef]
- Vitiello, A.; Ferrara, F. Therapeutic strategies for SARS-CoV-2 acting on ACE-2. Eur. J. Pharm. Sci. 2021, 156, 105579. [Google Scholar] [CrossRef]
- Rubin, A.A. Coronary vascular effects of griseofulvin. JAMA 1963, 185, 971–972. [Google Scholar] [CrossRef]
- Aldinger, E.E. Cardiovascular effects of griseofulvin. Circ. Res. 1968, 22, 589–593. [Google Scholar] [CrossRef] [Green Version]
- Agarwal, S.; Mehrotra, R. An overview of molecular docking. JSM Chem. 2016, 4, 1024–1028. [Google Scholar]
- Borhani, D.W.; Shaw, D.E. The future of molecular dynamics simulations in drug discovery. J. Comput. -Aided Mol. Des. 2012, 26, 15–26. [Google Scholar] [CrossRef] [Green Version]
- Deaven, D.M.; Ho, K.-M. Molecular geometry optimization with a genetic algorithm. Phys. Rev. Lett. 1995, 75, 288. [Google Scholar] [CrossRef] [PubMed] [Green Version]
- Liu, X.; Zhang, B.; Jin, Z.; Yang, H.; Rao, Z. The crystal structure of 2019-nCoV main protease in complex with an inhibitor N3. RCSB Protein Data Bank 2020, 10, pdb6LU7. [Google Scholar]
- Zhou, J.; Fang, L.; Yang, Z.; Xu, S.; Lv, M.; Sun, Z.; Chen, J.; Wang, D.; Gao, J.; Xiao, S. Identification of novel proteolytically inactive mutations in coronavirus 3C-like protease using a combined approach. FASEB J. 2019, 33, 14575–14587. [Google Scholar] [CrossRef] [PubMed] [Green Version]
- Liu, X.; Wang, X.-J. Potential inhibitors against 2019-nCoV coronavirus M protease from clinically approved medicines. J. Genet. Genom. 2020, 47, 119. [Google Scholar] [CrossRef]
- Marion, F.; Lieby-Muller, F.; Grisoni, S.; Rahier, N.; Perez, M.; Sartori, I. Griseofulvin Derivatives. WO/2014/020101, 6 February 2014. [Google Scholar]
- Krämer, A.; Rebacz, B.; Clausen, M.; Larsen, T.; Roennest, M.; Worm, K. Deutsches Krebsforschungszentrum DKFZ, Assignee. EP2204367A1, 7 July 2010. [Google Scholar]
- Santos, R.A.S.; Sampaio, W.O.; Alzamora, A.C.; Motta-Santos, D.; Alenina, N.; Bader, M.; Campagnole-Santos, M.J. The ACE2/angiotensin-(1–7)/MAS axis of the renin-angiotensin system: Focus on angiotensin-(1–7). Physiol. Rev. 2017, 98, 505–553. [Google Scholar] [CrossRef] [Green Version]
- Lan, J.; Ge, J.; Yu, J.; Shan, S.; Zhou, H.; Fan, S.; Zhang, Q.; Shi, X.; Wang, Q.; Zhang, L.; et al. Structure of the SARS-CoV-2 spike receptor-binding domain bound to the ACE2 receptor. Nature 2020, 581, 215–220. [Google Scholar] [CrossRef] [Green Version]
- Donoghue, M.; Hsieh, F.; Baronas, E.; Godbout, K.; Gosselin, M.; Stagliano, N.; Donovan, M.; Woolf, B.; Robison, K.; Jeyaseelan, R.; et al. A novel angiotensin-converting enzyme–related carboxypeptidase (ACE2) converts angiotensin I to angiotensin 1-9. Circ. Res. 2000, 87, e1–e9. [Google Scholar] [CrossRef]
- Hamming, I.; Timens, W.; Bulthuis, M.; Lely, A.; Navis, G.J.; van Goor, H. Tissue distribution of ACE2 protein, the functional receptor for SARS coronavirus. A first step in understanding SARS pathogenesis. J. Pathol. 2004, 203, 631–637. [Google Scholar] [CrossRef]
- Zhang, H.; Li, H.-B.; Lyu, J.-R.; Lei, X.-M.; Li, W.; Wu, G.; Lyu, J.; Dai, Z.-M. Specific ACE2 expression in small intestinal enterocytes may cause gastrointestinal symptoms and injury after 2019-nCoV infection. Int. J. Infect. Dis. 2020, 96, 19–24. [Google Scholar] [CrossRef]
- Sargsyan, K.; Grauffel, C.; Lim, C. How molecular size impacts RMSD applications in molecular dynamics simulations. J. Chem. Theory Comput. 2017, 13, 1518–1524. [Google Scholar] [CrossRef] [PubMed]
- Campagnola, G.; Gong, P.; Peersen, O.B. High-throughput screening identification of poliovirus RNA-dependent RNA polymerase inhibitors. Antivir. Res. 2011, 91, 241–251. [Google Scholar] [CrossRef] [PubMed] [Green Version]
- Tian, L.; Qiang, T.; Liang, C.; Ren, X.; Jia, M.; Zhang, J.; Li, J.; Wan, M.; YuWen, X.; Li, H.; et al. RNA-dependent RNA polymerase (RdRp) inhibitors: The current landscape and repurposing for the COVID-19 pandemic. Eur. J. Med. Chem. 2021, 213, 113201. [Google Scholar] [CrossRef] [PubMed]
- Das, K.; Aramini, J.M.; Ma, L.-C.; Krug, R.M.; Arnold, E. Structures of influenza A proteins and insights into antiviral drug targets. Nat. Struct. Mol. Biol. 2010, 17, 530–538. [Google Scholar] [CrossRef] [Green Version]
- Sampath, A.; Padmanabhan, R. Molecular targets for flavivirus drug discovery. Antivir. Res. 2009, 81, 6–15. [Google Scholar] [CrossRef] [Green Version]
- Wang, Y.; Anirudhan, V.; Du, R.; Cui, Q.; Rong, L. RNA-dependent RNA polymerase of SARS-CoV-2 as a therapeutic target. J. Med. Virol. 2021, 93, 300–310. [Google Scholar] [CrossRef]
- Zhu, W.; Chen, C.Z.; Gorshkov, K.; Xu, M.; Lo, D.C.; Zheng, W. RNA-dependent RNA polymerase as a target for COVID-19 drug discovery. SLAS Discov. Adv. Sci. Drug Discov. 2020, 25, 1141–1151. [Google Scholar] [CrossRef]
- Seyran, M.; Takayama, K.; Uversky, V.N.; Lundstrom, K.; Palù, G.; Sherchan, S.P.; Attrish, D.; Rezaei, N.; Aljabali, A.A.A.; Ghosh, S.; et al. The structural basis of accelerated host cell entry by SARS-CoV-2. FEBS J. 2021, 288, 5010–5020. [Google Scholar] [CrossRef]
- Durmaz, B.; Abdulmajed, O.; Durmaz, R. Mutations observed in the SARS-CoV-2 spike glycoprotein and their effects in the interaction of virus with ACE-2 receptor. Medeni. Med. J. 2020, 35, 253. [Google Scholar] [CrossRef]
- Wang, C.; Li, W.; Drabek, D.; Okba, N.; van Haperen, R.; Osterhaus, A.D.; van Kuppeveld, F.J.M.; Haagmans, B.L.; Grosveld, F.; Bosch, B.-J. A human monoclonal antibody blocking SARS-CoV-2 infection. Nat. Commun. 2020, 11, 1–6. [Google Scholar] [CrossRef]
- Daina, A.; Michielin, O.; Zoete, V. SwissADME: A free web tool to evaluate pharmacokinetics, drug-likeness and medicinal chemistry friendliness of small molecules. Sci. Rep. 2017, 7, 1–13. [Google Scholar] [CrossRef] [PubMed] [Green Version]
- Lipinski, C.A.; Lombardo, F.; Dominy, B.W.; Feeney, P.J. Experimental and computational approaches to estimate solubility and permeability in drug discovery and development settings. Adv. Drug Deliv. Rev. 1997, 23, 3–25. [Google Scholar] [CrossRef]
- Wang, J.; Wolf, R.M.; Caldwell, J.W.; Kollman, P.A.; Case, D.A. Development and testing of a general amber force field. J. Comput. Chem. 2004, 25, 1157–1174. [Google Scholar] [CrossRef] [PubMed]
- Schwede, T.; Kopp, J.; Guex, N.; Peitsch, M.C. SWISS-MODEL: An automated protein homology-modeling server. Nucleic Acids Res. 2003, 31, 3381–3385. [Google Scholar] [CrossRef] [Green Version]
- Laskowski, R.A.; MacArthur, M.W.; Moss, D.S.; Thornton, J.M. PROCHECK: A program to check the stereochemical quality of protein structures. J. Appl. Crystallogr. 1993, 26, 283–291. [Google Scholar] [CrossRef]
- Lovell, S.C.; Davis, I.W.; Arendall, W.B., III; De Bakker, P.I.; Word, J.M.; Prisant, M.G.; Richardson, J.S.; Richardson, D.C. Structure validation by Cα geometry: ϕ, ψ and Cβ deviation. Proteins Struct. Funct. Bioinform. 2003, 50, 437–450. [Google Scholar] [CrossRef]
- Naydenova, K.; Muir, K.W.; Wu, L.-F.; Zhang, Z.; Coscia, F.; Peet, M.J.; Castro-Hartmann, P.; Qian, P.; Sader, K.; Dent, K.; et al. Dent. Structure of the SARS-CoV-2 RNA-dependent RNA polymerase in the presence of favipiravir-RTP. Proc. Natl. Acad. Sci. USA 2021, 118, e2021946118. [Google Scholar] [CrossRef]
- Dallakyan, S.; Olson, A.J. Small-molecule library screening by docking with PyRx. In Chemical Biology; Springer: Berlin/Heidelberg, Germany, 2015; pp. 243–250. [Google Scholar]
- Morris, G.M.; Huey, R.; Lindstrom, W.; Sanner, M.F.; Belew, R.K.; Goodsell, D.S.; Olson, A.J. AutoDock4 and AutoDockTools4: Automated docking with selective receptor flexibility. J. Comput. Chem. 2009, 30, 2785–2791. [Google Scholar] [CrossRef] [Green Version]
- Abraham, L.; van der Spoel, H. GROMACS 2020.2 Source Code, Version 2020.2; Zenodo: Maastricht, The Netherlands, 2020. [Google Scholar]
- Sousa da Silva, A.W.; Vranken, W.F. ACPYPE-Antechamber python parser interface. BMC Res. Notes 2012, 5, 367. [Google Scholar] [CrossRef] [Green Version]
- Berendsen, H.J.; Postma, J.P.M.; Van Gunsteren, W.F.; DiNola, A.; Haak, J.R. Molecular dynamics with coupling to an external bath. J. Chem. Phys. 1984, 81, 3684–3690. [Google Scholar] [CrossRef] [Green Version]
- Fatima, U.; Rizvi, S.S.A.; Raina, N.; Fatima, S.; Rahman, S.; Kamal, M.A.; Hassan, M.I. Therapeutic management of COVID-19 patients: Clinical manifestation and limitations. Curr. Pharm. Des. 2021, 27, 4223–4231. [Google Scholar] [CrossRef] [PubMed]
- Salasc, F.; Lahlali, T.; Laurent, E.; Rosa-Calatrava, M.; Pizzorno, A. Treatments for COVID-19: Lessons from 2020 and new therapeutic options. Curr. Opin. Pharmacol. 2022, 62, 43–59. [Google Scholar] [CrossRef] [PubMed]
- Hamdy, A.K.; Sheha, M.M.; Abdel-Hafez, A.A.; Shouman, S.A. Design, synthesis, and cytotoxicity evaluation of novel griseofulvin analogues with improved water solubility. Int. J. Med. Chem. 2017, 2017, 7386125. [Google Scholar] [CrossRef] [PubMed] [Green Version]

| PubChem ID | Binding Energy (kcal/mol) | H-Bonds | Hydrophobic Interactions | Lipinski Analysis | Ligand Interaction Diagram | |
|---|---|---|---|---|---|---|
| 441140 (M1) | −6.80 | HIS 41 GLY 143 CYS 145 GLU 166 | MET 49 MET 165 ARG 188 | Molecular weight Lipophilicity H bond donor H bond acceptor Violations Lipinski Hepatotoxicity | 352.7 2.95 0 6 0 Yes No | 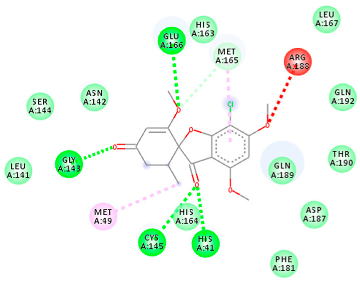 |
| 142550537 (M7) | −7.58 | HIS 41 GLY 143 GLU 166 THR 190 GLN 192 | MET 165 PRO 168 ARG 188 GLN 189 THR 190 GLN 192 | Molecular weight Lipophilicity H bond donor H bond acceptor Violations Lipinski Hepatotoxicity | 506.7 2.59 0 13 2 Yes No | 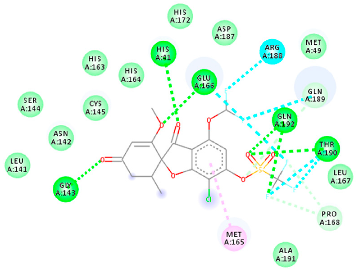 |
| 144564153 (M9) | −9.49 | MET 165 GLU 166 | CYS 44 MET 49 LEU 141 CYS 145 MET 165 | Molecular weight Lipophilicity H bond donor H bond acceptor Violations Lipinski Hepatotoxicity | 484.9 3.61 1 7 0 Yes No | 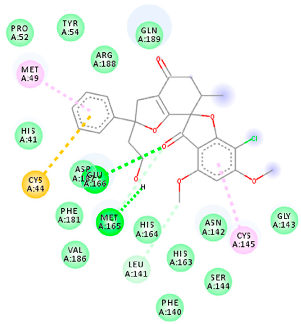 |
| 441140 (A7) | −5.2 | HIS 401 ARG 514 | HIS 378 GLU 398 HIS 401 | Molecular weight Lipophilicity H bond donor H bond acceptor Violations Lipinski Hepatotoxicity | 352.7 2.95 0 6 0 Yes No | 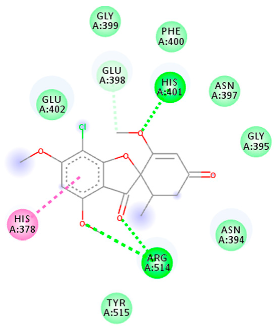 |
| 46844082 (A3) | −8.44 | ALA 348 ASN 394 ARG 514 | GLU 375 HIS 378 HIS 401 GLU 402 | Molecular weight Lipophilicity H bond donor H bond acceptor Violations Lipinski Hepatotoxicity | 641.1 5.51 0 8 2 Yes No | 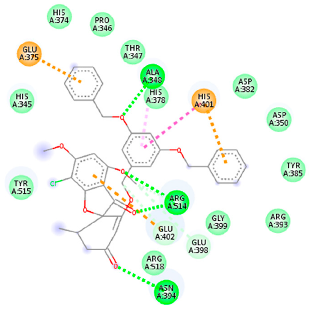 |
| 132286359 (A9) | −6.51 | ASP 382 GLY 395 PHE 400 HIS 401 GLU 402 ARG 514 | GLU 375 HIS 378 HIS 401 GLU 402 | Molecular weight Lipophilicity H bond donor H bond acceptor Violations Lipinski Hepatotoxicity | 551.3 3.85 2 9 1 Yes No | 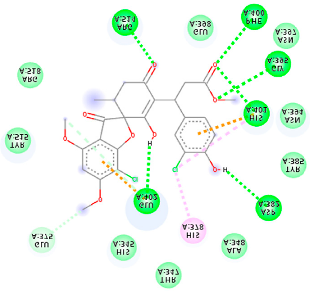 |
| 441140 (Rd7) | −5.62 | LYS 621 CYS 622 LYS 798 | ASP 623 | Molecular weight Lipophilicity H bond donor H bond acceptor Violations Lipinski Hepatotoxicity | 352.7 2.95 0 6 0 Yes No | 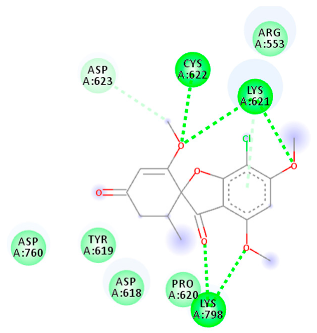 |
| 73331209 (Rd2) | −7.21 | LYS 621 CYS 622 LYS 798 | ASP 618 LYS 621 CYS 622 ASP 623 | Molecular weight Lipophilicity H bond donor H bond acceptor Violations Lipinski Hepatotoxicity | 458.8 3.75 0 7 0 Yes No | 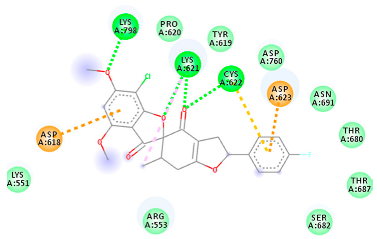 |
| 118254151 (Rd6) | −6.61 | LYS 621 CYS 622 LYS 798 | ASP 618 LYS 621 CYS 622 ASP 623 ASN 691 | Molecular weight Lipophilicity H bond donor H bond acceptor Violations Lipinski Hepatotoxicity | 458.8 3.73 0 7 0 Yes No | 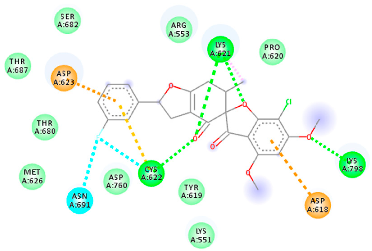 |
| 441140 (Rb1) | −5.3 | GLU 471 | LYS 458 GLU 471 | Molecular weight Lipophilicity H bond donor H bond acceptor Violations Lipinski Hepatotoxicity | 352.7 2.95 0 6 0 Yes No | 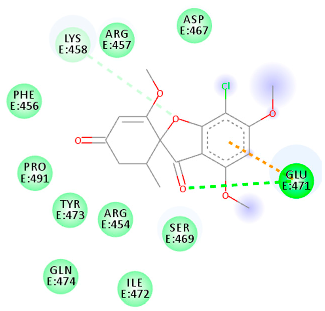 |
| 56950846 (Rb3) | −7.21 | ARG 457 LYS 458 SER 469 | ARG 457 LYS 458 GLU 471 PRO 491 | Molecular weight Lipophilicity H bond donor H bond acceptor Violations Lipinski Hepatotoxicity | 428.8 3.6 0 6 0 Yes No | 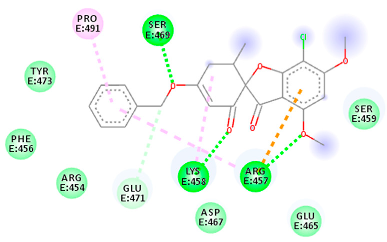 |
| 125429633 (Rb9) | −6.5 | ARG 457 LYS 458 SER 459 GLU 471 ILE 472 | ARG 457 LYS 458 GLU 471 PRO 491 | Molecular weight Lipophilicity H bond donor H bond acceptor Violations Lipinski Hepatotoxicity | 516.9 3.45 2 9 1 Yes No | 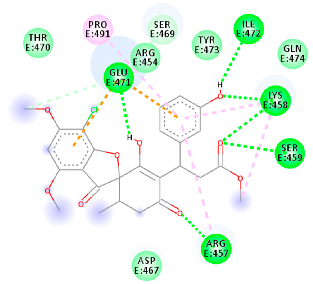 |
| Complex | Mean RMSD (Å) | Mean RMSF (Å) | Mean Rg (Å) | Mean SASA (Å) |
|---|---|---|---|---|
| M protease | 4.12 ± 0.08 | 0.91 ± 0.40 | 22.99 ± 0.95 | 13,382 ± 199 |
| M protease–M9 | 2.79 ± 0.30 | 1.2 ± 1.03 | 22.14 ± 0.11 | 15,177 ± 199 |
| M protease–M7 | 2.35 ± 0.16 | 1.05 ± 0.49 | 22.30 ± 0.10 | 14,885 ± 180 |
| M protease–griseofulvin | 3.51 ± 0.23 | 1.17 ± 0.65 | 21.81 ± 0.11 | 14,834 ± 200 |
| Complex | Mean RMSD (Å) | Mean RMSF (Å) | Mean Rg (Å) | Mean SASA (Å) |
|---|---|---|---|---|
| ACE2 | 5.70 ± 0.15 | 0.99 ± 0.58 | 25.7 ± 0.09 | 20,933 ± 385 |
| ACE2–A9 | 2.85 ± 0.21 | 1.18 ± 0.58 | 25.5 ± 0.11 | 27,798 ± 334 |
| ACE2–A3 | 2.63 ± 0.13 | 1 ± 0.48 | 24.7 ± 0.9 | 26,697 ± 270 |
| ACE2–griseofulvin | 2.28 ± 0.12 | 1.12 ± 0.48 | 24.9 ± 0.11 | 26,532 ± 285 |
| Complex | Mean RMSD (Å) | Mean RMSF (Å) | Mean Rg (Å) | Mean SASA (Å) |
|---|---|---|---|---|
| RdRp | 2.9 ± 0.15 | 0.14 ± 0.06 | 32 ± 0.11 | 39,625 ± 380 |
| RdRp–Rd6 | 3.1 ± 0.19 | 0.14 ± 0.06 | 31.8 ± 0.1 | 39,078 ± 389 |
| RdRp–Rd2 | 3.34 ± 0.31 | 0.13 ± 0.05 | 31.9 ± 0.1 | 39,257 ± 318 |
| RdRp–griseofulvin | 3.1 ± 0.16 | 0.16 ± 0.07 | 32.2 ± 0.10 | 39,735 ± 381 |
| Complex | Mean RMSD (Å) | Mean RMSF (Å) | Mean Rg (Å) | Mean SASA (Å) |
|---|---|---|---|---|
| RBD | 3.47 ± 0.12 | 0.95 ± 0.48 | 17.5 ± 0.06 | 8785 ± 128 |
| RBD–Rb9 | 2.45 ± 0.18 | 1.2 ± 0.63 | 18.1 ± 0.07 | 10,514 ± 148 |
| RBD–Rb3 | 2.41 ± 0.14 | 1.2 ± 0.63 | 18.2 ± 0.08 | 10,582 ± 152 |
| RdRp–griseofulvin | 2.17 ± 0.19 | 1.04 ± 0.50 | 18.1 ± 0.08 | 10,554 ± 155 |
| Compound | Residue Interaction (H-Bond Occupancy (%)) |
|---|---|
| 6LU7-griseofulvin (M1) | Gln192 (17.2) Cys145 (43.4), Glu166 (6.1) |
| 6LU7-142550537 (M7) | Gln192 (77.2), Thr190 (70.2), Gln189 (10.1) |
| 6LU7-144564153 (M9) | Glu166 (76.8), His41 (3.8), His164 (15.1) |
| ACE2-griseofulvin (A7) | Trp69 (1.7), Ser106 (9.1), Asn117 (2.6), Lys114 (1.9) |
| ACE2-46844082 (A3) | Trp69 (2.2), Asn117 (24.2), Asn63 (1.15), Arg514 (10.2) |
| ACE2-132286359 (A9) | Trp69 (7.9), Asn51 (2.6), Asn53 (7.6), Gly104 (3.9) |
| RdRp-griseofulvin (Rd7) | Cys622 (37.2), Arg555 (17.2), Asp623(1.7) |
| RdRp-73331209 (Rd2) | Arg553 (2.3), Lys621 (2.1), Asp623 (9.1) |
| RdRp-118254151 (Rd6) | Arg553 (8.8), Lys621 (1.8), Asp623 (1.52) |
| RBD-griseofulvin (Rb1) | Asn360 (1.6), Cys391 (2.3), Phe486 (2.8), Ala522 (3.8) |
| RBD-56950846 (Rb3) | Thr430 (1.4), Lys458 (5.1), Ser459 (39.1), Ala522 (7.8) |
| RBD-125429633 (Rb9) | Asn460 (6.4), Arg466 (6.8), Asn354 (3.8), Ser349 (3.5) |
Publisher’s Note: MDPI stays neutral with regard to jurisdictional claims in published maps and institutional affiliations. |
© 2022 by the authors. Licensee MDPI, Basel, Switzerland. This article is an open access article distributed under the terms and conditions of the Creative Commons Attribution (CC BY) license (https://creativecommons.org/licenses/by/4.0/).
Share and Cite
Aris, P.; Mohamadzadeh, M.; Wei, Y.; Xia, X. In Silico Molecular Dynamics of Griseofulvin and Its Derivatives Revealed Potential Therapeutic Applications for COVID-19. Int. J. Mol. Sci. 2022, 23, 6889. https://doi.org/10.3390/ijms23136889
Aris P, Mohamadzadeh M, Wei Y, Xia X. In Silico Molecular Dynamics of Griseofulvin and Its Derivatives Revealed Potential Therapeutic Applications for COVID-19. International Journal of Molecular Sciences. 2022; 23(13):6889. https://doi.org/10.3390/ijms23136889
Chicago/Turabian StyleAris, Parisa, Masoud Mohamadzadeh, Yulong Wei, and Xuhua Xia. 2022. "In Silico Molecular Dynamics of Griseofulvin and Its Derivatives Revealed Potential Therapeutic Applications for COVID-19" International Journal of Molecular Sciences 23, no. 13: 6889. https://doi.org/10.3390/ijms23136889
APA StyleAris, P., Mohamadzadeh, M., Wei, Y., & Xia, X. (2022). In Silico Molecular Dynamics of Griseofulvin and Its Derivatives Revealed Potential Therapeutic Applications for COVID-19. International Journal of Molecular Sciences, 23(13), 6889. https://doi.org/10.3390/ijms23136889