
Establishing In-House Cutoffs of CSF Alzheimer’s Disease Biomarkers for the AT(N) Stratification of the Alzheimer Center Barcelona Cohort

 , , , add
Show full author list
, , , add
Show full author list
Abstract
:1. Introduction
2. Results
2.1. Cutoffs of CSF Biomarkers for Both Immunoassays
2.2. Comparison of Immunoassays
2.3. Concordance between Immunoassays
2.4. MCI Progression in AT(N) Categories
3. Discussion
4. Methods
4.1. Participants
MCI Longitudinal Cohort
4.2. CSF Sampling and Analysis
4.3. Ethical Considerations
4.3.1. Study 1: Determination of Cutoff for Both Immunoassays
4.3.2. Study 2: Comparison of Immunoassays
4.3.3. Study 3: Concordance between Immunoassays
4.3.4. Study 4: MCI Progression
4.4. Statistical Analysis
Supplementary Materials
Author Contributions
Funding
Institutional Review Board Statement
Informed Consent Statement
Data Availability Statement
Acknowledgments
Conflicts of Interest
References
- Blennow, K.; de Leon, M.J.; Zetterberg, H. Alzheimer’s disease. Lancet 2006, 368, 387–403. [Google Scholar] [CrossRef]
- Blennow, K.; Hampel, H.; Weiner, M.; Zetterberg, H. Cerebrospinal fluid and plasma biomarkers in Alzheimer disease. Nat. Rev. Neurol. 2010, 6, 131–144. [Google Scholar] [CrossRef] [PubMed]
- McKhann, G.M.; Knopman, D.S.; Chertkow, H.; Hyman, B.T.; Jack, C.R., Jr.; Kawas, C.H.; Klunk, W.E.; Koroshetz, W.J.; Manly, J.J.; Mayeux, R.; et al. The diagnosis of dementia due to Alzheimer’s disease: Recommendations from the National Institute on Aging-Alzheimer’s Association workgroups on diagnostic guidelines for Alzheimer’s disease. Alzheimer’s Dement. 2011, 7, 263–269. [Google Scholar] [CrossRef] [PubMed] [Green Version]
- Dubois, B.; Feldman, H.H.; Jacova, C.; Hampel, H.; Molinuevo, J.L.; Blennow, K.; DeKosky, S.T.; Gauthier, S.; Selkoe, D.; Bateman, R.; et al. Advancing research diagnostic criteria for Alzheimer’s disease: The IWG-2 criteria. Lancet Neurol. 2014, 13, 614–629. [Google Scholar] [CrossRef]
- Jack, C.R., Jr.; Bennett, D.A.; Blennow, K.; Carrillo, M.C.; Dunn, B.; Haeberlein, S.B.; Holtzman, D.M.; Jagust, W.; Jessen, F.; Karlawish, J.; et al. NIA-AA Research Framework: Toward a biological definition of Alzheimer’s disease. Alzheimer’s Dement. 2018, 14, 535–562. [Google Scholar] [CrossRef]
- Van Maurik, I.S.; Vos, S.J.; Bos, I.; Bouwman, F.H.; Teunissen, C.E.; Scheltens, P.; Barkhof, F.; Frolich, L.; Kornhuber, J.; Wiltfang, J.; et al. Biomarker-based prognosis for people with mild cognitive impairment (ABIDE): A modelling study. Lancet Neurol. 2019, 18, 1034–1044. [Google Scholar] [CrossRef]
- Lifke, V.; Kollmorgen, G.; Manuilova, E.; Oelschlaegel, T.; Hillringhaus, L.; Widmann, M.; von Arnim, C.A.F.; Otto, M.; Christenson, R.H.; Powers, J.L.; et al. Elecsys ® Total-Tau and Phospho-Tau (181P) CSF assays: Analytical performance of the novel, fully automated immunoassays for quantification of tau proteins in human cerebrospinal fluid. Clin. Biochem. 2019, 72, 30–38. [Google Scholar] [CrossRef]
- Vos, S.J.; Visser, P.J.; Verhey, F.; Aalten, P.; Knol, D.; Ramakers, I.; Scheltens, P.; Rikkert, M.G.; Verbeek, M.M.; Teunissen, C.E. Variability of CSF Alzheimer’s disease biomarkers: Implications for clinical practice. PLoS ONE 2014, 9, e100784. [Google Scholar]
- Vanderstichele, H.; Bibl, M.; Engelborghs, S.; Le Bastard, N.; Lewczuk, P.; Molinuevo, J.L.; Parnetti, L.; Perret-Liaudet, A.; Shaw, L.M.; Teunissen, C.; et al. Standardization of preanalytical aspects of cerebrospinal fluid biomarker testing for Alzheimer’s disease diagnosis: A consensus paper from the Alzheimer’s Biomarkers Standardization Initiative. Alzheimer’s Dement. 2012, 8, 65–73. [Google Scholar] [CrossRef]
- Del Campo, M.; Mollenhauer, B.; Bertolotto, A.; Engelborghs, S.; Hampel, H.; Simonsen, A.H.; Kapaki, E.; Kruse, N.; Le Bastard, N.; Lehmann, S.; et al. Recommendations to standardize preanalytical confounding factors in Alzheimer’s and Parkinson’s disease cerebrospinal fluid biomarkers: An update. Biomark. Med. 2012, 6, 419–430. [Google Scholar] [CrossRef]
- Hansson, O.; Batrla, R.; Brix, B.; Carrillo, M.C.; Corradini, V.; Edelmayer, R.M.; Esquivel, R.N.; Hall, C.; Lawson, J.; Bastard, N.L.; et al. The Alzheimer’s Association international guidelines for handling of cerebrospinal fluid for routine clinical measurements of amyloid β and tau. Alzheimer’s Dement. 2021, 17, 1575–1582. [Google Scholar] [CrossRef]
- Willemse, E.; van Maurik, I.S.; Tijms, B.M.; Bouwman, F.H.; Franke, A.; Hubeek, I.; Boelaarts, L.; Claus, J.J.; Korf, E.; van Marum, R.; et al. Diagnostic performance of Elecsys immunoassays for cerebrospinal fluid Alzheimer’s disease biomarkers in a nonacademic, multicenter memory clinic cohort: The ABIDE project. Alzheimer’s Dement. 2018, 10, 563–572. [Google Scholar] [CrossRef]
- Schindler, S.E.; Gray, J.D.; Gordon, B.A.; Xiong, C.; Batrla-Utermann, R.; Quan, M.; Wahl, S.; Benzinger, T.L.S.; Holtzman, D.M.; Morris, J.C.; et al. Cerebrospinal fluid biomarkers measured by Elecsys assays compared to amyloid imaging. Alzheimer’s Dement 2018, 14, 1460–1469. [Google Scholar] [CrossRef]
- Alcolea, D.; Pegueroles, J.; Muñoz, L.; Camacho, V.; López-Mora, D.; Fernández-León, A.; Le Bastard, N.; Huyck, E.; Nadal, A.; Olmedo, V.; et al. Agreement of amyloid PET and CSF biomarkers for Alzheimer’s disease on Lumipulse. Ann. Clin. Transl. Neurol. 2019, 6, 1815–1824. [Google Scholar] [CrossRef] [Green Version]
- Paciotti, S.; Sepe, F.N.; Eusebi, P.; Farotti, L.; Cataldi, S.; Gatticchi, L.; Parnetti, L. Diagnostic performance of a fully automated chemiluminescent enzyme immunoassay for Alzheimer’s disease diagnosis. Clin. Chim. Acta. 2019, 494, 74–78. [Google Scholar] [CrossRef]
- Espinosa, A.; Alegret, M.; Valero, S.; Vinyes-Junqué, G.; Hernández, I.; Mauleón, A.; Rosende-Roca, M.; Ruiz, A.; López, O.; Tárraga, L.; et al. longitudinal follow-up of 550 mild cognitive impairment patients: Evidence for large conversion to dementia rates and detection of major risk factors involved. J. Alzheimer’s Dis. 2013, 34, 769–780. [Google Scholar] [CrossRef] [Green Version]
- Bahar-Fuchs, A.; Villemagne, V.; Ong, K.; Chetélat, G.; Lamb, F.; Reininger, C.B.; Woodward, M.; Rowe, C.C. Prediction of amyloid-beta pathology in amnestic mild cognitive impairment with neuropsychological tests. J. Alzheimer’s Dis. 2013, 33, 451–462. [Google Scholar] [CrossRef]
- Lacour, A.; Espinosa, A.; Louwersheimer, E.; Heilmann, S.; Hernández, I.; Wolfsgruber, S.; Fernández, V.; Wagner, H.; Rosende-Roca, M.; Mauleón, A.; et al. Genome-wide significant risk factors for Alzheimer’s disease: Role in progression to dementia due to Alzheimer’s disease among subjects with mild cognitive impairment. Mol. Psychiatry 2016, 22, 153–160. [Google Scholar] [CrossRef] [Green Version]
- Zakharova, N.V.; Bugrova, A.E.; Kononikhin, A.S.; Indeykina, M.I.; Popov, I.A.; Nikolaev, E.N. Mass spectrometry analysis of the diversity of Aβ peptides: Difficulties and future perspectives for AD biomarker discovery. Expert Rev. Proteom. 2018, 15, 773–775. [Google Scholar] [CrossRef]
- Kummer, M.P.; Heneka, M.T. Truncated and modified amyloid-beta species. Alzheimer’s Res. Ther. 2014, 6, 28. [Google Scholar] [CrossRef] [Green Version]
- Zimmermann, R.; Lelental, N.; Ganslandt, O.; Maler, J.M.; Kornhuber, J.; Lewczuk, P. Preanalytical sample handling and sample stability testing for the neurochemical dementia diagnostics. J. Alzheimer’s Dis. 2011, 25, 739–745. [Google Scholar] [CrossRef] [PubMed]
- Hyman, B.T.; Phelps, C.H.; Beach, T.G.; Bigio, E.H.; Cairns, N.J.; Carrillo, M.C.; Dickson, D.W.; Duyckaerts, C.; Frosch, M.P.; Masliah, E.; et al. National Institute on Aging-Alzheimer’s Association guidelines for the neuropathologic assessment of Alzheimer’s disease. Alzheimer’s Dement. 2012, 8, 1–13. [Google Scholar] [CrossRef] [PubMed] [Green Version]
- Bartlett, J.W.; Frost, C.; Mattsson, N.; Skillbäck, T.; Blennow, K.; Zetterberg, H.; Schott, J.M. Determining cut-points for Alzheimer’s disease biomarkers: Statistical issues, methods and challenges. Biomark. Med. 2012, 6, 391–400. [Google Scholar] [CrossRef] [PubMed] [Green Version]
- Mattsson, N.; Zetterberg, H.; Hansson, O.; Andreasen, N.; Parnetti, L.; Jonsson, M.; Herukka, S.K.; van der Flier, W.M.; Blankenstein, M.A.; Ewers, M.; et al. CSF biomarkers and incipient Alzheimer disease in patients with mild cognitive impairment. JAMA 2009, 302, 385–393. [Google Scholar] [CrossRef]
- Leitão, M.J.; Silva-Spínola, A.; Santana, I.; Olmedo, V.; Nadal, A.; Le Bastard, N.; Baldeiras, I. Clinical validation of the Lumipulse G cerebrospinal fluid assays for routine diagnosis of Alzheimer’s disease. Alzheimer’s Res. Ther. 2009, 11, 91. [Google Scholar] [CrossRef] [Green Version]
- Bayart, J.L.; Hanseeuw, B.; Ivanoiu, A.; van Pesch, V. Analytical and clinical performances of the automated Lumipulse cerebrospinal fluid Aβ 42 and T-Tau assays for Alzheimer’s disease diagnosis. J. Neurol. 2019, 266, 2304–2311. [Google Scholar] [CrossRef]
- Adamczuk, K.; Schaeverbeke, J.; Vanderstichele, H.M.; Lilja, J.; Nelissen, N.; Van Laere, K.; Dupont, P.; Hilven, K.; Poesen, K.; Vandenberghe, R. Diagnostic value of cerebrospinal fluid Aβ ratios in preclinical Alzheimer’s disease. Alzheimer’s Res. Ther. 2015, 7, 75. [Google Scholar] [CrossRef] [Green Version]
- Janelidze, S.; Pannee, J.; Mikulskis, A.; Chiao, P.; Zetterberg, H.; Blennow, K.; Hansson, O. Concordance Between Different Amyloid Immunoassays and Visual Amyloid Positron Emission Tomographic Assessment. JAMA Neurol. 2017, 74, 1492–1501. [Google Scholar] [CrossRef]
- Hansson, O.; Seibyl, J.; Stomrud, E.; Zetterberg, H.; Trojanowski, J.Q.; Bittner, T.; Lifke, V.; Corradini, V.; Eichenlaub, U.; Batrla, R.; et al. CSF biomarkers of Alzheimer’s disease concord with amyloid-β PET and predict clinical progression: A study of fully automated immunoassays in BioFINDER and ADNI cohorts. Alzheimer’s Dement. 2018, 14, 1470–1481. [Google Scholar] [CrossRef]
- Moon, S.; Kim, S.; Mankhong, S.; Choi, S.H.; Vandijck, M.; Kostanjevecki, V.; Jeong, J.H.; Yoon, S.J.; Park, K.W.; Kim, E.J.; et al. Alzheimer’s cerebrospinal biomarkers from Lumipulse fully automated immunoassay: Concordance with amyloid-beta PET and manual immunoassay in Koreans: CSF AD biomarkers measured by Lumipulse in Koreans. Alzheimer’s Res. Ther. 2021, 13, 22. [Google Scholar] [CrossRef]
- Van Maurik, I.S.; Zwan, M.D.; Tijms, B.M.; Bouwman, F.H.; Teunissen, C.E.; Scheltens, P.; Wattjes, M.P.; Barkhof, F.; Berkhof, J.; van der Flier, W.M.; et al. Interpreting Biomarker Results in Individual Patients With Mild Cognitive Impairment in the Alzheimer’s Biomarkers in Daily Practice (ABIDE) Project. JAMA Neurol. 2017, 74, 1481–1491. [Google Scholar] [CrossRef]
- Boada, M.; Tárraga, L.; Hernández, I.; Valero, S.; Alegret, M.; Ruiz, A.; Lopez, O.L.; Becker, J.T.; Fundació ACE Alzheimer Research Center and Memory Clinic. Design of a comprehensive Alzheimer’s disease clinic and research center in Spain to meet critical patient and family needs. Alzheimer’s Dement. 2014, 10, 409–415. [Google Scholar] [CrossRef] [Green Version]
- Rodriguez-Gomez, O.; Sanabria, A.; Perez-Cordon, A.; Sanchez-Ruiz, D.; Abdelnour, C.; Valero, S.; Hernandez, I.; Rosende-Roca, M.; Mauleon, A.; Vargas, L.; et al. FACEHBI: A Prospective Study of Risk Factors, Biomarkers and Cognition in a Cohort of Individuals with Subjective Cognitive Decline. Study Rationale and Research Protocols. J. Prev. Alzheimer’s Dis. 2017, 4, 100–108. [Google Scholar] [CrossRef]
- Esteban de Antonio, E.; Pérez-Cordón, A.; Gil, S.; Orellana, A.; Cano, A.; Alegret, M.; Espinosa, A.; Alarcón-Martín, E.; Valero, S.; Martínez, J.; et al. BIOFACE: A Prospective Study of Risk Factors, Cognition, and Biomarkers in a Cohort of Individuals with Early-Onset Mild Cognitive Impairment. Study Rationale and Research Protocols. J. Alzheimer’s Dis. 2021, 83, 1233–1249. [Google Scholar] [CrossRef]
- Folstein, M.F.; Folstein, S.E.; McHugh, P.R. Mini-mental state’. A practical method for grading the cognitive state of patients for the clinician. J. Psychiatr. Res. 1975, 12, 189–198. [Google Scholar] [CrossRef]
- Blesa, R.; Pujol, M.; Aguilar, M.; Santacruz, P.; Bertran-Serra, I.; Hernández, G.; Sol, J.M.; Peña-Casanova, J.; NORMACODEM Group. NORMAlisation of Cognitive and Functional Instruments for DEMentia. Clinical validity of the ‘mini-mental state’ for Spanish speaking communities. Neuropsychologia 2001, 39, 1150–1157. [Google Scholar] [CrossRef]
- Del Ser Quijano, T.; Sánchez Sánchez, F.; Garcia De Yébenes, M.J.; Otero Puime, Á.; Zunzunegui, M.V.; Muñoz, D.G. Spanish version of the 7 Minute screening neurocognitive battery. Normative data of an elderly population sample over 70. Neurologia 2004, 19, 344–358. [Google Scholar]
- Boada, M.; Tárraga, L.; Modinos, G.; López, O.L.; Cummings, J.L. Neuropsychiatric Inventory-Nursing Home version (NPI-NH): Spanish validation. Neurologia 2005, 20, 665–673. [Google Scholar]
- Hachinski, V.C.; Lassen, N.A.; Marshall, J. Multi-infarct dementia. A cause of mental deterioration in the elderly. Lancet 1974, 2, 207–209. [Google Scholar] [CrossRef]
- Blessed, G.; Tomlinson, B.E.; Roth, M. The association between quantitative measures of dementia and of senile change in the cerebral grey matter of elderly subjects. Br. J. Psychiatry 1968, 114, 797–811. [Google Scholar] [CrossRef]
- Morris, J.C. The Clinical Dementia Rating (CDR): Current version and scoring rules. Neurology 1993, 43, 2412–2414. [Google Scholar] [CrossRef]
- Alegret, M.; Espinosa, A.; Valero, S.; Vinyes-Junqué, G.; Ruiz, A.; Hernández, I.; Rosende-Roca, M.; Mauleón, A.; Becker, J.T.; Tárraga, L.; et al. Cut-off scores of a brief neuropsychological battery (NBACE) for Spanish individual adults older than 44 years old. PLoS ONE 2013, 8, e76436. [Google Scholar] [CrossRef] [Green Version]
- DSM-5. Available online: https://www.psychiatry.org/psychiatrists/practice/dsm (accessed on 2 March 2022).
- Jessen, F.; Amariglio, R.E.; van Boxtel, M.; Breteler, M.; Ceccaldi, M.; Chételat, G.; Dubois, B.; Dufouil, C.; Ellis, K.A.; van der Flier, W.M.; et al. A conceptual framework for research on subjective cognitive decline in preclinical Alzheimer’s disease. Alzheimer’s Dement. 2014, 10, 844–852. [Google Scholar] [CrossRef] [Green Version]
- Román, G.C.; Tatemichi, T.K.; Erkinjuntti, T.; Cummings, J.L.; Masdeu, J.C.; Garcia, J.H.; Amaducci, L.; Orgogozo, J.M.; Brun, A.; Hofman, A.; et al. Vascular dementia: Diagnostic criteria for research studies. Report of the NINDS-AIREN International Workshop. Neurology 1993, 43, 250–260. [Google Scholar] [CrossRef]
- Neary, D.; Snowden, J.S.; Gustafson, L.; Passant, U.; Stuss, D.; Black, S.; Freedman, M.; Kertesz, A.; Robert, P.H.; Albert, M.; et al. Frontotemporal lobar degeneration: A consensus on clinical diagnostic criteria. Neurology 1998, 51, 1546–1554. [Google Scholar] [CrossRef] [Green Version]
- McKeith, I.G.; Boeve, B.F.; Dickson, D.W.; Halliday, G.; Taylor, J.P.; Weintraub, D.; Aarsland, D.; Galvin, J.; Attems, J.; Ballard, C.G.; et al. Diagnosis and management of dementia with Lewy bodies: Fourth consensus report of the DLB Consortium. Neurology 2017, 89, 88–100. [Google Scholar] [CrossRef] [Green Version]
- Petersen, R.C. Mild cognitive impairment as a diagnostic entity. J. Intern. Med. 2004, 256, 183–194. [Google Scholar] [CrossRef]
- Petersen, R.C.; Smith, G.E.; Waring, S.C.; Ivnik, R.J.; Tangalos, E.G.; Kokme, E. Mild cognitive impairment: Clinical characterization and outcome. Arch. Neurol. 1999, 56, 303–308. [Google Scholar] [CrossRef]
- Moreno-Grau, S.; de Rojas, I.; Hernández, I.; Quintela, I.; Montrreal, L.; Alegret, M.; Hernández-Olasagarre, B.; Madrid, L.; González-Perez, A.; Maroñas, O.; et al. Genome-wide association analysis of dementia and its clinical endophenotypes reveal novel loci associated with Alzheimer’s disease and three causality networks: The GR@ACE project. Alzheimer’s Dement. 2019, 15, 1333–1347. [Google Scholar] [CrossRef]
- De Rojas, I.; Moreno-Grau, S.; Tesi, N.; Grenier-Boley, B.; Andrade, V.; Jansen, I.E.; Pedersen, N.L.; Stringa, N.; Zettergren, A.; Hernández, I.; et al. Common variants in Alzheimer’s disease and risk stratification by polygenic risk scores. Nat. Commun. 2021, 12, 3417. [Google Scholar] [CrossRef]
- Mattsson, N.; Andreasson, U.; Persson, S.; Arai, H.; Batish, S.D.; Bernardini, S.; Bocchio-Chiavetto, L.; Blankenstein, M.A.; Carrillo, M.C.; Chalbot, S.; et al. The Alzheimer’s Association external quality control program for cerebrospinal fluid biomarkers. Alzheimer’s Dement. 2011, 7, 386–395. [Google Scholar] [CrossRef] [PubMed] [Green Version]


| SCD | AD | Chi/T/UTest | p-Value | |
|---|---|---|---|---|
| n (%) | 45 (55%) | 37 (45%) | ||
| Age, years | 65.6 ± 5.7 | 74.3 ± 8.4 | 5.35 | <0.0001 |
| Gender, Female/Male (% Female) | 26/19 (58%) | 29/8 (78%) | 3.03 | 0.082 |
| APOEε4 a +/− (%+) | 7/38 (16%) | 16/21 (43%) | 6.40 | 0.011 |
| MMSE b score | 29.6 ± 0.7 | 20.7 ± 4.9 | 11.04 | <0.0001 |
| Education, years (n = 79) | 13.0 ± 3.3 | 7.7 ± 4.0 | 6.41 | <0.0001 |
| CSF biomarkers, ELISA | ||||
| Aβ1-42, pg/mL | 1053 + 261 | 527 ± 112 | 36.00 | <0.0001 |
| Aβ1-40, pg/mL (n = 72) | 11567 ± 3462 | 12216 ± 3566 | 578.00 | 0.443 |
| t-Tau, pg/mL | 237 ± 79 | 726 ± 421 | 92.00 | <0.0001 |
| P181Tau, pg/mL | 44 ± 12 | 100 ± 49 | 137.00 | <0.0001 |
| Aβ1-42/Aβ1-40 (n = 72) | 0.096 ± 0.023 | 0.045 ± 0.012 | 32.00 | <0.0001 |
| Aβ1-42/t-Tau | 4.93 ± 1.56 | 0.93 ± 0.49 | 5.00 | <0.0001 |
| Aβ1-42/p181Tau | 25.50 ± 6.87 | 6.23 ± 2.5 | 4.00 | <0.0001 |
| t-Tau/Aβ1-42 | 0.042 ± 0.015 | 0.1913 ± 0.091 | 5.00 | <0.0001 |
| P181Tau/Aβ1-42 | 0.2248 ± 0.098 | 1.3938 ± 0.778 | 4.00 | <0.0001 |
| CSF biomarkers, CLEIA | ||||
| Aβ1-42, pg/mL | 1171 ± 395 | 568 ± 179 | 121.00 | <0.0001 |
| Aβ1-40, pg/mL (n = 80) | 13093 ± 3654 | 14576 ± 4207 | 633.00 | 0.117 |
| t-Tau, pg/mL | 300 ± 91 | 825 ± 431 | 80.50 | <0.0001 |
| P181Tau, pg/mL (n = 80) | 40 ± 11 | 145 ± 87 | 48.00 | <0.0001 |
| Aβ1-42/Aβ1-40 (n = 80) | 0.088 ± 0.014 | 0.039 ± 0.008 | 11.00 | <0.0001 |
| Aβ1-42/t-Tau (n = 82) | 4.13 ± 1.36 | 0.81 ± 0.42 | 10.00 | <0.0001 |
| Aβ1-42/p181Tau (n = 80) | 29.6 ± 8.1 | 4.9 ± 3.0 | 6.00 | <0.0001 |
| t-Tau/Aβ1-42 (n = 82) | 0.27 ± 0.12 | 1.48 ± 0.6 | 10.00 | <0.0001 |
| P181Tau/Aβ1-42 (n = 80) | 0.04 ± 0.01 | 0.25 ± 0.13 | 6.00 | <0.0001 |
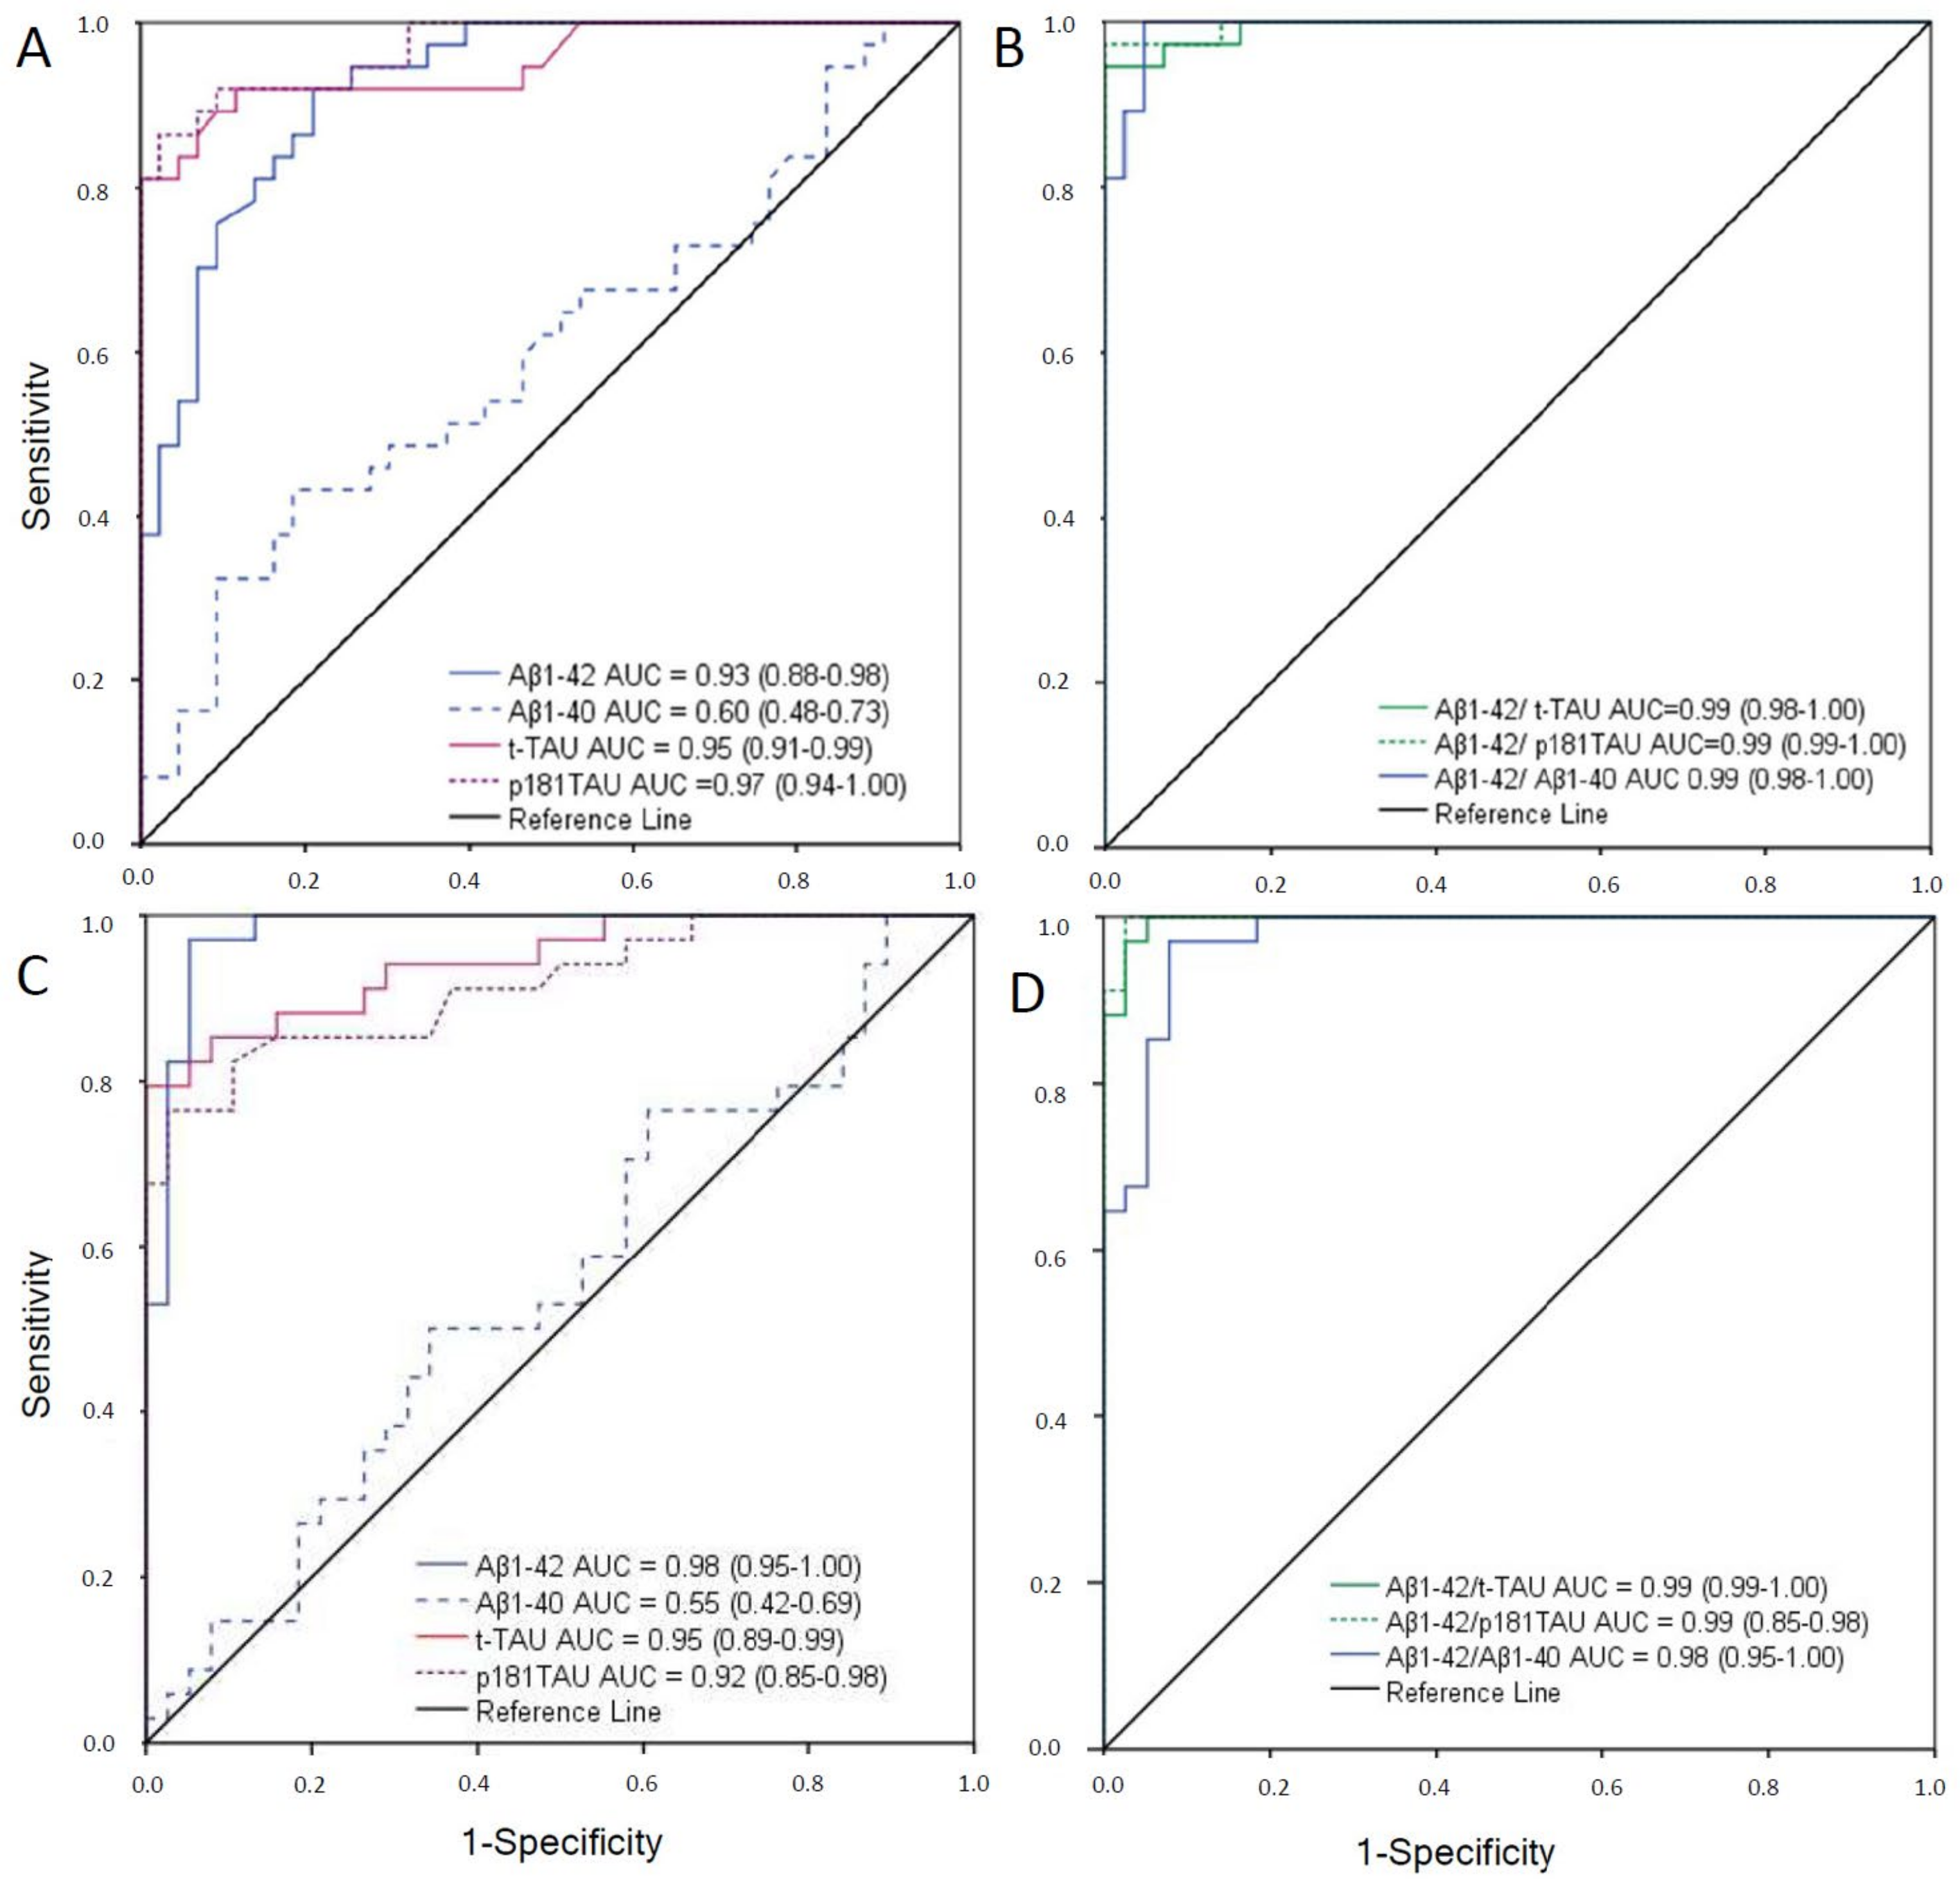
| Immunoassay | AUC c (95%IC) | Cutoff d | Youden J Index | Sensitivity | Specificity |
|---|---|---|---|---|---|
| Innotest ELISAe | |||||
| Aβ1-42 | 0.98 (0.95–1.00) | <676 | 0.90 | 95 | 96 |
| Aβ1-40 (n = 72) | 0.55 (0.42–0.69) | <10,530 | 0.16 | 77 | 40 |
| t-Tau | 0.95 (0.89–0.99) | >367 | 0.80 | 87 | 93 |
| p181Tau | 0.92 (0.85–0.98) | >58 | 0.72 | 81 | 91 |
| Aβ1-42/Aβ1-40(n = 72) | 0.98 (0.95–1.00) | <0.069 | 0.89 | 97 | 92 |
| Aβ1-42/t-Tau | 0.99 (0.99–1.00) | <2.13 | 0.95 | 97 | 98 |
| Aβ1-42/p181Tau | 0.99 (0.99–1.00) | <13.73 | 0.98 | 100 | 98 |
| Lumipulse CLEIAf | |||||
| Aβ1-42 | 0.93 (0.88–0.98) | <796 | 0.72 | 92 | 80 |
| Aβ1-40 (n = 80) | 0.60 (0.48–0.73) | <15,158 | 0.18 | 49 | 60 |
| t-Tau | 0.95 (0.91–0.99) | >412 | 0.81 | 92 | 89 |
| p181Tau (n = 80) | 0.97 (0.94–1.00) | >54 | 0.83 | 92 | 91 |
| Aβ1-42/Aβ1-40 (n = 80) | 0.99 (0.98–1.00) | <0.063 | 0.95 | 100 | 95 |
| Aβ1-42/t-Tau | 0.99 (0.98–1.00) | <1.37 | 0.95 | 95 | 100 |
| Aβ1-42/p181Tau | 0.99 (0.99–1.00) | <11.55 | 0.97 | 97 | 100 |
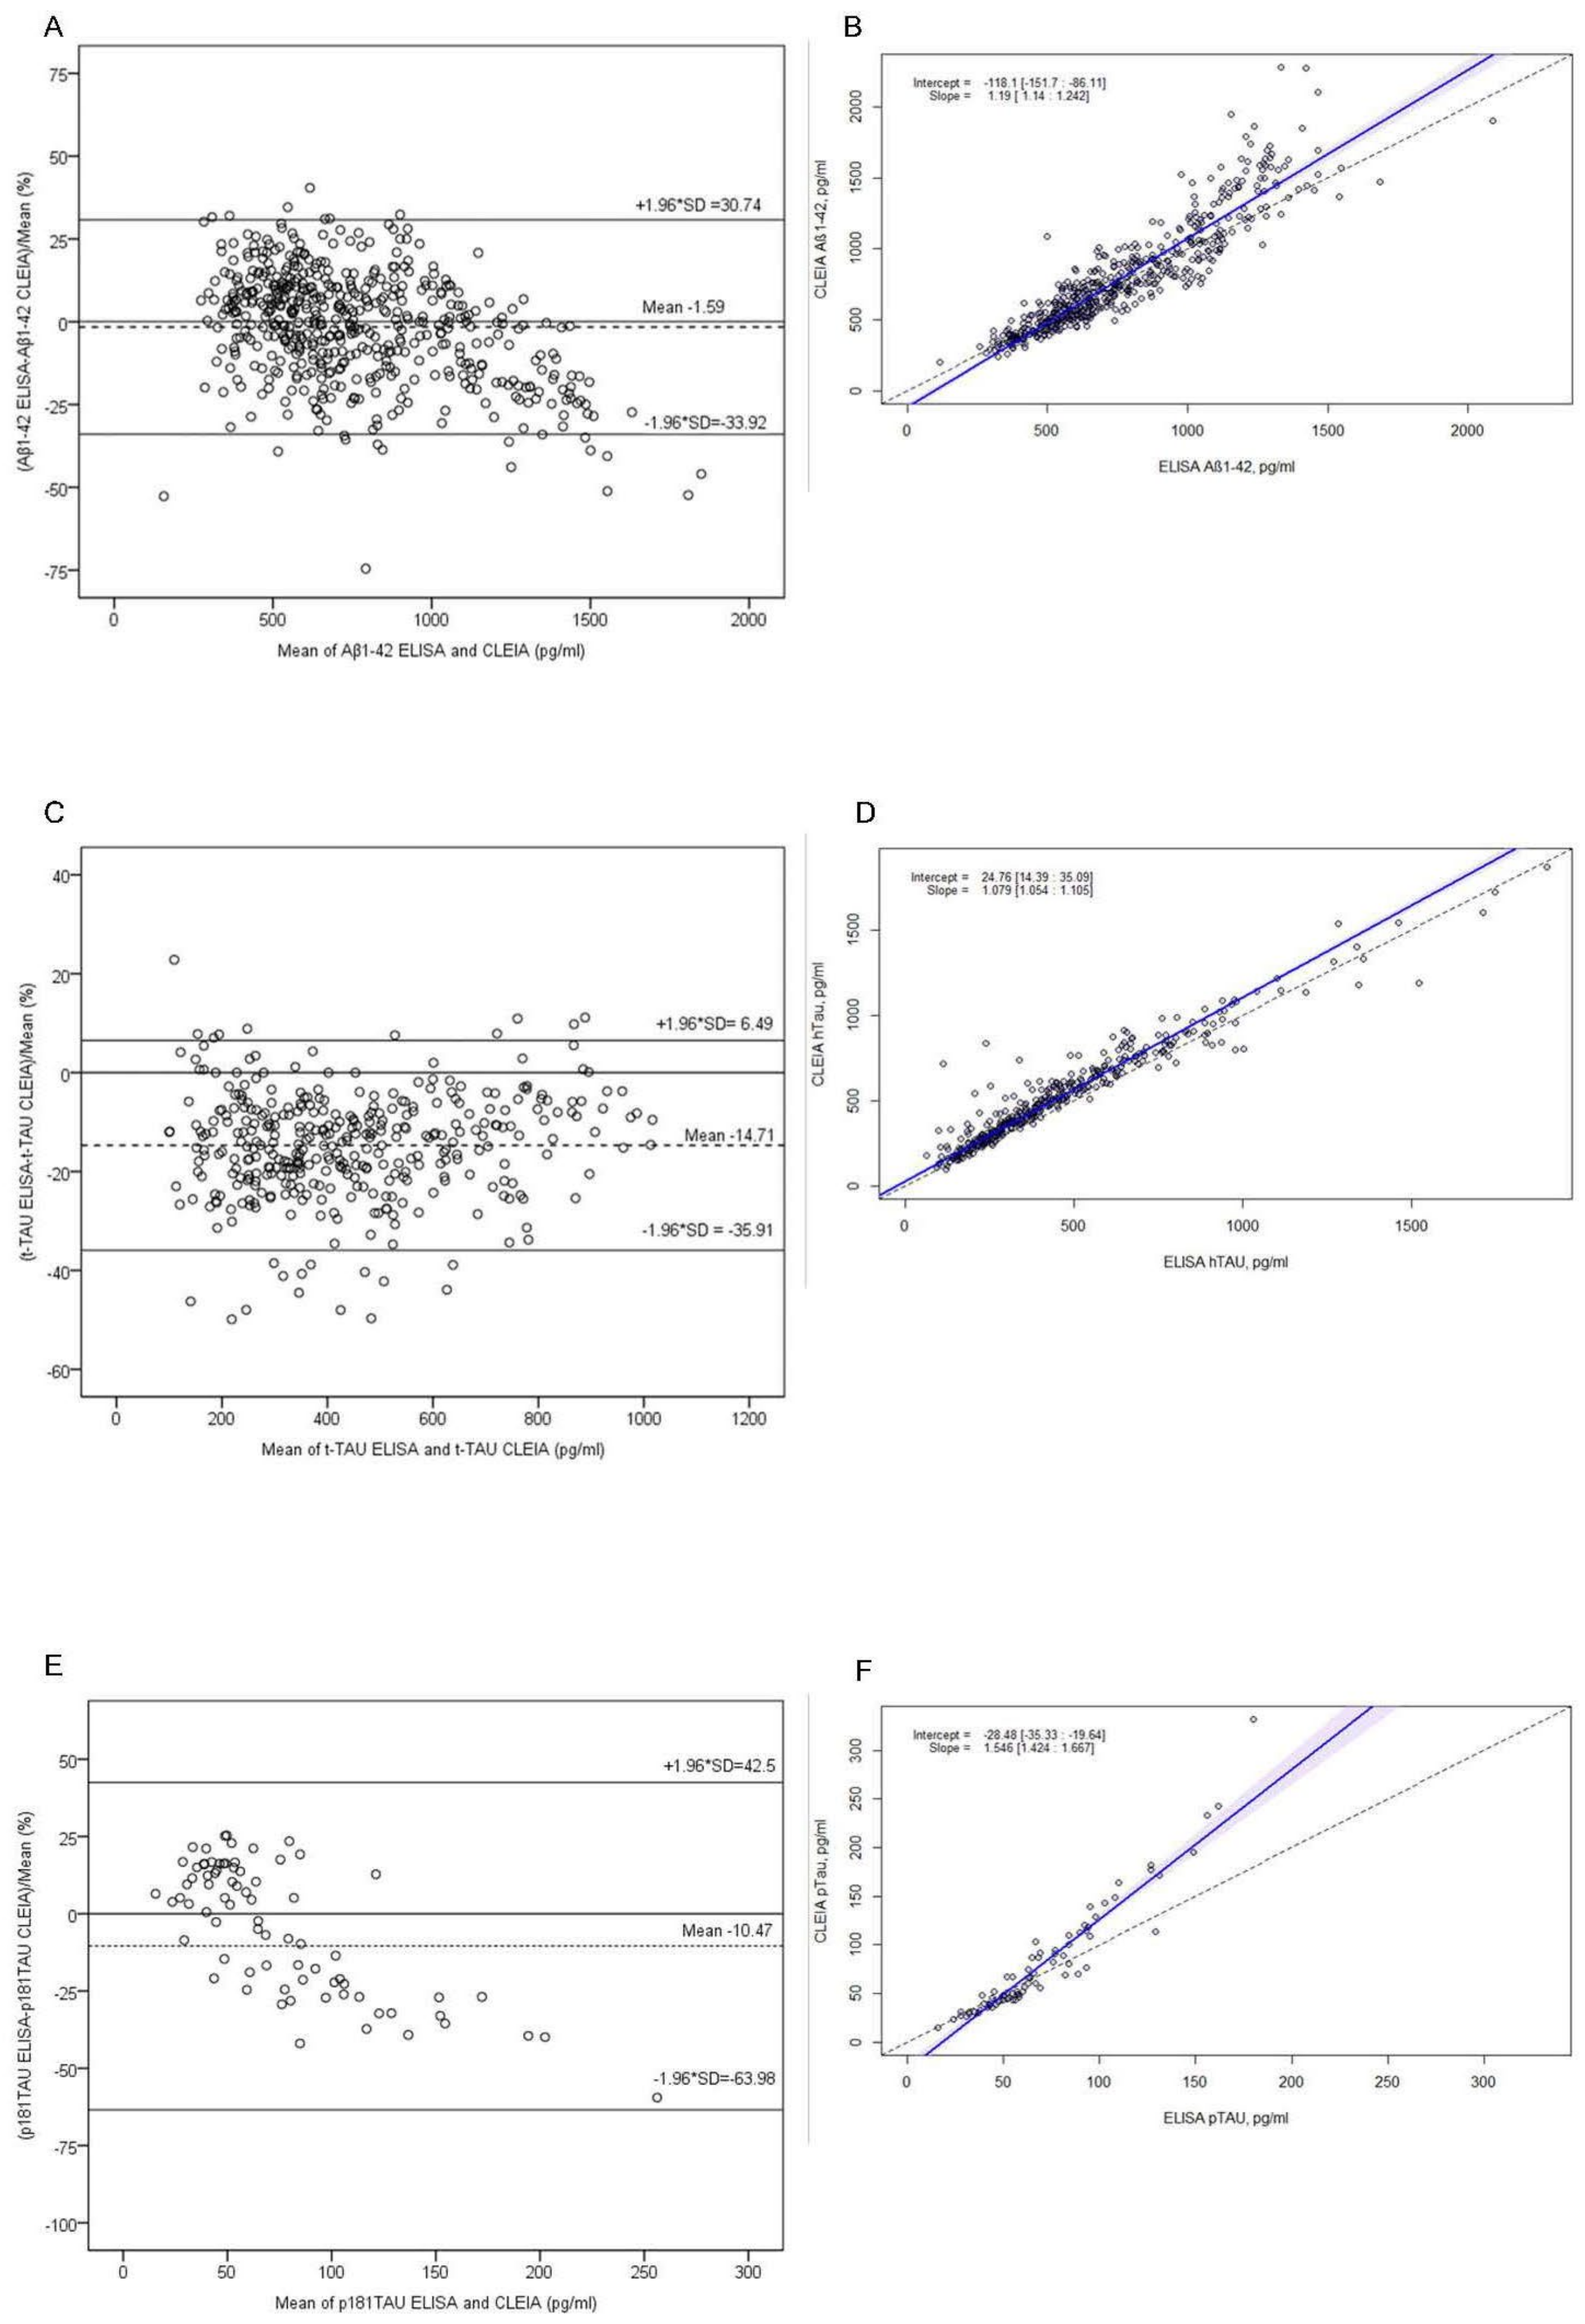
| ELISA | CLEIA | Kappa | CI 95% | Agreement (%) | |
|---|---|---|---|---|---|
| Negative | Positive | ||||
| Aβ42 | |||||
| Negative | 32 | 7 | 0.796 | 0.656–0.936 | 90 |
| Positive | 0 | 29 | |||
| t-Tau | |||||
| Negative | 33 | 6 | 0.824 | 0.693–0.955 | 91 |
| Positive | 0 | 29 | |||
| p181Tau | |||||
| Negative | 33 | 2 | 0.882 | 0.770–0.999 | 94 |
| Positive | 2 | 31 | |||
| Aβ42/Aβ40 | |||||
| Negative | 25 | 0 | 0.629 | 0.461–0.79 | 81 |
| Positive | 13 | 30 | |||
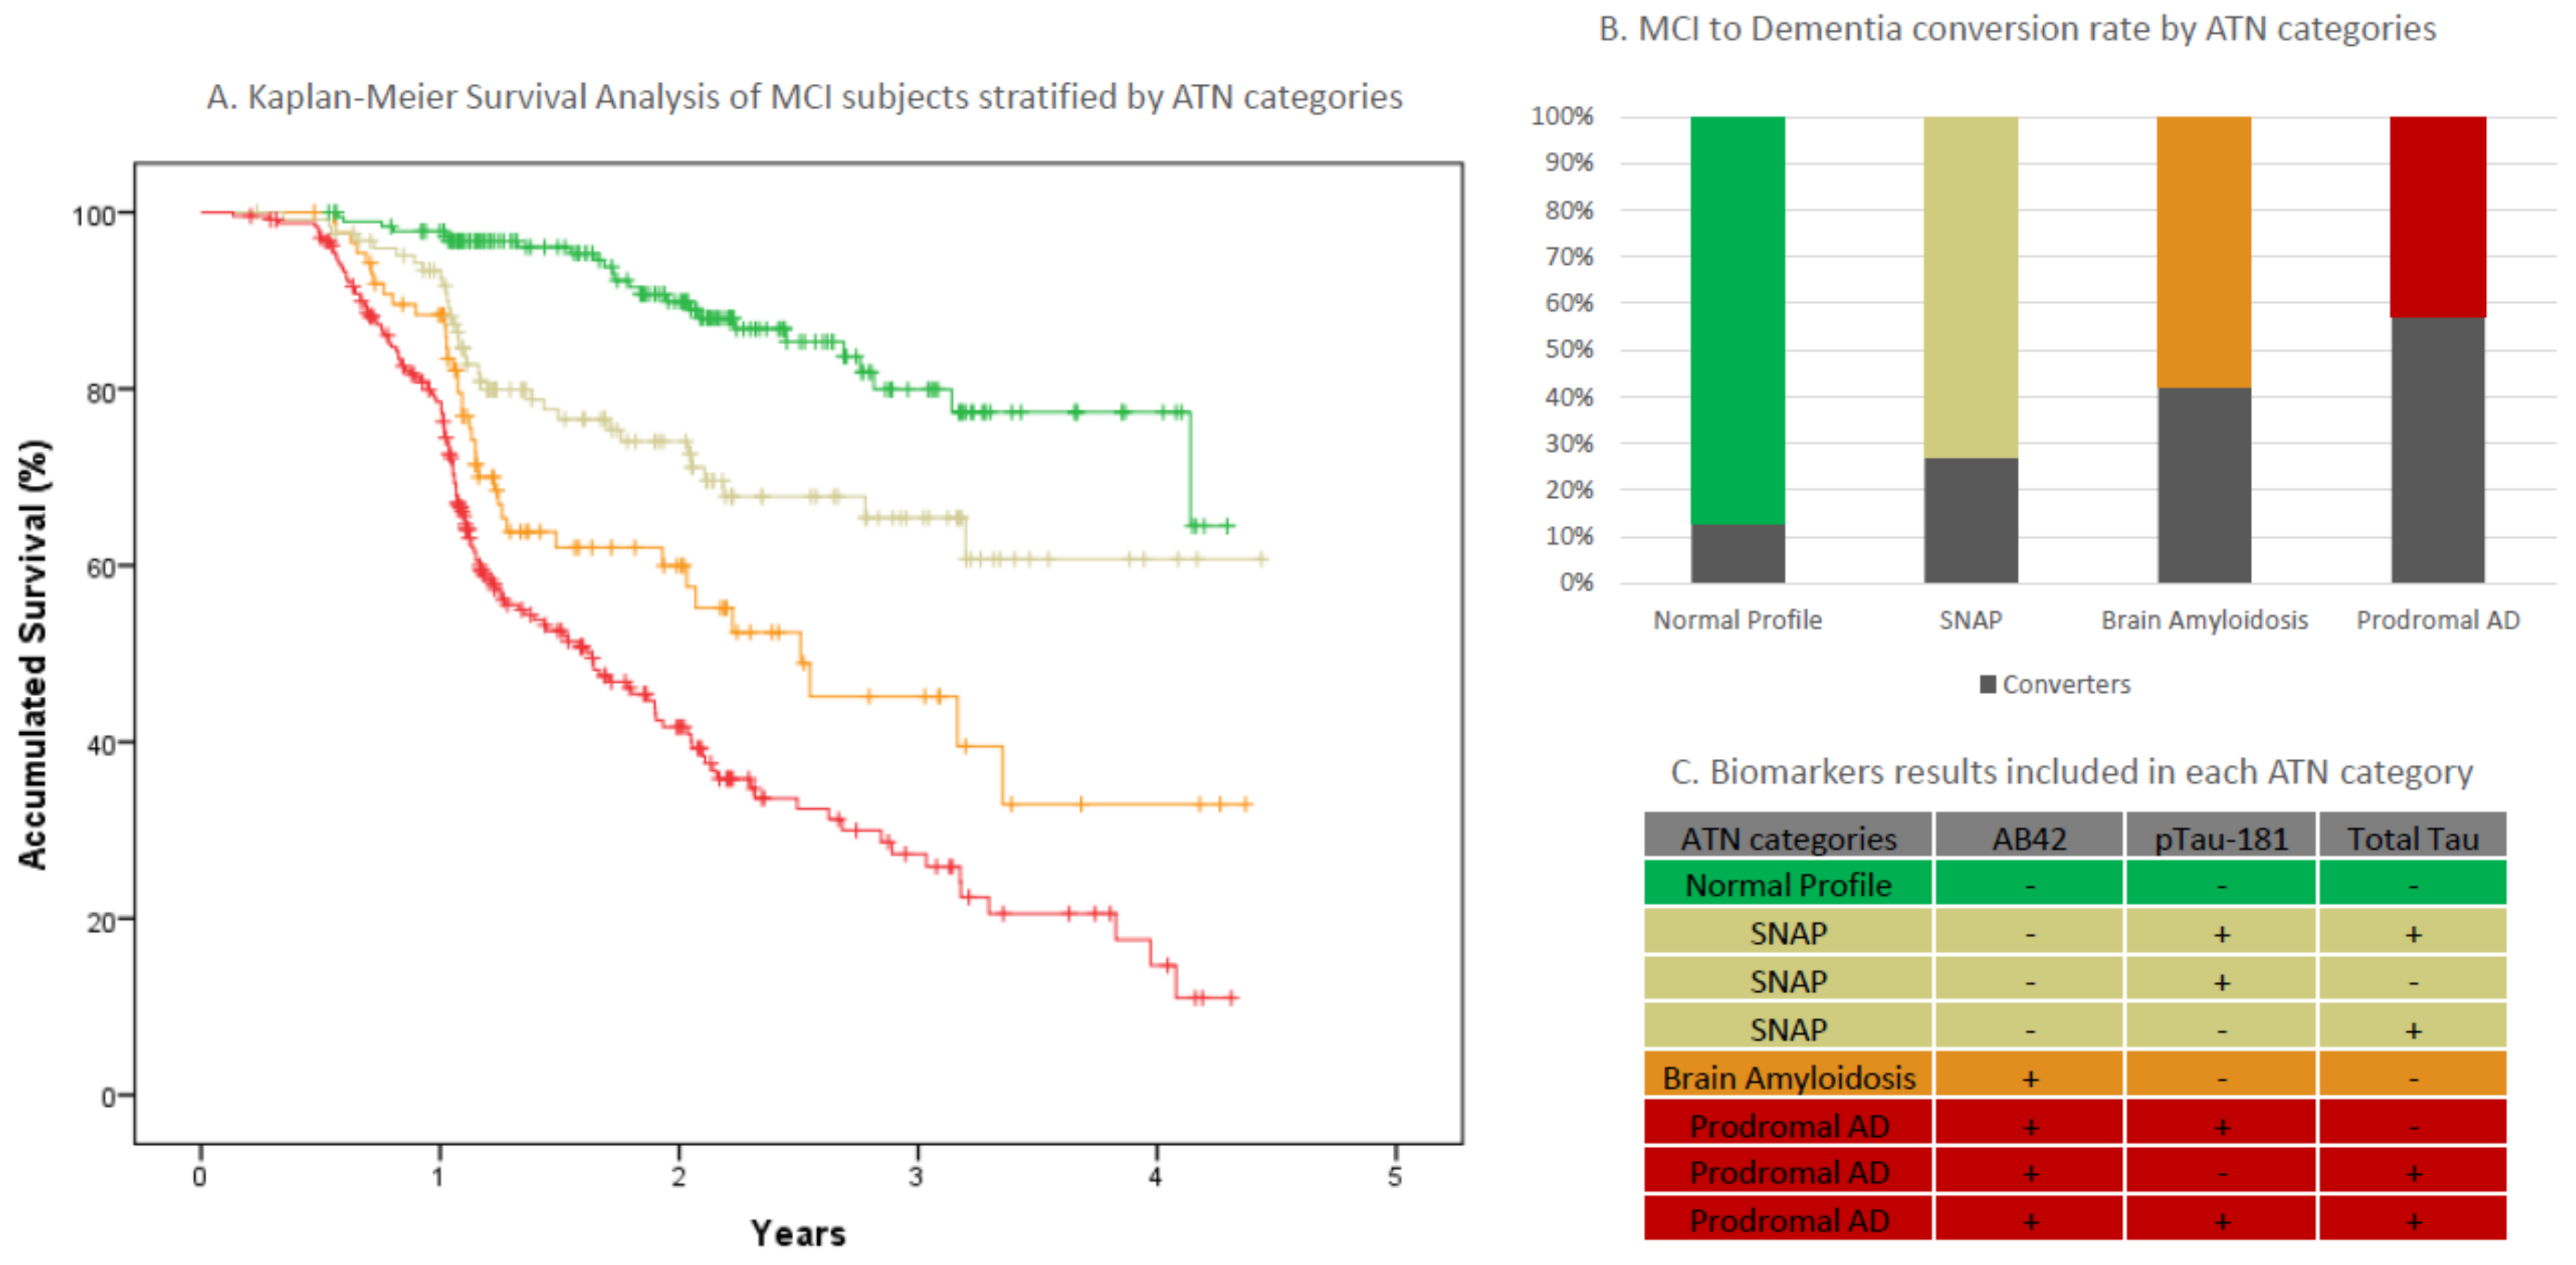
| All MCIs | A-T-N- Normal | A+T-N- Amyloidosis | A-(TN)+ SNAPS | A+(TN)+ Prodromal AD | |
|---|---|---|---|---|---|
| n (%) | 647 | 190 (29.4) | 88 (13.6) | 125 (19.3) | 244 (37.7) |
| Age, years (sd) | 72.8 (7.78) | 69.3 (9) | 72.4(7.6) | 73.8(7.1) | 75.1(6.1) |
| Sex, (n, % Female) | 347 (53.6) | 98 (51.6) | 42 (47.7) | 68 (54.4) | 129 (57) |
| APOEε4 carriers (%+) * | 32.7% | 12.7% | 33% | 26.8% | 53% |
| Mean baseline MMSE score (sd) | 25.55 (3.2) | 26.3 (3.1) | 25.5 (3) | 25.8 (3.4) | 24.9 (3.3) |
| Education mean years (s) | 8.1 (4.8) | 8.3 (4.2) | 8 (6.9) | 7.8 (4.6) | 8.1 (4.3) |
| Follow-up time mean years (sd) | 1.75 (0.9) | 2.11 (0.9) | 1.64 (0.9) | 1.86 (0.9) | 1.44 (0.9) |
| Dementia conversion rate n (%) | 234 (36.2) | 24 (12.6) | 37 (42) | 34 (27.2) | 139 (57) |
| Non-AD conversions n (%) ** | 39 (16.7) | 15 (62.5) | 9 (24.3) | 11 (32.4) | 4 (2.9) |
| ELISA/CLEIA/na (n) | 346/293/8 | 114/70/6 | 44/44/0 | 74/50/1 | 114/129/1 |
| NPS clinical categories (n) *** | 107/25/283/223/9 | 49/7/98/33/3 | 15/3/42/27/1 | 25/3/52/42/3 | 18/12/91/121/2 |
| Cases |
|---|
| Inclusion criteria |
|
| Exclusion criteria |
|
| Controls |
| Inclusion criteria |
|
| Exclusion criteria |
|
Publisher’s Note: MDPI stays neutral with regard to jurisdictional claims in published maps and institutional affiliations. |
© 2022 by the authors. Licensee MDPI, Basel, Switzerland. This article is an open access article distributed under the terms and conditions of the Creative Commons Attribution (CC BY) license (https://creativecommons.org/licenses/by/4.0/).
Share and Cite
Orellana, A.; García-González, P.; Valero, S.; Montrreal, L.; de Rojas, I.; Hernández, I.; Rosende-Roca, M.; Vargas, L.; Tartari, J.P.; Esteban-De Antonio, E.; et al. Establishing In-House Cutoffs of CSF Alzheimer’s Disease Biomarkers for the AT(N) Stratification of the Alzheimer Center Barcelona Cohort. Int. J. Mol. Sci. 2022, 23, 6891. https://doi.org/10.3390/ijms23136891
Orellana A, García-González P, Valero S, Montrreal L, de Rojas I, Hernández I, Rosende-Roca M, Vargas L, Tartari JP, Esteban-De Antonio E, et al. Establishing In-House Cutoffs of CSF Alzheimer’s Disease Biomarkers for the AT(N) Stratification of the Alzheimer Center Barcelona Cohort. International Journal of Molecular Sciences. 2022; 23(13):6891. https://doi.org/10.3390/ijms23136891
Chicago/Turabian StyleOrellana, Adelina, Pablo García-González, Sergi Valero, Laura Montrreal, Itziar de Rojas, Isabel Hernández, Maitee Rosende-Roca, Liliana Vargas, Juan Pablo Tartari, Ester Esteban-De Antonio, and et al. 2022. "Establishing In-House Cutoffs of CSF Alzheimer’s Disease Biomarkers for the AT(N) Stratification of the Alzheimer Center Barcelona Cohort" International Journal of Molecular Sciences 23, no. 13: 6891. https://doi.org/10.3390/ijms23136891
APA StyleOrellana, A., García-González, P., Valero, S., Montrreal, L., de Rojas, I., Hernández, I., Rosende-Roca, M., Vargas, L., Tartari, J. P., Esteban-De Antonio, E., Bojaryn, U., Narvaiza, L., Alarcón-Martín, E., Alegret, M., Alcolea, D., Lleó, A., Tárraga, L., Pytel, V., Cano, A., ... Ruiz, A. (2022). Establishing In-House Cutoffs of CSF Alzheimer’s Disease Biomarkers for the AT(N) Stratification of the Alzheimer Center Barcelona Cohort. International Journal of Molecular Sciences, 23(13), 6891. https://doi.org/10.3390/ijms23136891