Article

Genome-Wide Identification and Characterization of the Trehalose-6-phosphate Synthetase (TPS) Gene Family in Watermelon (Citrullus lanatus) and Their Transcriptional Responses to Salt Stress

Zhengzhou Fruit Research Institute of the Chinese Academy of Agricultural Sciences, Zhengzhou 450000, China
*
Authors to whom correspondence should be addressed.
Int. J. Mol. Sci. 2022, 23(1), 276; https://doi.org/10.3390/ijms23010276
Submission received: 22 November 2021 / Revised: 24 December 2021 / Accepted: 25 December 2021 / Published: 28 December 2021
(This article belongs to the Special Issue Mapping Abiotic Stress-Tolerance Genes in Plants 2021)

Abstract

:
With the increase in watermelon cultivation area, there is an urgent need to explore enzymatic and genetic resources for the sustainable development of watermelon, especially under salt stress. Among the various compounds known, trehalose plays an important role in regulating abiotic stress tolerances in diverse organisms, including plants. Therefore, the present study comprehensively analyzed the trehalose-6-phosphate synthase (TPS) gene family in watermelon. The study analyzed the functional classification, evolutionary characteristics, and expression patterns of the watermelon TPS genes family. Seven ClTPSs were identified and classified into two distinct classes according to gene structure and phylogeny. Evolutionary analysis suggested the role of purifying selection in the evolution of the TPS family members. Further, cis-acting elements related to plant hormones and abiotic stress were identified in the promoter region of the TPS genes. The tissue-specific expression analysis showed that ClTPS genes were widely expressed in roots, stems, leaves, flowers, and fruits, while ClTPS3 was significantly induced under salt stress. The overexpression of ClTPS3 in Arabidopsis thaliana significantly improved salt tolerance. Finally, the STRING functional protein association networks suggested that the transcription factor ClMYB and ClbHLH regulate ClTPS3. Thus, the study indicates the critical role of ClTPS3 in watermelon response to salt stress.

1. Introduction

Trehalose (α-d-glucopyranosyl-1, 1-α-d-glucopyranoside) is a non-reducing disaccharide consisting of two glucose molecules linked by α, α, 1, 1-glycosidic bonds [1]. It has a symmetrical structure, with two glucose molecules having symmetry more stable than maltose, sucrose, glucose, and other sugars of small molecules [2,3]. Therefore, the physical and chemical properties of trehalose are different from its analogs, making it an important component in keeping cells alive. Trehalose is known as a living substance, which exists in all living organisms and plays a major role in plant growth and development [4,5]. In recent years, trehalose has attracted extensive attention as a potential signal metabolite and a cell stabilizer of plants. Cells exposed to high temperature, freezing temperature, radiation, drought, high osmotic pressure, high salinity, and other adverse environmental conditions synthesize trehalose in large quantities, which plays an important role in maintaining osmotic pressure, protecting membrane structure, and participating in the signal transduction process. Subsequently, once the crisis is resolved, trehalose decomposes rapidly to substances that act as energy sources [2].
Trehalose in plants was first identified in Selaginella lepidophylla (Hook. and Grev.) Spring almost 100 years ago. A previous study found that high trehalose levels in Selaginella helped it to survive under an extreme drought environment [3]. However, in Arabidopsis thaliana and other drought-resistant species, only a small amount of trehalose was detected despite the existence of multiple genes encoding trehalose, which may be related to the co-involvement of its precursor trehalose-6-phosphate (T6P) in the regulation of plant stress [6,7]. These earlier findings suggested that trehalose metabolism regulates the biotic and abiotic stress response and may be an important target for improving the stress tolerance of plants.
The T6P signaling pathway may directly regulate many physiological plant activities, such as seed germination, seedling growth, flowering, and senescence [8,9,10]. In plants, T6P is mainly present in the cytoplasm and also in vacuoles and chloroplasts in small amounts. During metabolism, uridine diphosphate glucose (UDPG) and 6-phosphate glucose (G6P) are catalyzed by trehalose-6-phosphate synthetase (TPS) to T6P, and T6P is further catalyzed by trehalose-6-phosphate phosphatase (TPP) to trehalose. Finally, trehalase (TRE) catalyzes the conversion of trehalose to two glucose molecules [11]. In the above metabolic pathway, the TPS protein encoded by the TPS gene is the synthetase that catalyzes T6P. TPS genes have been identified in different plants, for example, there are eleven TPS members in A. thaliana, eleven in rice, twelve in poplar, eight in potato, fourteen in rubber tree, twelve in winter wheat, thirteen in apple, twelve in corn, nine in sugarcane, seven each in melon and cucumber, and twenty in soybean [12,13].
Generally, plants have low trehalose content; however, overexpression of the TPS gene will increase the trehalose content and improve stress tolerance [14,15,16]. Transgenic plants overexpressing the TPS gene improved water-holding power and electrolyte leakage under drought stress [17]. Guo et al. found that the transgenic tobacco line overexpressing AtTPS showed a higher trehalose level and enhanced salt tolerance [18]. The overexpression of HbTPS1 from Pará rubber tree in A. thaliana improved tolerance to freezing, heat, and drought stresses [19]. The drought-resistant transgenic plants obtained by homologous transformation of maize ZmTPS showed better drought tolerance than the control plants under greenhouse conditions [20]. Meanwhile, exogenous trehalose avoided biofilm damage under extreme conditions, such as low temperature, water loss, hyperosmotic stress, and nutritional imbalance [21,22]. In addition, exogenous trehalose increased the chlorophyll content of flue-cured tobacco seedlings under a low nitrogen environment [23,24], significantly alleviated leaf wilting caused by low temperature, increased antioxidant enzyme activities, reduced membrane lipid peroxidation caused by low temperature, increased leaf water content, and promoted osmotic regulatory substances accumulation [25,26]. Meanwhile, trehalose regulated the root physiological level, improved tolerance, and promoted root growth and biomass increase in maize seedlings under low-temperature stress [27]. In addition, exogenous trehalose pretreatment significantly alleviated the growth state of watermelon cells under mannitol osmotic stress [28]. The application of exogenous trehalose enhanced the drought tolerance and alleviated the drought damage; trehalose upregulated the activities of antioxidant enzymes, such as superoxide dismutase (SOD), ascorbic acid peroxidase (APX), peroxidase (POD), and catalase (CAT) in the roots and leaves of waxy maize seedlings, reducing the production rate of superoxide anion (O2-) and the content of malondialdehyde (MDA) and proline (PRO) [29]. Studies have also shown that trehalose improves salt tolerance by increasing reactive oxygen species (ROS) scavenging capacity, alleviating plasma membrane damage, and maintaining cytoplasmic ion homeostasis [30,31]. Similarly, the application of exogenous trehalose promoted the growth of licorice seedlings and the accumulation of effective components under NaCl stress [32]. In wheat seedlings, exogenous trehalose improved the adaptation to salt stress by increasing proline accumulation and K+ absorption [33]. Additionally, Hu et al. showed that an appropriate concentration of trehalose simultaneously improved salt tolerance, drought tolerance, and cold tolerance of cucumber seedlings [34,35].
Watermelon (Citrullus lanatus) is an important economic horticultural crop worldwide. In 2019, watermelon ranked second and seventh in production and cultivated area among the world’s top ten fruits. Meanwhile, China is the world’s largest watermelon producing and consuming country, and the watermelon industry has played a significant role in increasing farmers’ income in China. However, soil salinization is a major problem affecting the production and quality of watermelon. According to survey statistics, about one billion hm2 of land worldwide is affected by salinization [36]. It is estimated that more than 50% of the global arable land area will be salinized by 2050 [37]. The area of salinized soil in China is thirty-six million hm2, accounting for 4.88% of the available land area, mainly distributed in the north and the coastal regions [38,39]. Studies have shown that most plants are damaged in soils with a salt content of up to 0.3% [40]. Salt stress mainly inhibits plant growth. However, with the aggravation of salt stress, the leaf area stops increasing, and the aboveground and underground fresh and dry weight decreases significantly [41]. Salt stress can either directly inhibit plant growth or indirectly affect plant growth by inhibiting photosynthesis and reducing the synthesis of growth substances. Moreover, the higher the salt concentration, the longer the action time, and the more noticeable the inhibition effect [42]. For watermelon, salt stress decreases planting area, yield, and quality [43]. Furthermore, with the annual expansion of the watermelon cultivation area, soil salinization will become more serious, which will have a serious impact on the sustainable and healthy development of watermelon.
Therefore, the present study investigated the functional classification, evolutionary characteristics, and expression profile of the ClTPS family. The study on the ClTPS gene will help breeders effectively select high-quality salt-tolerant germplasm resources to maintain watermelon production under adverse conditions. The study will also be of great significance for the transformation and utilization of saline-alkali land and the improvement of agricultural production levels.

2. Results

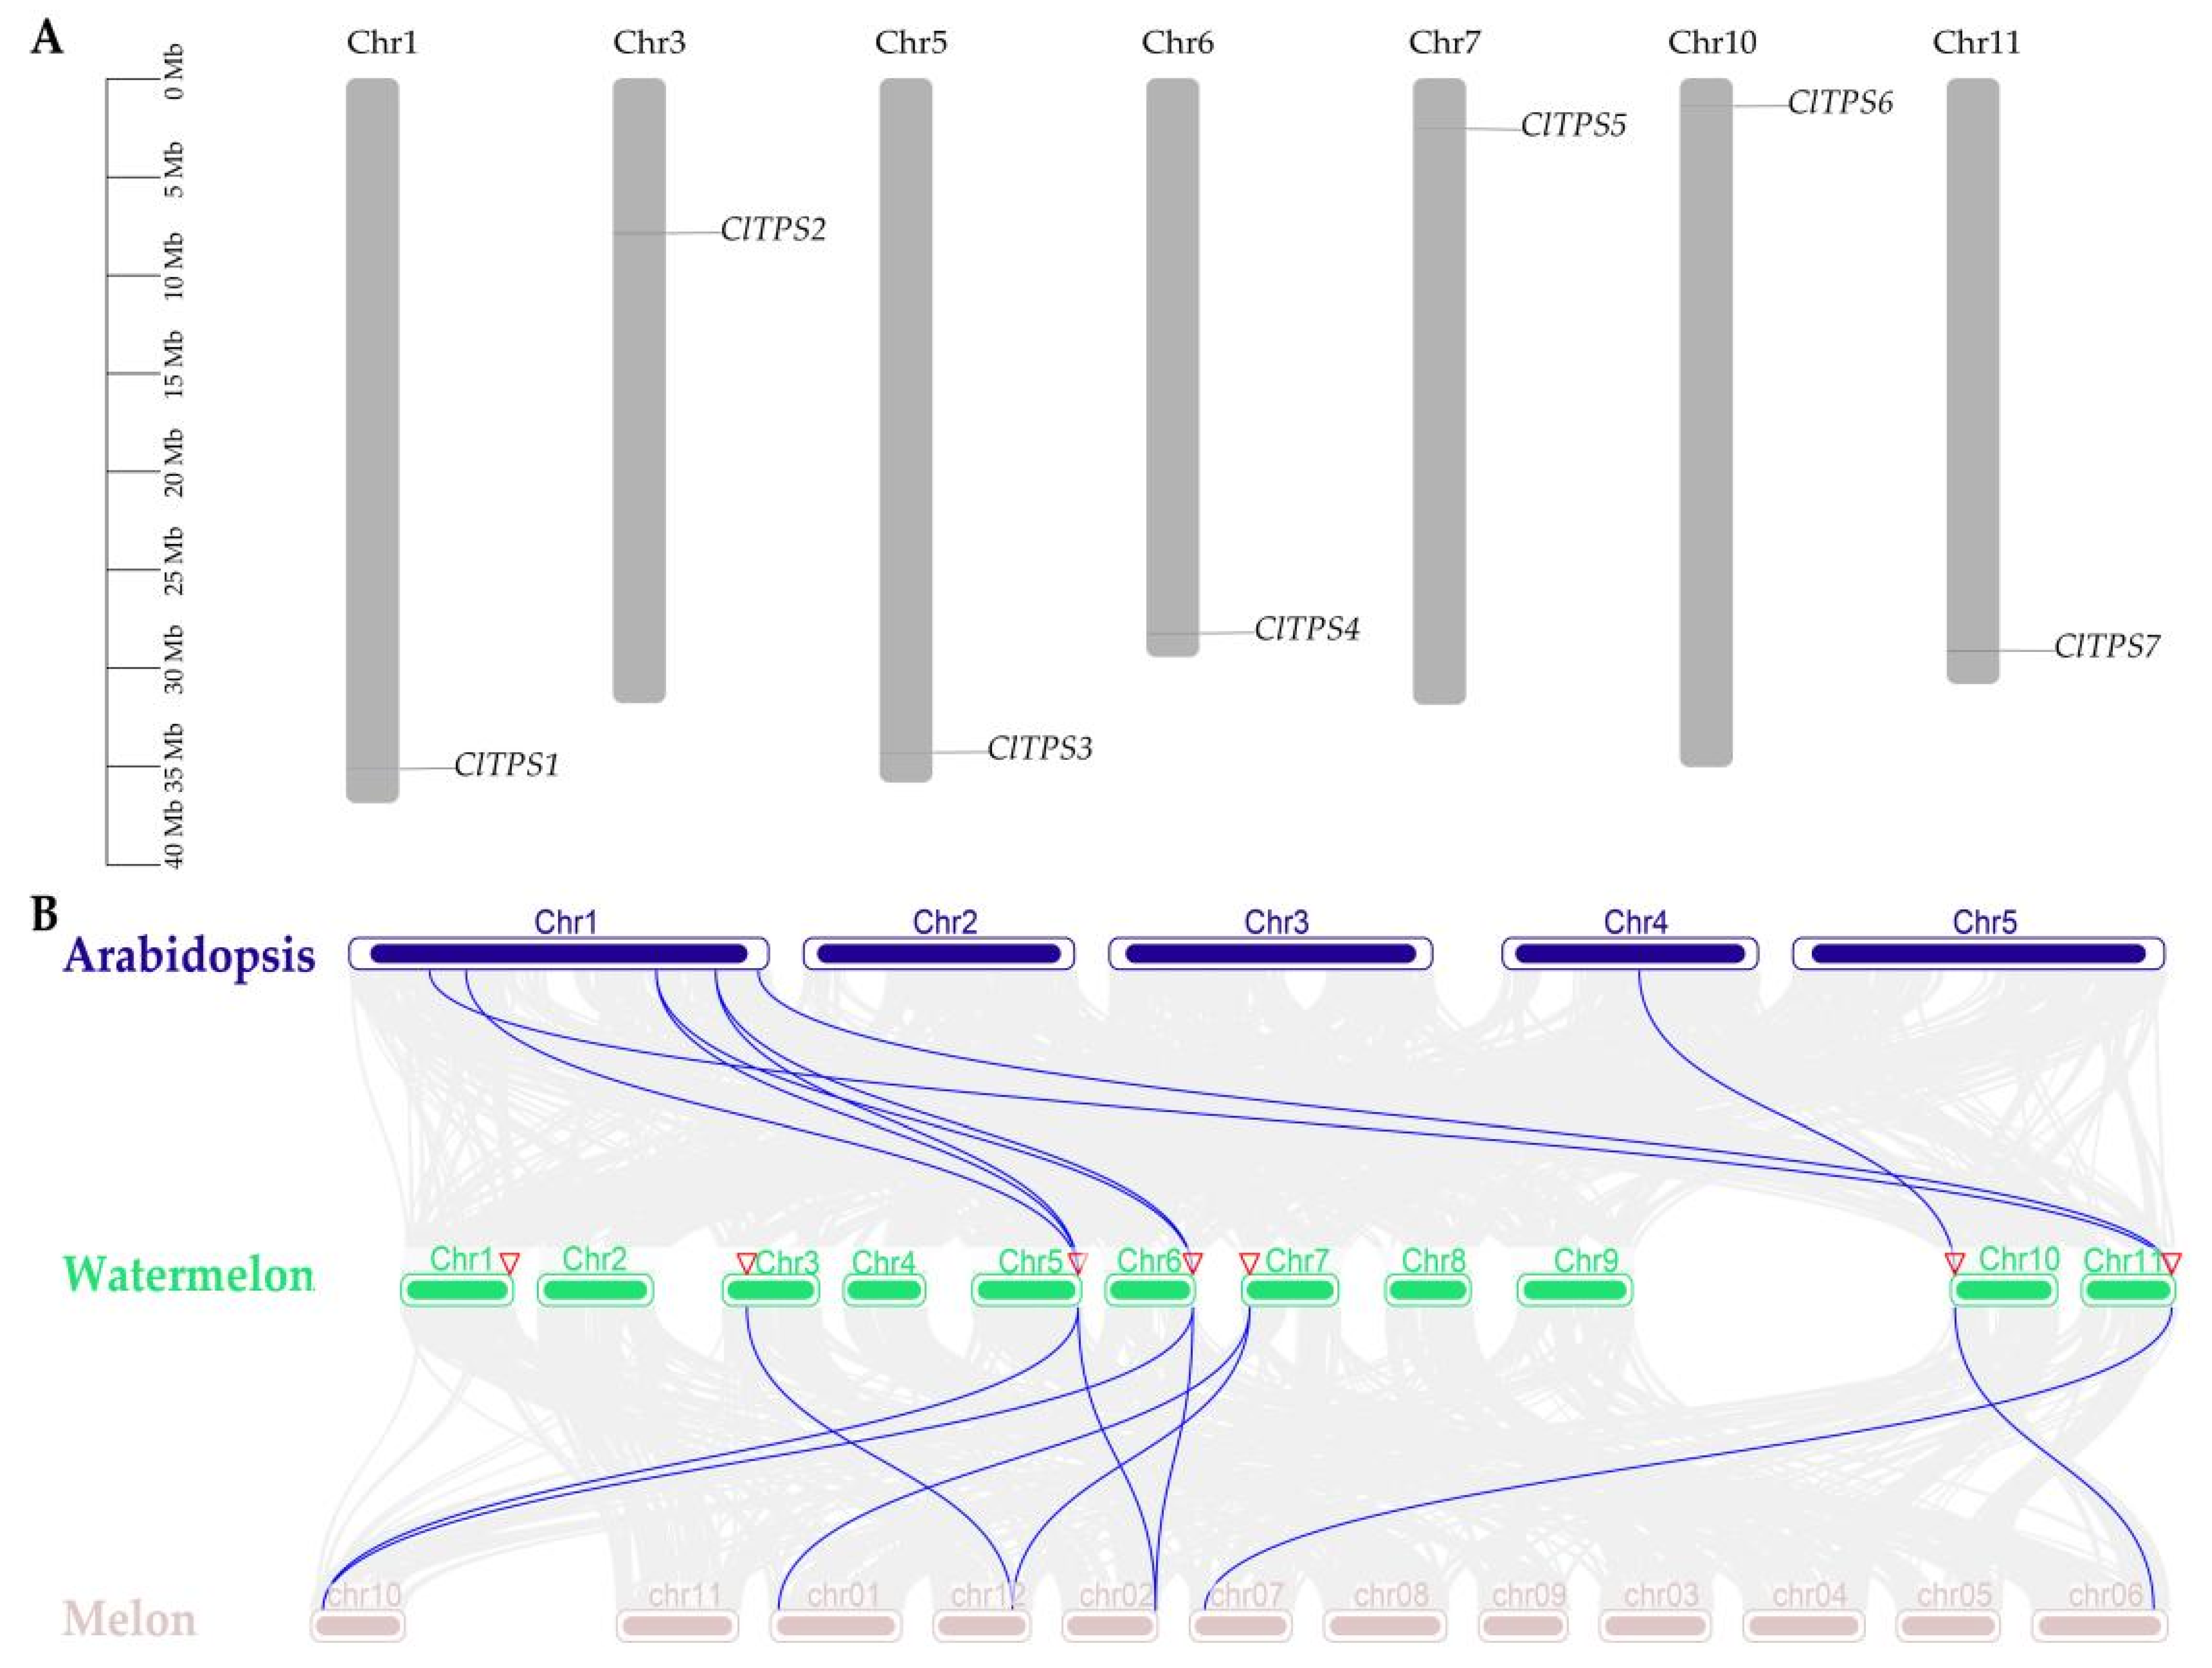
2.1. Identification of Watermelon TPS Genes and Distribution of TPS Proteins in Plant

Research has shown that TPS proteins contain two conserved domains, TPS and TPP [13,44]. Seven ClTPSs were identified from the watermelon genome database CuGenDB (http://cucurbitgenomics.org/organism/21) (accessed on 20 Octomber 2021) by BLASTP and numbered from ClTPS1 to ClTPS7 depending on their location on the chromosome (Table 1). The length of most of these TPS proteins (71.4%) ranged from 831 to 860 amino acids (aa), while the largest TPS (ClTPS2) had 933 aa and the smallest (ClTPS1) had 831 aa. The molecular weight (MW) ranged from 94.10 to 105.37 kDa and the predicted isoelectric points (pI) from 5.57 to 6.46. Finally, subcellular localization prediction indicated that the seven ClTPS proteins were located in the vacuole, including four showing chloroplast localization (ClTPS1, ClTPS4, ClTPS 6, and ClTPS7) and two showing cytoplasm localization (ClTPS2 and ClTPS3) too.
Meanwhile, the seven ClTPSs were located in seven different chromosomes (chromosomes 1, 3, 5, 6, 7, 10, and 11) of watermelon (Figure 1A), and a gene duplication event was detected.
Furthermore, a collinear relationship diagram of the dicots watermelon, A. thaliana, and melon TPS family was constructed to further understand the evolutionary mechanism of the watermelon TPS family (Figure 1B). Eight pairs of direct homologous genes were identified between watermelon and A. thaliana, and nine between watermelon and melon. Collinearity analysis detected ClTPS3, ClTPS4, ClTPS6, and ClTPS7 in the three plants, suggesting that these genes may be highly conserved. In addition, the Ka/Ks ratio of the eight pairs of direct homologous genes between watermelon and A. thaliana were less than 0.1 except for ClTPS7/AtTPS2 (supplementary Table S1), indicating purifying selection as the main driving force for the evolution of the watermelon TPS genes.

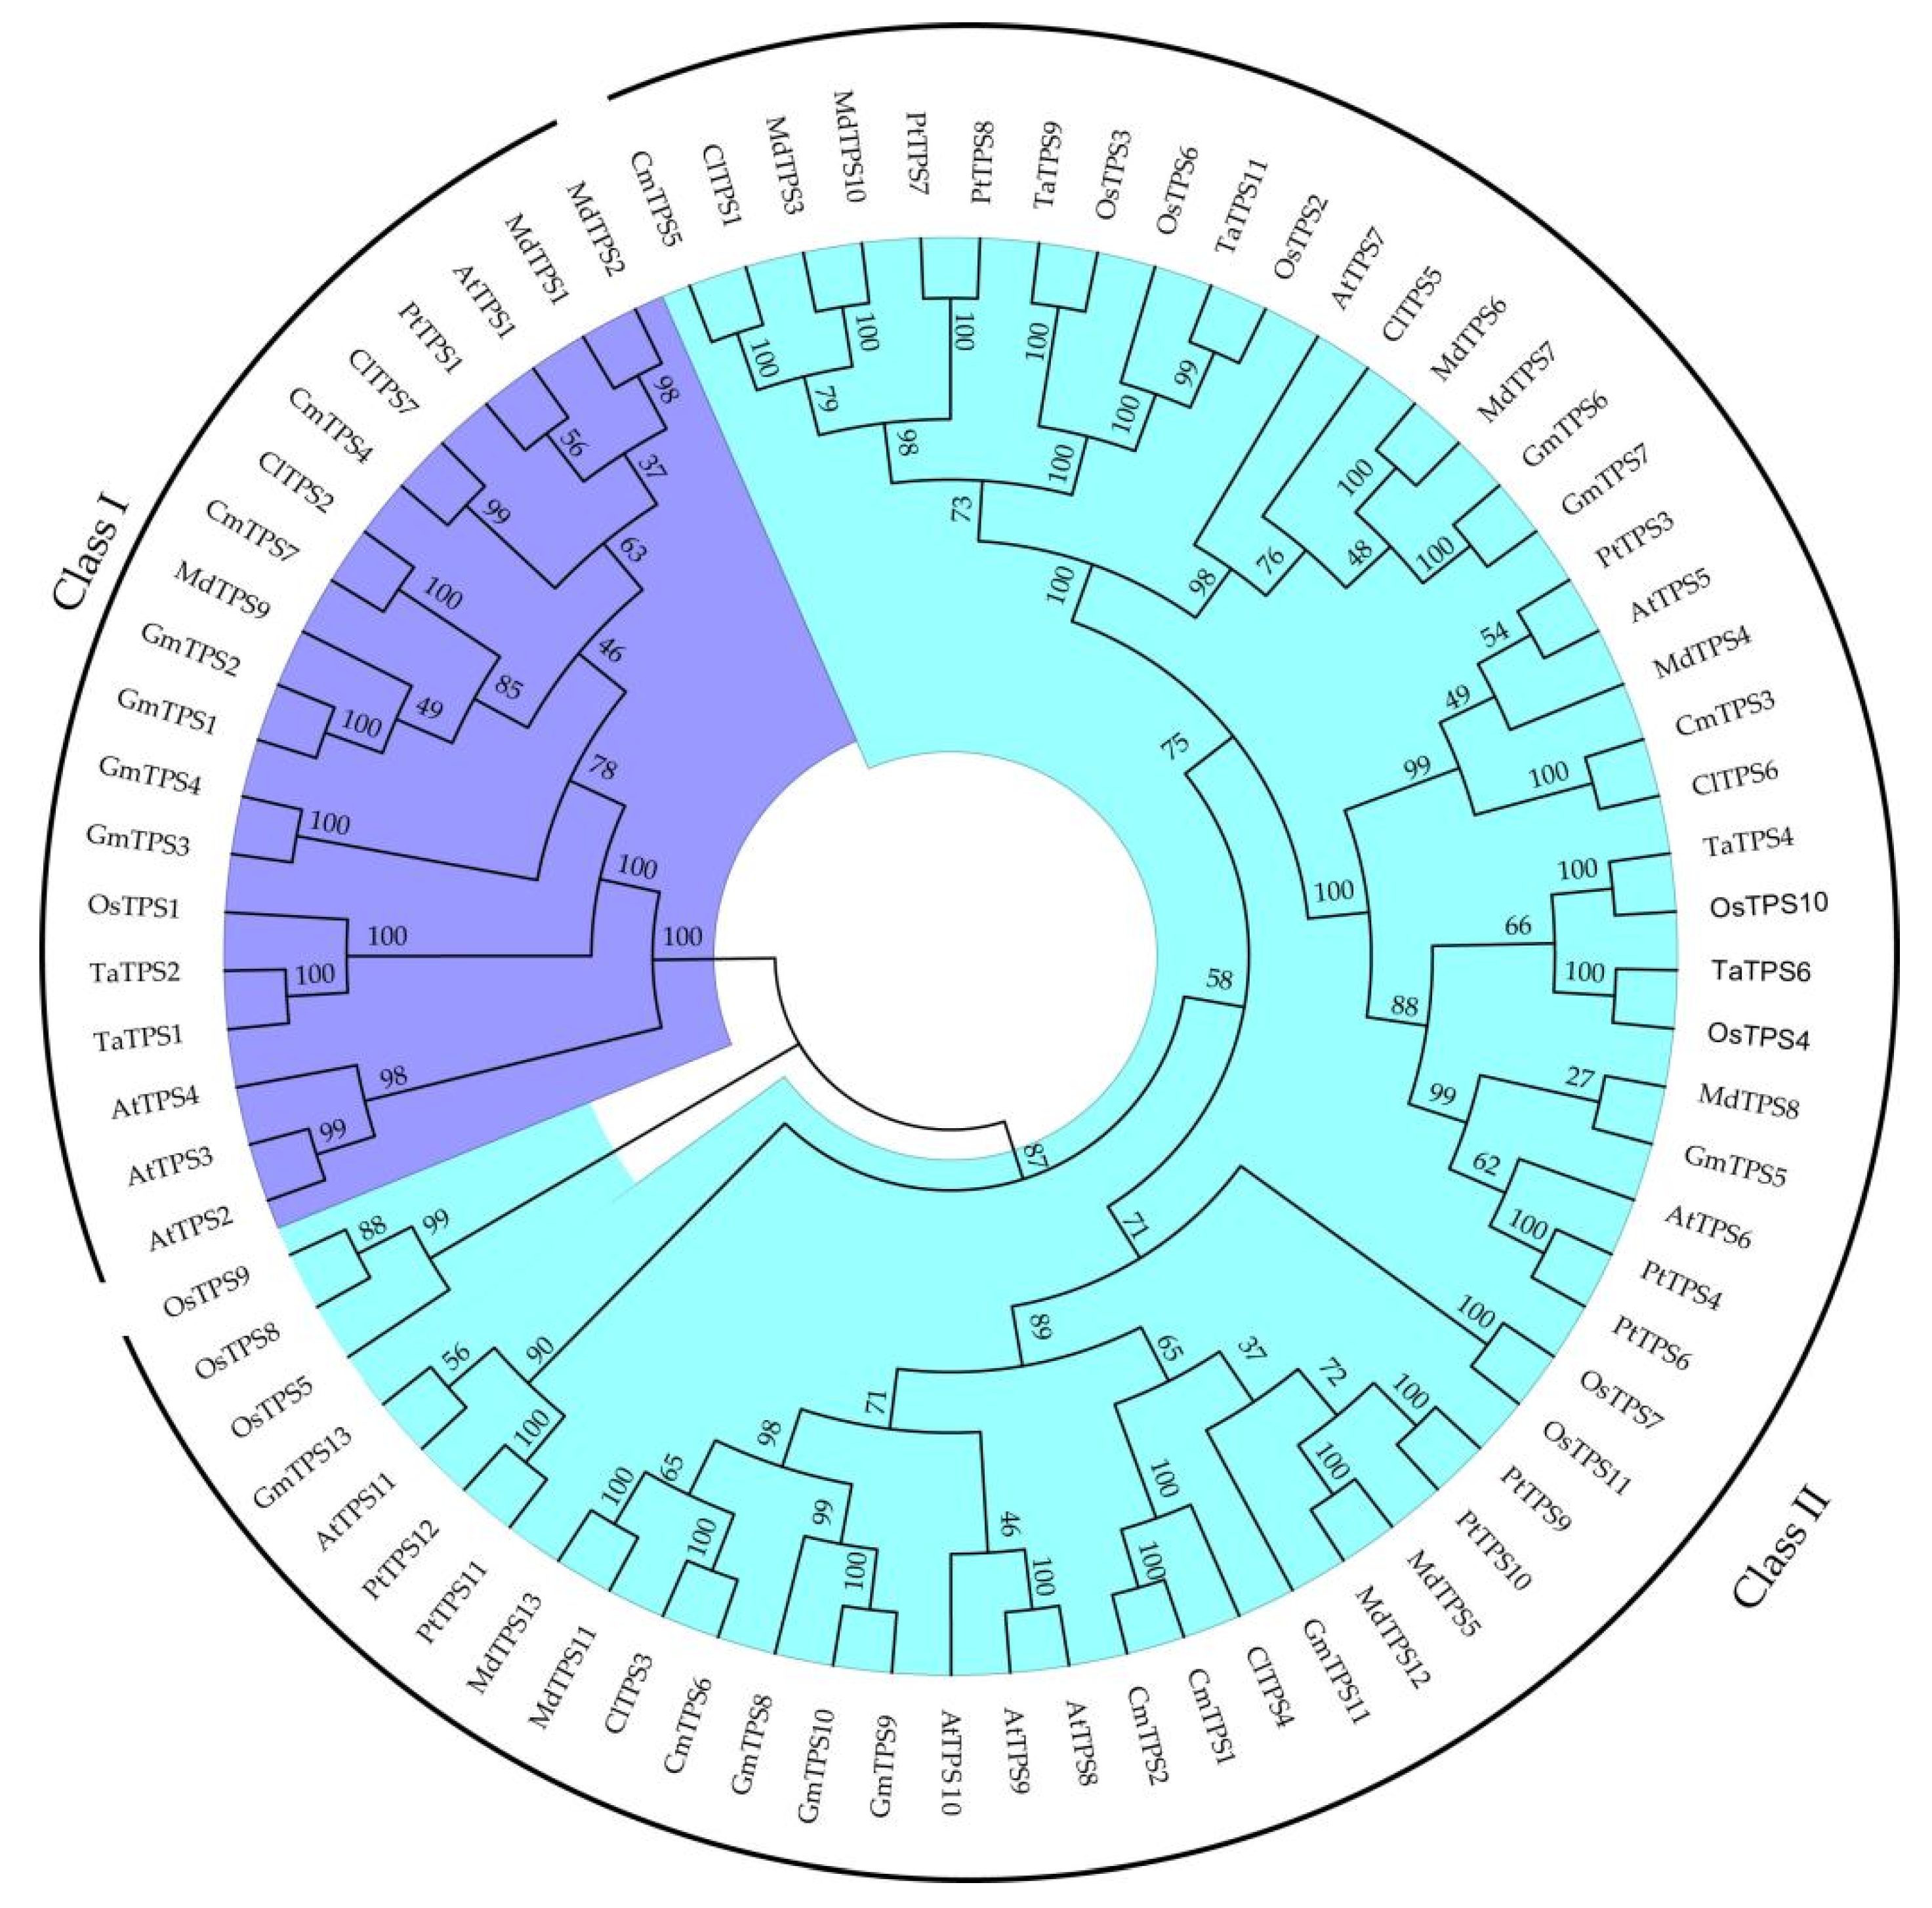
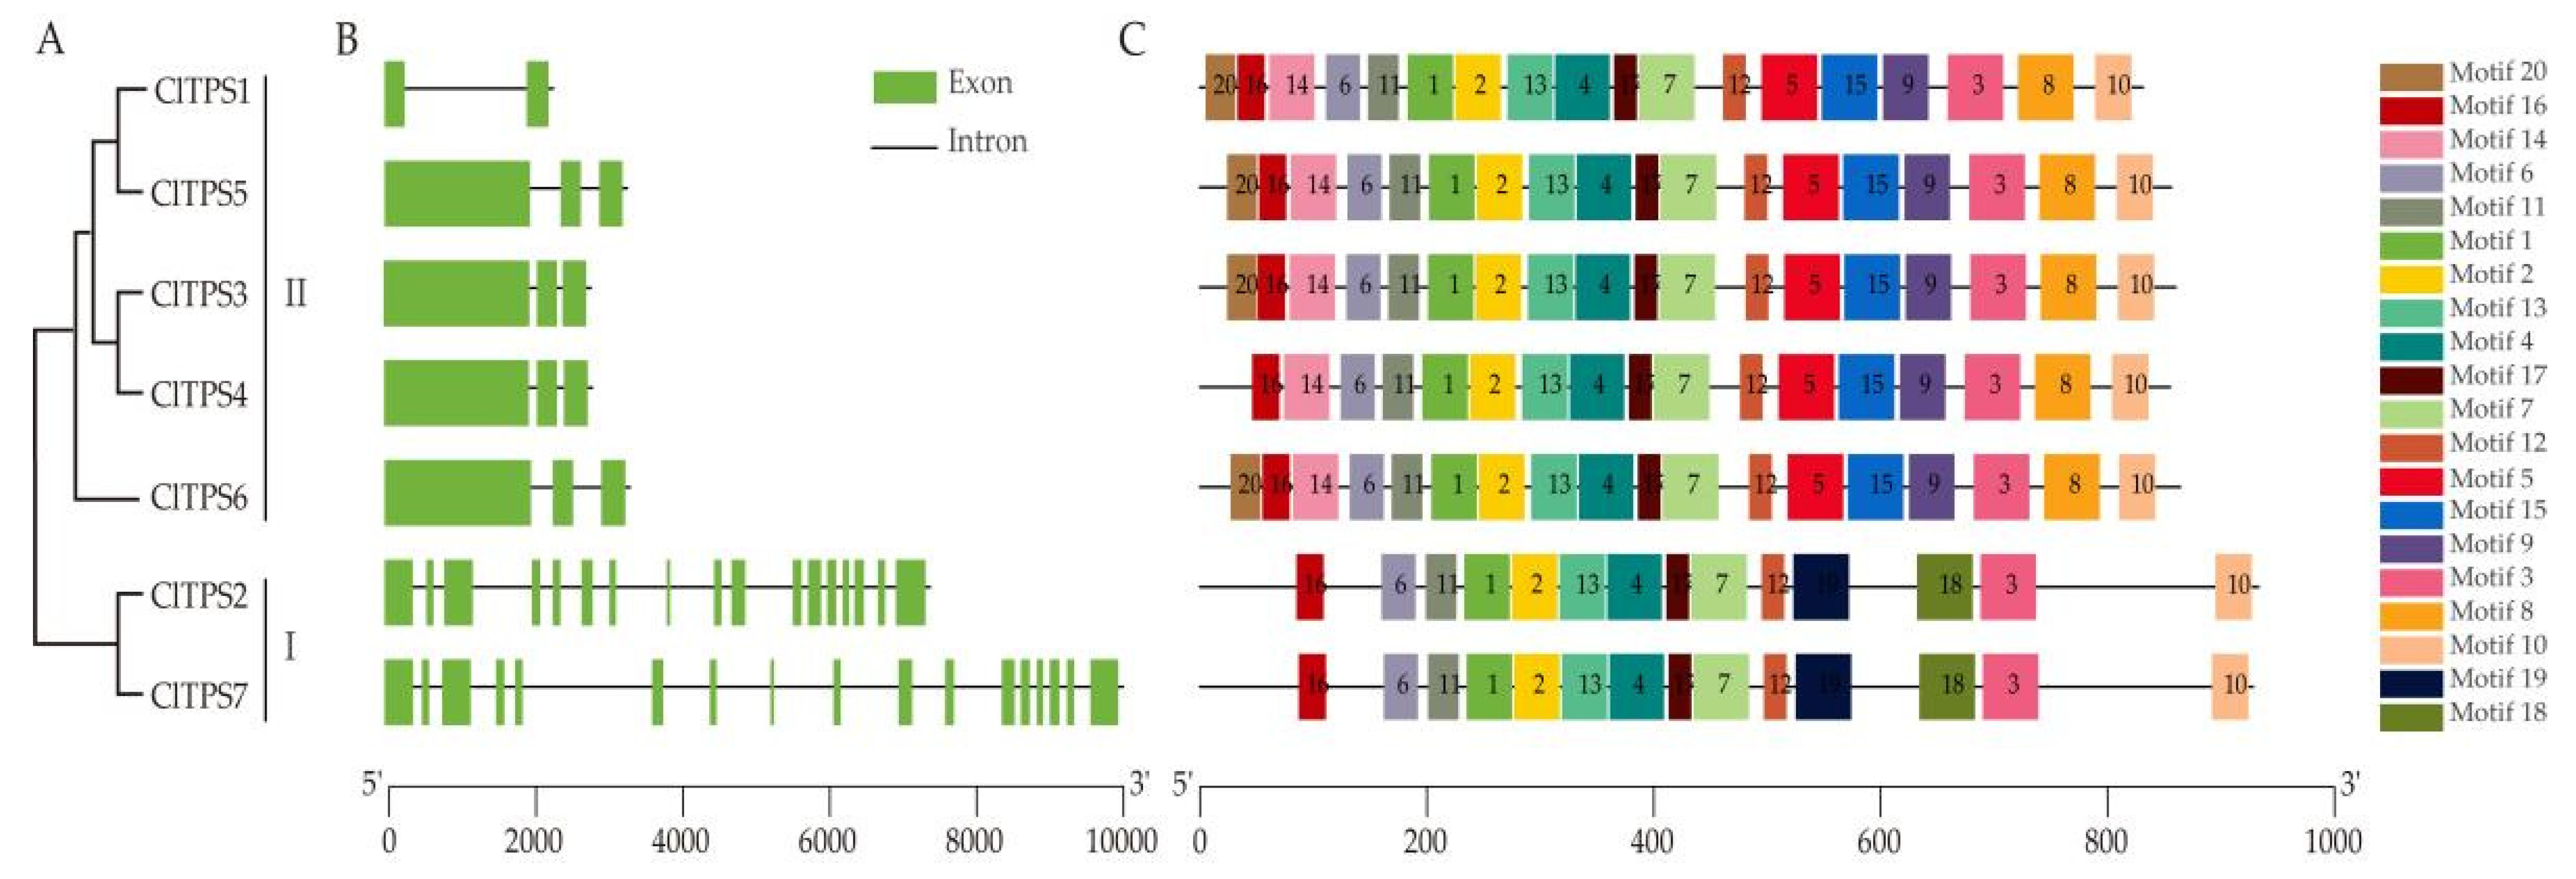
2.2. Phylogenetic Analysis, Structural and Conserved Motifs of ClTPSs

Seventy TPS proteins sequences from seven species and seven ClTPSs were used to construct a phylogenetic tree to understand the evolutionary relationship and classification of ClTPSs (Figure 2). All TPS proteins of watermelon were classified into two groups: Class I and Class II. Class I harbored two members, including ClTPS2 and ClTPS7; Class II harbored five members, including ClTPS1, ClTPS3, ClTPS4, ClTPS5, and ClTPS6. Phylogenetic analysis indicated that the protein was divided into two categories based on their sequences (Figure 3A). Generally, the most closely related members of each group had a similar exon–intron structure, with little difference in the length of introns and exons. Analysis of the exon–intron organization showed that all members except ClTPS1 in group II contain 3 exons, while group I members have 17 exons (Figure 3B).
Furthermore, MEME software was used to search for motifs and determine the predicted structural characteristics of ClTPS proteins (Figure 3C). Interestingly, all the members in group II contained 18 motifs, except ClTPS4 lacking motif 20; members of group I had only 14 motifs (lacking 5/8/9/14/15/20 motifs).

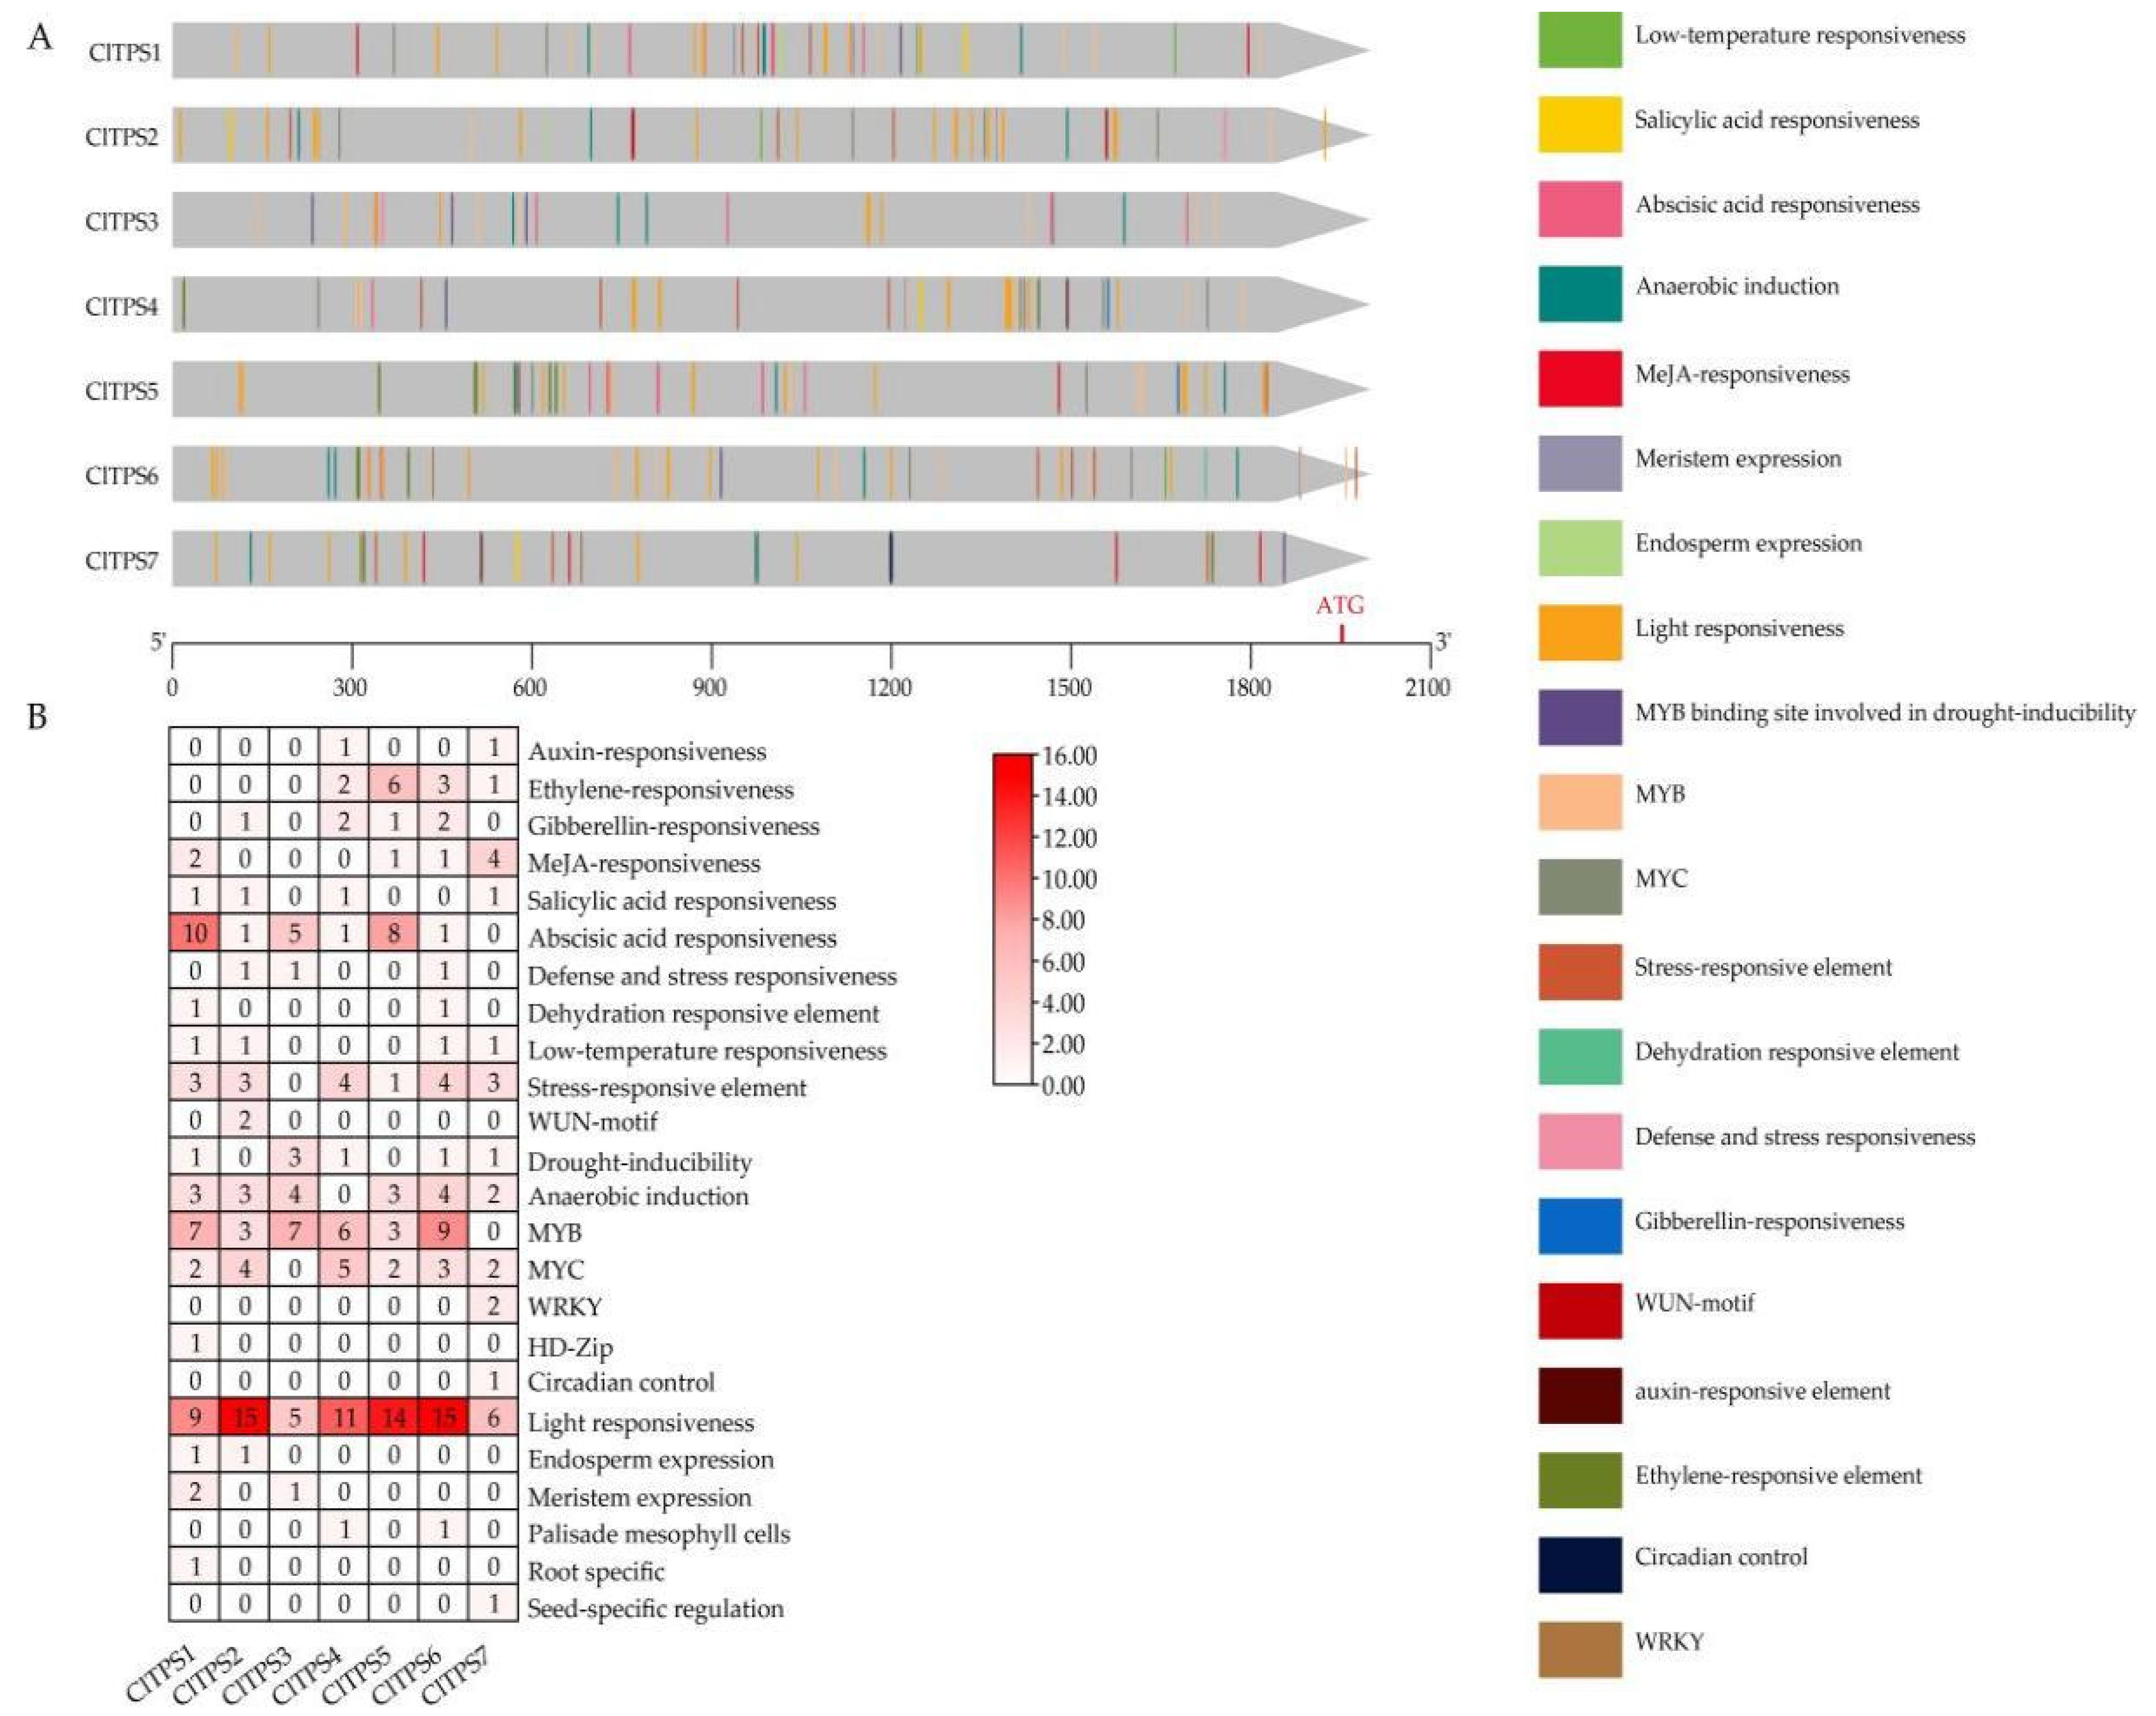
2.3. Prediction of Cis-Acting Elements of the ClTPS Genes

The 2000 bp sequences upstream of the start site of seven ClTPSs were used to identify the potential cis-acting elements in the promoter region for abiotic/biotic stress. The method predicted 249 cis-acting elements in these genes (Figure 4, Table S2). Many cis-acting elements were involved in response to environmental stress, hormone-responsiveness, development, light response, site binding, and other functions (Figure 4A). The most abundant elements were environmental stress-related elements, including those involved in low-temperature and anaerobic induction; all genes except CTPS7 contained low-temperature responsiveness elements, indicating that they may be considerably affected by the ambient temperature. Meanwhile, ABRE (ABA) was the most abundant among the predicted hormone-responsive elements (Figure 4B, Table S2).

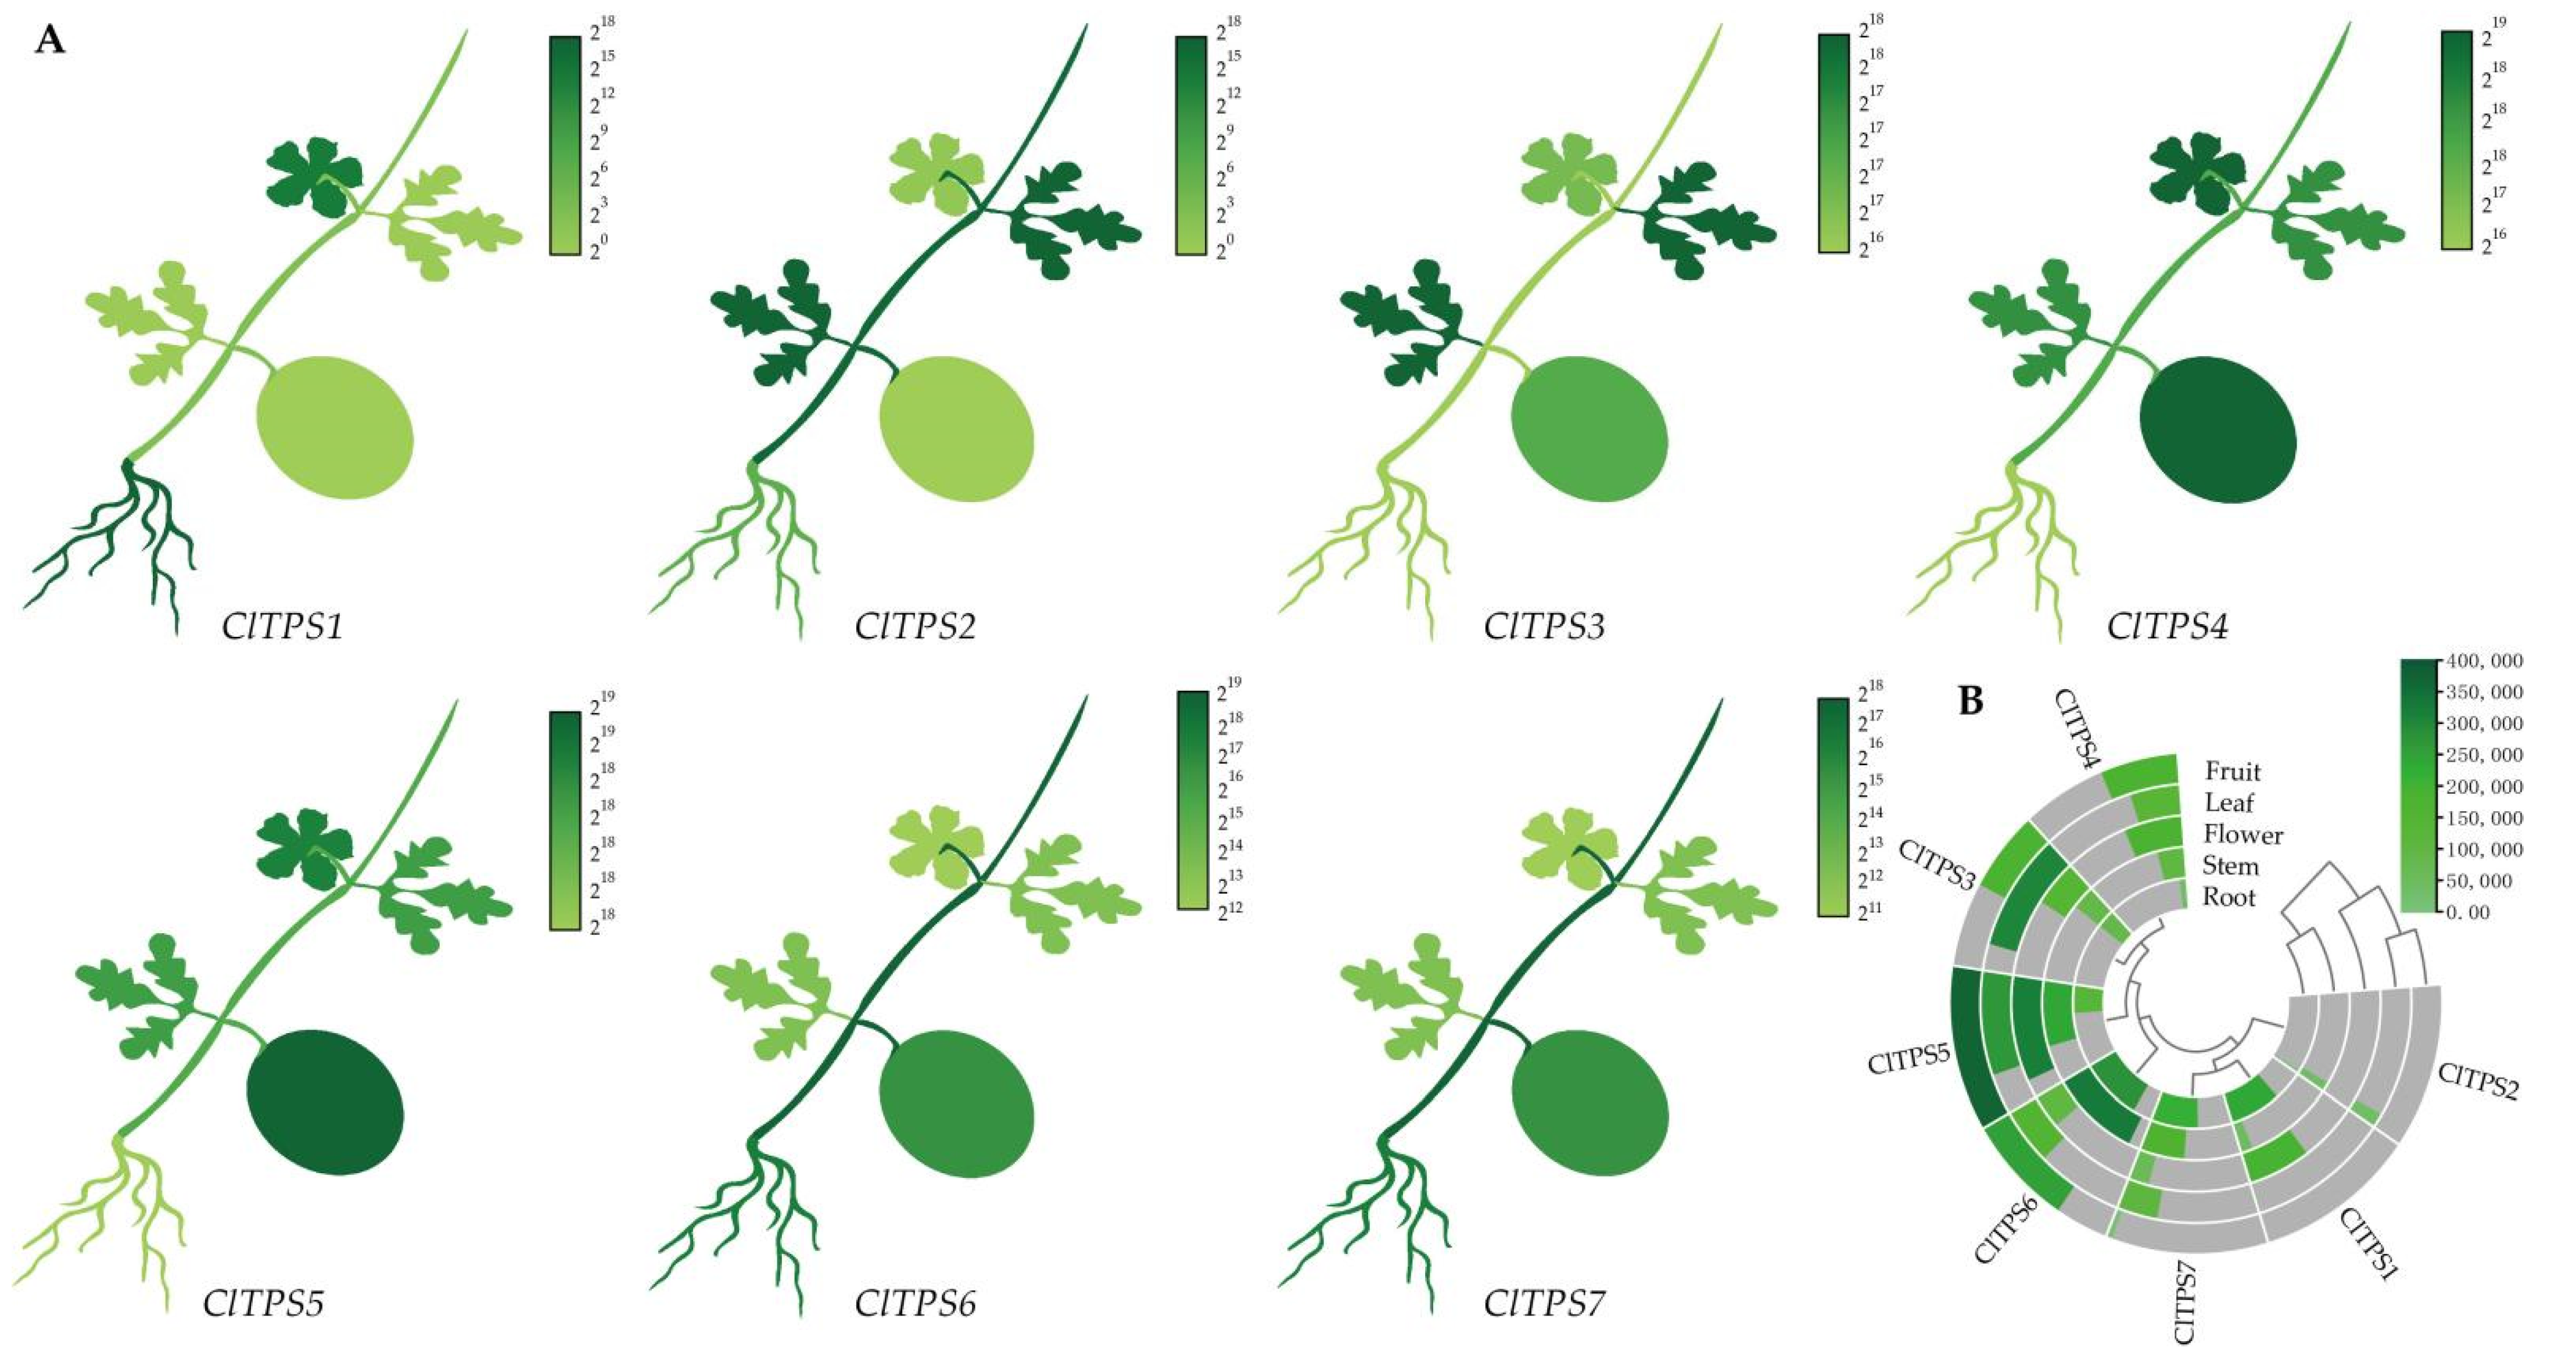
2.4. Tissue-Specific Expression of ClTPS Genes

Initially, the transcript profiles derived from the NCBI database were used to analyze the expression levels of ClTPSs in watermelon flowers, fruits, stems, leaves, and roots to elucidate their functions and provide the basis for further understanding of the tissue-specific expression pattern (Figure 5). The seven ClTPSs were divided into two groups; the genes clustered in the same group had a similar expression pattern; for example, ClTPS1/2/7 had low expression levels in fruits and leaves, with no expression of ClTPS1 in fruits. The other ClTPSs were widely expressed in all tissues, with ClTPS5 and ClTPS6 showing relatively high expression levels throughout development.

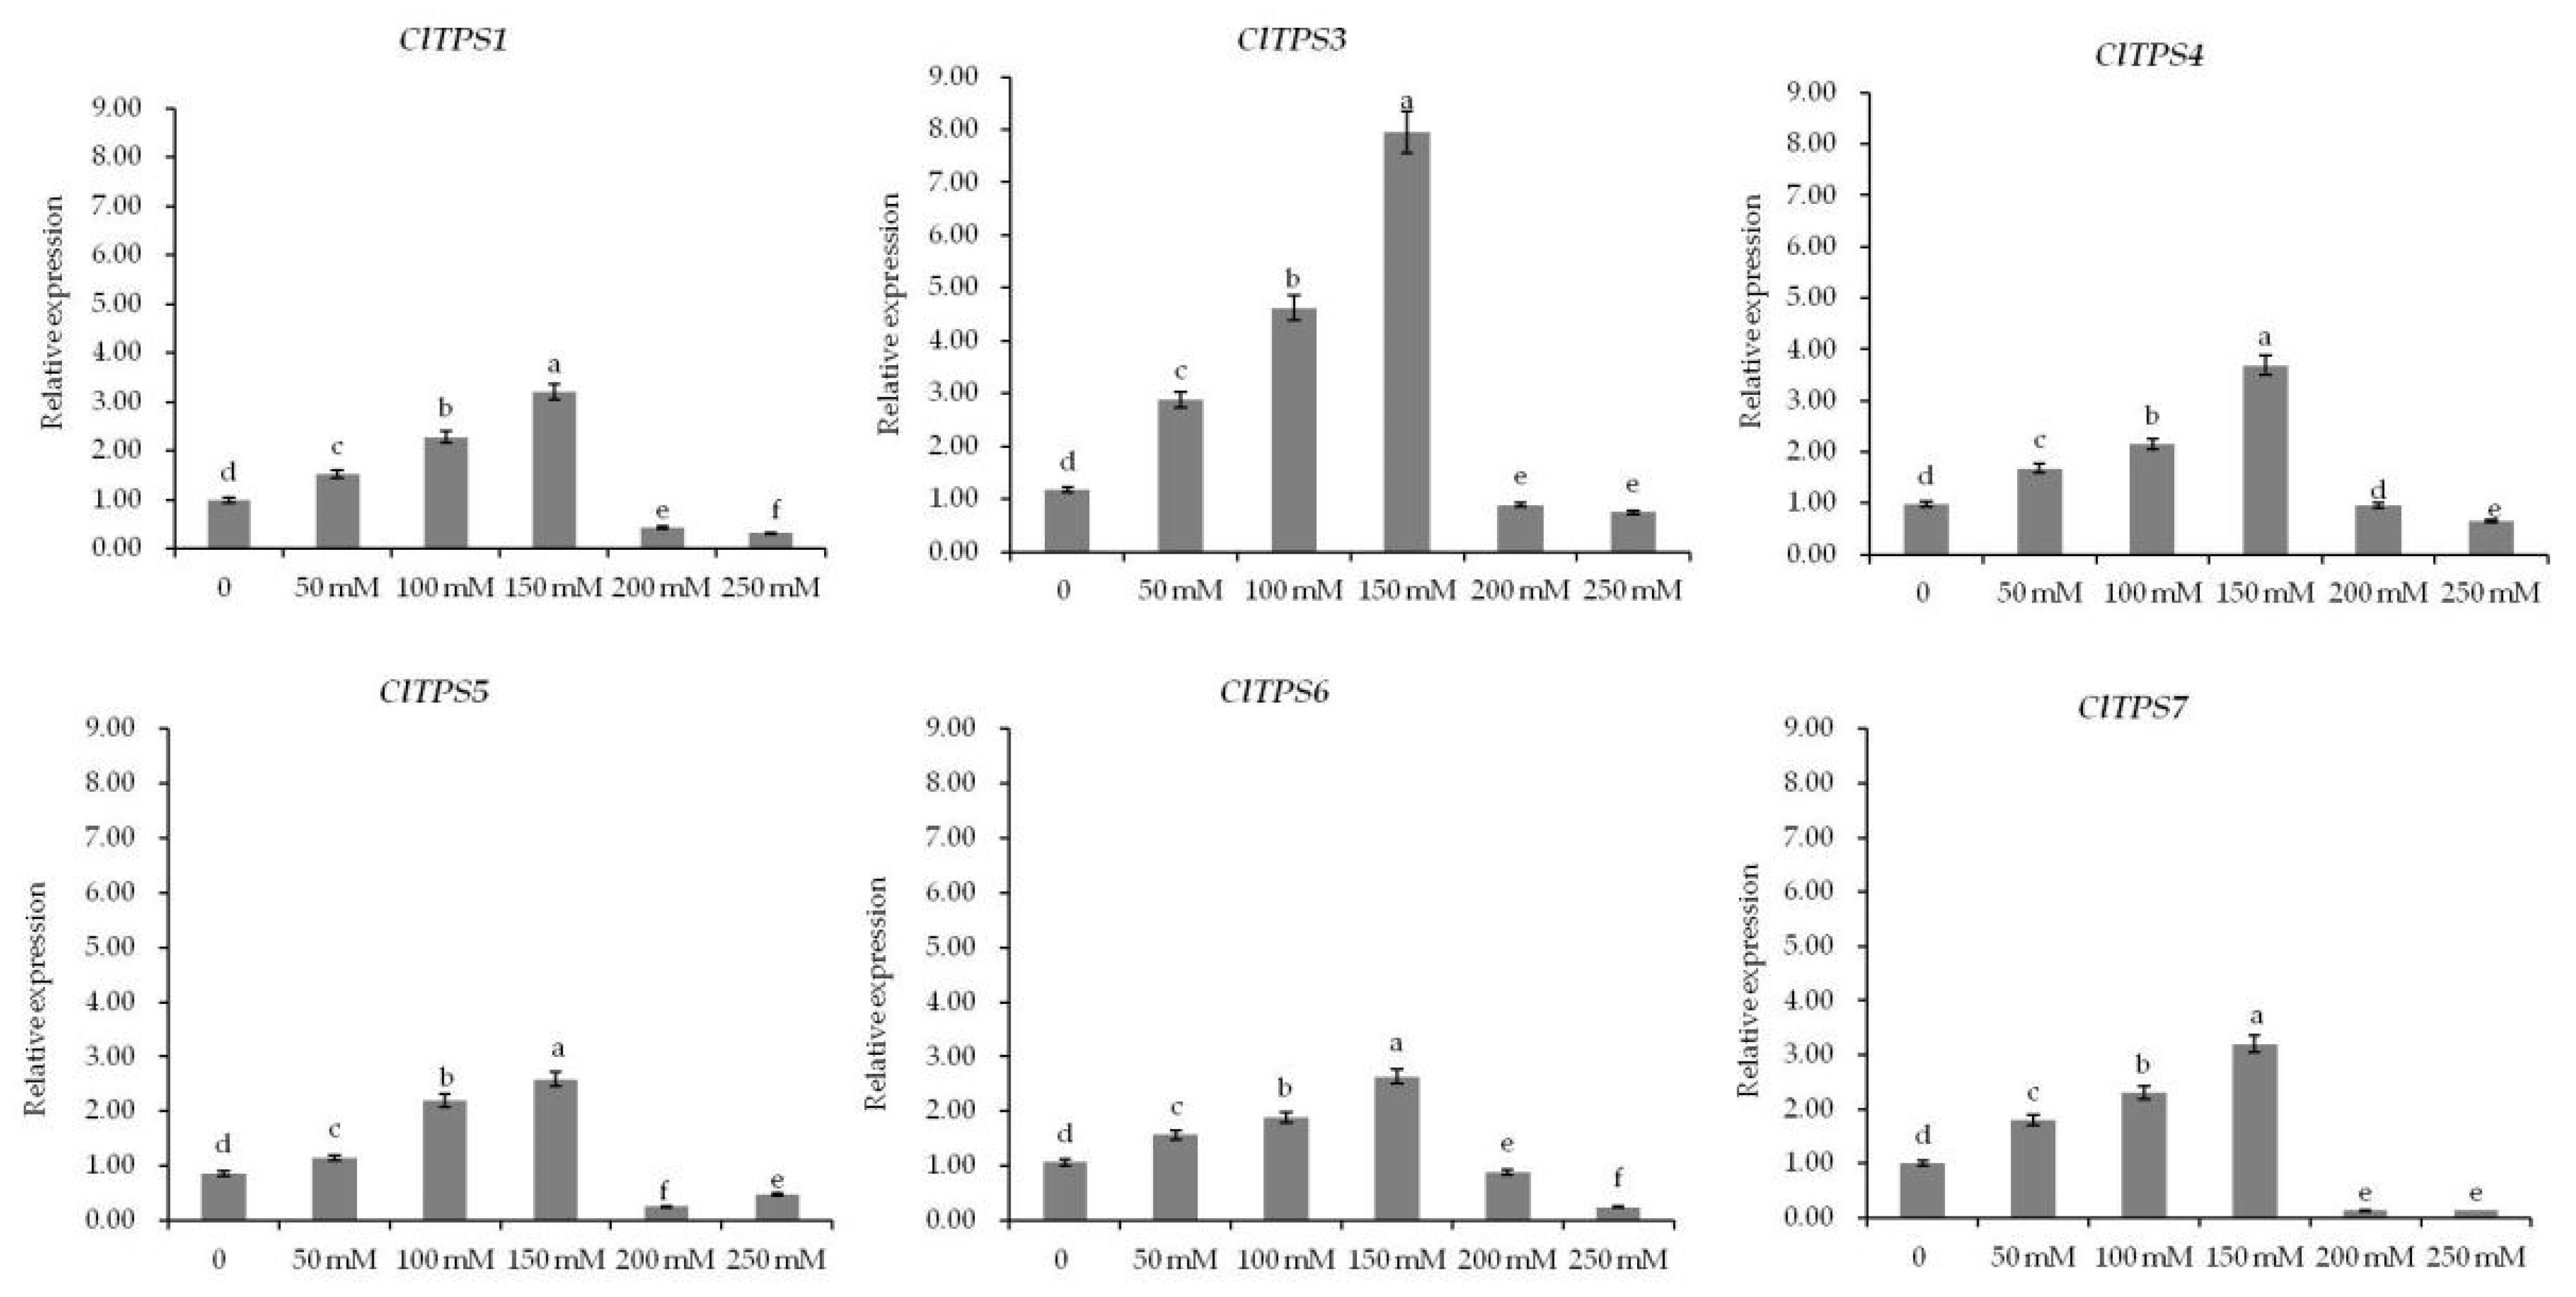
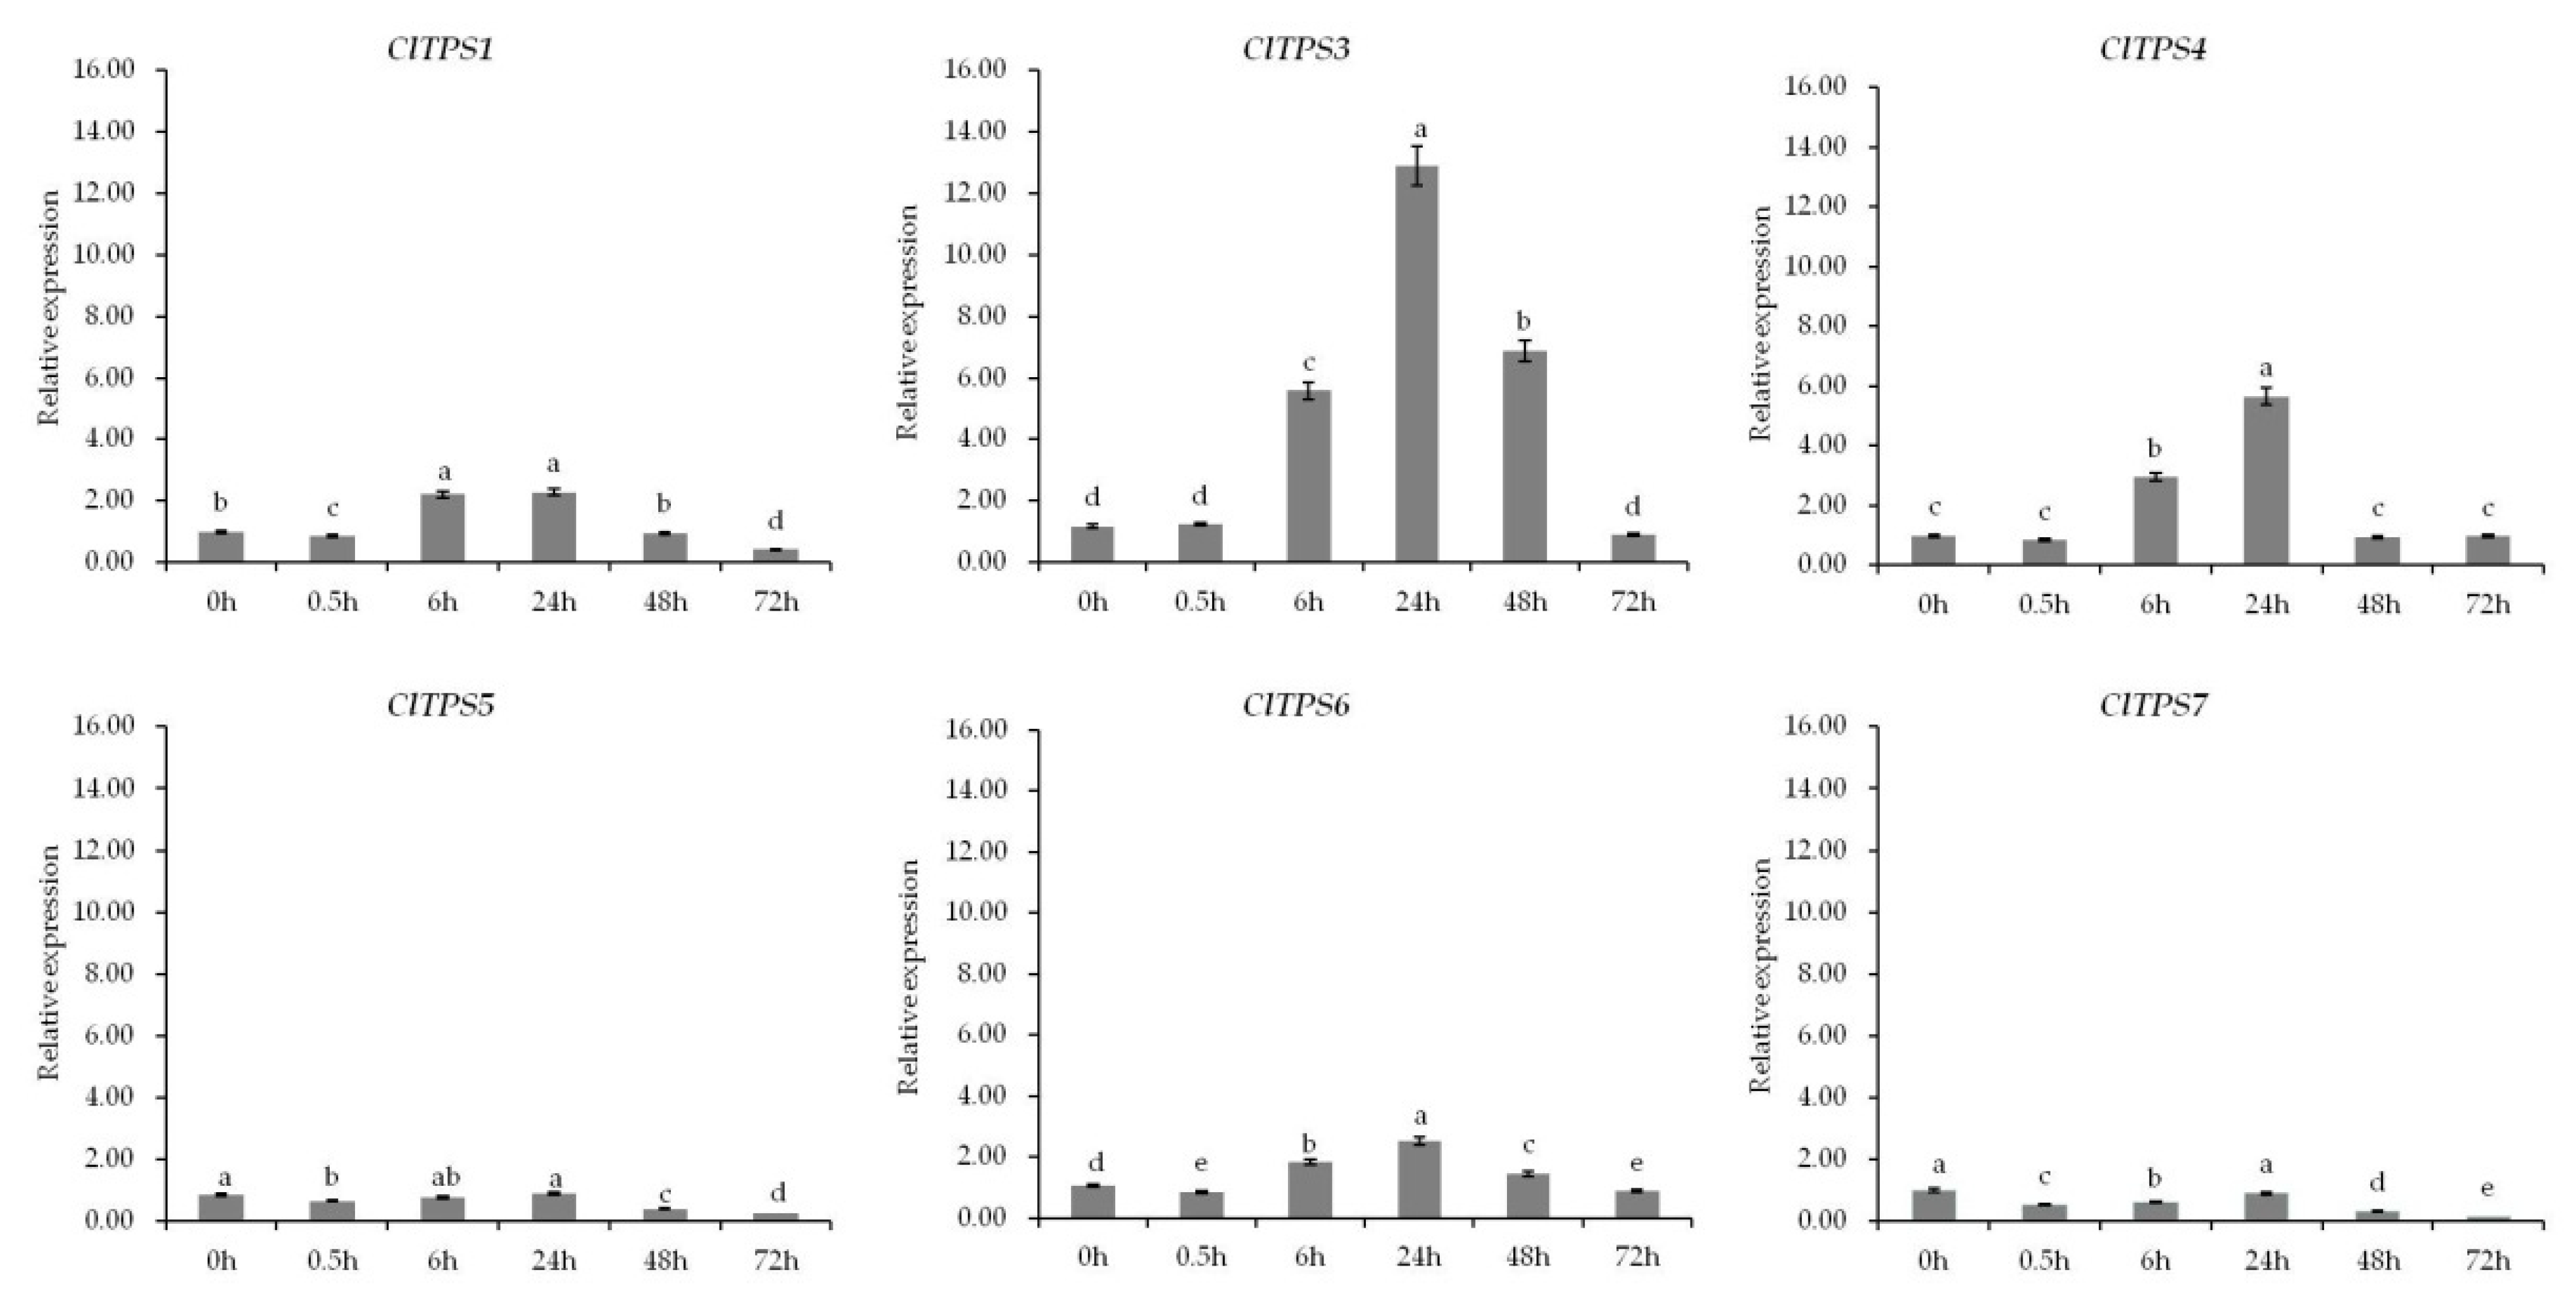
2.5. Expression of ClTPS Genes under Different Salt Stress

To further explore the role of ClTPSs in salt stress response, the expression levels of ClTPSs under different NaCl concentrations, including 0, 50, 100, 150, 200, and 250 mM, and at various time points, including 0, 0.5, 6, 24, 48, and 72 h, under 200 mM NaCl were analyzed by qRT-PCR results (Figure 6 and Figure 7). Under different NaCl concentrations, these genes (ClTPS2 had no value) showed similar expression patterns (Figure 6). In the concentration range 0–150 mM, the expression levels of the six genes gradually increased and then decreased at 200–250 mM concentration range.
Further analysis of genes at different time points under 200 mM NaCl revealed that six genes showed a decrease towards 0.5 h, an increase from 0.5 to 24 h, and then a decrease from 24 to 72 h; the expression level peaked at 24 h (Figure 7). Dehydration, wilting, and death of watermelon seedlings under high osmotic conditions probably resulted in this expression pattern. Meanwhile, ClTPS3 showed the highest expression level among all treatments, suggesting it is a key gene involved in salt stress response.

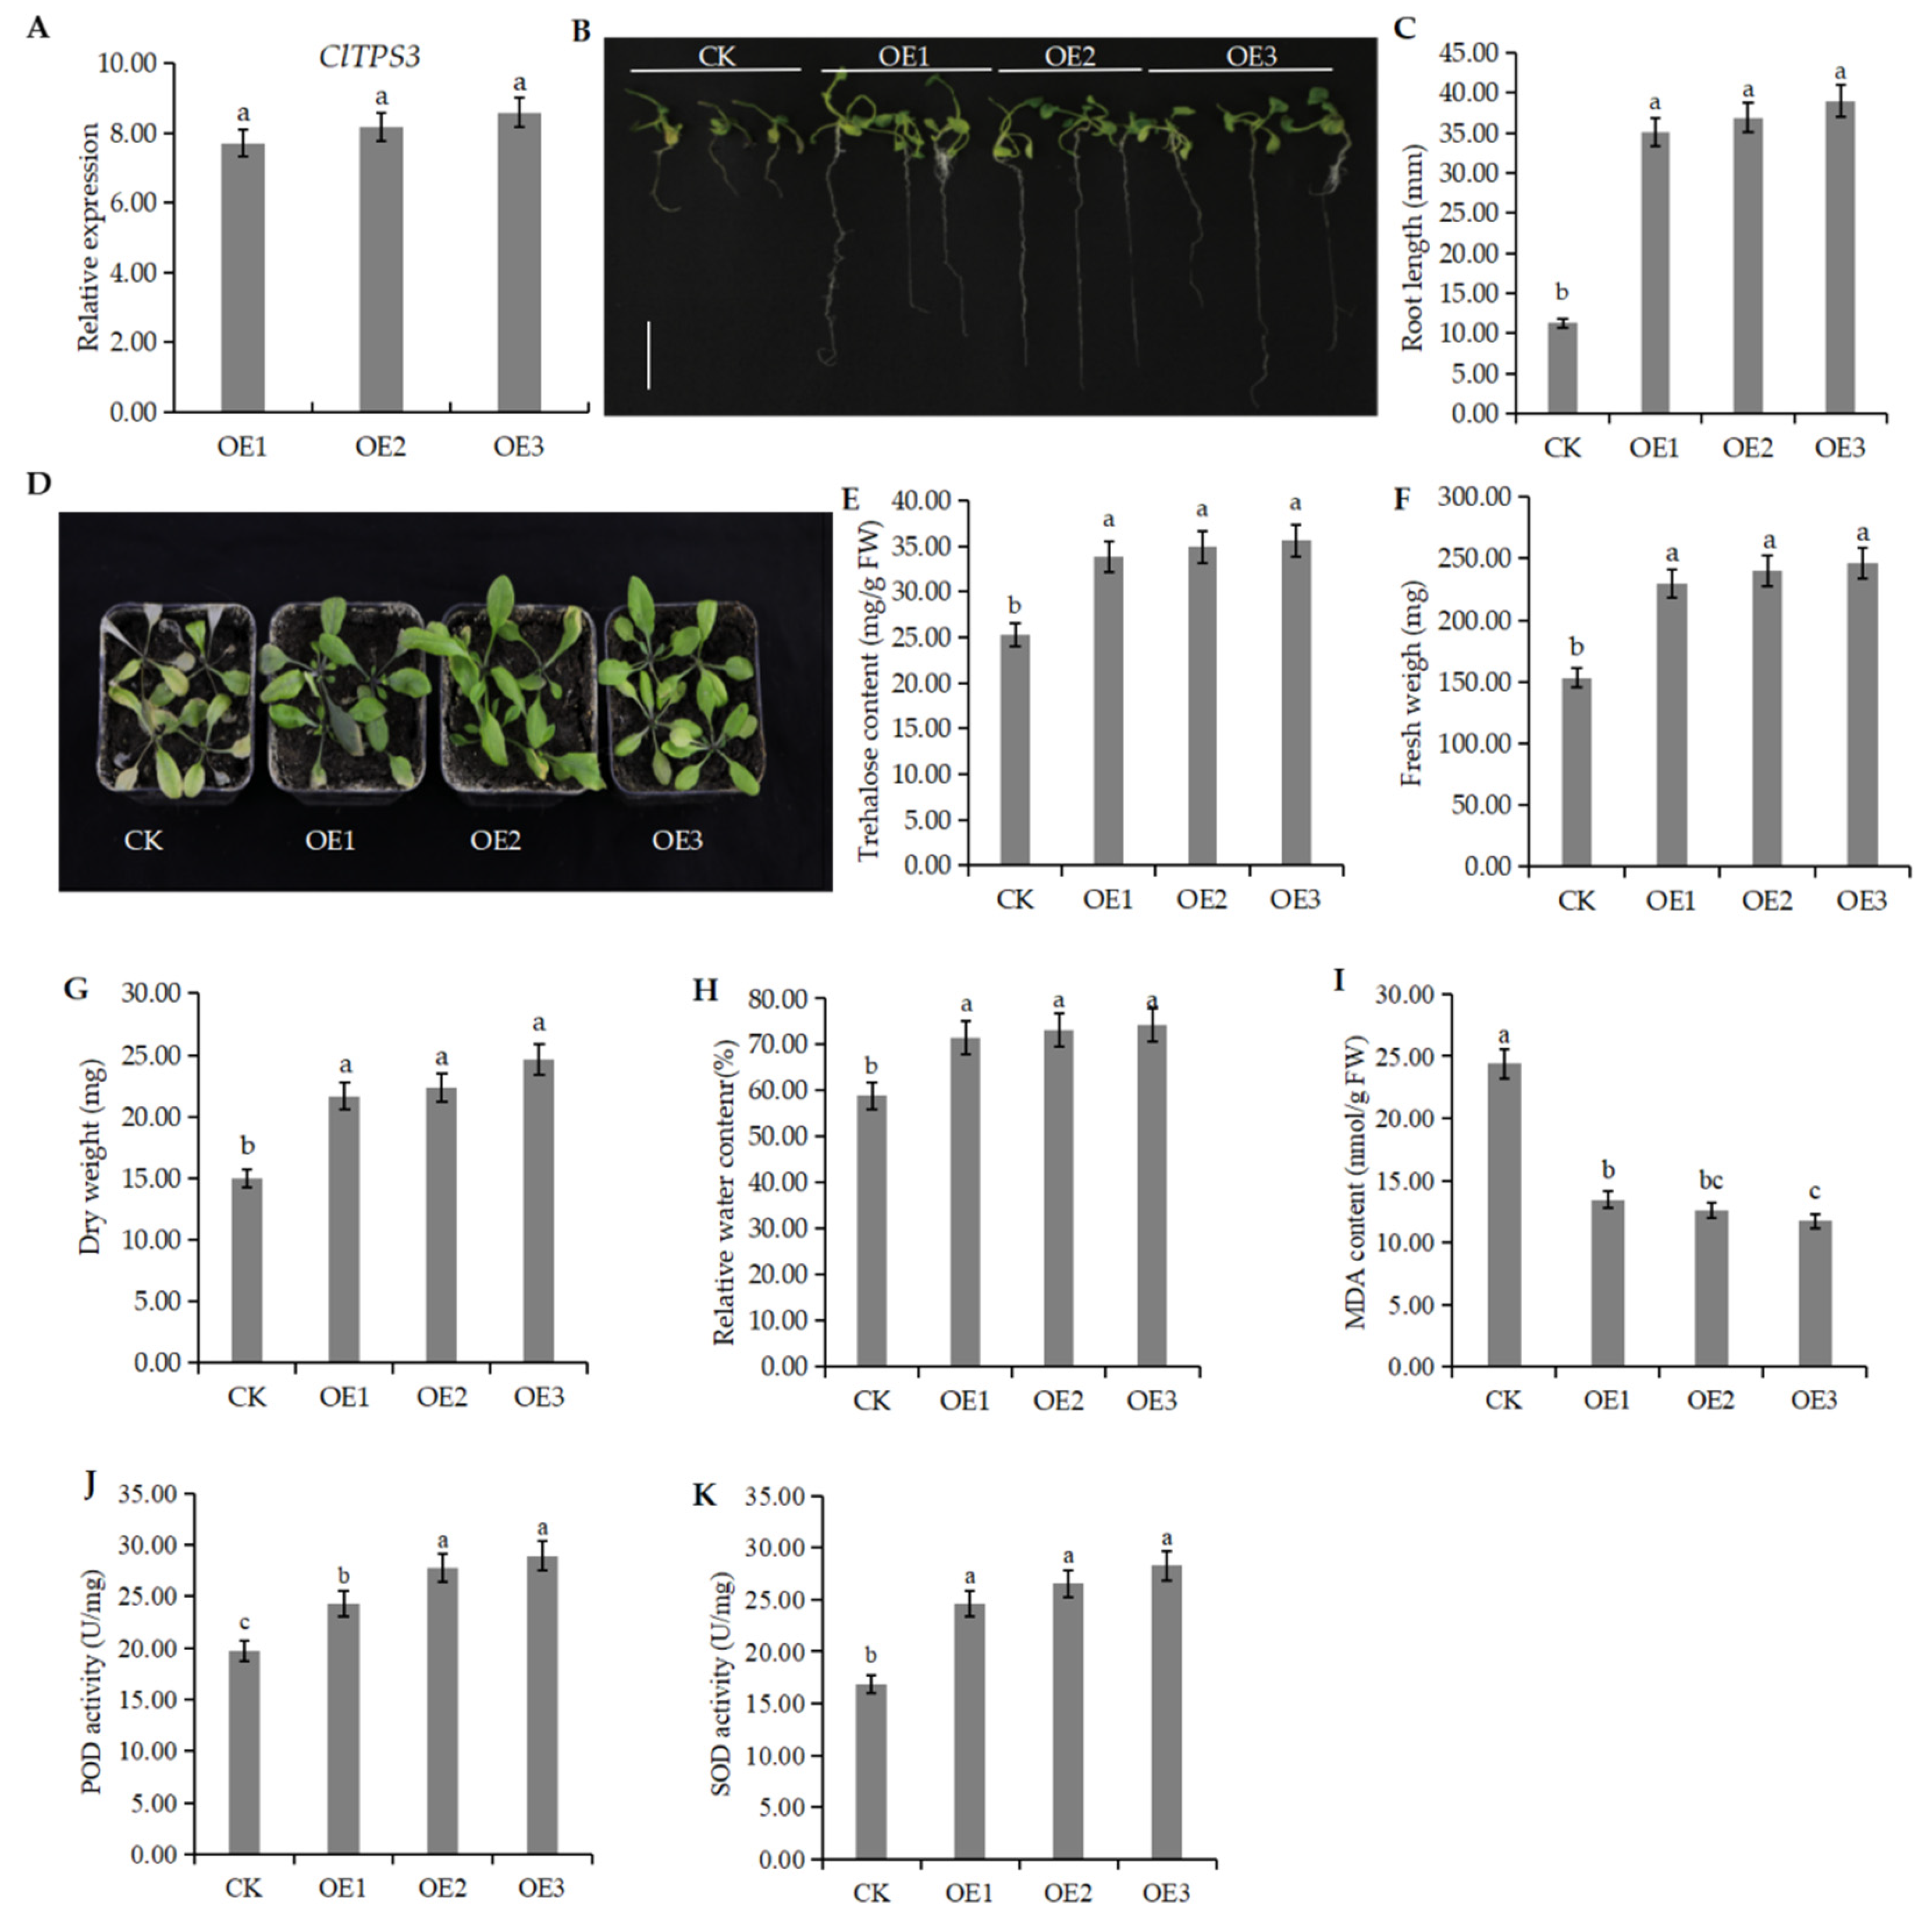
2.6. Functional Analysis of ClTPS3 Gene

The above results proved that salt stress significantly induced ClTPS3. A genetic transformation experiment was carried out in A. thaliana, and the plants were grown under 200 mM NaCl stress to verify the function of ClTPS3 further. The results showed that the expression level of ClTPS3 in transgenic plants OE1, OE2, and OE3 was significantly higher than that of the wild-type plants (CK), which was 7.4, 7.8 and 8.2 times higher than CK, respectively (Figure 1).
The transgenic plants grew normally under high salt concentration, while the growth of CK was significantly inhibited (Figure 8B). The transgenic plants had a root length of 35.19, 36.92, and 39.03 mm, respectively, which was three times more than that of CK (Figure 8C). To investigate the salt tolerance of transgenic plants and CK, the seedlings were treated with 200 mM NaCl for one week, and the results showed that transgenic plants had less wilting and a higher survival rate than CK (Figure 8C). To confirm this result, trehalose content, fresh weight (FW), dry weight (DW), and relative water content (RWC) were measured. The results showed that the trehalose content of transgenic plants was significantly higher than that of CK (Figure 8E), and the data of FW, DW and RWC exhibited similar trends (Figure 8F–H). In addition, the MDA content of the CK was significantly higher than that of transgenic plants, while POD activity and SOD activity were significantly lower than that of transgenic plants (Figure 8I–K), which indicates that ClTPS3-overexpressed reduced the content of H2O2 and O2− and reduced the cell membrane damage. These results suggest that the ClTPS3 gene may improve salt tolerance.

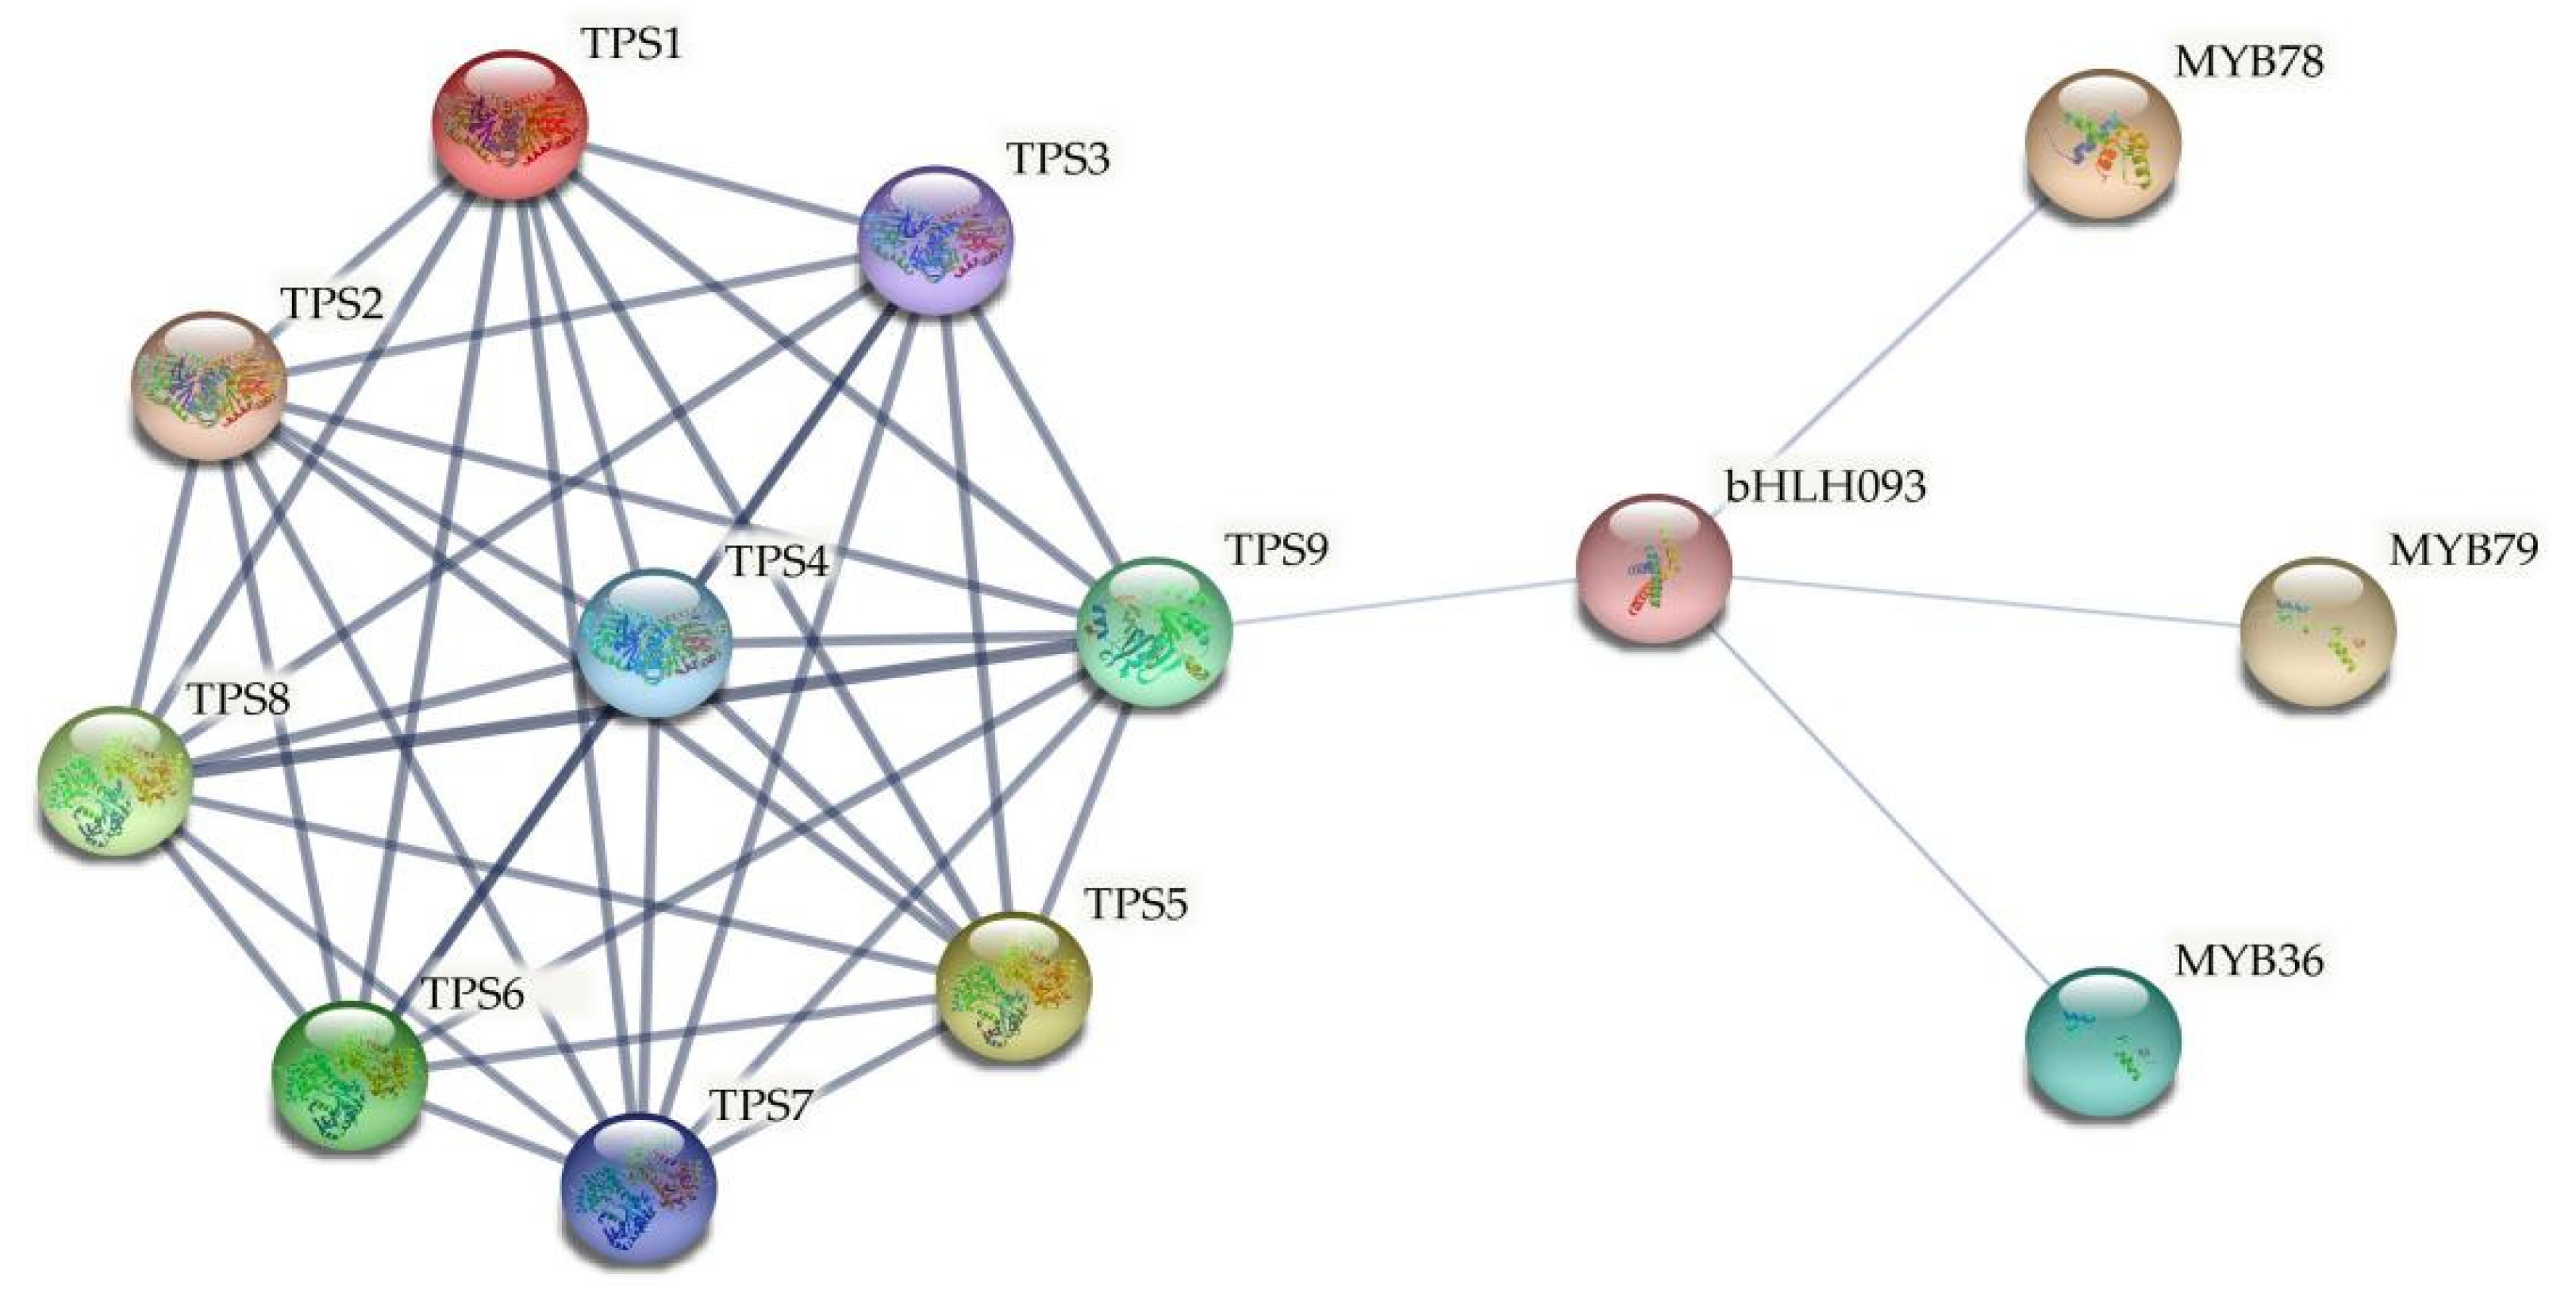
2.7. Functional Protein Association Networks of ClTPS Genes

As mentioned above (Figure 4), many MYB and bHLH transcription factor binding sites were detected in the promoter region of ClTPS genes, indicating their regulation by the transcription factors. A functional protein association network analysis was performed to screen for transcription factors that regulate ClTPS genes. Studies have reported the roles of MYB and bHLH transcription factor family genes in regulating watermelon response to abiotic stress [45,46]. Therefore, the interactions among the TPS proteins, MYB, and bHLH transcription factors were predicted using the STRING program. The analysis indicated a direct regulatory relationship between TPS9 (ClTPS3) and bHLH093 (ClbHLH93), while MYB36 (ClMYB9), MYB78 (ClMYB69), and MYB79 (ClMYB51) appeared to regulate bHLH093 (Figure 9).

3. Discussion

The present study adopted a bioinformatic approach to identify and characterize the watermelon TPS gene family. Seven ClTPS genes were identified in watermelon, which was less than the number of genes in A. thaliana and rice (11 TPS gene members). Previous studies revealed that fragment duplication resulted in three TPS genes in rice, genome-wide duplication produced one TPS gene in A. thaliana; AtTPS2 and AtTPS3 genes were produced by fragment duplication from AtTPS1 [44]. However, in this study, no tandem duplication or fragment duplication event was detected in the ClTPS gene family, indicating different ancestor genes for these seven ClTPSs. This observation confirmed the presence of at least seven TPS genes in the common ancestor of monocotyledonous and dicotyledonous plants [47]. Meanwhile, in genetics, the Ka/Ks ratio is used as an indicator of selective pressure (the force applied by natural selection) acting on a protein-coding gene. Ka/Ks greater than 1 indicates a strong positive selection, genes with Ka/Ks between 0.5 and 1 have a weak positive selection, and those with Ka/Ks less than 1 are negatively selected (purifying selection) [48,49,50]. In this study, the analysis of evolutionary selective pressure indicated that the ClTPS genes were subjected to a purifying selection, which may partly explain fewer genes than A. thaliana.
According to the gene structure and enzyme activity, TPS family genes in plants are classified into two classes: Class I and Class II [51,52,53,54,55]. In the phylogenetic tree, ClTPS2 and ClTPS7 clustered with AtTPS1, AtTPS2, AtTPS3, AtTPS4, and OsTPS1, belonging to the Class I TPS subfamily, while the other five ClTPS genes belonged to the Class II TPS subfamily. Studies have also shown that the Class I genes have TPS activity, while the function of Class II TPS subfamily genes is not clear [52,56,57,58]. However, few researchers pointed out that the N-terminal of some genes in Class II TPS subfamily have the TPS domain of the conserved sites of glycotransferase and the TPP domain of the conserved sites of two phosphohydrolases at the C-terminal; the presence of these two domains indicate that the gene members are either bifunctional or act as a TPS complex subunit [54,55,59]. Long et al. [28] predicted ten glycosylation sites and forty-nine phosphorylation sites for the protein encoded by the ClTPS1 gene, indicating TPS and TPP activities for the ClTPS1 gene. The functional verification of the TPS gene family in maize revealed both TPS activity and TPP activity for the ZmTPS3 gene of the Class II subfamily [60]. These observations collectively indicate that the TPS genes may quickly respond to stress and synthesize trehalose to help watermelon survive under stress.
The ClTPS genes of Class I and Class II subfamily had significantly different numbers of exons, indicating evolutionary differences between them similar to Populus, A. thaliana, and rice [44]. Studies have proven a close relationship between the structure and function of genes [61]. Similarly, the differences in the expression patterns and functions of Class I and Class II ClTPS genes may be related to the wide differences in the exon–intron structure. In this study, two Class I members and four Class II members showed similar tissue expression patterns (Figure 5B), probably because few introns are required during the selective splicing of mRNA to subsequently regulate the structure and function of the protein encoded by the gene. Meanwhile, some genes may have enhanced mRNA transcription and transport, leading to different tissue-specific patterns and different expression levels [62,63].
TPS is a gene that encodes a key enzyme in the trehalose pathway. The promoter region of ClTPS genes contains a variety of signal response elements, which can respond to various stress conditions. Moreover, each ClTPS gene contains different stress response elements, indicating that different signals may induce each gene. The ClTPS5 gene has the largest number of hormone-responsive cis-acting elements, consistent with the highest expression level in the tissues. Many cis-acting elements involved in drought-inducibility and anaerobic induction were identified in the ClTPS3 gene, in agreement with the high expression level under osmotic stress. Studies have demonstrated that an important feature of drought and salt stress is cell osmosis, which leads to ABA accumulation as an adaptive response [64]. Meanwhile, the relationship between ScTPS and ABA signals in sugarcane indicated the role of ScTPS in drought tolerance [65]. Most of the ClTPS genes also had ABA cis-acting elements, suggesting their roles in the drought stress response.
Studies have shown that high temperature, high salt concentration, and drought stress significantly increased the expression levels of TPS1 and TPS7 genes in potatoes, suggesting the role of the TPS gene in the signal transduction pathway of stress tolerance [13]. Similarly, the expression level of PhTPS6 in petunia was significantly upregulated after 12 h of low-temperature treatment, with a gradual increase in the expression level with the treatment time [66]. PhTPS6 showed the same expression pattern after NaCl treatment, suggesting its role under low temperature and salt stress [66]. A recent study in sugarcane showed that salt and drought induced the expression of the ScTPS1 gene, which indicated that sugarcane maintained the cell osmotic stability by increasing trehalose-6-phosphate production and alleviated the simulated stress. These observations suggested that genetic engineering of endogenous ScTPS1 gene involved in trehalose biosynthesis may improve the drought tolerance of sugarcane [13]. Similarly, salt stress markedly induced ClTPS3 (Figure 6 and Figure 7). Previous studies had proved that trehalose could improve the salt tolerance of plants by increasing the activity of antioxidant enzymes, and it was found that the activities of SOD, CAT, POD were positively correlated with the salt tolerance of plants [29,67]. In addition, trehalose significantly reduced the accumulation of MDA in tomato, indicating that trehalose can reduce the degree of cell membrane damage and improve the salt tolerance of tomato [68]. In this study, the trehalose content of ClTPS3 transgenic A.thaliana plants was significantly increased, and the activities of SOD and POD were also significantly increased. In addition, the MDA content was significantly decreased, while the relative water content was significantly increased, indicating that ClTPS3 played an important role in the salt tolerance of watermelon. Furthermore, the results of STRING functional protein association networks showed that ClMYB and ClbHLH transcription factors most likely regulated only ClTPS3 among the seven ClTPS genes. These results indicate a putative role of ClTPS3 in watermelon response to various abiotic stresses. Therefore, effective use of the ClTPS3 gene may help watermelon maintain growth and production under salt stress.

4. Materials and Methods

4.1. Identification and Characterization Analysis of Putative Watermelon TPS Genes

In this study, 11 AtTPS protein sequences and 11 OsTPS protein sequences [44] were used to blast against the CuGenDB (http://cucurbitgenomics.org/organism/21) (accessed on 20 Octomber 2021) [69] to identify TPS genes of watermelon. The Conserved Domains database (https://www.ncbi.nlm.nih.gov/Structure/cdd/wrpsb.cgi) (accessed on 8 June 2021) was used to ensure that all candidate TPSs contained the TPS domain. In addition, the online software ExPASy Proteomics Server (http://web.expasy.org/protparam/) (accessed on 8 June 2021) was used to analyze the molecular weight, length, and isoelectric point of the watermelon TPS proteins [70], and the online software Cell-PLoc (http://www.csbio.sjtu.edu.cn/bioinf/Cell-PLoc-2/) (accessed on 8 June 2021) was used to predict their subcellular localization [71].

4.2. Chromosomal Localization, Phylogenetic Analysis, Duplication Events, and Collinearity Analysis of ClTPS Genes

The chromosomal distribution of ClTPSs was derived from CuGenDB. The TBtools software [72] was used to determine the chromosome localization and the ClTPSs duplication events. Furthermore, 77 protein sequences of various species, including watermelon, Populous, Cucumis melo, Malus domestica, A. thaliana, Oryza sativa, Glycine max, and Triticum aestivum, were used to construct the phylogenetic tree. Amino acid sequence alignment was carried out using Clustal W [73], and then the phylogenetic trees were constructed following the neighbor-joining (NJ) method with 1000 bootstrap using the MEGA 7.0 software [74]. TPS genes duplication events, collinearity, and selective evolutionary pressure were analyzed using the TBtools software [72].

4.3. Analysis of ClTPS Gene Structures and Conserved Motifs

The structure (exon-intron arrangement) of ClTPS genes was obtained from CuGenDB and visualized using TBtools. Then, the putative conserved motifs of ClTPS protein sequences were analyzed using the MEME program (http://meme-suite.org/tools/meme) (accessed on 8 June 2021), with any number of repetitions, a maximum of 20 motifs; and an optimum width of each motif between 6 and 60 residues [75]; the conserved domains were visualized using TBtools.

4.4. Analysis of Cis-Acting Elements

TBtools was used to extract the 2000 bp sequences upstream of the transcriptional start site (ATG) of the ClTPS genes as the putative promoter region; these sequences were submitted to Plantcare (http://bioinformatics.psb.ugent.be/webtools/plantcare/html/) (accessed on 8 June 2021) to identify the cis-acting elements in the promoter region.

4.5. Tissue-Specific Expression Patterns and Expression Levels under Different Stresses of ClTPS Genes

The data of different tissues, including flower (GSE69073), fruit (PRJNA338036), stem (SRP012853), leaf (PRJNA381300), and root (PRJNA641525), and under different stresses, such as drought (GSE144814), osmotic stress (PRJNA381300), heat shock (PRJNA504354) and cold (PRJNA328189), were retrieved from the NCBI database (https://www.ncbi.nlm.nih.gov/) (accessed on 22 June 2021). The data were first downloaded from the SRA database, converted into fastq format, and uploaded into the Kallisto Super Wrapper of TBtools to obtain the transcript expression matrix. Finally, the gene expression matrix was obtained from the transcript expression matrix using the Trans Value Sum of TBtools. Furthermore, hierarchical clustering and heatmap of ClTPS genes were generated using TBtools.

4.6. Plant Growth and Treatments

Watermelon (“HQ-2” variety) seedlings were maintained in Hoagland solution in a growth chamber at 25 °C under a photoperiod of 16 h light/8 h dark. After growing for 30 days, the seedlings were grown hydroponically in Hoagland solution containing 0 (control), 50, 100, 150, 200, or 250 mM NaCl; thirty seedlings were maintained per treatment. Control plants (were cultured in standard Hoagland solution) were cultured in parallel. Seedlings were sampled after 3 days of salt treatment. In addition, samples under 200 mM NaCl were collected at 0, 0.5, 6, 24, 48, and 72 h. Finally, all the samples were immediately frozen in liquid nitrogen and stored at −80 °C until for RNA extraction. Three seedlings were mixed into one sample, and three biological replicates were maintained per treatment.

4.7. RNA Extraction and Quantitative Real-Time-PCR

Total RNA was isolated using the Plant RNA Kit (Huayueyang, Beijing, China) according to the manufacturer’s protocol. The first strand of cDNA was obtained using a PrimeScript RT reagent Kit (TaKaRa, Dalian, China). qRT-PCR was performed on the Light Cycler480 Real-Time System (Bio-Rad Laboratories) with the method described previously [61]. ClActin was used as the reference gene, and the specific primers are shown in Supplementary Table S3. The data were analyzed using the 2−ΔΔCt method [76].

4.8. Functional Analysis of ClTPS3 Gene

The coding sequence of ClTPS3 (Cla97C05G107320.1) was inserted into the plant transformation vector pRI101-AN at Nde I-Kpn I sites to generate the ClTPS3-overexpressing recombinant vector, and the specific primer sequences used for PCR amplification were as follows: 5′-CATATGATGGCATCAAGATCCCCCAC-3′ and 5′-GGTACCTCAAAAAACACTCTCAAAAGAAACAC-3′. The construct was transformed into Agrobacterium tumefaciens strain GV3101.
The Agrobacterium dipping flower method was employed to infect A. thaliana [77]. The seeds of the overexpressed homozygote and the wild-type A. thaliana were disinfected and seeded on the MS medium and cultured under normal light. The overexpressed (OE) and wild-type A.thaliana (CK) plants were transferred to an MS medium containing 200 mM NaCl for stress treatment. After 7 days, the root length was measured using a vernier caliper (SHRN 0–300 mm, Guilin, China), and at least ten seedlings were measured for each line. In addition, the 3-week-old OE and CK seedlings were treated with 200 mM NaCl for 7 days, then three seedlings were sampled for the fresh weight (FW), dry weight (DW) and relative water content (RWC) measurement, and ten seedlings were immediately frozen in liquid nitrogen and stored at −80 °C until for RNA extraction and indexes analysis.
Furthermore, the trehalose, MDA, POD, and SOD content were determined using BC0330 (Solarbio, Beijing, China), KTB1050, KTB1150, and KTB1030 (Abbkine, Beijing, China) kits, respectively. The absorbance was measured using the SpectraMax i3X Multi-mode Detection Platform Molecular Devices (Molecular Devices, China).
All data were statistically analyzed using three biological replicates and expressed as mean values ± standard deviation (SD). SPSS 18.0 statistical software was used for variance analysis, and differences were considered statistically significant at a p-value of 0.05 (p < 0.05).

4.9. Functional Protein Association Networks of ClTPS Genes

A TPS-related functional protein association network was built using the online software STRING (http://stringdb.org) (accessed on 1 May 2021) using the TAIR gene ID of genes related to TPS. The amino acid sequences of the MYB transcription factors and bHLH transcription factors were derived from the articles of Wang [45] and He [46]. The gene ID of A. thaliana may be responsible for multiple members in watermelon. The transcription factors with the highest amino acid identity were selected (Table S4). The confidence level of minimum required interaction score parameters was set at 0.25.

5. Conclusions

In this study, a total of seven TPS genes were identified through genome-wide analysis in watermelon, divided into two groups, and located on seven chromosomes. Tissue-specific expression and stress response analysis showed diversity and specificity in the expression patterns of ClTPSs in different tissues and under various stresses. The ClTPS3 gene was highly expressed under salt stress, suggesting an essential role in watermelon’s response to salt stress. Our results will help to lay a foundation for further understanding the structures and characteristics of the TPS gene family and improving the efficiency of watermelon breeding.

Supplementary Materials

The following are available online at https://www.mdpi.com/article/10.3390/ijms23010276/s1.

Author Contributions

Conceptualization, G.Y., Y.Z. and D.S.; methodology, G.Y.; software, G.Y. and Y.Z.; validation, G.Y.; formal analysis, G.Y.; investigation, G.A. and W.L; resources, G.A., W.L. and W.S.; data curation, G.Y.; writing—original draft preparation, G.Y.; writing—review and editing, Y.Z. and D.S.; visualization, G.Y.; supervision, Y.Z., J.L. and D.S.; project administration, G.Y., Y.Z., J.L. and D.S.; funding acquisition, G.Y., Y.Z., J.L. and D.S. All authors have read and agreed to the published version of the manuscript.

Funding

This research was funded by grants from the China Agriculture Research System of MOF and MARA (CARS-25); Central Public-interest Scientific Institution Basal Research Fund (1610192021308); Province Key Scientific and Technological Project in Henan (202102110194, 212102110424); Special Scientific Research Service Fee of the Chinese Academy of Agricultural Sciences (Y2019XK16-03); the Agricultural Science and Technology Innovation Program (CAAS-ASTIP-2021-ZFRI); screening and technical demonstration and popularization of fruit and melon varieties in Xinjiang (Y2021XK14); special funds for basic research and special basic research (20131415).

Institutional Review Board Statement

Not applicable.

Informed Consent Statement

Not applicable.

Data Availability Statement

Not applicable.

Conflicts of Interest

The authors declare no conflict of interest.

Abbreviations

T6Ptrehalose-6-phosphate
UDPGuridine diphosphate glucose
TPStrehalose-6-phosphate synthetase
TPPtrehalose-6-phosphate phosphatase
TREtrehalase
SODsuperoxide dismutase
APXascorbic acid peroxidase
PODperoxidase
CATcatalase
MDAmalondialdehyde
O2-superoxide anion
PROproline
ROSreactive oxygen species
ORFopen reading frame
pIisoelectronic point
MWsmolecular weights
NJneighbor-joining
FWfresh weight
DWdry weight
RWCrelative water content

References

  1. Elbein, A.D. New insights on trehalose: A multifunctional molecule. Glycobiology 2003, 13, 17–27. [Google Scholar] [CrossRef]
  2. Feofilova, E.P.; Usov, A.I.; Mysyakina, I.S.; Kochkina, G.A. Trehalose: Chemical structure, biological functions, and practical application. Microbiology 2014, 83, 184–194. [Google Scholar] [CrossRef]
  3. Wang, Y.W.; Quan, S.J.; Ma, H.; Liu, D.H.; Xie, F.H. Review on the mechanism of trehalose protecting plant tissues and animal cells. Jiangsu Agric. Sci. 2019, 47, 14–18. [Google Scholar]
  4. Park, M.; Mitchell, W.J.; Rafii, F. Effect of trehalose and trehalose transport on the tolerance of Clostridium perfringens to environmental stress in a wild type strain and its fluoroquinolone-resistant mutant. Int. J. Microbiol. 2016, 48, 29716. [Google Scholar]
  5. Tian, T.; Gang, Z.; Dan, H.; Zhu, K.; Chen, D.; Zhang, Z.; Wei, Z.; Cao, Y.; Zhou, P. Effects of vitrification cryopreservation on follicular morphology and stress relaxation behaviors of human ovarian tissues: Sucrose versus trehalose as the non-permeable protective agent. Hum. Reprod. 2015, 30, 877–883. [Google Scholar] [CrossRef] [Green Version]
  6. Schluepmann, H.; Dijken, A.V.; Aghdasi, M.; Wobbes, B.; Smeekens, P.S. Trehalose Mediated Growth Inhibition of Arabidopsis Seedlings Is Due to Trehalose-6-Phosphate Accumulation. Plant Physiol. 2004, 135, 879–890. [Google Scholar] [CrossRef] [Green Version]
  7. O’Hara, L.E.; Paul, M.J.; Wingler, A. How Do Sugars Regulate Plant Growth and Development? New Insight into the Role of Trehalose-6-Phosphate. Mol. Plant 2013, 6, 261–274. [Google Scholar] [CrossRef] [Green Version]
  8. Fernandez, O.; Vandesteene, L.; Feil, R.; Baillieul, F.; Lunn, J.E.; Clément, C. Trehalose metabolism is activated upon chilling in grapevine and might participate in Burkholderia phytofirmans induced chilling tolerance. Planta 2012, 236, 355–369. [Google Scholar] [CrossRef]
  9. Zhang, W.; Wang, Y.F.; Guo, Y.P. Review on crosstalk regulation involving in trehalose-6-phosphate signal in plant. Plant Physiol. J. 2016, 52, 394–400. [Google Scholar]
  10. Paul, M. Trehalose 6-phosphate. Curr. Opin. Plant Biol. 2007, 10, 303–309. [Google Scholar] [CrossRef]
  11. Eastmond, P.J.; Graham, I.A. Trehalose metabolism: A regulatory role for trehalose-6-phosphate? Curr. Opin. Plant Biol. 2003, 6, 231–235. [Google Scholar] [CrossRef]
  12. Dan, Y.; Niu, Y.; Wang, C.; Yan, M.; Liao, W. Genome-wide identification and expression analysis of the trehalose-6-phosphate synthase (TPS) gene family in cucumber (Cucumis sativus L.). PeerJ 2021, 9, e11398. [Google Scholar] [CrossRef]
  13. Xu, Y.C.; Wang, Y.J.; Mattson, N.; Yang, L.; Jin, Q. Genome-wide analysis of the Solanum tuberosum (potato) trehalose-6-phosphate synthase (TPS) gene family: Evolution and differential expression during development and stress. BMC Genom. 2017, 18, 926. [Google Scholar] [CrossRef]
  14. Garg, A.; Owens, T.; Setter, T.; Miller, W.; Kim, J.K.; Kochian, L.; Wu, R. Trehalose Accumulation in Rice, Maize, and Wheat Plants Confers High Tolerance Levels to Different Abiotic Stresses. In Vitro Cell Dev. 2010, 46, S204. [Google Scholar]
  15. Miranda, J.A.; Avonce, N.; Suárez, R.; Thevelein, J.M.; Dijck, P.V.; Iturriaga, G. A bifunctional TPS-TPP enzyme from yeast confers tolerance to multiple and extreme abiotic-stress conditions in transgenic Arabidopsis. Planta 2007, 226, 1411–1421. [Google Scholar] [CrossRef] [Green Version]
  16. Jang, I.C.; Oh, S.J.; Seo, J.S.; Choi, W.-B.; Song, S.I.; Kim, C.H.; Kim, Y.S.; Seo, H.S.; Choi, Y.D.; Nahm, B.H.; et al. Expression of a bifunctional fusion of the Escherichia coli genes for trehalose-6-phosphate synthase and trehalose-6-phosphate phosphatase in transgenic rice plants increases trehalose accumulation and abiotic stress tolerance without stunting growth. Plant Physiol. 2003, 2, 516–524. [Google Scholar] [CrossRef] [PubMed] [Green Version]
  17. Jia, W.L.; Hu, Y.L.; Zhang, Y.Q.; Yang, L.L.; Lin, Z.P.; Wu, Q. Transformation of trehalose synthase gene (TPS Gene) into Perennial Ryegrass and identification of drought tolerance. Mol. Plant Breed. 2007, 5, 27–31. [Google Scholar]
  18. Guo, B.; Hu, L.; He, X.; Chen, X.M.; Jiang, X.N. Trehalose-6-phosphate synthase transgenic tobacco enhanced tolerance to salt stress. Chin. Bull. Bot. 2008, 25, 41–49. [Google Scholar]
  19. Zhou, B.H. Cloning and Functional Characterization of the Trehalose-6-Phosphate Synthase Gene Family in Hevea Brasiliensis; Hainan University: Hainan, China, 2017. [Google Scholar]
  20. Zhang, Y.Q.; Dong, C.L.; Yang, L.L.; Liang, G.M.; Li, J.; Yang, R.; Chang, J.Z.; Zhao, Q.H.; Zhang, M.Y. Study on transformation of trehalose synthase gene tps to maize and their drought resistance. J. Shanxi Agric. Sci. 2016, 44, 1–4. [Google Scholar]
  21. Choi, Y.; Cho, K.W.; Jeong, K.; Jung, S. Molecular dynamics simulations of trehalose as a ‘dynamic reducer’ for solvent water molecules in the hydration shell. Carbohydr. Res. 2006, 341, 1020–1028. [Google Scholar] [CrossRef]
  22. Zhang, Y.H.; Ji, B.P.; Ling, P.X.; Meng, Y. Protective effects and mechanisms oftrehalose and hyaluronic acid on membrane lipid bilayer. Food Sci. 2007, 28, 31–37. [Google Scholar]
  23. Wang, Z.H.; Kong, D.J.; Chen, L.L.; Wu, C.; Chen, H.; Yang, Z.X.; Wei, K.S.; Lin, Y.C. Effects of exogenous trehalose on chlorophyll metabolism and chloroplast development under low nitrogen condition. J. South. Agric. 2019, 50, 1191–1196. [Google Scholar]
  24. Lin, Y.C.; Zhang, J.; Gao, W.; Chen, Y.; Li, H.; Lawlor, D.W.; Paul, M.J.; Pan, W. Exogenous trehalose improves growth under limiting nitrogen through upregulation of nitrogen metabolism. BMC Plant Biol. 2017, 17, 247. [Google Scholar] [CrossRef] [PubMed] [Green Version]
  25. Jing, E.E. Effects of Choline Chloride and Trehalose on the Growth and Development of Wheat under Low Temperature Conditions; Henan Agricultural University: Zhengzhou, China, 2018. [Google Scholar]
  26. Xie, D.W. Analysis on Gene Expression Profile and Trehalose Gene Family in Winter Wheat under Low Temperature; Northeast Agricultural University: Harbin, China, 2014. [Google Scholar]
  27. Liu, X. Physiological Effects of Exogenous Treha Lose on Chilling Tolerance of Roots of Maize Seedlings; Northeast Agricultural University: Harbin, China, 2018. [Google Scholar]
  28. Long, Y.L. Analysis of Gene Expression Profile in Diploidy and Autotetraploidy Watermelon and Preliminary Study on the Mechanism of Trehalose Resistance; Hainan University: Haikou, China, 2017. [Google Scholar]
  29. Ye, Y.X.; Lu, D.L.; Wang, F.B.; Chen, X.H.; Qi, M.Y.; He, R.; Lu, W.P. Effects of exogenous trehalose on physiological characteristics in waxy maize seedlings under drought stress. J. Maize Sci. 2020, 28, 80–86. [Google Scholar]
  30. Wang, W.J.; Zhang, L.; Yu, M.F.; Wang, P.T. Research progress of trehalose in regulating plant response to abiotic stress. Mol. Plant Breed. 2020, 18, 3433–3440. [Google Scholar]
  31. Ding, S.H. Effect of Exogenous Trehalose on Salt Tolerance of Wheat; Shandong Normal University: Jinan, China, 2001. [Google Scholar]
  32. Liu, F.Z.; Wang, N. Effects of exogenous trehalose on growth of Glycyrrhiza uralensis seedlings and total flavonoid content under salt stress. Chin. Tradit. Herb. Drugs 2020, 51, 6345–6353. [Google Scholar]
  33. Yan, D.L.; Zheng, B.S. Effects of soaking seeds in trehalose on physiological characteristics of wheat Yangmai-19 under salt stress. Acta Agric. Zhejiangensis 2016, 28, 1271–1276. [Google Scholar]
  34. Hu, H.F. The effect of exogenous trehalose on cold resistance of cucumber seedlings. North. Hortic. 2008, 2, 11–13. [Google Scholar]
  35. Hu, H.F.; Ma, Y.H. A study on exgenous trehalose improving droughty resistance of cucumber. J. Shenyang Agric. Univ. 2008, 39, 83–85. [Google Scholar]
  36. Li, J.G.; Pu, L.J.; Zhu, M.; Zhang, R.S. The present situation and hot issues in the salt-affected soil research. Acta Geogr. Sinaca 2012, 67, 1233–1245. [Google Scholar]
  37. Vincent, D.; Ergül, A.; Bohlman, M.C.; Tattersall, E.A.R.; Tillett, R.L.; Wheatley, M.D.; Woolsey, R.; Quilici, D.R.; Joets, J.; Schlauch, K.; et al. Proteomic analysis reveals differences between Vitis vinifera L. cv. Chardonnay and cv. Cabernet Sauvignon and their responses to water deficit and salinity. J. Exp. Bot. 2007, 58, 1873–1892. [Google Scholar] [CrossRef] [Green Version]
  38. Wang, J.L.; Huang, X.J.; Zhong, T.Y.; Chen, Z.G. Review on sustainable utilization of salt-affected land. Acta Geogr. Sinaca 2011, 66, 673–684. [Google Scholar]
  39. Zhang, K.; Li, M.N.; Cao, S.H.; Sun, Y. The research advances of molecular mechanisms of plant in responding to salt stress. Acta Agrestia Sin. 2017, 25, 226–235. [Google Scholar] [CrossRef]
  40. Chen, J.; Lin, Q.F. Progress on salt tolerance physiology and mechanism of plants. Nat. Sci. J. Hainan Univ. 2003, 21, 177–182. [Google Scholar]
  41. Yang, S.H.; Ji, J.; Wang, G.; Song, Y.J. Research progress on the effects of salt stress on plants. Mol. Plant Breed. 2006, 4, 139–142. [Google Scholar]
  42. Munns, R. Physiological processes limiting plant growth in saline soils: Some dogmas and hypotheses. Plant Cell Environ. 2010, 16, 15–24. [Google Scholar] [CrossRef]
  43. Zhu, Y.C.; Sun, D.X.; Liu, J.P.; Sun, X.W. Effects of chitosan oligosaccharides on watermelon seedlings with different salt tolerance under NaCl stress. J. Fruit Sci. 2020, 37, 866–874. [Google Scholar]
  44. Yang, H.L.; Liu, Y.J.; Wang, C.L.; Zeng, Q.Y.; Natarajan, K. Molecular Evolution of Trehalose-6-Phosphate Synthase (TPS) Gene Family in Populus, Arabidopsis and Rice. PLoS ONE 2012, 7, e42438. [Google Scholar] [CrossRef]
  45. Wang, J. Expression of Duplicated ClR2R3-MYB Genes in Watermelon Response to Low Temperature Stress; Huazhong Agricultural University: Wuhan, China, 2019. [Google Scholar]
  46. He, J.; Gu, X.R.; Wei, C.H.; Yang, X.Z.; Li, H.; Ma, J.X.; Zhang, Y.; Yang, J.Q.; Zhang, X. Identification and expression analysis under abiotic stresses of the bHLH transcription factor gene family in watermelon. Acta Hortic. Sin. 2016, 43, 281–294. [Google Scholar]
  47. Guo, S.; Zhang, J.; Sun, H.; Salse, J.; Lucas, W.J.; Zhang, H.; Zheng, Y.; Mao, L.; Ren, Y.; Wang, Z. The draft genome of watermelon (Citrullus lanatus) and resequencing of 20 diverse accessions. Nat. Genet. 2013, 45, 51–58. [Google Scholar] [CrossRef] [Green Version]
  48. Hurst, L.D. The Ka/Ks ratio: Diagnosing the form of sequence evolution. Trends Genet. 2002, 18, 486. [Google Scholar] [CrossRef]
  49. Song, J.; Gao, Z.; Huo, X.; Sun, H.; Xu, Y.; Shi, T.; Ni, Z. Genome-wide identification of the auxin response factor (ARF) gene family and expression analysis of its role associated with pistil development in Japanese apricot (Prunus mume Sieb. et Zucc). Acta Physiol. Plant 2015, 37, 145. [Google Scholar] [CrossRef]
  50. Wang, X.; Shi, X.; Hao, B.; Ge, S.; Luo, J. Duplication and DNA segmental loss in the rice genome: Implications for diploidization. New Phytol. 2005, 165, 937–946. [Google Scholar] [CrossRef]
  51. Lunn, J.E. Gene families and evolution of trehalose metabolism in plants. Funct. Plant Biol. 2007, 34, 550–563. [Google Scholar] [CrossRef]
  52. Ramon, M.; De Smet, I.; Vandesteene, L.; Naudts, M.; Leyman, B.; Van Dijck, P.; Rolland, F.; Beeckman, T.; Thevelein, J.M. Extensive expression regulation and lack of heterologous enzymatic activity of the Class II trehalose metabolism proteins from Arab. Thaliana. Plant Cell Environ. 2009, 32, 1015–1032. [Google Scholar] [CrossRef]
  53. Chary, S.N.; Hicks, G.R.; Choi, Y.G.; Carter, D.; Raikhel, N.V. Trehalose-6-Phosphate Synthase/Phosphatase Regulates Cell Shape and Plant Architecture in Arabidopsis. Plant Physiol. 2008, 146, 97–107. [Google Scholar] [CrossRef] [Green Version]
  54. Vandesteene, L.; Ramon, M.; Roy, K.L.; Dijck, P.V.; Rolland, F. A single active trehalose-6-P synthase (TPS) and a family of putative regulatory TPS-like proteins in Arabidopsis. Mol. Plant 2010, 3, 406–419. [Google Scholar] [CrossRef]
  55. Zang, B.; Li, H.; Li, W.; Deng, X.W.; Wang, X. Analysis of trehalose-6-phosphate synthase (TPS) gene family suggests the formation of TPS complexes in rice. Plant Mol. Biol. 2011, 76, 507–522. [Google Scholar] [CrossRef]
  56. Yeo, E.T.; Kwon, H.B.; Han, S.E.; Lee, J.T.; Ryu, J.C.; Byu, M.O. Genetic engineering of drought resistant potato plants by introduction of the trehalose-6-phosphate synthase (TPS1) gene from Saccharomyces cerevisiae. Mol. Cells 2000, 10, 263–268. [Google Scholar] [PubMed]
  57. Li, H.W.; Zang, B.S.; Deng, X.W.; Wang, X.P. Overexpression of the trehalose-6-phosphate synthase gene OsTPS1 enhances abiotic stress tolerance in rice. Planta 2011, 234, 1007–1018. [Google Scholar] [CrossRef]
  58. Li, Y.; Liu, S.K. Cloning of a TPS gene and analysis of its function in stress tolerance in Puccinellia tenuiflora. Acta Prataculturae Sin. 2015, 24, 99–106. [Google Scholar]
  59. Shi, J.W.; Xu, Y.; Ji, D.H.; CHen, C.S.; Xie, C.T. Cloning and expression analysis of trehalose-6-phosphate synthase (TPS) family genes from Pyropia haitanensis. J. Fish. China 2015, 39, 485–495. [Google Scholar]
  60. Jiang, W. Functional Identification and Diferential Expression Analysis of Trehalose-6-Phosphate Synthase Gene Family in Maize; Sichuan Agricultural University: Yaan, China, 2010. [Google Scholar]
  61. Yuan, G.P.; He, S.S.; Bian, S.X.; Han, X.L.; Liu, K.; Cong, P.H.; Zhang, C.X. Genome-wide identification and expression analysis of major latex protein (MLP) family genes in the apple (Malus domestica Borkh.) genome. Gene 2020, 733, 144275. [Google Scholar] [CrossRef]
  62. Reddy, A.S.N.; Marquez, Y.; Kalyna, M.; Barta, A. Complexity of the alternative splicing landscape in plants. Plant Cell 2013, 25, 3657–3683. [Google Scholar] [CrossRef] [Green Version]
  63. Baek, J.M.; Han, P.; Iandolino, A.; Cook, D.R. Characterization and comparison of intron structure and alternative splicing between Medicago truncatula, Populus trichocarpa, Arabidopsis and rice. Plant Mol. Biol. 2008, 67, 499. [Google Scholar] [CrossRef]
  64. Bartels, D.; Sunkar, R. Drought and salt tolerance in plants. Crit. Rev. Plant Sci. 2005, 24, 23–58. [Google Scholar] [CrossRef]
  65. Hu, X.; Wu, Z.D.; Luo, Z.Y.; Burner, D.M.; Wu, C.W. Genome-Wide Analysis of the Trehalose-6-Phosphate Synthase (TPS) Gene Family and Expression Profiling of ScTPS Genes in Sugarcane. Agronomy 2020, 10, 969. [Google Scholar] [CrossRef]
  66. Wang, Q.; Liu, T.R.; Liu, N.; Xiong, F.; Zhang, S.M.; Dong, L.L. Colning and expression analysis of trehalose 6 phosphate synthase g ene phtps6 from petunia hybrida. Acta Agric. Boreali Occident. Sin. 2019, 28, 273–278. [Google Scholar]
  67. Husen, A.; Iqbal, M.; Aref, I.M. IAA-induced alteration in growth and photosynthesis of pea (Pisum sativum L.) plants grown under salt stress. J. Environ. Biol. 2016, 37, 421–429. [Google Scholar]
  68. Chen, X.Y. Effect of Exogenous Trehalose on Sugar Metabolism Response to Salt Stress in Tomato Seedlings; Tianjin University: Tianjin, China, 2016. [Google Scholar]
  69. Guo, S.G.; Zhao, S.J.; Sun, H.H.; Wang, X.; Wu, S.W.; Lin, T.; Ren, Y.; Gao, L.; Deng, Y.; Zhang, J.; et al. Resequencing of 414 cultivated and wild watermelon accessions identifies selection for fruit quality traits. Nat. Genet. 2019, 51, 1616–1623. [Google Scholar] [CrossRef]
  70. Artimo, P.; Jonnalagedda, M.; Arnold, K.; Baratin, D.; Csardi, G.; Decastroe, E.; Duvaud, S.; Flege, L.V.; Fortier, A.; Gasteiger, E. ExPASy: SIB bioinformatics resource portal. Nucleic Acids Res. 2012, 40, 597–603. [Google Scholar] [CrossRef] [PubMed]
  71. Chou, K.C.; Shen, H.B. Cell-PLoc 2.0: An improved package of web-servers for predicting subcellular localization of proteins in various organisms. Nat. Sci. 2010, 2, 1090–1103. [Google Scholar] [CrossRef] [Green Version]
  72. Chen, C.J.; Chen, H.; Zhang, Y.; Thomas, H.R.; Frank, M.H.; He, Y.H.; Xia, R. TBtools: An Integrative Toolkit Developed for Interactive Analyses of Big Biological Data. Mol. Plant 2020, 13, 1194–1202. [Google Scholar] [CrossRef]
  73. Thompson, J.D.; Gibson, T.J.; Higgins, D.G. Multiple Sequence Alignment Using ClustalW and ClustalX. Chapter 2, Unit 2.3. Curr. Protoc. Bioinform. 2002, 1, 2–3. [Google Scholar]
  74. Sudhir, K.; Glen, S.; Koichiro, T. MEGA7: Molecular Evolutionary Genetics Analysis Version 7.0 for Bigger Datasets. Mol. Biol. Evol. 2016, 33, 1870–1874. [Google Scholar]
  75. Bailey, T.L.; Mikael, B.; Buske, F.A.; Martin, F.; Grant, C.E.; Luca, C.; Ren, J.; Li, W.W.; Noble, W.S. MEME Suite: Tools for motif discovery and searching. Nucleic Acids Res. 2009, 37, 202–208. [Google Scholar] [CrossRef]
  76. Kenneth, J.L.; Thomas, D.S. Analysis of relative gene expression data using real-time quantitative PCR and the 2−ΔΔCT method. Methods 2002, 25, 402–408. [Google Scholar]
  77. Clough, S.J.; Bent, A.F. Floral dip: A simplified method for Agrobacterium-mediated transformation of Arab. Thaliana Plant J. 1998, 16, 735–743. [Google Scholar] [CrossRef] [Green Version]
Figure 1. Chromosomal location of ClTPS genes and collinearity analysis of A. thaliana, watermelon and melon. (A) Chromosomal location of ClTPS genes; (B) collinearity analysis of A. thaliana, watermelon and melon.
Ijms 23 00276 g001
Figure 2. Phylogenetic relationship of TPS proteins among watermelon and other seven species. All TPS proteins were divided into two subgroups, represented by two colors. The green color represents Class I protein, and the blue color represents Class II protein. The phylogenetic tree was constructed by MEGA7 software with 1000 bootstrap replicates, following the neighbor-joining method.
Ijms 23 00276 g002
Figure 3. Phylogenetic analysis, gene structure, and conserved motifs of ClTPSs. (A) Phylogenetic analysis of seven ClTPSs. (B) Exon/intron organization of ClTPSs. (C) Conserved motifs of ClTPSs.
Ijms 23 00276 g003
Figure 4. Cis-acting elements of ClTPSs. (A) Kind, quantity and position of cis-acting elements in ClTPSs; (B) numbers of cis-acting elements.
Ijms 23 00276 g004
Figure 5. Tissue-specific expression of ClTPSs. (A) The heatmap shown in the form of the whole plant. (B) The heatmap and cluster analysis of tissue-specific expression. The expression levels were derived from NCBI and visualized by TBtools; the dark green represents high expression level, and the light green represents low expression level.
Ijms 23 00276 g005
Figure 6. Expression analysis of ClTPSs under different NaCl concentrations. ClTPS2 expression was not detected. Error bars indicate the SD of three biological replicates. Different letters indicate significant differences within treatments by ANOVA (p < 0.05).
Ijms 23 00276 g006
Figure 7. Expression analysis of ClTPSs at different time points under 200 mM NaCl stress. ClTPS2 expression was not detected. Error bars indicate the SD of three biological replicates. Different letters indicated significant differences within treatments by ANOVA (p < 0.05).
Ijms 23 00276 g007
Figure 8. Phenotypic analysis of ClTPS3 overexpressed A.thaliana plants. (A) The expression level of ClTPS3 in different A.thaliana lines. (B) The growth status of wild type and transgenic seedlings under 200 mM NaCl stress, the white scale range represents 1 cm. (C) The root length of different A.thaliana lines under 200 mM NaCl stress. (D) The growth status of different A.thaliana lines adult plant under 200 mM NaCl stress. (E) Trehalose content of different A.thaliana lines. (F) Fresh weight, (G) dry weight, (H) relative water content, (I) MDA content, (J) POD activity and (K) SOD activity of different A.thaliana lines under 200 mM NaCl stress. CK represents wild-type A. thaliana plants, and OE1, OE2, and OE3 are transgenic A. thaliana plants. Error bars indicate the SD of three biological replicates. Different letters indicate significant differences within treatments by ANOVA (p < 0.05).
Ijms 23 00276 g008
Figure 9. Functional protein association networks using the TAIR accessions of MYB36 (At5g57620.1, ClMYB9, Cla97C01G017110.1); MYB78 (At5g49620.2, ClMYB69, Cla97C09G167270.1); MYB79 (At4g13480.1, ClMYB51, Cla97C05G084530.1); bHLH093 (At5g65640.1, ClbHLH93, Cla97C11G220830.1); AtTPS1 (At1g78580.1, ClTPS1, Cla97C11G223240.1); AtTPS2 (At1g16980.1, ClTPS7, Cla97C11G223240.1); AtTPS3 (At1g17000.1, ClTPS7, Cla97C11G223240.1); AtTPS4 (At4g27550.1, ClTPS7, Cla97C11G223240.1); AtTPS5 (At4g17770.1, ClTPS6, Cla97C10G186050.1); AtTPS6 (At1g68020.1, ClTPS6, Cla97C10G186050.1); AtTPS7 (At1g06410.1, ClTPS5, Cla97C07G130930.1); AtTPS8 (At1g70290.1, ClTPS3, Cla97C05G107320.1); AtTPS9 (At1g23870.1, ClTPS3, Cla97C05G107320.1). Blue lines represent gene interaction confidence (0 to 1); thick lines indicate confidence score higher than 0.85, while thin lines indicate confidence score between 0.26 and 0.84.
Ijms 23 00276 g009
Table 1. Characteristics of TPS family members in watermelon.
Gene
Name
Gene
ID
Length ORF
(bp)
No. of
Amino
Acids
TPS
Domain
Location
TPP
Domain
Location
Isoelectronic Point
(pI)
Molecular Mass
(kD)
Subcellular
Localization
ClTPS1Cla97C01G023850.1249683141–525574–8085.5794.10Chloroplast/Vacuole
ClTPS2Cla97C03G058540.1280293392–559593–8176.46105.37Cytoplasm/Vacuole
ClTPS3Cla97C05G107320.1258386058–545594–8286.1597.32Cytoplasm/Vacuole
ClTPS4Cla97C06G126510.1256885553–540589–8236.3897.23Chloroplast/Vacuole
ClTPS5Cla97C07G130930.1257185660–544593–8275.6697.47Vacuole
ClTPS6Cla97C10G186050.1259586463–548597–8295.8197.54Chloroplast/Vacuole
ClTPS7Cla97C11G223240.1278792894–561595–8166.39105.10Chloroplast/Vacuole
Publisher’s Note: MDPI stays neutral with regard to jurisdictional claims in published maps and institutional affiliations.

