Abstract
The cytogenetic and molecular assessment of deletions, amplifications and rearrangements are key aspects in the diagnosis and therapy of cancer. Not only the initial evaluation and classification of the disease, but also the follow-up of the tumor rely on these laboratory approaches. The therapeutic choice can be guided by the results of the laboratory testing. Genetic deletions and/or amplifications directly affect the susceptibility or the resistance to specific therapies. In an era of personalized medicine, the correct and reliable molecular characterization of the disease, also during the therapeutic path, acquires a pivotal role. Molecular assays like multiplex ligation-dependent probe amplification and droplet digital PCR represent exceptional tools for a sensitive and reliable detection of genetic alterations and deserve a role in molecular oncology. In this manuscript we provide a technical comparison of these two approaches with the golden standard represented by fluorescence in situ hybridization. We also describe some relevant targets currently evaluated with these techniques in solid and hematologic tumors.
1. Introduction
Fluorescence in situ hybridization (FISH) represents the reference method for gene deletion and amplification assessment. Today, this approach and its variants are still the gold standard in many genetics laboratories dealing with deletions and amplifications or rearrangements [1,2].
It is an informative and versatile technique that has been applied to the study of tumor protein 53 (TP53), human epidermal growth factor receptor 2 (HER2), anaplastic lymphoma kinase (ALK), baculoviral IAP repeat containing 3 (BIRC3), rearranged during transfection (RET) and many other targets during the years [1,3,4,5,6,7].
FISH presents some limitations and caveats though, first of all the relatively low sensitivity. Only large gene deletions or amplifications can be detected and quantified by the probes by immunofluorescence. Furthermore, FISH does not provide information on the fusion partner (when investigating gene rearrangements) and has been shown to be limited in specificity for common targets such as ALK [2]. The technique also bears the variability due to manual preparation of glasses and to the microscopy skills of the geneticists.
In recent years, some molecular techniques have been developed and tested successfully with the purpose of improving the copy number variation (CNV) detection and quantitation. Multiplex ligation-dependent probe amplification (MLPA), droplet digital PCR (ddPCR) and next-generation sequencing (NGS) encompass these techniques.
MLPA is an accurate and time-efficient approach to detect genomics deletions and insertions, which are frequently causes of cancers. MLPA can successfully detect the CNV of all exons within a gene simultaneously and with high sensitivity. Besides the detection of CNV and rearrangement assessments in cancers and other diseases, another application of MLPA is the analysis of the ploidy in human cells [8]. ddPCR is an innovative technique, mainly used for research purposes. This technique was developed to provide high-precision and absolute quantitation of nucleic acid target sequences. Several are the emerging application of ddPCR, such as: absolute quantitation, CNVs, detection of rare sequence, gene expression, microRNA analysis, library quantitation for next-generation sequencing (NGS) and genome editing detection (www.bio.rad.com (accessed on 1 April 2021)).
Targeted next-generation sequencing approaches (NGS) have proven to be affective in the detection of chromosomal aberrations like translocation of ALK and lysine methyltransferase 2A (KMT2A) in lung carcinoma, anaplastic large cell carcinoma and acute leukemias [9]. Sensitivity and specificity resulted to be similar to routine FISH with the advantage of single nucleotide breakpoint resolution and the well known capabilities of deep-sequencing to discover new variants. Furthermore, the NGS method demonstrated to have a very low rate of false positive detections [9]. NGS has been used also for the detection of hereditary deletions, for instance, of genes related to CRC [10].
However, some limits can be represented by variability in tumor cellularity, input DNA levels and sequencing coverage. Last but not least, NGS requires dedicated bioinformatics platforms and skills, which not all the routine laboratories can afford. Thus, next generation sequencing approaches deserve a dedicated review [9,11].
In the present manuscript, MLPA and ddPCR are reviewed. Relevant examples of solid and hematologic tumors like breast, lung and colon cancers in addition to chronic lymphocytic leukemia and gliomas are considered. The translational potential of ddPCR for the detection of copy number variations (CNVs) in several examples is reported and EMAP like 4-anaplastic lymphoma kinase-ALK (EML4-ALK) gene rearrangements in the molecular oncology field is commented.
2. Fluorescence in Situ Hybridization (FISH)
CNVs are notable sources of genetic variation in human DNA and result involved in a large number of diseases. For diagnostic purposes the main technique used in routine clinical laboratory is FISH [12,13,14].
FISH is an approach that uses fluorescently labeled DNA probes to detect chromosomal and cytogenetic alterations like aneusomy, duplication, amplification, deletion and translocation. There are four types of FISH probes: chromosome enumeration probes (CEPs), locus-specific indicator (LSI) probes, repetitive-sequence probes (RSPs) (centromeric and telomeric) and whole chromosome painting (WCP) [15].
FISH probes were first developed in the late 1970s [16,17,18]. Continuous improvements have been made since then. The latter involved the engineering of probes and protocols with the development of robotic platforms, multiple detection and greater sensitivity [19,20,21,22,23,24,25,26,27]. Continuous efforts have significantly improved the signal-to-noise ratio, sensitivity and reproducibility of FISH in various applications. However, little technical advancement has been achieved in simplifying the procedure. FISH remains a labor-intensive and time-consuming approach contemplating technically complex protocols despite the fact that robotic platforms have been developed at the state-of-the-art facilities [28,29]. The procedure is represented in Figure 1.
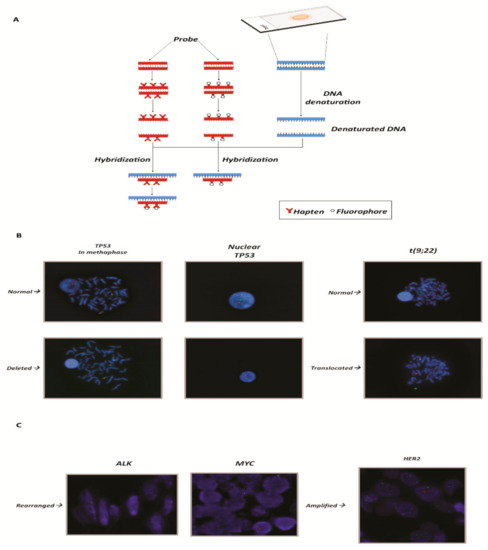
Figure 1.
(A) Graphical representation of the FISH technique: from the adhesion of the nucleic acid to the hybridization of the probes. (B) On the left panels, example of a gene deleted in chronic lymphocytic leukemia. The slides show the TP53 gene (17p13.1) represented by the red spot [cosmid probes for TP53 deletion (Cytocell)] and the control (centromere 17) by the green spot. In the normal nucleus and metaphase, the number of red spots is equal to the number of green spots and they are both diploid. In the deleted nucleus the number of red spots is equal to 1, instead of two. On the right panels, example of translocation in chronic myeloid leukemia. The translocation in question concerns the t(9;22) of the genes ABL (9q34.12) and BCR (22q11.21), known as the Philadelphia chromosome. In the upper slide a normal karyotype is represented. BCR and ABL are clearly distinguishable and highlighted by a dual fusion cosmid probes for BCR/ABL (ABL1) translocation. The lower slide shows the translocation: the two spots overlap and are displayed as a yellow spot. (C) Example of rearranged and amplified genes: on the left ALK and MYC genes, respectively, in cervical cancer and B-cell lymphoma. The rearrangement in FISH can be seen because the two spots, one that identifies the gene (red tag; LSI ALK dual color break apart probe (Vysis) and LSI MYC dual color break apart rearrangement probe (Vysis)) and one that identifies the centromere, which is used as a control (green tag), are distant. On the right panel, example of amplification of the HER2 gene in breast cancer. The red spots (identified in the images by dual color probe LSI HER2 spectrum orange) that identify HER2 gene are in a greater number compared to the green spots that identify the control, represented by centromere 17 (CEP17 Spectrum Green PathVysion Vysis). DAPI staining (blue) is used for the nuclei morphology in all the presented panels. The magnification is 63×.
3. Multiplex Ligation-Dependent Probe Amplification (MLPA)
MLPA is a multiplex amplifiable probe hybridization (MAPH)-related method developed by Mrc-Holland and presented for the first time in 2002. MLPA was developed to bypass the immobilization of the nucleic acid to the membrane, like Southern blot, that is difficult to introduce in routine diagnostics [30].
MLPA are based on a simple quantitative PCR reaction and can be performed using standard laboratory equipment. MLPA probes are comprised of a pair of single-stranded DNA half-probes that need to be joined by ligation before PCR amplification can occur. MLPA have been designed to determine, in one assay, the quantity and the copy number, of a set of specific sequences in a sample of interest. This technique allows the detection of deletions and duplications in genomic DNA in relation to specific genetic diseases. To achieve this, the method works with genomically unique sequences that hybridize to one target sequence only. After ligation, bound probes are coamplified and quantified. To discriminate the individual probes the original protocols encompass size separation by capillary electrophoresis. A MLPA probe set is designed so that the length of each of its amplification products is unique. In a diploid genome, a deletion will result in a 50% signal reduction of one or more probes while a duplication results in a 50% gain of signal [31,32,33,34].
The main advantages of MLPA can be summarized as follows:
- -
- It is a cost effective way to check for rearrangements, duplications and deletions;
- -
- It can be applied to a large number of targets (high throughput);
- -
- It can be performed on a large number of samples simultaneously;
- -
- It is reproducible, easy to perform, and it is capable of detecting a low quantity of the target;
- -
- It requires only 50 ng of human DNA, can distinguish sequences differing by a single nucleotide and can detect small copy number differences.
While being a very robust technique there are some limitations linked to MLPA. These limits are represented by inability to detect anomalies at the single cell level, inability to detect unknown point mutations, sensitivity to contaminants and to novel benign polymorphisms or to polymorphisms located near to a probe ligation site. The procedure is represented in Figure 2.
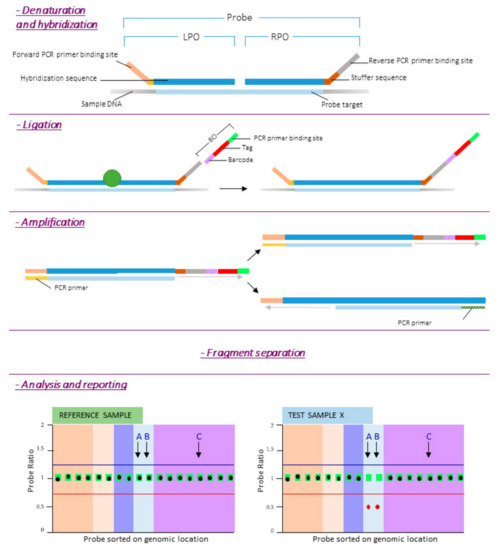
Figure 2.
MLPA procedure. Reference DNA samples are required to determine the relative copy number of each of the probes. After denaturation of the target DNA, the left and right probe oligos (LPO and RPO respectively) are hybridized to their target sequence overnight (at least 16 h). The next day, the two oligonucleotides are enzymatically ligated and a barcode oligo (BO) is incorporated into the amplicon for sample identification. After PCR, products are separated by length. Finally quality check is performed and probe ratios calculated. A probe ratio of 1.0 corresponds to a normal diploid copy number, a probe ratio of 0.5 to a heterozygous deletion.
4. Droplet Digital PCR (ddPCR)
Droplet digital PCR is a robust technique that enables accurate absolute quantification of target molecules at a high degree of sensitivity. It essentially combines the simplicity of traditional end-point PCR and the quantification features of the real-time quantitative PCR (qPCR) methodologies. Unlike qPCR, the quantitation is absolute and does not utilize standards for calibration, leading to a faster, more precise and reproducible process [35,36].
The term “digital-PCR” was first used in 1999 to describe the application of the technique to the detection of RAS mutations by partitioning the sample. Digital PCR represents an evolution of the previously developed “limiting dilution PCR”. Digital PCR uses fluorescence instead of gel electrophoresis for the endpoint detection and, eventually, became widespread in the biomedical field due to technological improvements [37,38].
The basic principle of ddPCR involves an emulsion chemistry, which consists of creating emulsions of aqueous droplets in an oil medium where each droplet functions as a PCR unit [39,40]. A DNA sample is fractionated in a high number of droplets (up to 20,000). Each droplet contains all the reagents necessary for a PCR reaction, and basically functions as a micro-PCR reactor. If the droplet contains the template of interest, PCR amplification yields a positive signal. If there is no template, there is no signal [36]. The data are acquired and plotted through a two-channel fluorometer, allowing multiplexing of target genes, hence the term “digital” [36].
Minimum information for publication of quantitative digital PCR experiments guidelines (MIQE) were eventually published, with the aim of standardizing the experimental protocols. Specific MIQE for ddPCR (dMIQE) have been described and updated in recent papers in order to match the technological improvements [41,42].
The most appreciated features of this system are:
- -
- Reproducibility of the data, given by the absolute quantitation of the target genes;
- -
- Sensitivity of the quantitation, obtained through the amplification into an emulsion matrix;
- -
- Very low amount of starting material requested for any of the possible applications, due to the high sensitivity of the technique.
- -
- The few disadvantages known up to now are:
- -
- ddPCR requires special and dedicated instrumentation;
- -
- ddPCR detects only known mutations.
- -
- The procedure is represented in Figure 3.
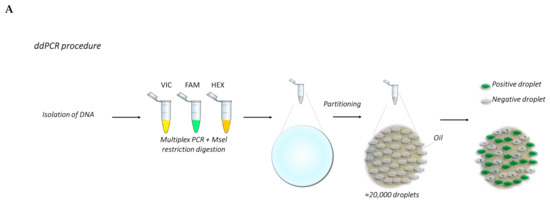
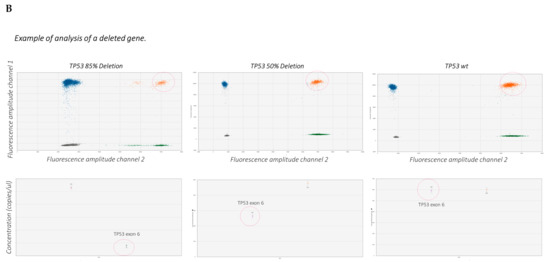 Figure 3. (A) Overview of the ddPCR procedure. (B) The graphs show examples of the analysis of TP53 CNV obtained from a previous work carried out by Frazzi and coauthors [43]. These graphs show the wild-type (wt) TP53 gene (right panel), TP53 with 50% deletion (middle panel) and 85% deletion (left panel). The increase in gene deletion corresponds to a decrease of the positive population (orange dots, red circled). The orange population is the double-positive one.
5. Protocols and Graphical Representation of the Described Techniques
5.1. FISH Protocol
5.1.1. Slide Preparation
- Starting material is either formalin-fixed, paraffin-embedded tissue, needle aspirates or cell slides;
- Incubate with 200 µL RNase for 1 h at 37 °C
- Wash slides in 2× saline-sodium citate buffer (SSC) for 5 min, repeat.
- Rinse slides in 10 mM HCl.
- Incubate with 200 µL pepsin for 10 min at 37 °C.
- Rinse slides in deionized H2O.
- Wash slides in 2× SSC for 5 min, repeat.
- Stabilize slides in paraformaldehyde for 10 min.
- Wash slides in 2× SSC for 5 min, repeat.
- Dehydrate slides in an ethanol series: 70%, 80% and 95%; 2 min each.
- Air dry.
5.1.2. Hybridization
- Prepare 30 µL hybridization solution per slide containing the specific probes for a target of interest. Heat to 70 °C for 10 min and place on ice.
- Place 30 µL of hybridization solution on each slide and cover with a plastic cover slip.
- Denature slide at 65–70 °C for 5 min on heat block.
- Gradually decrease temperature to 37 °C.
- Hybridize at 37 °C overnight in humidity chamber.
5.1.3. Detection
- Wash slides in 2× SSC to remove coverslip.
- Wash slides in wash buffer at 40 °C for 5 min, repeat.
- Wash slides in 0.1× SSC at 40 °C for 5–15 min.
- Wash slides in 2× SSC at 40 °C for 5–15 min.
- Cool slides to room temperature.
- Equilibrate slides in detection buffer for 5 min.
- Block in blocking buffer for 20–30 min.
- Incubate with 50 µL antibody or detection compound for 30–60 min (e.g., 5 µg/mL Streptavidin-Cy3 in blocking buffer).
- Wash slides in 2× SSC for 5 min, repeat twice.
- Counterstain with DAPI solution for 10 min.
- Rinse briefly and mount in antifade mounting medium.
- Analyze with a fluorescence microscope.
5.2. MLPA Protocol
- DNA denaturation:
- -
- Incubate 100 ng DNA sample in 5 μL of Tris-EDTA (pH 8) for 5 min at 98 °C.
- Probes hybridization to sample DNA:
- -
- Cool down the samples to room temperature;
- -
- Add 3 μL hybridization master mix;
- -
- In a thermal cycler incubate 1 min at 95 °C followed by 16 h at 60 °C.
- Ligation of hybridized probes:
- -
- Lower thermocycler temperature to 54 °C;
- -
- Add 32 μL Ligase-65 master mix, incubate 15 min at 54 °C;
- -
- Heat inactivates the ligase enzyme: 5 min at 98 °C.
- PCR amplification of ligated probes:
- -
- Cool down the samples to room temperature;
- -
- Add 10 μL polymerase master mix at room temperature;
- -
- Start PCR amplification.
- Fragment separation by capillary electrophoresis and data analysis.
5.3. ddPCR Protocol
- Prepare the samples by diluting genomic DNA at the desired concentration before setting up the reaction mix (e.g., dilute the DNA at 25 ng/microliter);
- Prepare master mixes containing the specific reaction buffer for probes, each of the sampling and reference probes, 25 ng DNA/sample and water to a final volume of 20 μL/sample. The master mixes shall be sufficient for three-four technical replicates each target deletion;
- Mix thoroughly and allow reaction tubes to equilibrate at room temperature for about 3 min;
- Once the reaction mixtures are ready, load 20 μL of each reaction mix into a sample well of a cartridge, followed by 70 μL of droplet generation oil for probes into the oil wells;
- Put the cartridge in the automated droplet generator;
- After droplet generation, carefully transfer droplets into a clean 96-well PCR plate. Seal the plate with an aluminum foil in the PCR plate sealer.
- Proceed to thermal cycling and PCR amplification, followed by the acquisition of droplets in the QX100 or QX200 droplet reader.
- Design the experimental template through QuantaSoft™ Software (plate layout). After that the droplets acquisition is complete, data are analyzed with the proper setup for any specific application (CNV, gene expression, mutation detection, etc.).
These three techniques, as shown, feature significant differences in terms of the number of steps, reagents and time required for the whole procedure. Therefore, they involve different resources in order to complete medical reports. A direct and schematic comparison is shown in Figure 4.
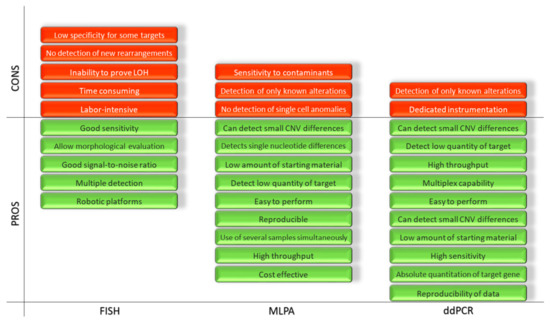
Figure 4.
Representation of the advantages and disadvantages of the FISH, MLPA and ddPCR.
6. Time Required for the Report, Sensitivity and Specificity
A relevant and somehow overlooked issue is represented by the time required to produce a medical report. Regardless of whether the disease is acute or chronic, time is crucial and bears economics implications. The shorter the time required to produce a medical report, the less is the cost related to specialized personnel dedicated to the procedures.
In this regard, ddPCR is advantageous over FISH and MLPA when dealing with deletion- or duplication-detection. ddPCR is also very advantageous for the detection of gene rearrangements, useful during the differential diagnosis of different tumor types. In the recent paper by Frazzi R. and coworkers [43], the estimated time interval that is necessary from the moment of sample collection to the final, analyzed data is about 6 h. This time is comparable to that required by other molecular amplification techniques and is considerably shorter than that required by fluorescence microscopy-based techniques and multiplex ligation-dependent probe amplification. The required time ranges from about 15 h for FISH (starting to ready-made slides) to about 24 h for MLPA. Moreover, the number of ddPCR droplets counted by the fluorometer and used for data analysis constitute an objective measurement, at variance with the FISH positive foci that depend, to some extent, on the microscopist.
The analytical sensitivity and specificity of these three techniques is very high, according to the literature. FISH shows analytical specificity and sensitivity above 95%. MLPA is reported to have 95–99% of sensitivity and 93–97% of specificity whereas ddPCR above 98% for both [2,44,45,46].
7. Applications in Cancer Research and Molecular Testing
Cancer represents a major field of application for these three techniques, both for diagnostic and research purposes. To the present day, FISH and MLPA are mainly used for diagnostic purposes while ddPCR for research purposes.
Some of the most significant targets investigated by means of these three techniques in cancer are mentioned hereinafter (Table 1).

Table 1.
Molecular targets investigated by the three techniques FISH, MLPA and ddPCR in the type of tumors described in the text.
7.1. Chronic Lymphocytic Leukemia
TP53 gene disruption is a major prognostic and predictive factor in chronic lymphocytic leukemia (CLL; [47]). It has been recently shown that ddPCR is an excellent approach to detect and quantitate TP53 deletions in alternative to conventional FISH methods. According to the calculated diagnostic thresholds reported in the paper by Frazzi R. and coworkers, CLL patients with CNV values equal or above 1.83–1.90 are considered TP53 non-deleted. On the contrary, patients having CNV values below these thresholds (calculated specifically for exons no. 5, 6 and 7) are deleted in one or more exons [43]. FISH and ddPCR demonstrate a high concordance for both non-deleted and deleted patients (93.1% and 90.0% respectively). Specificity and sensitivity result in being very high with this approach and the simultaneous probing for different exons ensures a higher percentage of detection in deleted patients.
Genomic aberrations of TP53 can be also analyzed by MLPA. MLPA is an improvement of the polymerase chain reaction and can simultaneously detect several alterations like copy number changes, DNA methylation and point mutations of up to 50 genomic DNA sequences in a single experiment [48].
Previous studies have demonstrated that MLPA is a suitable technique to detect genomic aberrations in CLL and exhibits good correlation with FISH results [49,50]. Additionally, MLPA has the advantage of being faster and more cost-effective than FISH. While FISH provides information for only a limited number of genomic targets at the same time, MLPA can detect copy number alterations and point mutations simultaneously in multiple target regions [51].
Deletion 11q (del11q-) is another relevant karyotypic aberration in CLL associated to unfavorable prognosis [52]. Del11q is a recurrent karyotypic abnormality acquired by patients with progressive CLL disease. Initial karyotypic and FISH studies were complemented by genotypization of CLL patients, leading to the discovery that del11q is monoallelic, often large and includes a minimal deleted region encompassing ataxia telangiectasia mutated (ATM) gene and often also BIRC3, located on the 11q22.2 band, in cis with ATM [7,53].
ATM is involved in DNA damage repair whereas BIRC3 is a negative regulator of non-canonical NF-kB signaling [53,54,55]. BIRC3 deletion occurs in 83% of del11q cases and always coexists with ATM deletion, as demonstrated by the CLL4 study [53].
In the Italian study mentioned before, del11q- was investigated by FISH in the discovery cohort, where the deleted region included BIRC3 in the 81.8% of cases. In the validation cohort both ATM and BIRC3 were investigated by ddPCR, confirming the ATM deletion and showing the BIRC3 deletion in 75.9% of the cases. The patients with a biallelic lesion of BIRC3 (del and mut) showed a significant shorter time to first treatment when compared to BIRC3-del/wt or wild type patients [7].
ATM likewise TP53 point mutations were investigated also by MLPA vs. FISH. These studies demonstrated that, although MLPA detected most recurrent copy number genomic aberrations (90.9%), false negative results were found in cases with small-size abnormal clones. False positive MLPA results may be obtained, instead, from samples with point mutations (TP53) or due to an apparent lack of probe specificity. Thus, MLPA may be a useful complementary but not alternative approach for FISH testing, in these cases [56].
BIRC3 deletions and mutations are rare albeit unfavorable events for CLL patients that can be also associated to fludarabine-chemoresistance and to adverse prognosis in some chemotherapy-treated CLL patients [55,57]. Furthermore, a target resequencing of 22 genes of the patients enrolled in the UK LRF CLL4 study confirms that biallelic BIRC3 lesions (del and mut) are an independent marker of inferior progression free survival (PFS) and overall survival (OS) [47]. Thus, the introduction and application of reliable molecular techniques to the early detection and quantitation of TP53-, ATM- and BIRC3-deletions would improve the predictive and prognostic opportunities in CLL patients. The introduction of multiplex diagnostic ddPCR panels would reduce considerably the time required to produce a complete report.
7.2. Glioma and Glioblastoma
Gliomas are the most common tumor of the brain in humans with an incidence rate of 6.03 per 100,000 individuals every year [61].
Low-grade gliomas (LGGs) have an indolent course but may evolve to aggressive, high-grade gliomas (HGG, like glioblastomas) [62]. Glioblastoma multiforme (GBM) is an aggressive form of tumor of the central nervous system characterized by therapy resistance insurgence associated to the disease recurrence. The main treatment options are represented by surgery, radiotherapy and chemotherapy even though the prognosis remains dismal [63].
Gliomas can be classified into subtypes based on distinct molecular signatures. These molecular subtypes are characterized by different prognoses and treatment responses [64,65,66]. The molecular signatures allow the identification of epidermal growth factor receptor (EGFR) amplification, TP53 and cyclin dependent kinase Inhibitor 2A (CDKN2A) deletion as associated to poor prognosis [67,68,69,70].
Meanwhile, other markers such as IDH1 and IDH2 gene mutations were correlated with a favorable prognosis [71].
The EGFR gene, given its correlation to a poor prognosis, is an important analytical marker in gliomas. EGFR is a transmembrane receptor tyrosine kinase that can initiate several intracellular signaling pathways contributing to cancer cell proliferation, inhibition of apoptosis, invasion, metastasis and stimulation of neovascularization [116,117]. The most frequent EGFR alterations are at genetic level (amplification or deletion like epidermal growth factor receptor variant III (EGFRvIII)) or at protein level (overexpression). EGFR alterations promote proliferation, angiogenesis and invasion and in glioblastoma also resistance to radiotherapy and chemotherapy [72,73,74].
EGFR protein overexpression is mainly studied by IHC whereas EGFR gene amplification preferentially by FISH [75]. The FISH assay is based on the EGFR/CEP7 ratio. A probe hybridizes with chromosomal 7p12 region containing EGFR locus while a second probe hybridizes to the centromeric region 7p11.1. This latter one is used to count the number of copies of chromosome 7 [76,77]. The number of signals corresponding to the EGFR specific probe is directly related to the number of copies of this gene. The number of signals corresponding to the CEP7 is directly related to the number of copies of chromosome 7. Normally, one probe is red and one is green. Yellow signals correspond to the overlap between red and green labeling. EGFR amplification is recorded when more than 10% of analyzed cells show an EGFR to CEP7 ratio ≥2 [76,78].
EGFR abnormalities in brain tumor tissue can be also assessed by MLPA and ddPCR [79,80]. FISH and MLPA are widely used for diagnostic and research purposes. On the contrary, fewer articles exist describing ddPCR approach in glioma. Most of them are focused on EGFR mutations.
As mentioned before, EGFR is a prognostic marker that has to be combined with other molecular markers in order to identify different glioma subtypes. As an example, the codeletion of chromosomes 1p and 19q is strongly associated to oligodendroglioma [66,80,81,82]. Likewise, the fusion gene KIAA1549:BRAF is a specific molecular marker of the group of pilocytic astrocytoma [80,83,84].
7.3. Breast Cancer, Lung Cancer and Colorectal Cancer
Breast cancer, lung cancer and colorectal cancer are three examples of solid and often aggressive tumors. The investigation of specific gene alterations is useful for diagnostic and prognostic purposes.
Amplification and overexpression of HER2 are associated with poor prognosis in breast cancer and suitable for anti-HER2 therapy. Thus, a correct identification of patients with HER2 amplification is crucial. There are several methods to determine HER2 status, including FISH, MLPA and ddPCR. FISH analysis usually uses a probe to the HER2 gene and another for CEP17, as reference control. Patients with increased HER2 along with increased CEP17 copy numbers might be misclassified as non-amplified HER2 as during polysomy of chromosome 17. Although several studies have reported that true polysomy of chromosome 17 is rare specific reporting guidelines have recently been developed to overcome this issue [96,97,98,99]. HER2 and c-Myc gene amplification also were detected by MLPA and FISH in tissue samples of invasive breast cancer [101,102].
Moerland E. and coworkers evidenced a good correlation between MLPA, FISH and chromogenic in situ hybridization (CISH). However, the use of these different methods raises the issue of intra- and inter-laboratory reproducibility. Fixation time in FISH, together with other preanalytic variables, is another parameter affecting this approach [97]. Absolute HER2 copy number can be determined by ddPCR without the need for calibration. So, ddPCR technique may be useful as an alternative to FISH and MLPA in HER2 diagnosis [103].
Colorectal cancer (CRC) is one of the most deadly cancer in the world together with lung, liver and stomach cancer [114]. Advances in elucidating the molecular biology of these deadly cancers or other cancers led to the identification of a number of potential biomarkers that could be relevant in the clinical management of patients [115].
In CRC the main gene with copy number variation related to the disease is EGFR. The pivotal role of EGFR in cancer progression is used in the treatment of RAS wild-type metastatic CRC by EGFR-targeting monoclonal antibodies cetuximab and panitumumab [117,118,119,120,121,122,123]. EGFR is routinely analyzed by FISH. Likewise, HER2 and EGFR copy number is evaluated by EGFR/CEP7 ratio and can be affected by intra- and inter-laboratories variability [124,125,126]. The study of EGFR with other techniques such as MLPA and ddPCR are few and concern gene mutations instead of copy number variations.
The mutations in the rat sarcoma (RAS) gene are described more frequently than EGFR in CRC. The literature reports several studies on RAS using the three techniques that we are comparing in this review.
RAS gene family includes Kirsten rat sarcoma viral oncogene homolog (KRAS) and neuroblastoma RAS viral oncogene homolog (NRAS). It has also been suggested that NRAS mutations play a role in prognosis since patients harboring NRAS mutations have a significantly shorter survival compared to those bearing wild type NRAS. This is due to the fact that when RAS family members are mutated, the cells have an increased potential of invasion and metastasis [127,128,129,130].
As mentioned above, another leading cause of cancer-related death in the world is lung cancer. The clinical importance of the molecular phenotype of lung cancer bears therapeutic implications since different subtypes may respond to different targeted treatments.
ALK rearrangement represents a molecular target in a subset of non-small cell lung cancers (NSCLCs) [142]. Approximately 3%–7% of NSCLC harbor an ALK fusion gene, thus defining a tumor group that may be responsive to targeted therapy [143]. Fusion of ALK with the upstream partner EML4 was found in NSCLC in 2007. This fusion is due to a chromosomal inversion on chromosome 2p, resulting in the formation of EML4-ALK fusion oncogene. Notably, ALK rearrangements occur almost exclusively in adenocarcinomas [144,145]. ALK-rearranged lung cancer is a unique molecular subgroup with a high sensitivity to ALK inhibitors and mutually exclusive with other well-known oncogenic mutations (EGFR or KRAS) [146,147].
ALK-rearranged lung cancer can be identified by immunohistochemistry (IHC), FISH or qRT-PCR with each method having advantages and disadvantages for screening. In 2011 ALK FISH was approved as a diagnostic kit for NSCLC [1,148,149,150]. However, FISH requires specialized technical resources and expertise, and the signals rapidly fade over time. Therefore, there has been interest in the development of other methods/technologies such as IHC, qRT-PCR and, in recent years, also NGS. Prior to its approval as a companion diagnostic kit for testing ALK rearrangement in NSCLC, the ALK FISH test was already being challenged by IHC. However, discrepancies in results obtained by FISH and IHC, such as ALK FISH+/ALK IHC− or ALK FISH−/ALK IHC+, have been reported in some cases [1,151,152,153,154,155].
In the past decade, due to new and better anti-ALK antibodies that detect ALK gene fusion, and automation of IHC procedures, a new generation ALK IHC has been developed and is considered as sensitive as ALK FISH for detecting this rearrangement [156,157,158,159]. Considering FISH, a gold standard reference, sensitivity and specificity of IHC are 90.0 and 97.8%, respectively [151].
Quantitative RT-PCR (qRT-PCR) has also been applied successfully to the detection of EML4-ALK fusion at the RNA level [160,161]. qRT-PCR is used to examine expression levels of the 5′ and 3′ portions of ALK transcripts, because the breakpoint in ALK consistently occurs at exon 20 and EML4 (or other fusion partners). The resulting strong expression of ALK kinase domain leads to an unbalanced expression in 5′ and 3′ portions of ALK transcripts [143,162]. qRT-PCR could define ALK fusion partners and variants and also could be a suitable method for detecting ALK translocations using cytology samples from patients with primary lung cancer, especially when tissue samples are not available [161,162]. According to these studies, the concordances between qRT-PCR and ALK IHC or ALK FISH are approximately 95%-100% [160,162].
NGS-based methods are also becoming widely used in the detection of ALK rearrangements. The utility of these NGS-based methods emerged in the identification of ALK rearrangement-positive cases with an atypical ALK FISH signal pattern, even in cases that resulted in being negative by ALK FISH [9,163,164,165].
Finally, also ddPCR based assays have proven to be appropriate for the detection of ALK rearrangements. A significant advantage of ddPCR is the ability to detect and quantitate three variants of the EML4-ALK rearrangements that FISH cannot distinguish. Further advantages of ddPCR over FISH are represented by a lower limit of detection (LOD) associated to a lower cost of the test [166,167,168].
8. Conclusions
Molecular and cytogenetic techniques are the key to the study and diagnosis of cancer. For this purpose, some of their main applications are copy number variation analysis (deletion and duplication) and genetic rearrangements. Over the years, many targets have been successfully detected through FISH, MLPA and ddPCR (please, see Table 1).
In this article, we compared these three techniques evidencing the potential and characteristics of each one for cancer diagnostics.
Although FISH is often the golden standard for many targets, MLPA and ddPCR, according to the published data, can be much more sensitive and accurate. MLPA and ddPCR, however, differ in timing so that ddPCR bears a great potential for future applications.
Author Contributions
V.Y.C. wrote the manuscript and prepared the figures; A.B., M.R. and C.C. provided the expertise on FISH and the related images; R.F. conceived and wrote the paper and provided the ddPCR expertise. All authors have read and agreed to the published version of the manuscript.
Funding
This work has been carried out with the funds of Azienda Unità Sanitaria Locale—IRCCS Reggio Emilia, Italy.
Institutional Review Board Statement
Not applicable.
Informed Consent Statement
Not applicable.
Data Availability Statement
Not applicable.
Acknowledgments
The authors are grateful to the Laboratory of Translational Research, AUSL-IRCCS Reggio Emilia for the precious support.
Conflicts of Interest
The authors declare no conflict of interest. The funders had no role in the design of the study; in the collection, analyses or interpretation of data; in the writing of the manuscript, or in the decision to publish the results.
References
- Tang, Z.; Wang, L.; Tang, G.; Medeiros, L.J. Fluorescence in situ hybridization (fish) for detecting anaplastic lymphoma kinase (alk) rearrangement in lung cancer: Clinically relevant technical aspects. Int. J. Mol. Sci. 2019, 20, 3939. [Google Scholar] [CrossRef] [PubMed]
- Sussman, R.T.; Oran, A.R.; Paolillo, C.; Lieberman, D.; Morrissette, J.J.D.; Rosenbaum, J.N. Validation of a next-generation sequencing assay targeting rna for the multiplexed detection of fusion transcripts and oncogenic isoforms. Arch. Pathol. Lab. Med. 2020, 144, 90–98. [Google Scholar] [CrossRef] [PubMed]
- Chen, J.R.; Chien, H.P.; Chen, K.S.; Hwang, C.C.; Chen, H.Y.; Yeh, K.Y.; Hsieh, T.Y.; Chang, L.C.; Hsu, Y.C.; Lu, R.J.; et al. Amplification of her2 and top2a and deletion of top2a genes in a series of taiwanese breast cancer. Medicine 2017, 96, e5582. [Google Scholar] [CrossRef] [PubMed]
- Liu, Y.; Wu, S.; Shi, X.; Luo, Y.; Pang, J.; Wang, C.; Mao, F.; Liang, Z.; Zeng, X. Her2 double-equivocal breast cancer in chinese patients: A high concordance of her2 status between different blocks from the same tumor. Breast Cancer Res. Treat. 2019, 178, 275–281. [Google Scholar] [CrossRef] [PubMed]
- Nevisi, F.; Yaghmaie, M.; Pashaiefar, H.; Alimoghaddam, K.; Iravani, M.; Javadi, G.; Ghavamzadeh, A. Correlation of her2, mdm2, c-myc, c-met, and tp53 copy number alterations in circulating tumor cells with tissue in gastric cancer patients: A pilot study. Iran Biomed. J. 2020, 24, 47–53. [Google Scholar] [CrossRef] [PubMed]
- Pessoa, I.A.; Amorim, C.K.; Ferreira, W.A.S.; Sagica, F.; Brito, J.R.; Othman, M.; Meyer, B.; Liehr, T.; de Oliveira, E.H.C. Detection and correlation of single and concomitant tp53, pten, and cdkn2a alterations in gliomas. Int. J. Mol. Sci. 2019, 20, 2658. [Google Scholar] [CrossRef] [PubMed]
- Raponi, S.; Del Giudice, I.; Ilari, C.; Cafforio, L.; Messina, M.; Cappelli, L.V.; Bonina, S.; Piciocchi, A.; Marinelli, M.; Peragine, N.; et al. Biallelic birc3 inactivation in chronic lymphocytic leukaemia patients with 11q deletion identifies a subgroup with very aggressive disease. Br. J. Haematol. 2019, 185, 156–159. [Google Scholar] [CrossRef]
- Eijk-Van Os, P.G.; Schouten, J.P. Multiplex ligation-dependent probe amplification (mlpa(r)) for the detection of copy number variation in genomic sequences. Methods Mol. Biol. 2011, 688, 97–126. [Google Scholar]
- Abel, H.J.; Al-Kateb, H.; Cottrell, C.E.; Bredemeyer, A.J.; Pritchard, C.C.; Grossmann, A.H.; Wallander, M.L.; Pfeifer, J.D.; Lockwood, C.M.; Duncavage, E.J. Detection of gene rearrangements in targeted clinical next-generation sequencing. J. Mol. Diagn. 2014, 16, 405–417. [Google Scholar] [CrossRef]
- Baert-Desurmont, S.; Coutant, S.; Charbonnier, F.; Macquere, P.; Lecoquierre, F.; Schwartz, M.; Blanluet, M.; Vezain, M.; Lanos, R.; Quenez, O.; et al. Optimization of the diagnosis of inherited colorectal cancer using ngs and capture of exonic and intronic sequences of panel genes. Eur. J. Hum. Genet. 2018, 26, 1597–1602. [Google Scholar] [CrossRef]
- Yohe, S.; Thyagarajan, B. Review of clinical next-generation sequencing. Arch. Pathol. Lab. Med. 2017, 141, 1544–1557. [Google Scholar] [CrossRef]
- Mundle, S.D.; Sokolova, I. Clinical implications of advanced molecular cytogenetics in cancer. Expert Rev. Mol. Diagn. 2004, 4, 71–81. [Google Scholar] [CrossRef]
- Sunil, P.; Ramachandran, C.; Gokul, S.; Jaisanghar, N. Fluorescence in-situ hybridization technique as a diagnostic and prognostic tool in oral squamous cell carcinoma. J. Oral. Maxillofac. Pathol. 2013, 17, 61–64. [Google Scholar] [CrossRef]
- Cui, C.; Shu, W.; Li, P. Fluorescence in situ hybridization: Cell-based genetic diagnostic and research applications. Front. Cell Dev. Biol. 2016, 4, 89. [Google Scholar] [CrossRef]
- Halling, K.C.; Kipp, B.R. Fluorescence in situ hybridization in diagnostic cytology. Hum. Pathol. 2007, 38, 1137–1144. [Google Scholar] [CrossRef]
- Rudkin, G.T.; Stollar, B.D. High resolution detection of DNA-rna hybrids in situ by indirect immunofluorescence. Nature 1977, 265, 472–473. [Google Scholar] [CrossRef]
- Bauman, J.G.; Wiegant, J.; Borst, P.; van Duijn, P. A new method for fluorescence microscopical localization of specific DNA sequences by in situ hybridization of fluorochromelabelled rna. Exp. Cell Res. 1980, 128, 485–490. [Google Scholar] [CrossRef]
- Singer, R.H.; Ward, D.C. Actin gene expression visualized in chicken muscle tissue culture by using in situ hybridization with a biotinated nucleotide analog. Proc. Natl. Acad. Sci. USA 1982, 79, 7331–7335. [Google Scholar] [CrossRef]
- Langer, P.R.; Waldrop, A.A.; Ward, D.C. Enzymatic synthesis of biotin-labeled polynucleotides: Novel nucleic acid affinity probes. Proc. Natl. Acad. Sci. USA 1981, 78, 6633–6637. [Google Scholar] [CrossRef]
- Nielsen, P.E.; Egholm, M.; Berg, R.H.; Buchardt, O. Sequence-selective recognition of DNA by strand displacement with a thymine-substituted polyamide. Science 1991, 254, 1497–1500. [Google Scholar] [CrossRef]
- Nilsson, M.; Malmgren, H.; Samiotaki, M.; Kwiatkowski, M.; Chowdhary, B.P.; Landegren, U. Padlock probes: Circularizing oligonucleotides for localized DNA detection. Science 1994, 265, 2085–2088. [Google Scholar] [CrossRef]
- Femino, A.M.; Fay, F.S.; Fogarty, K.; Singer, R.H. Visualization of single rna transcripts in situ. Science 1998, 280, 585–590. [Google Scholar] [CrossRef]
- Silahtaroglu, A.; Pfundheller, H.; Koshkin, A.; Tommerup, N.; Kauppinen, S. Lna-modified oligonucleotides are highly efficient as fish probes. Cytogenet. Genome Res. 2004, 107, 32–37. [Google Scholar] [CrossRef]
- Larsson, C.; Grundberg, I.; Soderberg, O.; Nilsson, M. In situ detection and genotyping of individual mrna molecules. Nat. Methods 2010, 7, 395–397. [Google Scholar] [CrossRef] [PubMed]
- Speicher, M.R.; Gwyn Ballard, S.; Ward, D.C. Karyotyping human chromosomes by combinatorial multi-fluor fish. Nat. Genet. 1996, 12, 368–375. [Google Scholar] [CrossRef] [PubMed]
- Levsky, J.M.; Shenoy, S.M.; Pezo, R.C.; Singer, R.H. Single-cell gene expression profiling. Science 2002, 297, 836–840. [Google Scholar] [CrossRef] [PubMed]
- Sieben, V.J.; Debes-Marun, C.S.; Pilarski, L.M.; Backhouse, C.J. An integrated microfluidic chip for chromosome enumeration using fluorescence in situ hybridization. Lab Chip 2008, 8, 2151–2156. [Google Scholar] [CrossRef] [PubMed]
- Wang, D.O.; Matsuno, H.; Ikeda, S.; Nakamura, A.; Yanagisawa, H.; Hayashi, Y.; Okamoto, A. A quick and simple fish protocol with hybridization-sensitive fluorescent linear oligodeoxynucleotide probes. RNA 2012, 18, 166–175. [Google Scholar] [CrossRef]
- Sigma-Aldrich. Available online: Https://www.Sigmaaldrich.Com/technical-documents/protocols/biology/fish-procedure.Html (accessed on 1 April 2021).
- Schouten, J.P.; McElgunn, C.J.; Waaijer, R.; Zwijnenburg, D.; Diepvens, F.; Pals, G. Relative quantification of 40 nucleic acid sequences by multiplex ligation-dependent probe amplification. Nucleic Acids Res. 2002, 30, e57. [Google Scholar] [CrossRef]
- Den Dunnen, J.T.; White, S.J. Mlpa and maph: Sensitive detection of deletions and duplications. Curr. Protoc. Hum. Genet. 2006, 7, 7–14. [Google Scholar] [CrossRef]
- Lips, E.H.; Laddach, N.; Savola, S.P.; Vollebergh, M.A.; Oonk, A.M.; Imholz, A.L.; Wessels, L.F.; Wesseling, J.; Nederlof, P.M.; Rodenhuis, S. Quantitative copy number analysis by multiplex ligation-dependent probe amplification (mlpa) of brca1-associated breast cancer regions identifies brcaness. Breast Cancer Res. 2011, 13, R107. [Google Scholar] [CrossRef]
- Schouten, J.; van Vught, P.; Galjaard, R.J. Multiplex ligation-dependent probe amplification (mlpa) for prenatal diagnosis of common aneuploidies. Methods Mol. Biol. 2019, 1885, 161–170. [Google Scholar]
- MRC Holland. Available online: https://www.Mrcholland.com/ (accessed on 1 April 2021).
- Manoj, P. Droplet digital pcr technology promises new applications and research areas. Mitochondrial DNA A DNA Mapp Seq. Anal. 2016, 27, 742–746. [Google Scholar] [CrossRef]
- Kanagal-Shamanna, R. Digital pcr: Principles and applications. Methods Mol. Biol. 2016, 1392, 43–50. [Google Scholar]
- Vogelstein, B.; Kinzler, K.W. Digital pcr. Proc. Natl. Acad. Sci. USA 1999, 96, 9236–9241. [Google Scholar] [CrossRef]
- Morley, A.A. Digital pcr: A brief history. Biomol. Detect. Quantif. 2014, 1, 1–2. [Google Scholar] [CrossRef]
- Taly, V.; Pekin, D.; Benhaim, L.; Kotsopoulos, S.K.; Le Corre, D.; Li, X.; Atochin, I.; Link, D.R.; Griffiths, A.D.; Pallier, K.; et al. Multiplex picodroplet digital pcr to detect kras mutations in circulating DNA from the plasma of colorectal cancer patients. Clin. Chem. 2013, 59, 1722–1731. [Google Scholar] [CrossRef]
- Nakano, M.; Komatsu, J.; Matsuura, S.; Takashima, K.; Katsura, S.; Mizuno, A. Single-molecule pcr using water-in-oil emulsion. J. Biotechnol. 2003, 102, 117–124. [Google Scholar] [CrossRef]
- Huggett, J.F.; Foy, C.A.; Benes, V.; Emslie, K.; Garson, J.A.; Haynes, R.; Hellemans, J.; Kubista, M.; Mueller, R.D.; Nolan, T.; et al. The digital miqe guidelines: Minimum information for publication of quantitative digital pcr experiments. Clin. Chem. 2013, 59, 892–902. [Google Scholar] [CrossRef]
- Huggett, J.F. The digital miqe guidelines update: Minimum information for publication of quantitative digital pcr experiments for 2020. Clin. Chem. 2020, 66, 1012–1029. [Google Scholar] [CrossRef]
- Frazzi, R.; Bizzarri, V.; Albertazzi, L.; Cusenza, V.Y.; Coppolecchia, L.; Luminari, S.; Ilariucci, F. Droplet digital pcr is a sensitive tool for the detection of tp53 deletions and point mutations in chronic lymphocytic leukaemia. Br. J. Haematol. 2020, 189, e49–e52. [Google Scholar] [CrossRef] [PubMed]
- Wiktor, A.E.; Van Dyke, D.L.; Stupca, P.J.; Ketterling, R.P.; Thorland, E.C.; Shearer, B.M.; Fink, S.R.; Stockero, K.J.; Majorowicz, J.R.; Dewald, G.W. Preclinical validation of fluorescence in situ hybridization assays for clinical practice. Genet. Med. 2006, 8, 16–23. [Google Scholar] [CrossRef] [PubMed]
- Gu, J.; Smith, J.L.; Dowling, P.K. Fluorescence in situ hybridization probe validation for clinical use. Methods Mol. Biol. 2017, 1541, 101–118. [Google Scholar] [PubMed]
- Abdool, A.; Donahue, A.C.; Wohlgemuth, J.G.; Yeh, C.H. Detection, analysis and clinical validation of chromosomal aberrations by multiplex ligation-dependent probe amplification in chronic leukemia. PLoS ONE 2010, 5, e15407. [Google Scholar] [CrossRef]
- Blakemore, S.J.; Clifford, R.; Parker, H.; Antoniou, P.; Stec-Dziedzic, E.; Larrayoz, M.; Davis, Z.; Kadalyayil, L.; Colins, A.; Robbe, P.; et al. Clinical significance of tp53, birc3, atm and mapk-erk genes in chronic lymphocytic leukaemia: Data from the randomised uk lrf cll4 trial. Leukemia 2020, 34, 1760–1774. [Google Scholar] [CrossRef]
- Homig-Holzel, C.; Savola, S. Multiplex ligation-dependent probe amplification (mlpa) in tumor diagnostics and prognostics. Diagn. Mol. Pathol. 2012, 21, 189–206. [Google Scholar] [CrossRef]
- Al Zaabi, E.A.; Fernandez, L.A.; Sadek, I.A.; Riddell, D.C.; Greer, W.L. Multiplex ligation-dependent probe amplification versus multiprobe fluorescence in situ hybridization to detect genomic aberrations in chronic lymphocytic leukemia: A tertiary center experience. J. Mol. Diagn. 2010, 12, 197–203. [Google Scholar] [CrossRef]
- Alhourani, E.; Rincic, M.; Othman, M.A.; Pohle, B.; Schlie, C.; Glaser, A.; Liehr, T. Comprehensive chronic lymphocytic leukemia diagnostics by combined multiplex ligation dependent probe amplification (mlpa) and interphase fluorescence in situ hybridization (ifish). Mol. Cytogenet. 2014, 7, 79. [Google Scholar] [CrossRef]
- Srinivasan, V.K.; Naseem, S.; Varma, N.; Lad, D.P.; Malhotra, P. Genomic alterations in chronic lymphocytic leukemia and their correlation with clinico-hematological parameters and disease progression. Blood Res. 2020, 55, 131–138. [Google Scholar] [CrossRef]
- Krober, A.; Bloehdorn, J.; Hafner, S.; Buhler, A.; Seiler, T.; Kienle, D.; Winkler, D.; Bangerter, M.; Schlenk, R.F.; Benner, A.; et al. Additional genetic high-risk features such as 11q deletion, 17p deletion, and v3-21 usage characterize discordance of zap-70 and vh mutation status in chronic lymphocytic leukemia. J. Clin. Oncol. 2006, 24, 969–975. [Google Scholar] [CrossRef]
- Rose-Zerilli, M.J.; Forster, J.; Parker, H.; Parker, A.; Rodriguez, A.E.; Chaplin, T.; Gardiner, A.; Steele, A.J.; Collins, A.; Young, B.D.; et al. Atm mutation rather than birc3 deletion and/or mutation predicts reduced survival in 11q-deleted chronic lymphocytic leukemia: Data from the uk lrf cll4 trial. Haematologica 2014, 99, 736–742. [Google Scholar] [CrossRef]
- Stankovic, T.; Skowronska, A. The role of atm mutations and 11q deletions in disease progression in chronic lymphocytic leukemia. Leuk. Lymphoma 2014, 55, 1227–1239. [Google Scholar] [CrossRef]
- Frazzi, R. Birc3 and birc5: Multi-faceted inhibitors in cancer. Cell Biosci. 2021, 11, 8. [Google Scholar] [CrossRef]
- Veronese, L.; Tournilhac, O.; Combes, P.; Prie, N.; Pierre-Eymard, E.; Guieze, R.; Veyrat-Masson, R.; Bay, J.O.; Vago, P.; Tchirkov, A. Contribution of mlpa to routine diagnostic testing of recurrent genomic aberrations in chronic lymphocytic leukemia. Cancer Genet. 2013, 206, 19–25. [Google Scholar] [CrossRef]
- Tausch, E.; Stilgenbauer, S. Birc3 mutations in chronic lymphocytic leukemia—Uncommon and unfavorable. Haematologica 2020, 105, 255–256. [Google Scholar] [CrossRef]
- Chan, T.S.; Lee, Y.S.; Del Giudice, I.; Marinelli, M.; Ilari, C.; Cafforio, L.; Guarini, A.; Tan, D.; Phipps, C.; Goh, Y.T.; et al. Clinicopathological features and outcome of chronic lymphocytic leukaemia in Chinese patients. Oncotarget 2017, 8, 25455–25468. [Google Scholar] [CrossRef][Green Version]
- Balgobind, B.V.; Hollink, I.H.; Reinhardt, D.; van Wering, E.R.; de Graaf, S.S.; Baruchel, A.; Stary, J.; Beverloo, H.B.; de Greef, G.E.; Pieters, R.; et al. Low frequency of mll-partial tandem duplications in paediatric acute myeloid leukaemia using mlpa as a novel DNA screenings technique. Eur. J. Cancer 2010, 46, 1892–1899. [Google Scholar] [CrossRef]
- Amin, N.A.; Seymour, E.; Saiya-Cork, K.; Parkin, B.; Shedden, K.; Malek, S.N. A quantitative analysis of subclonal and clonal gene mutations before and after therapy in chronic lymphocytic leukemia. Clin. Cancer Res. 2016, 22, 4525–4535. [Google Scholar] [CrossRef]
- Dolecek, T.A.; Propp, J.M.; Stroup, N.E.; Kruchko, C. CBTRUS statistical report: Primary brain and central nervous system tumors diagnosed in the united states in 2005–2009. Neuro Oncol. 2012, 14. [Google Scholar] [CrossRef]
- Gressot, L.V.; Doucette, T.; Yang, Y.; Fuller, G.N.; Manyam, G.; Rao, A.; Latha, K.; Rao, G. Analysis of the inhibitors of apoptosis identifies birc3 as a facilitator of malignant progression in glioma. Oncotarget 2017, 8, 12695–12704. [Google Scholar] [CrossRef]
- Ziegler, D.S.; Wright, R.D.; Kesari, S.; Lemieux, M.E.; Tran, M.A.; Jain, M.; Zawel, L.; Kung, A.L. Resistance of human glioblastoma multiforme cells to growth factor inhibitors is overcome by blockade of inhibitor of apoptosis proteins. J. Clin. Investig. 2008, 118, 3109–3122. [Google Scholar] [CrossRef]
- Brennan, C.W.; Verhaak, R.G.; McKenna, A.; Campos, B.; Noushmehr, H.; Salama, S.R.; Zheng, S.; Chakravarty, D.; Sanborn, J.Z.; Berman, S.H.; et al. The somatic genomic landscape of glioblastoma. Cell 2013, 155, 462–477. [Google Scholar] [CrossRef]
- Verhaak, R.G.; Hoadley, K.A.; Purdom, E.; Wang, V.; Qi, Y.; Wilkerson, M.D.; Miller, C.R.; Ding, L.; Golub, T.; Mesirov, J.P.; et al. Integrated genomic analysis identifies clinically relevant subtypes of glioblastoma characterized by abnormalities in pdgfra, idh1, egfr, and nf1. Cancer Cell 2010, 17, 98–110. [Google Scholar] [CrossRef]
- Yip, S.; Butterfield, Y.S.; Morozova, O.; Chittaranjan, S.; Blough, M.D.; An, J.; Birol, I.; Chesnelong, C.; Chiu, R.; Chuah, E.; et al. Concurrent cic mutations, idh mutations, and 1p/19q loss distinguish oligodendrogliomas from other cancers. J. Pathol. 2012, 226, 7–16. [Google Scholar] [CrossRef]
- Zhu, H.; Acquaviva, J.; Ramachandran, P.; Boskovitz, A.; Woolfenden, S.; Pfannl, R.; Bronson, R.T.; Chen, J.W.; Weissleder, R.; Housman, D.E.; et al. Oncogenic egfr signaling cooperates with loss of tumor suppressor gene functions in gliomagenesis. Proc. Natl. Acad. Sci. USA 2009, 106, 2712–2716. [Google Scholar] [CrossRef]
- Okada, Y.; Hurwitz, E.E.; Esposito, J.M.; Brower, M.A.; Nutt, C.L.; Louis, D.N. Selection pressures of tp53 mutation and microenvironmental location influence epidermal growth factor receptor gene amplification in human glioblastomas. Cancer Res. 2003, 63, 413–416. [Google Scholar]
- Kraus, J.A.; Glesmann, N.; Beck, M.; Krex, D.; Klockgether, T.; Schackert, G.; Schlegel, U. Molecular analysis of the pten, tp53 and cdkn2a tumor suppressor genes in long-term survivors of glioblastoma multiforme. J. Neurooncol. 2000, 48, 89–94. [Google Scholar] [CrossRef]
- Ichimura, K.; Bolin, M.B.; Goike, H.M.; Schmidt, E.E.; Moshref, A.; Collins, V.P. Deregulation of the p14arf/mdm2/p53 pathway is a prerequisite for human astrocytic gliomas with g1-s transition control gene abnormalities. Cancer Res. 2000, 60, 417–424. [Google Scholar]
- Yan, H.; Parsons, D.W.; Jin, G.; McLendon, R.; Rasheed, B.A.; Yuan, W.; Kos, I.; Batinic-Haberle, I.; Jones, S.; Riggins, G.J.; et al. Idh1 and idh2 mutations in gliomas. N. Engl. J. Med. 2009, 360, 765–773. [Google Scholar] [CrossRef]
- Nakamura, J.L. The epidermal growth factor receptor in malignant gliomas: Pathogenesis and therapeutic implications. Expert Opin. Ther. Targets 2007, 11, 463–472. [Google Scholar] [CrossRef]
- Schober, R.; Bilzer, T.; Waha, A.; Reifenberger, G.; Wechsler, W.; von Deimling, A.; Wiestler, O.D.; Westphal, M.; Kemshead, J.T.; Vega, F.; et al. The epidermal growth factor receptor in glioblastoma: Genomic amplification, protein expression, and patient survival data in a therapeutic trial. Clin. Neuropathol. 1995, 14, 169–174. [Google Scholar] [PubMed]
- Li, L.; Dutra, A.; Pak, E.; Labrie, J.E., 3rd; Gerstein, R.M.; Pandolfi, P.P.; Recht, L.D.; Ross, A.H. Egfrviii expression and pten loss synergistically induce chromosomal instability and glial tumors. Neuro Oncol. 2009, 11, 9–21. [Google Scholar] [CrossRef] [PubMed]
- Lassman, A.B.; Aldape, K.D.; Ansell, P.J.; Bain, E.; Curran, W.J.; Eoli, M.; French, P.J.; Kinoshita, M.; Looman, J.; Mehta, M.; et al. Epidermal growth factor receptor (egfr) amplification rates observed in screening patients for randomized trials in glioblastoma. J. Neurooncol. 2019, 144, 205–210. [Google Scholar] [CrossRef] [PubMed]
- Munoz-Hidalgo, L.; San-Miguel, T.; Megias, J.; Monleon, D.; Navarro, L.; Roldan, P.; Cerda-Nicolas, M.; Lopez-Gines, C. Somatic copy number alterations are associated with egfr amplification and shortened survival in patients with primary glioblastoma. Neoplasia 2020, 22, 10–21. [Google Scholar] [CrossRef] [PubMed]
- Saadeh, F.S.; Mahfouz, R.; Assi, H.I. Egfr as a clinical marker in glioblastomas and other gliomas. Int. J. Biol. Markers 2018, 33, 22–32. [Google Scholar] [CrossRef]
- Korshunov, A.; Sycheva, R.; Golanov, A. Molecular stratification of diagnostically challenging high-grade gliomas composed of small cells: The utility of fluorescence in situ hybridization. Clin Cancer Res. 2004, 10, 7820–7826. [Google Scholar] [CrossRef]
- Jeuken, J.; Cornelissen, S.; Boots-Sprenger, S.; Gijsen, S.; Wesseling, P. Multiplex ligation-dependent probe amplification: A diagnostic tool for simultaneous identification of different genetic markers in glial tumors. J. Mol. Diagn. 2006, 8, 433–443. [Google Scholar] [CrossRef]
- Trabelsi, S.; Chabchoub, I.; Ksira, I.; Karmeni, N.; Mama, N.; Kanoun, S.; Burford, A.; Jury, A.; Mackay, A.; Popov, S.; et al. Molecular diagnostic and prognostic subtyping of gliomas in tunisian population. Mol. Neurobiol. 2017, 54, 2381–2394. [Google Scholar] [CrossRef]
- Weller, M.; Felsberg, J.; Hartmann, C.; Berger, H.; Steinbach, J.P.; Schramm, J.; Westphal, M.; Schackert, G.; Simon, M.; Tonn, J.C.; et al. Molecular predictors of progression-free and overall survival in patients with newly diagnosed glioblastoma: A prospective translational study of the german glioma network. J. Clin. Oncol. 2009, 27, 5743–5750. [Google Scholar] [CrossRef]
- Smith, J.S.; Perry, A.; Borell, T.J.; Lee, H.K.; O’Fallon, J.; Hosek, S.M.; Kimmel, D.; Yates, A.; Burger, P.C.; Scheithauer, B.W.; et al. Alterations of chromosome arms 1p and 19q as predictors of survival in oligodendrogliomas, astrocytomas, and mixed oligoastrocytomas. J. Clin. Oncol. 2000, 18, 636–645. [Google Scholar] [CrossRef]
- Sievert, A.J.; Jackson, E.M.; Gai, X.; Hakonarson, H.; Judkins, A.R.; Resnick, A.C.; Sutton, L.N.; Storm, P.B.; Shaikh, T.H.; Biegel, J.A. Duplication of 7q34 in pediatric low-grade astrocytomas detected by high-density single-nucleotide polymorphism-based genotype arrays results in a novel braf fusion gene. Brain Pathol. 2009, 19, 449–458. [Google Scholar] [CrossRef]
- Hawkins, C.; Walker, E.; Mohamed, N.; Zhang, C.; Jacob, K.; Shirinian, M.; Alon, N.; Kahn, D.; Fried, I.; Scheinemann, K.; et al. Braf-kiaa1549 fusion predicts better clinical outcome in pediatric low-grade astrocytoma. Clin. Cancer Res. 2011, 17, 4790–4798. [Google Scholar] [CrossRef]
- Ghasimi, S.; Wibom, C.; Dahlin, A.M.; Brannstrom, T.; Golovleva, I.; Andersson, U.; Melin, B. Genetic risk variants in the cdkn2a/b, rtel1 and egfr genes are associated with somatic biomarkers in glioma. J. Neurooncol. 2016, 127, 483–492. [Google Scholar] [CrossRef]
- Trevisan, P.; Graziadio, C.; Rodrigues, D.B.K.; Rosa, R.F.M.; Soares, F.P.; Provenzi, V.O.; de Oliveira, C.A.V.; Paskulin, G.A.; Varella-Garcia, M.; Zen, P.R.G. Clinical and molecular characterization of adult glioblastomas in southern brazil. J. Neuropathol. Exp. Neurol. 2019, 78, 297–304. [Google Scholar] [CrossRef]
- Broniscer, A.; Hwang, S.N.; Chamdine, O.; Lin, T.; Pounds, S.; Onar-Thomas, A.; Chi, L.; Shurtleff, S.; Allen, S.; Gajjar, A.; et al. Bithalamic gliomas may be molecularly distinct from their unilateral high-grade counterparts. Brain Pathol. 2018, 28, 112–120. [Google Scholar] [CrossRef]
- Purkait, S.; Mallick, S.; Sharma, V.; Kumar, A.; Pathak, P.; Jha, P.; Biswas, A.; Julka, P.K.; Gupta, D.; Suri, A.; et al. A simplified approach for molecular classification of glioblastomas (gbms): Experience from a tertiary care center in india. Brain Tumor Pathol. 2016, 33, 183–190. [Google Scholar] [CrossRef]
- Holtkamp, N.; Ziegenhagen, N.; Malzer, E.; Hartmann, C.; Giese, A.; von Deimling, A. Characterization of the amplicon on chromosomal segment 4q12 in glioblastoma multiforme. Neuro Oncol. 2007, 9, 291–297. [Google Scholar] [CrossRef]
- Gielen, G.H.; Gessi, M.; Buttarelli, F.R.; Baldi, C.; Hammes, J.; zur Muehlen, A.; Doerner, E.; Denkhaus, D.; Warmuth-Metz, M.; Giangaspero, F.; et al. Genetic analysis of diffuse high-grade astrocytomas in infancy defines a novel molecular entity. Brain Pathol. 2015, 25, 409–417. [Google Scholar] [CrossRef]
- Wang, J.; Zhao, Y.Y.; Li, J.F.; Guo, C.C.; Chen, F.R.; Su, H.K.; Zhao, H.F.; Long, Y.K.; Shao, J.Y.; To, S.; et al. Idh1 mutation detection by droplet digital pcr in glioma. Oncotarget 2015, 6, 39651–39660. [Google Scholar] [CrossRef]
- Ge, J.; Liu, M.Y.; Li, L.; Deng, Q.; Liu, F.; Luo, Y.; Wang, L.; Yao, G.; Zhu, D.; Lu, H.; et al. Detection of idh1 and tert promoter mutations with droplet digital pcr in diffuse gliomas. Int. J. Clin. Exp. Pathol. 2020, 13, 230–238. [Google Scholar]
- Harat, M.; Blok, M.; Harat, A.; Soszynska, K. The impact of adjuvant radiotherapy on molecular prognostic markers in gliomas. Onco Targets Ther. 2019, 12, 2215–2224. [Google Scholar] [CrossRef] [PubMed]
- Yokogami, K.; Yamasaki, K.; Matsumoto, F.; Yamashita, S.; Saito, K.; Tacheva, A.; Mizuguchi, A.; Watanabe, T.; Ohta, H.; Takeshima, H. Impact of pcr-based molecular analysis in daily diagnosis for the patient with gliomas. Brain Tumor Pathol. 2018, 35, 141–147. [Google Scholar] [CrossRef] [PubMed]
- Fina, F.; Barets, D.; Colin, C.; Bouvier, C.; Padovani, L.; Nanni-Metellus, I.; Ouafik, L.; Scavarda, D.; Korshunov, A.; Jones, D.T.; et al. Droplet digital pcr is a powerful technique to demonstrate frequent fgfr1 duplication in dysembryoplastic neuroepithelial tumors. Oncotarget 2017, 8, 2104–2113. [Google Scholar] [CrossRef] [PubMed]
- Tse, C.; Gauchez, A.S.; Jacot, W.; Lamy, P.J. Her2 shedding and serum her2 extracellular domain: Biology and clinical utility in breast cancer. Cancer Treat. Rev. 2012, 38, 133–142. [Google Scholar] [CrossRef] [PubMed]
- Yeh, I.T.; Martin, M.A.; Robetorye, R.S.; Bolla, A.R.; McCaskill, C.; Shah, R.K.; Gorre, M.E.; Mohammed, M.S.; Gunn, S.R. Clinical validation of an array cgh test for her2 status in breast cancer reveals that polysomy 17 is a rare event. Mod. Pathol. 2009, 22, 1169–1175. [Google Scholar] [CrossRef] [PubMed]
- Vranic, S.; Teruya, B.; Repertinger, S.; Ulmer, P.; Hagenkord, J.; Gatalica, Z. Assessment of her2 gene status in breast carcinomas with polysomy of chromosome 17. Cancer 2011, 117, 48–53. [Google Scholar] [CrossRef]
- Marchio, C.; Lambros, M.B.; Gugliotta, P.; Di Cantogno, L.V.; Botta, C.; Pasini, B.; Tan, D.S.; Mackay, A.; Fenwick, K.; Tamber, N.; et al. Does chromosome 17 centromere copy number predict polysomy in breast cancer? A fluorescence in situ hybridization and microarray-based cgh analysis. J. Pathol. 2009, 219, 16–24. [Google Scholar] [CrossRef]
- Wolff, A.C.; Hammond, M.E.H.; Allison, K.H.; Harvey, B.E.; Mangu, P.B.; Bartlett, J.M.S.; Bilous, M.; Ellis, I.O.; Fitzgibbons, P.; Hanna, W.; et al. Human epidermal growth factor receptor 2 testing in breast cancer: American society of clinical oncology/college of american pathologists clinical practice guideline focused update. J. Clin. Oncol. 2018, 36, 2105–2122. [Google Scholar] [CrossRef]
- Moerland, E.; van Hezik, R.L.; van der Aa, T.C.; van Beek, M.W.; van den Brule, A.J. Detection of her2 amplification in breast carcinomas: Comparison of multiplex ligation-dependent probe amplification (mlpa) and fluorescence in situ hybridization (fish) combined with automated spot counting. Cell Oncol. 2006, 28, 151–159. [Google Scholar]
- Soosanabadi, M.; Mirfakhraie, R.; Atanesyan, L.; Biglarian, A.; Aghakhani Moghadam, F.; Rahimi, M.; Behjati, F.; Keyhani, E. Application of multiplex ligation-dependent probe amplification in determining the copy number alterations of her gene family members in invasive ductal breast carcinoma. Rep. Biochem. Mol. Biol. 2019, 8, 91–101. [Google Scholar]
- Tantiwetrueangdet, A.; Panvichian, R.; Wongwaisayawan, S.; Sueangoen, N.; Lertsithichai, P. Droplet digital pcr using her2/eif2c1 ratio for detection of her2 amplification in breast cancer tissues. Med. Oncol. 2018, 35, 149. [Google Scholar] [CrossRef]
- Faraz, M.; Tellstrom, A.; Ardnor, C.E.; Grankvist, K.; Huminiecki, L.; Tavelin, B.; Henriksson, R.; Hedman, H.; Ljuslinder, I. Lrig1 gene copy number analysis by ddpcr and correlations to clinical factors in breast cancer. BMC Cancer 2020, 20, 459. [Google Scholar] [CrossRef]
- Veenstra, C.; Karlsson, E.; Mirwani, S.M.; Nordenskjold, B.; Fornander, T.; Perez-Tenorio, G.; Stal, O. The effects of ptpn2 loss on cell signalling and clinical outcome in relation to breast cancer subtype. J. Cancer Res. Clin. Oncol. 2019, 145, 1845–1856. [Google Scholar] [CrossRef]
- Chen, W.; Zheng, J.; Wu, C.; Liu, S.; Chen, Y.; Liu, X.; Du, J.; Wang, J. Breast cancer subtype classification using 4-plex droplet digital pcr. Clin. Chem. 2019, 65, 1051–1059. [Google Scholar] [CrossRef]
- Medford, A.J.; Gillani, R.N.; Park, B.H. Detection of cancer DNA in early stage and metastatic breast cancer patients. Methods Mol. Biol. 2018, 1768, 209–227. [Google Scholar]
- Otsuji, K.; Sasaki, T.; Tanabe, M.; Seto, Y. Droplet-digital pcr reveals frequent mutations in tert promoter region in breast fibroadenomas and phyllodes tumours, irrespective of the presence of med12 mutations. Br. J. Cancer 2021, 124, 466–473. [Google Scholar] [CrossRef]
- Del Re, M.; Bertolini, I.; Crucitta, S.; Fontanelli, L.; Rofi, E.; De Angelis, C.; Diodati, L.; Cavallero, D.; Gianfilippo, G.; Salvadori, B.; et al. Overexpression of tk1 and cdk9 in plasma-derived exosomes is associated with clinical resistance to cdk4/6 inhibitors in metastatic breast cancer patients. Breast Cancer Res. Treat. 2019, 178, 57–62. [Google Scholar] [CrossRef]
- Ooi, A.; Inokuchi, M.; Horike, S.I.; Kawashima, H.; Ishikawa, S.; Ikeda, H.; Nakamura, R.; Oyama, T.; Dobashi, Y. Amplicons in breast cancers analyzed by multiplex ligation-dependent probe amplification and fluorescence in situ hybridization. Hum. Pathol. 2019, 85, 33–43. [Google Scholar] [CrossRef]
- Hirai, N.; Sasaki, T.; Okumura, S.; Sado, M.; Akiyama, N.; Kitada, M.; Takei, H.; Ohsaki, Y. Novel alk-specific mrna in situ hybridization assay for non-small-cell lung carcinoma. Transl. Lung Cancer Res. 2020, 9, 257–268. [Google Scholar] [CrossRef]
- Badawy, O.M.; Loay, I. Fish analysis of top2a and her-2 aberrations in female breast carcinoma on archived material: Egyptian nci experience. Appl. Immunohistochem Mol. Morphol. 2019, 27, 216–222. [Google Scholar] [CrossRef]
- Gogas, H.; Kotoula, V.; Alexopoulou, Z.; Christodoulou, C.; Kostopoulos, I.; Bobos, M.; Raptou, G.; Charalambous, E.; Tsolaki, E.; Xanthakis, I.; et al. Myc copy gain, chromosomal instability and pi3k activation as potential markers of unfavourable outcome in trastuzumab-treated patients with metastatic breast cancer. J. Transl. Med. 2016, 14, 136. [Google Scholar] [CrossRef]
- Brody, H. Colorectal cancer. Nature 2015, 521, S1. [Google Scholar] [CrossRef]
- Villalobos, P.; Wistuba, I.I. Lung cancer biomarkers. Hematol. Oncol. Clin. N. Am. 2017, 31, 13–29. [Google Scholar] [CrossRef]
- Ciardiello, F.; Tortora, G. Egfr antagonists in cancer treatment. N. Engl. J. Med. 2008, 358, 1160–1174. [Google Scholar] [CrossRef]
- Birkman, E.M.; Avoranta, T.; Algars, A.; Korkeila, E.; Lintunen, M.; Lahtinen, L.; Kuopio, T.; Ristamaki, R.; Carpen, O.; Sundstrom, J. Egfr gene copy number decreases during anti-egfr antibody therapy in colorectal cancer. Hum. Pathol. 2018, 82, 163–171. [Google Scholar] [CrossRef]
- Lievre, A.; Bachet, J.B.; Le Corre, D.; Boige, V.; Landi, B.; Emile, J.F.; Cote, J.F.; Tomasic, G.; Penna, C.; Ducreux, M.; et al. Kras mutation status is predictive of response to cetuximab therapy in colorectal cancer. Cancer Res. 2006, 66, 3992–3995. [Google Scholar] [CrossRef] [PubMed]
- Amado, R.G.; Wolf, M.; Peeters, M.; Van Cutsem, E.; Siena, S.; Freeman, D.J.; Juan, T.; Sikorski, R.; Suggs, S.; Radinsky, R.; et al. Wild-type kras is required for panitumumab efficacy in patients with metastatic colorectal cancer. J. Clin. Oncol. 2008, 26, 1626–1634. [Google Scholar] [CrossRef] [PubMed]
- Linardou, H.; Dahabreh, I.J.; Kanaloupiti, D.; Siannis, F.; Bafaloukos, D.; Kosmidis, P.; Papadimitriou, C.A.; Murray, S. Assessment of somatic k-ras mutations as a mechanism associated with resistance to egfr-targeted agents: A systematic review and meta-analysis of studies in advanced non-small-cell lung cancer and metastatic colorectal cancer. Lancet Oncol. 2008, 9, 962–972. [Google Scholar] [CrossRef]
- Allegra, C.J.; Rumble, R.B.; Hamilton, S.R.; Mangu, P.B.; Roach, N.; Hantel, A.; Schilsky, R.L. Extended ras gene mutation testing in metastatic colorectal carcinoma to predict response to anti-epidermal growth factor receptor monoclonal antibody therapy: American society of clinical oncology provisional clinical opinion update 2015. J. Clin. Oncol. 2016, 34, 179–185. [Google Scholar] [CrossRef] [PubMed]
- Atreya, C.E.; Corcoran, R.B.; Kopetz, S. Expanded ras: Refining the patient population. J. Clin. Oncol. 2015, 33, 682–685. [Google Scholar] [CrossRef] [PubMed]
- Sorich, M.J.; Wiese, M.D.; Rowland, A.; Kichenadasse, G.; McKinnon, R.A.; Karapetis, C.S. Extended ras mutations and anti-egfr monoclonal antibody survival benefit in metastatic colorectal cancer: A meta-analysis of randomized, controlled trials. Ann. Oncol. 2015, 26, 13–21. [Google Scholar] [CrossRef]
- Al-Kuraya, K.; Novotny, H.; Bavi, P.; Siraj, A.K.; Uddin, S.; Ezzat, A.; Sanea, N.A.; Al-Dayel, F.; Al-Mana, H.; Sheikh, S.S.; et al. Her2, top2a, ccnd1, egfr and c-myc oncogene amplification in colorectal cancer. J. Clin. Pathol. 2007, 60, 768–772. [Google Scholar] [CrossRef]
- Sartore-Bianchi, A.; Fieuws, S.; Veronese, S.; Moroni, M.; Personeni, N.; Frattini, M.; Torri, V.; Cappuzzo, F.; Vander Borght, S.; Martin, V.; et al. Standardisation of egfr fish in colorectal cancer: Results of an international interlaboratory reproducibility ring study. J. Clin. Pathol. 2012, 65, 218–223. [Google Scholar] [CrossRef]
- Spindler, K.L.; Lindebjerg, J.; Nielsen, J.N.; Olsen, D.A.; Bisgard, C.; Brandslund, I.; Jakobsen, A. Epidermal growth factor receptor analyses in colorectal cancer: A comparison of methods. Int. J. Oncol. 2006, 29, 1159–1165. [Google Scholar] [CrossRef]
- Afrasanie, V.A.; Marinca, M.V.; Alexa-Stratulat, T.; Gafton, B.; Paduraru, M.; Adavidoaiei, A.M.; Miron, L.; Rusu, C. Kras, nras, braf, her2 and microsatellite instability in metastatic colorectal cancer—Practical implications for the clinician. Radiol. Oncol. 2019, 53, 265–274. [Google Scholar] [CrossRef]
- Bos, J.L.; Fearon, E.R.; Hamilton, S.R.; Verlaan-de Vries, M.; van Boom, J.H.; van der Eb, A.J.; Vogelstein, B. Prevalence of ras gene mutations in human colorectal cancers. Nature 1987, 327, 293–297. [Google Scholar] [CrossRef]
- Finkelstein, S.D.; Sayegh, R.; Christensen, S.; Swalsky, P.A. Genotypic classification of colorectal adenocarcinoma. Biologic behavior correlates with k-ras-2 mutation type. Cancer 1993, 71, 3827–3838. [Google Scholar] [CrossRef]
- Boughdady, I.S.; Kinsella, A.R.; Haboubi, N.Y.; Schofield, P.F. K-ras gene mutations in adenomas and carcinomas of the colon. Surg. Oncol. 1992, 1, 275–282. [Google Scholar] [CrossRef]
- Orhan, T.; Nielsen, P.B.; Hviid, T.V.F.; Rosen, A.W.; Gogenur, I. Expression of circadian clock genes in human colorectal cancer tissues using droplet digital pcr. Cancer Investig. 2019, 37, 90–98. [Google Scholar] [CrossRef]
- Bidshahri, R.; Attali, D.; Fakhfakh, K.; McNeil, K.; Karsan, A.; Won, J.R.; Wolber, R.; Bryan, J.; Hughesman, C.; Haynes, C. Quantitative detection and resolution of braf v600 status in colorectal cancer using droplet digital pcr and a novel wild-type negative assay. J. Mol. Diagn. 2016, 18, 190–204. [Google Scholar] [CrossRef]
- Vanova, B.; Kalman, M.; Jasek, K.; Kasubova, I.; Burjanivova, T.; Farkasova, A.; Kruzliak, P.; Busselberg, D.; Plank, L.; Lasabova, Z. Droplet digital pcr revealed high concordance between primary tumors and lymph node metastases in multiplex screening of kras mutations in colorectal cancer. Clin. Exp. Med. 2019, 19, 219–224. [Google Scholar] [CrossRef] [PubMed]
- Alcaide, M.; Cheung, M.; Bushell, K.; Arthur, S.E.; Wong, H.L.; Karasinska, J.; Renouf, D.; Schaeffer, D.F.; McNamara, S.; Tertre, M.C.D.; et al. A novel multiplex droplet digital pcr assay to identify and quantify kras mutations in clinical specimens. J. Mol. Diagn. 2019, 21, 214–227. [Google Scholar] [CrossRef] [PubMed]
- Lee, K.T.; Gopalan, V.; Islam, F.; Wahab, R.; Mamoori, A.; Lu, C.T.; Smith, R.A.; Lam, A.K. Gaec1 mutations and copy number aberration is associated with biological aggressiveness of colorectal cancer. Eur. J. Cell Biol. 2018, 97, 230–241. [Google Scholar] [CrossRef] [PubMed]
- Herring, E.; Kanaoka, S.; Tremblay, E.; Beaulieu, J.F. Droplet digital pcr for quantification of itga6 in a stool mrna assay for the detection of colorectal cancers. World J. Gastroenterol. 2017, 23, 2891–2898. [Google Scholar] [CrossRef] [PubMed]
- Lagerstedt-Robinson, K.; Rohlin, A.; Aravidis, C.; Melin, B.; Nordling, M.; Stenmark-Askmalm, M.; Lindblom, A.; Nilbert, M. Mismatch repair gene mutation spectrum in the swedish lynch syndrome population. Oncol. Rep. 2016, 36, 2823–2835. [Google Scholar] [CrossRef]
- McCarthy, A.J.; Capo-Chichi, J.M.; Spence, T.; Grenier, S.; Stockley, T.; Kamel-Reid, S.; Serra, S.; Sabatini, P.; Chetty, R. Heterogenous loss of mismatch repair (mmr) protein expression: A challenge for immunohistochemical interpretation and microsatellite instability (msi) evaluation. J. Pathol. Clin. Res. 2019, 5, 115–129. [Google Scholar] [CrossRef]
- Dong, Z.; Kong, L.; Wan, Z.; Zhu, F.; Zhong, M.; Lv, Y.; Zhao, P.; Shi, H. Somatic mutation profiling and her2 status in kras-positive chinese colorectal cancer patients. Sci. Rep. 2019, 9, 16894. [Google Scholar] [CrossRef]
- Khan, S.A.; Zeng, Z.; Shia, J.; Paty, P.B. Egfr gene amplification and kras mutation predict response to combination targeted therapy in metastatic colorectal cancer. Pathol. Oncol. Res. 2017, 23, 673–677. [Google Scholar] [CrossRef]
- Fiedler, D.; Heselmeyer-Haddad, K.; Hirsch, D.; Hernandez, L.S.; Torres, I.; Wangsa, D.; Hu, Y.; Zapata, L.; Rueschoff, J.; Belle, S.; et al. Single-cell genetic analysis of clonal dynamics in colorectal adenomas indicates cdx2 gain as a predictor of recurrence. Int. J. Cancer 2019, 144, 1561–1573. [Google Scholar] [CrossRef]
- Pao, W.; Girard, N. New driver mutations in non-small-cell lung cancer. Lancet Oncol. 2011, 12, 175–180. [Google Scholar] [CrossRef]
- Wang, R.; Pan, Y.; Li, C.; Hu, H.; Zhang, Y.; Li, H.; Luo, X.; Zhang, J.; Fang, Z.; Li, Y.; et al. The use of quantitative real-time reverse transcriptase pcr for 5′ and 3′ portions of alk transcripts to detect alk rearrangements in lung cancers. Clin. Cancer Res. 2012, 18, 4725–4732. [Google Scholar] [CrossRef] [PubMed]
- Soda, M.; Choi, Y.L.; Enomoto, M.; Takada, S.; Yamashita, Y.; Ishikawa, S.; Fujiwara, S.; Watanabe, H.; Kurashina, K.; Hatanaka, H.; et al. Identification of the transforming eml4-alk fusion gene in non-small-cell lung cancer. Nature 2007, 448, 561–566. [Google Scholar] [CrossRef] [PubMed]
- Kwak, E.L.; Bang, Y.J.; Camidge, D.R.; Shaw, A.T.; Solomon, B.; Maki, R.G.; Ou, S.H.; Dezube, B.J.; Janne, P.A.; Costa, D.B.; et al. Anaplastic lymphoma kinase inhibition in non-small-cell lung cancer. N. Engl. J. Med. 2010, 363, 1693–1703. [Google Scholar] [CrossRef] [PubMed]
- Kim, H.; Yoo, S.B.; Choe, J.Y.; Paik, J.H.; Xu, X.; Nitta, H.; Zhang, W.; Grogan, T.M.; Lee, C.T.; Jheon, S.; et al. Detection of alk gene rearrangement in non-small cell lung cancer: A comparison of fluorescence in situ hybridization and chromogenic in situ hybridization with correlation of alk protein expression. J. Thorac. Oncol. 2011, 6, 1359–1366. [Google Scholar] [CrossRef]
- Inamura, K.; Takeuchi, K.; Togashi, Y.; Hatano, S.; Ninomiya, H.; Motoi, N.; Mun, M.Y.; Sakao, Y.; Okumura, S.; Nakagawa, K.; et al. Eml4-alk lung cancers are characterized by rare other mutations, a ttf-1 cell lineage, an acinar histology, and young onset. Mod. Pathol. 2009, 22, 508–515. [Google Scholar] [CrossRef]
- Shaw, A.T.; Yeap, B.Y.; Mino-Kenudson, M.; Digumarthy, S.R.; Costa, D.B.; Heist, R.S.; Solomon, B.; Stubbs, H.; Admane, S.; McDermott, U.; et al. Clinical features and outcome of patients with non-small-cell lung cancer who harbor eml4-alk. J. Clin. Oncol. 2009, 27, 4247–4253. [Google Scholar] [CrossRef]
- Rodig, S.J.; Mino-Kenudson, M.; Dacic, S.; Yeap, B.Y.; Shaw, A.; Barletta, J.A.; Stubbs, H.; Law, K.; Lindeman, N.; Mark, E.; et al. Unique clinicopathologic features characterize alk-rearranged lung adenocarcinoma in the western population. Clin. Cancer Res. 2009, 15, 5216–5223. [Google Scholar] [CrossRef]
- Jokoji, R.; Yamasaki, T.; Minami, S.; Komuta, K.; Sakamaki, Y.; Takeuchi, K.; Tsujimoto, M. Combination of morphological feature analysis and immunohistochemistry is useful for screening of eml4-alk-positive lung adenocarcinoma. J. Clin. Pathol. 2010, 63, 1066–1070. [Google Scholar] [CrossRef]
- Yi, E.S.; Boland, J.M.; Maleszewski, J.J.; Roden, A.C.; Oliveira, A.M.; Aubry, M.C.; Erickson-Johnson, M.R.; Caron, B.L.; Li, Y.; Tang, H.; et al. Correlation of ihc and fish for alk gene rearrangement in non-small cell lung carcinoma: Ihc score algorithm for fish. J. Thorac. Oncol. 2011, 6, 459–465. [Google Scholar] [CrossRef]
- Paik, J.H.; Choe, G.; Kim, H.; Choe, J.Y.; Lee, H.J.; Lee, C.T.; Lee, J.S.; Jheon, S.; Chung, J.H. Screening of anaplastic lymphoma kinase rearrangement by immunohistochemistry in non-small cell lung cancer: Correlation with fluorescence in situ hybridization. J. Thorac. Oncol. 2011, 6, 466–472. [Google Scholar] [CrossRef]
- Just, P.A.; Cazes, A.; Audebourg, A.; Cessot, A.; Pallier, K.; Danel, C.; Vacher-Lavenu, M.C.; Laurent-Puig, P.; Terris, B.; Blons, H. Histologic subtypes, immunohistochemistry, fish or molecular screening for the accurate diagnosis of alk-rearrangement in lung cancer: A comprehensive study of caucasian non-smokers. Lung Cancer 2012, 76, 309–315. [Google Scholar] [CrossRef]
- McLeer-Florin, A.; Moro-Sibilot, D.; Melis, A.; Salameire, D.; Lefebvre, C.; Ceccaldi, F.; de Fraipont, F.; Brambilla, E.; Lantuejoul, S. Dual ihc and fish testing for alk gene rearrangement in lung adenocarcinomas in a routine practice: A french study. J. Thorac. Oncol. 2012, 7, 348–354. [Google Scholar] [CrossRef]
- Park, H.S.; Lee, J.K.; Kim, D.W.; Kulig, K.; Kim, T.M.; Lee, S.H.; Jeon, Y.K.; Chung, D.H.; Heo, D.S. Immunohistochemical screening for anaplastic lymphoma kinase (alk) rearrangement in advanced non-small cell lung cancer patients. Lung Cancer 2012, 77, 288–292. [Google Scholar] [CrossRef]
- Conklin, C.M.; Craddock, K.J.; Have, C.; Laskin, J.; Couture, C.; Ionescu, D.N. Immunohistochemistry is a reliable screening tool for identification of alk rearrangement in non-small-cell lung carcinoma and is antibody dependent. J. Thorac. Oncol. 2013, 8, 45–51. [Google Scholar] [CrossRef]
- Selinger, C.I.; Rogers, T.M.; Russell, P.A.; O’Toole, S.; Yip, P.; Wright, G.M.; Wainer, Z.; Horvath, L.G.; Boyer, M.; McCaughan, B.; et al. Testing for alk rearrangement in lung adenocarcinoma: A multicenter comparison of immunohistochemistry and fluorescent in situ hybridization. Mod. Pathol. 2013, 26, 1545–1553. [Google Scholar] [CrossRef]
- Conde, E.; Suarez-Gauthier, A.; Benito, A.; Garrido, P.; Garcia-Campelo, R.; Biscuola, M.; Paz-Ares, L.; Hardisson, D.; de Castro, J.; Camacho, M.C.; et al. Accurate identification of alk positive lung carcinoma patients: Novel fda-cleared automated fluorescence in situ hybridization scanning system and ultrasensitive immunohistochemistry. PLoS ONE 2014, 9, e107200. [Google Scholar] [CrossRef]
- Wynes, M.W.; Sholl, L.M.; Dietel, M.; Schuuring, E.; Tsao, M.S.; Yatabe, Y.; Tubbs, R.R.; Hirsch, F.R. An international interpretation study using the alk ihc antibody d5f3 and a sensitive detection kit demonstrates high concordance between alk ihc and alk fish and between evaluators. J. Thorac. Oncol. 2014, 9, 631–638. [Google Scholar] [CrossRef]
- Soda, M.; Isobe, K.; Inoue, A.; Maemondo, M.; Oizumi, S.; Fujita, Y.; Gemma, A.; Yamashita, Y.; Ueno, T.; Takeuchi, K.; et al. A prospective pcr-based screening for the eml4-alk oncogene in non-small cell lung cancer. Clin. Cancer Res. 2012, 18, 5682–5689. [Google Scholar] [CrossRef] [PubMed]
- Li, Y.; Pan, Y.; Wang, R.; Sun, Y.; Hu, H.; Shen, X.; Lu, Y.; Shen, L.; Zhu, X.; Chen, H. Alk-rearranged lung cancer in chinese: A comprehensive assessment of clinicopathology, ihc, fish and rt-pcr. PLoS ONE 2013, 8, e69016. [Google Scholar] [CrossRef]
- Nakamichi, S.; Seike, M.; Miyanaga, A.; Chiba, M.; Matsuda, K.; Kobayashi, K.; Takahashi, A.; Takeuchi, S.; Minegishi, Y.; Kubota, K.; et al. Rt-pcr for detecting alk translocations in cytology samples from lung cancer patients. Anticancer Res. 2017, 37, 3295–3299. [Google Scholar]
- Pekar-Zlotin, M.; Hirsch, F.R.; Soussan-Gutman, L.; Ilouze, M.; Dvir, A.; Boyle, T.; Wynes, M.; Miller, V.A.; Lipson, D.; Palmer, G.A.; et al. Fluorescence in situ hybridization, immunohistochemistry, and next-generation sequencing for detection of eml4-alk rearrangement in lung cancer. Oncologist 2015, 20, 316–322. [Google Scholar] [CrossRef] [PubMed]
- Ali, S.M.; Hensing, T.; Schrock, A.B.; Allen, J.; Sanford, E.; Gowen, K.; Kulkarni, A.; He, J.; Suh, J.H.; Lipson, D.; et al. Comprehensive genomic profiling identifies a subset of crizotinib-responsive alk-rearranged non-small cell lung cancer not detected by fluorescence in situ hybridization. Oncologist 2016, 21, 762–770. [Google Scholar] [CrossRef] [PubMed]
- Wang, B.; Wu, S.; Huang, F.; Shen, M.; Jiang, H.; Yu, Y.; Yu, Q.; Yang, Y.; Zhao, Y.; Zhou, Y.; et al. Analytical and clinical validation of a novel amplicon-based ngs assay for the evaluation of circulating tumor DNA in metastatic colorectal cancer patients. Clin. Chem. Lab. Med. 2019, 57, 1501–1510. [Google Scholar] [CrossRef] [PubMed]
- Wang, Q.; Yang, X.; He, Y.; Ma, Q.; Lin, L.; Fu, P.; Xiao, H. Droplet digital pcr for absolute quantification of eml4-alk gene rearrangement in lung adenocarcinoma. J. Mol. Diagn. 2015, 17, 515–520. [Google Scholar] [CrossRef]
- Lund, H.L.; Hughesman, C.B.; Fakhfakh, K.; McNeil, K.; Clemens, S.; Hocken, K.; Pettersson, R.; Karsan, A.; Foster, L.J.; Haynes, C. Initial diagnosis of alk-positive non-small-cell lung cancer based on analysis of alk status utilizing droplet digital pcr. Anal. Chem. 2016, 88, 4879–4885. [Google Scholar] [CrossRef]
- Junca, A.; Tachon, G.; Evrard, C.; Villalva, C.; Frouin, E.; Karayan-Tapon, L.; Tougeron, D. Detection of colorectal cancer and advanced adenoma by liquid biopsy (decalib study): The ddpcr challenge. Cancers 2020, 12, 1482. [Google Scholar] [CrossRef]
- Ferrara, R.; Auger, N.; Auclin, E.; Besse, B. Clinical and translational implications of ret rearrangements in non-small cell lung cancer. J. Thorac. Oncol. 2018, 13, 27–45. [Google Scholar] [CrossRef]
- Luk, P.P.; Selinger, C.I.; Mahar, A.; Cooper, W.A. Biomarkers for alk and ros1 in lung cancer: Immunohistochemistry and fluorescent in situ hybridization. Arch. Pathol. Lab. Med. 2018, 142, 922–928. [Google Scholar] [CrossRef]
- Piton, N.; Ruminy, P.; Gravet, C.; Marchand, V.; Colasse, E.; Lamy, A.; Naoures Mear, C.L.; Bibeau, F.; Marguet, F.; Guisier, F.; et al. Ligation-dependent rt-pcr: A new specific and low-cost technique to detect alk, ros, and ret rearrangements in lung adenocarcinoma. Lab. Investig. 2018, 98, 371–379. [Google Scholar] [CrossRef]
- Sung, J.S.; Chong, H.Y.; Kwon, N.J.; Kim, H.M.; Lee, J.W.; Kim, B.; Lee, S.B.; Park, C.W.; Choi, J.Y.; Chang, W.J.; et al. Detection of somatic variants and egfr mutations in cell-free DNA from non-small cell lung cancer patients by ultra-deep sequencing using the ion ampliseq cancer hotspot panel and droplet digital polymerase chain reaction. Oncotarget 2017, 8, 106901–106912. [Google Scholar] [CrossRef]
- Yamaura, T.; Muto, S.; Mine, H.; Takagi, H.; Watanabe, M.; Ozaki, Y.; Inoue, T.; Fukuhara, M.; Okabe, N.; Matsumura, Y.; et al. Genetic alterations in epidermal growth factor receptor-tyrosine kinase inhibitor-naive non-small cell lung carcinoma. Oncol. Lett. 2020, 19, 4169–4176. [Google Scholar]
- Li, C.; He, Q.; Liang, H.; Cheng, B.; Li, J.; Xiong, S.; Zhao, Y.; Guo, M.; Liu, Z.; He, J.; et al. Diagnostic accuracy of droplet digital pcr and amplification refractory mutation system pcr for detecting egfr mutation in cell-free DNA of lung cancer: A meta-analysis. Front. Oncol. 2020, 10, 290. [Google Scholar] [CrossRef]
Publisher’s Note: MDPI stays neutral with regard to jurisdictional claims in published maps and institutional affiliations. |
© 2021 by the authors. Licensee MDPI, Basel, Switzerland. This article is an open access article distributed under the terms and conditions of the Creative Commons Attribution (CC BY) license (https://creativecommons.org/licenses/by/4.0/).