Abstract
Autism spectrum disorders (ASDs) are a group of neurodevelopmental disorders whose pathogenesis seems to be related to an imbalance of excitatory and inhibitory synapses, which leads to disrupted connectivity during brain development. Among the various biomarkers that have been evaluated in the last years, metabolic factors represent a bridge between genetic vulnerability and environmental aspects. In particular, cholesterol homeostasis and circulating fatty acids seem to be involved in the pathogenesis of ASDs, both through the contribute in the stabilization of cell membranes and the modulation of inflammatory factors. The purpose of the present review is to summarize the available data about the role of cholesterol and fatty acids, mainly long-chain ones, in the onset of ASDs. A bibliographic research on the main databases was performed and 36 studies were included in our review. Most of the studies document a correlation between ASDs and hypocholesterolemia, while the results concerning circulating fatty acids are less univocal. Even though further studies are necessary to confirm the available data, the metabolic biomarkers open to new treatment options such as the modulation of the lipid pattern through the diet.
1. Introduction
Autism spectrum disorders (ASDs) are a group of neurodevelopmental disorders which have their onset in childhood and include autistic disorder, Asperger syndrome, childhood disintegrative disorder and pervasive developmental disorder not otherwise specified [1]. Nevertheless, the classification of ASDs has undergone changes over the years with significant changes between DSM-5 and the previous versions of the manual. The whole spectrum affects the general population with a prevalence of 1–5% and with a predominance of male gender (Lord et al., 2018). The core symptoms include the alteration of social cognition, deficits in social interaction and impaired communication abilities [2,3,4]. Children with ASDs also show atypical behaviors, which tend to be repetitive, ranging from stereotypies to perseverations, both in general and in relation to eating behaviors [5,6,7]. The restricted pattern of behavior also applies to the field of interests, which tends to be characterized by narrowness and repetitiveness [8]. Moreover, in 30% of cases, ASDs co-occur with intellectual disability, a factor that worsens prognosis [9].
Given the variability of the clinical manifestations and the diagnostic delay that often occurs in patients affected by ASDs, the detection of biological biomarkers capable of facilitating early diagnosis appears of extreme importance [6,10,11,12]. Screening campaigns have been applied to facilitate the diagnosis of ASDs; however, they did not result to be successful being essentially based on clinical phenotypes that have the limit of variable specificity and prognostic value [13,14]. The identification of reliable biomarkers could improve the limits of clinical diagnosis and it is not a coincidence that most research on this field has focused on biological aspects in the last years. The candidate markers regard different biological systems including genetics, immunity, brain changes and metabolism [15,16,17]. Among these, the metabolic hypothesis is particularly promising as it integrates genetic vulnerability with environmental aspects [18,19,20].
ASDs seem to be the result of an imbalance between excitatory and inhibitory synapses and of a dysfunction in the synaptic plasticity of the brain, which leads to a disrupted connectivity during the brain development [21,22,23,24,25]. Cholesterol homeostasis was demonstrated to be involved in correct synaptic functioning and consequently this molecule was hypothesized to play a role in the etiology of ASDs [26,27]. Of note, several evidences support the involvement of an aberrant metabolism of cholesterol and fatty acids in the pathogenesis of autism. Firstly, polymorphisms of genes, codifying for molecules involved in mevalonate/cholesterol metabolism, were associated with an increased risk of ASDs [28]. In addition, subjects suffering from Smith-Lemli-Opitz Syndrome (SLOS), a genetic disorder implying a deficit in cholesterol biosynthesis, appear to be predisposed to develop ASDs [26]. Finally, the regulation of synaptic excitation seems to be connected to the allosteric modulation of N-Methyl-D-Aspartate Receptors (NMDARs), mediated by 24(S)-hydroxycholesterol (OHC) that is the most relevant brain cholesterol metabolite [29].
Cholesterol is transported through the blood by lipoproteins, where it is esterified with fatty acids [30]. Lipoproteins contain also phospholipids carrying further fatty acids. Circulating fatty acids are in continuous exchange with membrane lipids, in order to reach a biologic balance, specific for any individual and based on genetic and environmental factors (mainly dietary habits) [31]. Long-chain polyunsaturated fatty acids (namely, arachidonic acid [AA] and docosahexaenoic acid [DHA]) are the biologically most active compounds within the fatty acid family. AA and DHA might influence the neural response and their concentrations in the brain may largely vary, thus influencing behavioral domains [32]. Eicosapentaenoic acid (EPA), the biochemical precursor of DHA, even if not directly present in neural membranes, contributes to the AA/DHA balance and it plays a role in modulating inflammation [18].
If the metabolism of cholesterol and fatty acids plays a role in the onset and severity of ASDs, the modulation of diet appears to be promising for the prevention or management of these disorders. Steps have been already moved towards this direction and several studies hypothesized the role of specific dietary interventions, such as limiting and/or depriving either gluten and casein supply, even in association with ketogenic diets [33,34]. Changes in type of diet, by modifying the intestinal microbiome, could have anti-inflammatory properties which therefore would be beneficial for the Central Nervous System [35,36,37]. Even though the data regarding these therapeutic options are preliminary, they appear promising especially as they regard a non-pharmacological approach for improving symptoms. Furthermore, the contribution of diet in the onset of ASD has been poorly investigated till now, especially as regards the lipid component, but it is a promising field of investigation. As a matter of fact, few authors evaluated the impact of diet modifications on the course of ASDs, but the results appear to be promising despite being preliminary [6,18]. Starting from these assumptions, the purpose of the present review is to summarize the available data about the role of cholesterol and fatty acids, mainly long-chain ones, in the onset of ASDs, respectively.
2. Methods
A search in the main databases (PubMed, Embase, PsycInfo, Isi Web of Knowledge, Medscape, The Cochrane Library) was conducted with last check on 31 October 2020. The terms “autism”, “Asperger” were individually matched with “cholesterol”, “fatty acids”, “arachidonic acid”, “EPA” and “DHA”.
The initial search was obtained using only headings. Then, a double-blind selection of papers (MB and CME) was manually performed, to select the articles suiting with the topic of this review. The selection process is detailed in Figure 1. Studies concerning the role of cholesterol and fatty acids in the pathogenesis of ASDs were included. Therefore, studies focusing on therapeutic strategies were excluded, as well as those in which the sample of patients with ASD was not analyzed individually but only in a context of a mixed sample. Furthermore, exclusion criteria consisted of: (1) animal studies; (2) case reports and reviews; (3) use of fatty acids as parallel treatments; (4) maternal diet studies; (5) intestinal microbiome studies. Moreover, we excluded paper in a language different from English.
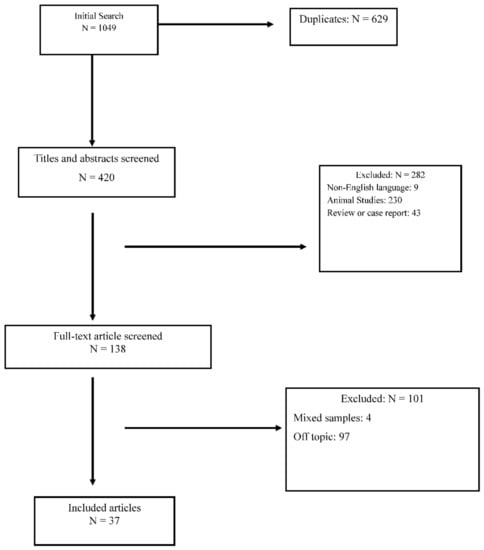
Figure 1.
Prisma Diagram for reviews.
One thousand and forty nine papers were initially identified, of which 1012 were discarded because they were duplicates or because they met exclusion criteria. Thirty-seven papers satisfied the inclusion criteria. Table 1 summarizes the results of the included papers.

Table 1.
Summary of the results of the selected studies about the role of cholesterol and fatty acids in the pathogenesis of ASDs.
3. Results
3.1. ASDs and Cholesterol
As regards the relationship between ASDs and cholesterol, 14 studies were identified, conducted between 2001 and 2020. Among the identified studies, most of them regard the association between ASDs and hypo- or hypercholesterolemia and they report discordant results, as highlighted in Table 2.
Table 2.
Associations between serum/plasma total cholesterol (TC) levels and Autism spectrum disorders.
Several studies reported the association between ASDs and hypocholesterolemia [40,45,70,71]. A recent study by Benhachenhou and colleagues showed that in subjects affected by ASDs the prevalence of hypocholesterolemia was more than threefold higher than in the general population [70]. Total cholesterol (TC) levels below the 10th percentile would be also associated with a higher risk of comorbidities such as intellectual disability and the presence of anxious-depressive symptoms [70]. In addition to TC levels, low-density lipoprotein (LDL) cholesterol levels were also found to be reduced in patients with autism compared to the general population [42,67]. Of note, Dziobeck and collaborators detected reduced levels of LDL cholesterol in face of increased levels of TC in patients with Asperger syndrome [42]. Consequently, an interesting hypothesis is that impaired cholesterol synthesis could affect its concentration in the central nervous system in subjects affected by ASDs. In support to this speculation, red blood cell (RBC) membranes of children affected by autism have on the average significantly less cholesterol and significantly more ganglioside 1 (GM1), which is involved in neuronal plasticity, than RBC membranes of healthy controls [38]. On the other hand, the association between SLOS, a genetic disorder caused by a defect in cholesterol biosynthesis, and autism demonstrates the importance of the entire lipid panel in the etiology of ASDs [52]. The clinical picture of SLOS consists of hypocholesterolemia and abnormal accumulation of the precursor 7-dehydrocholesterol (7-DHC) [40], however, neither TC plasma levels, nor 7-DHC levels, nor 8-dehydrocholesterol (8-DHC) levels appear to correlate with the presence of autistic symptoms in SLOS patients [43].
In contrast with the mentioned results, a study conducted by Blazewicz and collaborators showed an increase of TC levels in adolescents with autism, divided into groups according to dietary characteristics [33]. In particular, the presence of increased TC/high-density lipoprotein (HDL) plasma levels was found in patients with ASDs compared to healthy controls regardless of the type of diet. In addition, the groups of patients characterized by low-fat diet or regular diet showed an increase in triglycerides (TG), while the group of patients following a gluten-casein-free diet exhibited an increase in non-HDL cholesterol [33].
Other studies, on the contrary, did not identify statistically significant differences in patients with ASDs compared to healthy controls, neither with regard to TC and LDL cholesterol levels [49,56], nor with regard to the levels of cholesterol sulfate (CS), which is an endogenous steroid involved in the stabilization of plasma membranes [53]. Kim and colleagues, however, identified higher LDL/HDL ratio in ASDs patients than controls, as well as the association between autism and plasma TG, HDL and LDL/HDL ratio [49].
3.2. ASDs and Fatty Acids
It was possible to identify 17 articles concerning the association between ASDs and fatty acids in general, 5 articles concerning the association between ASDs and AA, 7 articles concerning the association between ASDs and EPA, 11 articles concerning the association between ASDs and DHA. Among these manuscripts, 23 resulted to be duplicates.
Bell and colleagues reported a higher frequency of fatty acids deficiency (FAD) in patients with autism and Asperger syndrome compared to healthy controls [41]. Specifically, patients with regressive autism, which includes individuals who passed all developmental criteria up to 18–36 months and thereafter regressed into autism, had higher percentages of stearic acid (18:0), linoleic acid (18:2n − 6) and total saturates in their RBC membranes than controls, as well as higher lignoceric acid (24:0), docosapentaenoic acid (22:5n − 6), nervonic acid (24:1) and AA/EPA ratio; these latter characteristics are shared by regressive autism and Asperger syndrome [41]. Furthermore, patients with regressive autism showed lower oleic acid (18:1n − 9) and AA values and patients both with regressive autism and with Asperger syndrome presented lower docosapentaenoic acid and total n − 3 polyunsaturated fatty acids (n − 3 PUFAs) compared to controls [41]. A study then analyzed the erythrocyte and plasma fatty acid compositions of children with autism compared to healthy controls and children with developmental delay, showing decreased levels of lignoceric acid (24:0) and nervonic acid (24:1) in children with developmental delay with respect to ASDs [47]. According to Bell and colleagues, patients with ASDs would not have an underlying specific “phospholipid disorder”, but, within the phospholipid pool, an increase of the AA/EPA ratio would suggest the presence of an imbalance of essential highly unsaturated fatty acids in some autistic children [47]. According to Howsmon and colleagues, on the other hand, the erythrocyte fatty acid profiles are not reliable markers that can be applied for the classification of subjects affected by ASDs [68].
On the contrary, Brown and colleagues identified essential fatty acids (EFAs) deficiencies in patients with ASDs, giving rise to the hypothesis that a dysregulation of the fatty acid phospholipid metabolism plays an essential role in the etiology of these conditions [55]. Furthermore, other studies reported abnormal concentrations of linoleic and α-linolenic acids, higher levels of DHA, AA and lower levels of phospholipids in ASDs compared to controls [44,51,58,61,62,73], as well as the increase in most of the saturated fatty acids and a decrease in most of polyunsaturated fatty acids [50]. As reported in Table 3, an elevated Omega-6 (ω6)/Omega-3 (ω3) ratio was found by different authors [39,54,58], where ω3 and ω6 are a group of essential fatty acids involved in maintaining the integrity of plasma membranes. DHA and EPA belong to the ω3 group, while linoleic acid and AA belong to the ω6 group. The finding of increased monounsaturated fatty acids, decreased EPA and DHA and consequently of an increased ω6/ω3 ratio could explain the reduction of erythrocyte membrane fluidity in ASDs compared to controls [54]. Reduced levels of DHA, EPA and AA in the RBCs as well as reduced levels of DHA, AA, EPA, α-linolenic and linoleic acids in plasma were identified in ASDs patients than healthy controls [44,46,48,57,59,60,63,65,66]. Furthermore, the DHA/AA ratio was supposed to be a reliable marker to differentiate subjects affected by ASDs from healthy individuals [61]. The results about the association between ASDs and DHA, AA and EPA serum/plasma levels are summarized in Table 3, Table 4, Table 5 and Table 6, respectively. Finally, lower serum levels of very-low-density lipoproteins (VLDL) and apoprotein B (APOB) were detected in serum of children with ASDs than typical developmental controls [72].
Table 3.
Associations between serum/plasma ω6/ω3 ratio and Autism spectrum disorders.
Table 4.
Associations between docosahexaenoic acid (DHA) serum/plasma levels and Autism spectrum disorders.
Table 5.
Associations between arachidonic acid (AA) serum/plasma levels and Autism spectrum disorders.
Table 6.
Associations between eicosapentaenoic acid (EPA) serum/plasma levels and Autism spectrum disorders.
According to Puig-Alcatraz and colleagues, no significant differences were observed in adipic acid and suberic acid levels in patients with ASDs compared to healthy controls [64]. However, the increase of adipic acid levels was indirectly correlated with the severity of the deficit in socialization and communication skills in children with an ASD [64]. Plasma levels of fatty acids (both ω3 and ω6 ones) were found to be positively correlated with social interaction of children with ASDs [72]. The findings by Bell and colleagues would allow to differentiate the clinical subgroups of patients affected by ASDs: for example, patients with regressive autism showed a reduction in highly unsaturated fatty acid levels in polar lipids, after storage of RBC at −20 °C for 6 weeks, while this reduction was not observable neither in controls nor in patients with classical autism or Asperger syndrome [41]. Patients presenting with both autism and Asperger syndrome exhibited increased EPA and DHA levels and decreased AA, 20:3n − 6 levels and AA/EPA ratio in their RBC polar lipids, after EPA-rich fish oil supplementation. These patients presented also higher concentrations of type IV phospholipase A2 in RBCs compared to controls [41].
4. Discussion
Several studies indicate that abnormalities in the lipid panel are usual in patients with ASDs and that the degree of these alterations may affect the severity of clinical symptoms [64,72]. While we are probably still far from having reliable lipid biomarkers to be used for early diagnosis of these disorders often characterized by an insidious onset, available findings seem to be promising towards this direction.
Specifically, most observational studies detected an association between low cholesterol plasma levels and ASDs [40,45,70,71]. This evidence is supported by the cases of SLOS, in which the deficit of cholesterol biosynthesis is associated with clinical manifestations largely overlapping with a diagnosis of autism [26,38]. The most accredited hypothesis claims that there is a correspondence between low plasma cholesterol levels and its reduction in the central nervous system, with a consequent alteration in the lipid constitution of neuron membranes [52]. This abnormality would lead to an imbalance of excitatory and inhibitory synapses and to a dysfunction in the synaptic plasticity of the brain [22,24,74]. Another interesting hypothesis is that the alteration of cholesterol and its metabolites, such as OHC, can be involved in the pathogenesis of ASDs by inducing oxidative stress and consequent glutamate toxicity at neuronal level [75]. The consequence would be a dysfunctional brain connectivity, an altered neurodevelopment and the onset of ASDs [24]. It should be also emphasized that the role of cholesterol in psychiatric disorders has not been fully understood and that the association with its plasma levels varies according to the disorder or psychiatric symptoms. While low cholesterol plasma levels were found to be associated with suicide attempts, particularly violent ones (similarly to ASDs) [76], depressive symptoms seem to be associated with an increase of plasma cholesterol levels [77]. This is not surprising as autism and depression are at the opposite symptomatic poles (e.g., active social avoidance in ASDs versus passive social withdrawal in depression) [78]. In addition, psychiatric symptoms can modulate the function of second messengers or enzymes involved in lipid metabolism. Of note, a recent article demonstrated that depressive symptoms were directly associated with levels of Proprotein Convertase Subtilisin/Kexin Type 9 (PCSK9), an enzyme that regulates the degradation of LDL receptor [79].
With regard to fatty acids, the results are more discordant within highly heterogeneous settings of observations. In general, it would seem that patients with ASDs show a trend towards lower levels of both DHA and AA in comparison with healthy controls [46,48,54,57,59,60,61,63,65], as well as an elevated ω6/ω3 ratio [39,54,58,60]. Again, these alterations support the hypothesis of an inflammatory dysregulation in patients affected by psychiatric conditions [80,81,82] including ASDs [83]. In addition, it was demonstrated that changes in lipid profile may enhance systemic and brain oxidative stress affecting synaptic function [75,84], paving the way for new therapeutic perspectives [18].
Taken as a whole, increasing evidence seems to support a role of cholesterol and probably fatty acids in the etiology of ASDs. These findings open up the possibility of an environmental modulation of lipid alterations in ASDs, for example through the diet. In this sense, various dietary supplementation treatments in patients with ASDs were tested with promising results [34,35]. Of note, the very few clinical trials included in the present review regard attempts to modify the lipid panel, either through diet or through dietary supplements [33,41,46]. Meguild and colleagues remarked the role of fish oil supplementation in increasing plasma levels of DHA, as well as in improving the clinical symptoms of subjects affected by autism [46]. On the other hand, Blazewicz and collaborators identified a specific correlation between nutritional habits and plasma cholesterol levels (TC, HDL and non-HDL cholesterol) [33]. These studies open the perspective of modifying diet styles to improve the prognosis of patients with ASDs.
Several clinical trials currently underway are based precisely on the hypothesis of the metabolic etiology of the ASDs and analyze in particular the possibilities of intervention on the nutritional side. In particular, trials were carried out to test specific diets, such as the ketogenic diet or the gluten-free one, as potential modifiers of the clinical course of patients affected by ASDs [33,34]. The pathogenetic hypothesis underlying these attempts is essentially based on the possibility of modulating the intestinal microbiome, which in recent years has been recognized as a factor implicated in the onset of psychiatric symptoms [36]. In fact, through the diet or through the use of probiotics it is possible to modify the intestinal microbiome and, thus, its critical role in the regulation of immunity and brain function [35,37].
Major limitations of the included studies are:
- (1)
- a high heterogeneity of study designs, with a wide range of sample sizes, involving in some cases very small groups, so largely limiting the statistical power (rarely reported by authors);
- (2)
- differences in the type of cell or biological material (e.g., RBCs or plasma) used to measure the lipid/fatty acid profile;
- (3)
- the possible influence of concurrent pharmacological treatment on lipid levels and other potential confounding factors, including the concomitance of psychiatric or medical comorbidity;
- (4)
- the heterogeneity in the number of fatty acids tested and/or described in the different reports.
Finally, the high number of observational reports does not allow the exclusion of a possible reverse causality until more controlled clinical trials are available. For all these reasons, the data reported in this article have to be considered as preliminary and need to be confirmed by further research studies.
A final aspect to underline is the predominance of male sex in the samples of the included studies, in agreement with the available literature [85]. The present manuscript had not as purpose the evaluation of the impact of gender on lipid profile of subjects affected by ASDs; however, this aspect could be investigated by future meta-regression analyses. In conclusion, to better understand the role of cholesterol and fatty acids in the pathogenesis of ASDs, it would be helpful to enrich the available literature with studies having controlled designs, with reliable sample sizes and long-term follow-up.
Author Contributions
C.M.E.: Methodology, Investigation, Data curation, Writing—Original draft preparation, M.B.: Conceptualization, Methodology, Validation, Writing—Original draft preparation, Supervision, Writing—review and editing, V.C.: Writing—review and editing, Supervision, C.A.: Conceptualization, Writing—review and editing, Supervision, P.B.: Conceptualization, Writing—review and editing, Supervision. All authors have read and agreed to the published version of the manuscript.
Funding
The authors received no financial support for the research, authorship and/or publication of this article.
Data Availability Statement
Not applicable.
Acknowledgments
PB was partially supported by grants from the Ministry of Health (RF-2016-02364582).
Conflicts of Interest
The authors declare no conflict of interest.
Abbreviations
| AA | arachidonic acid |
| APOB | apoprotein B |
| ASD | autism spectrum disorder |
| BMI | body mass index |
| CE | cholesterol ester |
| CRP | C-reactive protein |
| CS | cholesterol sulfate |
| DD | developmental delay |
| DHA | docosahexaenoic acid |
| EPA | eicosapentaenoic acid |
| FA | fatty acids |
| FAD | fatty acids deficiency |
| FS | free sterol |
| GF-CF | gluten-casein-free diet |
| GI | gastrointestinal |
| GM1 | ganglioside GM1 |
| HBL | hypobetalipoproteinemia |
| HC | healthy controls |
| HDL-C | high-density lipoprotein |
| ID | intellectual disabilities |
| LDL-C | low-density lipoprotein |
| LFD | low-fat diet |
| MDA-LDL | malondialdehyde-modified low-density lipoprotein |
| PC | phosphatidylcholine |
| PE | phosphatidylethanolamine |
| PS | phosphatidylserine |
| PUFA | polyunsaturated fatty acids |
| RBC | red blood cell |
| RD | regular diet |
| SLOS | Smith-Lemli-Opitz Syndrome |
| TC | total cholesterol |
| TG | triglycerides |
| VLDL | very-low-density lipoprotein |
| 7-DHC | 7-dehydrocholesterol |
| 8-DHC | 8-dehydrocholesterol |
References
- American Psychiatric Association. Diagnostic and Statistical Manual of Mental Disorders: DSM-5; American Psychiatric Press: Washington, DC, USA, 2013. [Google Scholar]
- Carmo, J.C.; Rumiati, R.I.; Siugzdaite, R.; Brambilla, P. Preserved Imitation of Known Gestures in Children with High-Functioning Autism. ISRN Neurol. 2013, 2013, 751516. [Google Scholar] [CrossRef]
- Grecucci, A.; Brambilla, P.; Siugzdaite, R.; Londero, D.; Fabbro, F.; Rumiati, R.I. Emotional Resonance Deficits in Autistic Children. J. Autism Dev. Disord. 2012, 43, 616–628. [Google Scholar] [CrossRef]
- Frye, R.E. Social Skills Deficits in Autism Spectrum Disorder: Potential Biological Origins and Progress in Developing Therapeutic Agents. CNS Drugs 2018, 32, 713–734. [Google Scholar] [CrossRef]
- Calderoni, S.; Bellani, M.; Hardan, A.Y.; Muratori, F.; Brambilla, P. Basal ganglia and restricted and re-petitive behaviours in Autism Spectrum Disorders: Current status and future perspectives. Epidemiol. Psychiatr. Sci. 2014, 23, 235–238. [Google Scholar] [CrossRef] [PubMed]
- Masi, A.; DeMayo, M.M.; Glozier, N.; Guastella, A.J. An Overview of Autism Spectrum Disorder, Heterogeneity and Treatment Options. Neurosci. Bull. 2017, 33, 183–193. [Google Scholar] [CrossRef]
- Piccin, S.; Crippa, A.; Nobile, M.; Hardan, A.Y.; Brambilla, P. Video modeling for the development of personal hygiene skills in youth with autism spectrum disorder. Epidemiol. Psychiatr. Sci. 2017, 27, 127–132. [Google Scholar] [CrossRef]
- DeFilippis, M.; Wagner, K.D. Treatment of Autism Spectrum Disorder in Children and Adolescents. Psychopharmacol. Bull. 2016, 46, 18–41. [Google Scholar]
- Sanchack, K.E.; Thomas, C.A. Autism Spectrum Disorder: Primary Care Principles. Am. Fam. Physician 2016, 94, 972–979. [Google Scholar] [PubMed]
- Bellani, M.; Calderoni, S.; Muratori, F.; Brambilla, P. Brain anatomy of autism spectrum disorders I. Focus on corpus callosum. Epidemiol. Psychiatr. Sci. 2013, 22, 217–221. [Google Scholar] [CrossRef] [PubMed]
- Brambilla, P.; Hardan, A.Y.; Di Nemi, S.U.; Caverzasi, E.; Soares, J.C.; Perez, J.; Barale, F. The functional neuroanatomy of autism. Funct. Neurol. 2004, 19, 9–18. [Google Scholar] [PubMed]
- Mengotti, P.; D’Agostini, S.; Terlevic, R.; De Colle, C.; Biasizzo, E.; Londero, D.; Ferro, A.; Rambaldelli, G.; Balestrieri, M.; Zanini, S.; et al. Altered white matter integrity and development in children with autism: A combined voxel-based morphometry and diffusion imaging study. Brain Res. Bull. 2011, 84, 189–195. [Google Scholar] [CrossRef] [PubMed]
- Lord, C.; Elsabbagh, M.; Baird, G.; Veenstra-Vanderweele, J. Autism spectrum disorder. Lancet 2018, 392, 508–520. [Google Scholar] [CrossRef]
- Picardi, A.; Fagnani, C.; Medda, E.; Toccaceli, V.; Brambilla, P.; Stazi, M.A. Genetic and environmental influences underlying the relationship between autistic traits and temperament and character dimensions in adulthood. Compr. Psychiatry 2015, 58, 178–188. [Google Scholar] [CrossRef]
- Bellani, M.; Calderoni, S.; Muratori, F.; Brambilla, P. Brain anatomy of autism spectrum disorders II. Focus on amygdala. Epidemiol. Psychiatr. Sci. 2013, 22, 309–312. [Google Scholar] [CrossRef]
- Frye, R.E.; Vassall, S.; Kaur, G.; Lewis, C.; Karim, M.; Rossignol, D. Emerging biomarkers in autism spectrum disorder: A systematic review. Ann. Transl. Med. 2019, 7, 792. [Google Scholar] [CrossRef]
- Zoccante, L.; Viviani, A.; Ferro, A.; Cerini, R.; Cerruti, S.; Rambaldelli, G.; Bellani, M.; Dusi, N.; Perlini, C.; Boscaini, F.; et al. Increased left parietal volumes relate to delayed language development in autism: A structural mri study. Funct. Neurol. 2011, 25, 217–221. [Google Scholar]
- Agostoni, C.; Nobile, M.; Ciappolino, V.; Delvecchio, G.; Tesei, A.; Turolo, S.; Crippa, A.; Mazzocchi, A.; Altamura, C.A.; Brambilla, P. The Role of Omega-3 Fatty Acids in Developmental Psychopathology: A Systematic Review on Early Psychosis, Autism, and ADHD. Int. J. Mol. Sci. 2017, 18, 2608. [Google Scholar] [CrossRef] [PubMed]
- Botturi, A.; Ciappolino, V.; DelVecchio, G.; Boscutti, A.; Viscardi, B.; Brambilla, P. The Role and the Effect of Magnesium in Mental Disorders: A Systematic Review. Nutrients 2020, 12, 1661. [Google Scholar] [CrossRef]
- Shen, L.; Liu, X.; Zhang, H.; Lin, J.; Feng, C.; Iqbal, J. Biomarkers in autism spectrum disorders: Current progress. Clin. Chim. Acta 2020, 502, 41–54. [Google Scholar] [CrossRef] [PubMed]
- Calderoni, S.; Billeci, L.; Narzisi, A.; Brambilla, P.; Retico, A.; Muratori, F. Rehabilitative Interventions and Brain Plasticity in Autism Spectrum Disorders: Focus on MRI-Based Studies. Front. Neurosci. 2016, 10, 139. [Google Scholar] [CrossRef]
- Gao, R.; Penzes, P. Common mechanisms of excitatory and inhibitory imbalance in schizophrenia and autism spectrum disorders. Curr. Mol. Med. 2015, 15, 146–167. [Google Scholar] [CrossRef]
- Giuliano, A.; Saviozzi, I.; Brambilla, P.; Muratori, F.; Retico, A.; Calderoni, S. The effect of age, sex and clinical features on the volume of Corpus Callosum in pre-schoolers with Autism Spectrum Disorder: A case-control study. Eur. J. Neurosci. 2018, 47, 568–578. [Google Scholar] [CrossRef]
- Mohammad-Rezazadeh, I.; Frohlich, J.; Loo, S.K.; Jeste, S.S. Brain connectivity in autism spectrum disorder. Curr. Opin. Neurol. 2016, 29, 137–147. [Google Scholar] [CrossRef]
- Serati, M.; DelVecchio, G.; Orsenigo, G.; Mandolini, G.M.; Lazzaretti, M.; Scola, E.; Triulzi, F.; Brambilla, P. The Role of the Subplate in Schizophrenia and Autism: A Systematic Review. Neuroscience 2019, 408, 58–67. [Google Scholar] [CrossRef]
- Petrov, A.M.; Kasimov, M.R.; Zefirov, A.L. Cholesterol in the Pathogenesis of Alzheimer’s, Parkinson’s Diseases and Autism: Link to Synaptic Dysfunction. Acta Naturae 2017, 9, 26–37. [Google Scholar] [CrossRef]
- Wang, H. Lipid rafts: A signaling platform linking cholesterol metabolism to synaptic deficits in autism spectrum disorders. Front. Behav. Neurosci. 2014, 8. [Google Scholar] [CrossRef] [PubMed]
- Segatto, M.; Tonini, C.; Pfrieger, F.W.; Trezza, V.; Pallottini, V. Loss of Mevalonate/Cholesterol Homeostasis in the Brain: A Focus on Autism Spectrum Disorder and Rett Syndrome. Int. J. Mol. Sci. 2019, 20, 3317. [Google Scholar] [CrossRef]
- Paul, S.M.; Doherty, J.J.; Robichaud, A.J.; Belfort, G.M.; Chow, B.Y.; Hammond, R.S.; Crawford, D.C.; Linsenbardt, A.J.; Shu, H.-J.; Izumi, Y.; et al. The Major Brain Cholesterol Metabolite 24(S)-Hydroxycholesterol Is a Potent Allosteric Modulator of N-Methyl-D-Aspartate Receptors. J. Neurosci. 2013, 33, 17290–17300. [Google Scholar] [CrossRef]
- Nasrallah, H.A. The puzzling relationship between cholesterol and psychopathology. Curr. Psychiatry 2018, 17, 4–5. [Google Scholar]
- Kawicka, A.; Regulska-Ilow, B. How nutritional status, diet and dietary supplements can affect autism. A review. Roczniki Państwowego Zakładu Higieny 2013, 64, 1–12. [Google Scholar] [PubMed]
- Gillberg, C.; Fernell, E.; Kočovská, E.; Minnis, H.; Bourgeron, T.; Thompson, L.; Allely, C.S. The role of cholesterol metabolism and various steroid abnormalities in autism spectrum disorders: A hypothesis paper. Autism Res. 2017, 10, 1022–1044. [Google Scholar] [CrossRef]
- Błażewicz, A.; Szymańska, I.; Astel, A.; Stenzel-Bembenek, A.; Dolliver, W.R.; Makarewicz, A. Assessment of Changes over Time of Lipid Profile, C-Reactive Protein Level and Body Mass Index in Teenagers and Young Adults on Different Diets Belonging to Autism Spectrum Disorder. Nutrients 2020, 12, 2594. [Google Scholar] [CrossRef]
- Lee, R.W.Y.; Corley, M.J.; Pang, A.; Arakaki, G.; Abbott, L.; Nishimoto, M.; Miyamoto, R.; Lee, E.; Yamamoto, S.; Maunakea, A.K.; et al. A modified ketogenic gluten-free diet with MCT improves behavior in children with autism spectrum disorder. Physiol. Behav. 2018, 188, 205–211. [Google Scholar] [CrossRef]
- Peretti, S.; Mariano, M.; Mazzocchetti, C.; Mazza, M.; Pino, M.C.; Di Pianella, A.V.; Valenti, M. Diet: The keystone of autism spectrum disorder? Nutr. Neurosci. 2019, 22, 825–839. [Google Scholar] [CrossRef]
- Bastiaanssen, T.F.S.; Cowan, C.S.M.; Claesson, M.J.; Dinan, T.G.; Cryan, J.F. Making Sense of … the Microbiome in Psychiatry. Int. J. Neuropsychopharmacol. 2019, 22, 37–52. [Google Scholar] [CrossRef] [PubMed]
- Sivamaruthi, B.S.; Suganthy, N.; Kesika, P.; Chaiyasut, C. The Role of Microbiome, Dietary Supplements, and Probiotics in Autism Spectrum Disorder. Int. J. Environ. Res. Public Health 2020, 17, 2647. [Google Scholar] [CrossRef]
- Tierney, E.; Nwokoro, N.A.; Porter, F.D.; Freund, L.S.; Ghuman, J.K.; Kelley, R.I. Behavior phenotype in the RSH/Smith-Lemli-Opitz syndrome. Am. J. Med. Genet. 2001, 98, 191–200. [Google Scholar] [CrossRef]
- Vancassel, S.; Durand, G.; Barthélémy, C.; Lejeune, B.; Martineau, J.; Guilloteau, D.; Andrès, C.; Chalon, S. Plasma fatty acid levels in autistic children. Prostaglandins Leukot. Essent. Fat. Acids 2001, 65, 1–7. [Google Scholar] [CrossRef]
- Goldenberg, A.; Chevy, F.; Bernard, C.; Wolf, C.; Cormier-Daire, V. Circonstances cliniques du diagnostic du syndrome de Smith-Lemli-Opitz et tentatives de corrélation phénotype-génotype: À propos de 45 cas [Clinical characteristics and diagnosis of Smith-Lemli-Opitz syndrome and tentative phenotype-genotype correlation: Report of 45 cases]. Arch. Pediatr. 2003, 10, 4–10. [Google Scholar]
- Bell, J.; MacKinlay, E.; Dick, J.; MacDonald, D.; Boyle, R.; Glen, A. Essential fatty acids and phospholipase A2 in autistic spectrum disorders. Prostaglandins Leukot. Essent. Fat. Acids 2004, 71, 201–204. [Google Scholar] [CrossRef] [PubMed]
- Dziobek, I.; Gold, S.M.; Wolf, O.T.; Convit, A. Hypercholesterolemia in Asperger syndrome: Independence from lifestyle, obsessive-compulsive behavior, and social anxiety. Psychiatry Res. 2007, 149, 321–324. [Google Scholar] [CrossRef]
- Sikora, D.M.; Pettit-Kekel, K.; Penfield, J.; Merkens, L.S.; Steiner, R.D. The near universal presence of autism spectrum disorders in children with Smith–Lemli–Opitz syndrome. Am. J. Med Genet. Part A 2006, 140, 1511–1518. [Google Scholar] [CrossRef]
- Sliwinski, S.; Croonenberghs, J.; Christophe, A.; Deboutte, D.; Maes, M. Polyunsaturated fatty acids: Do they have a role in the pathophysiology of autism? Neuro Endocrinol. Lett. 2006, 27, 465–471. [Google Scholar] [PubMed]
- Tierney, E.; Bukelis, I.; Thompson, R.E.; Ahmed, K.; Aneja, A.; Kratz, L.; Kelley, R.I. Abnormalities of cholesterol metabolism in autism spectrum disorders. Am. J. Med Genet. Part B Neuropsychiatr. Genet. 2006, 141B, 666–668. [Google Scholar] [CrossRef] [PubMed]
- Meguid, N.A.; Atta, H.M.; Gouda, A.S.; Khalil, R.O. Role of polyunsaturated fatty acids in the man-agement of Egyptian children with autism. Clin. Biochem. 2008, 41, 1044–1048. [Google Scholar] [CrossRef] [PubMed]
- Bell, J.G.; Miller, D.; MacDonald, D.J.; MacKinlay, E.E.; Dick, J.R.; Cheseldine, S.; Boyle, R.M.; Graham, C.; O’Hare, A.E. The fatty acid compositions of erythrocyte and plasma polar lipids in children with autism, developmental delay or typically developing controls and the effect of fish oil intake. Br. J. Nutr. 2010, 103, 1160–1167. [Google Scholar] [CrossRef]
- Wiest, M.; German, J.; Harvey, D.; Watkins, S.; Hertz-Picciotto, I. Plasma fatty acid profiles in autism: A case-control study. Prostaglandins Leukot. Essent. Fat. Acids 2009, 80, 221–227. [Google Scholar] [CrossRef]
- Kim, E.K.; Neggers, Y.H.; Shin, C.S.; Kim, E.; Kim, E.M. Alterations in lipid profile of autistic boys: A case control study. Nutr. Res. 2010, 30, 255–260. [Google Scholar] [CrossRef]
- El-Ansary, A.K.; Ben Bacha, A.G.; Ayahdi, L.Y.A. Impaired plasma phospholipids and relative amounts of essential polyunsaturated fatty acids in autistic patients from Saudi Arabia. Lipids Health Dis. 2011, 10, 63. [Google Scholar] [CrossRef] [PubMed]
- El-Ansary, A.K.; Bacha, A.G.; Al-Ayahdi, L.Y. Plasma fatty acids as diagnostic markers in autistic patients from Saudi Arabia. Lipids Health Dis. 2011, 10, 62. [Google Scholar] [CrossRef]
- Schengrund, C.L.; Ali-Rahmani, F.; Ramer, J.C. Cholesterol, GM1, and autism. Neurochem. Res. 2012, 37, 1201–1207. [Google Scholar] [CrossRef]
- Fong, B.M.-W.; Tam, S.; Leung, K.S.-Y. Determination of plasma cholesterol sulfate by LC–APCI-MS/MS in the context of pediatric autism. Talanta 2013, 116, 115–121. [Google Scholar] [CrossRef] [PubMed]
- Ghezzo, A.; Visconti, P.; Abruzzo, P.M.; Bolotta, A.; Ferreri, C.; Gobbi, G.; Malisardi, G.; Manfredini, S.; Marini, M.; Nanetti, L.; et al. Oxidative Stress and Erythrocyte Membrane Alterations in Children with Autism: Correlation with Clinical Features. PLoS ONE 2013, 8, e66418. [Google Scholar] [CrossRef]
- Brown, C.M.; Austin, D.W.; Busija, L. Observable essential fatty acid deficiency markers and autism spectrum disorder. Breastfeed. Rev. Prof. Publ. Nurs. Mothers Assoc. Aust. 2014, 22, 21–26. [Google Scholar]
- Moses, L.; Katz, N.; Weizman, A. Metabolic profiles in adults with autism spectrum disorder and intellectual disabilities. Eur. Psychiatry 2014, 29, 397–401. [Google Scholar] [CrossRef] [PubMed]
- Brigandi, S.A.; Shao, H.; Qian, S.Y.; Shen, Y.; Wu, B.-L.; Kang, J.X. Autistic Children Exhibit Decreased Levels of Essential Fatty Acids in Red Blood Cells. Int. J. Mol. Sci. 2015, 16, 10061–10076. [Google Scholar] [CrossRef]
- Esparham, A.E.; Smith, T.; Belmont, J.M.; Haden, M.; Wagner, L.E.; Evans, R.G.; Drisko, J.A. Nutritional and Metabolic Biomarkers in Autism Spectrum Disorders: An Exploratory Study. Integr. Med. (Encinitas) 2015, 14, 40–53. [Google Scholar] [PubMed]
- Jory, J. Abnormal fatty acids in Canadian children with autism. Nutrition 2016, 32, 474–477. [Google Scholar] [CrossRef]
- Mostafa, G.A.; Al-Ayadhi, L.Y. Reduced levels of plasma polyunsaturated fatty acids and serum carnitine in autistic children: Relation to gastrointestinal manifestations. Behav. Brain Funct. 2015, 11, 4. [Google Scholar] [CrossRef]
- Yui, K.; Imataka, G.; Kawasak, Y.; Yamada, H. Increased ω-3 polyunsaturated fatty acid/arachidonic acid ratios and upregulation of signaling mediator in individuals with autism spectrum disorders. Life Sci. 2016, 145, 205–212. [Google Scholar] [CrossRef]
- Yui, K.; Imataka, G.; Kawasaki, Y.; Yamada, H. Down-regulation of a signaling mediator in association with lowered plasma arachidonic acid levels in individuals with autism spectrum disorders. Neurosci. Lett. 2016, 610, 223–228. [Google Scholar] [CrossRef] [PubMed]
- Parletta, N.; Niyonsenga, T.; Duff, J. Omega-3 and Omega-6 Polyunsaturated Fatty Acid Levels and Correlations with Symptoms in Children with Attention Deficit Hyperactivity Disorder, Autistic Spectrum Disorder and Typically Developing Controls. PLoS ONE 2016, 11, e0156432. [Google Scholar] [CrossRef]
- Puig-Alcaraz, C.; Fuentes-Albero, M.; Cauli, O. Relationship between adipic acid concentration and the core symptoms of autism spectrum disorders. Psychiatry Res. 2016, 242, 39–45. [Google Scholar] [CrossRef] [PubMed]
- Wang, H.; Liang, S.; Wang, M.; Gao, J.; Sun, C.; Wang, J.; Xia, W.; Wu, S.; Sumner, S.J.; Zhang, F.; et al. Potential serum biomarkers from a metabolomics study of autism. J. Psychiatry Neurosci. 2016, 41, 27–37. [Google Scholar] [CrossRef] [PubMed]
- Yui, K.; Imataka, G.; Kawasaki, Y. Competitive Interaction between Plasma Omega-3 Fatty Acids and Arachidonic Acid is Related to Down-Regulation of A Signaling Mediator. Med. Chem. 2016, 12, 318–327. [Google Scholar] [CrossRef]
- Cariou, B.; Challet-Bouju, G.; Bernard, C.; Marrec, M.; Hardouin, J.-B.; Authier, C.; Bach-Ngohou, K.; Leux, C.; Pichelin, M.; Grall-Bronnec, M. Prevalence of hypobetalipoproteinemia and related psychiatric characteristics in a psychiatric population: Results from the retrospective HYPOPSY Study. Lipids Health Dis. 2018, 17, 249. [Google Scholar] [CrossRef]
- Howsmon, D.P.; Adams, J.B.; Krüger, U.; Geis, E.; Gehn, E.; Hahn, J. Erythrocyte fatty acid profiles in children are not predictive of autism spectrum disorder status: A case control study. Biomark. Res. 2018, 6, 12. [Google Scholar] [CrossRef]
- Toscano, C.V.A.; Carvalho, H.M.; Ferreira, J.P. Exercise Effects for Children With Autism Spectrum Disorder: Metabolic Health, Autistic Traits, and Quality of Life. Percept Mot Skills. 2018, 125(1), 126–146. [Google Scholar] [CrossRef]
- Benachenhou, S.; Etcheverry, A.; Galarneau, L.; Dubé, J.; Çaku, A. Implication of hypocholesterolemia in autism spectrum disorder and its associated comorbidities: A retrospective case–control study. Autism Res. 2019, 12, 1860–1869. [Google Scholar] [CrossRef]
- Hassan, M.H.; Desoky, T.; Sakhr, H.M.; Gabra, R.H.; Bakri, A.H. Possible Metabolic Alterations among Autistic Male Children: Clinical and Biochemical Approaches. J. Mol. Neurosci. 2019, 67, 204–216. [Google Scholar] [CrossRef]
- Usui, N.; Iwata, K.; Miyachi, T.; Takagai, S.; Wakusawa, K.; Nara, T.; Tsuchiya, K.J.; Matsumoto, K.; Kurita, D.; Kameno, Y.; et al. VLDL-specific increases of fatty acids in autism spectrum disorder correlate with social interaction. EBioMedicine 2020, 58, 102917. [Google Scholar] [CrossRef]
- Yui, K.; Imataka, G.; Sasaki, H.; Shiroki, R. The role of lipid peroxidation in individuals with autism spectrum disorders. Metab. Brain Dis. 2020, 35, 1101–1108. [Google Scholar] [CrossRef]
- Crippa, A.; Del Vecchio, G.; Ceccarelli, S.B.; Nobile, M.; Arrigoni, F.; Brambilla, P. Cortico-Cerebellar Connectivity in Autism Spectrum Disorder: What Do We Know So Far? Front. Psychiatry 2016, 7. [Google Scholar] [CrossRef]
- El-Ansary, A.; Chirumbolo, S.; Bhat, R.S.; Dadar, M.; Ibrahim, E.M.; Bjørklund, G. The Role of Lipidomics in Autism Spectrum Disorder. Mol. Diagn. Ther. 2020, 24, 31–48. [Google Scholar] [CrossRef]
- Capuzzi, E.; Caldiroli, A.; Capellazzi, M.; Tagliabue, I.; Auxilia, A.; Ghilardi, G.; Buoli, M.; Clerici, M. Exploring the role of serum lipid profile and neutrophil-to-lymphocyte ratio in violent suicide attempters: A cross sectional study. CNS Spectr. 2020, 10, 1–7. [Google Scholar] [CrossRef] [PubMed]
- Buoli, M.; Caldiroli, L.; Guenzani, D.; Carnevali, G.S.; Cesari, M.; Turolo, S.; Barkin, J.L.; Messa, P.; Agostoni, C.; Vettoretti, S. Associations Between Cholesterol and Fatty Acid Profile on the Severity of Depression in Older Persons with Nondialysis Chronic Kidney Disease. J. Ren. Nutr. 2020. [Google Scholar] [CrossRef] [PubMed]
- Harvey, P.D.; Deckler, E.; Jones, M.T.; Jarskog, L.F.; Penn, D.L.; Pinkham, A.E. Autism symptoms, depression, and active social avoidance in schizophrenia: Association with self-reports and informant assessments of everyday functioning. J. Psychiatr. Res. 2019, 115, 36–42. [Google Scholar] [CrossRef]
- Macchi, C.; Favero, C.; Ceresa, A.; Vigna, L.; Conti, D.M.; Pesatori, A.C.; Racagni, G.; Corsini, A.; Ferri, N.; Sirtori, C.R.; et al. Depression and cardiovascular risk—Association among Beck Depression Inventory, PCSK9 levels and insulin resistance. Cardiovasc. Diabetol. 2020, 19, 1–11. [Google Scholar] [CrossRef]
- Brambilla, P.; Bellani, M.; Isola, M.; Bergami, A.; Marinelli, V.; Dusi, N.; Rambaldelli, G.; Tansella, M.; Finardi, A.M.; Martino, G.; et al. Increased M1/decreased M2 signature and signs of Th1/Th2 shift in chronic patients with bipolar disorder, but not in those with schizophrenia. Transl. Psychiatry 2014, 4, e406. [Google Scholar] [CrossRef] [PubMed]
- Bellani, M.; Zanette, G.; Zovetti, N.; Barillari, M.; Del Piccolo, L.; Brambilla, P. Adult Mild Encephalitis With Reversible Splenial Lesion Associated With Delirious Mania: A Case Report. Front. Psychiatry 2020, 11. [Google Scholar] [CrossRef] [PubMed]
- Guenzani, D.; Buoli, M.; Caldiroli, L.; Carnevali, G.S.; Serati, M.; Vezza, C.; Armelloni, S.; Messa, P.; Vettoretti, S. DREAM Project Group Malnutrition and inflammation are associated with severity of depressive and cognitive symptoms of old patients affected by chronic kidney disease. J. Psychosom. Res. 2019, 124, 109783. [Google Scholar] [CrossRef] [PubMed]
- Corradini, I.; Focchi, E.; Rasile, M.; Morini, R.; Desiato, G.; Tomasoni, R.; Lizier, M.; Ghirardini, E.; Fesce, R.; Morone, D.; et al. Maternal Immune Activation Delays Excitatory-to-Inhibitory Gamma-Aminobutyric Acid Switch in Offspring. Biol. Psychiatry 2018, 83, 680–691. [Google Scholar] [CrossRef] [PubMed]
- Qasem, H.; Al-Ayadhi, L.; Bjørklund, G.; Chirumbolo, S.; El-Ansary, A. Impaired lipid metabolism markers to assess the risk of neuroinflammation in autism spectrum disorder. Metab. Brain Dis. 2018, 33, 1141–1153. [Google Scholar] [CrossRef] [PubMed]
- Loomes, R.; Hull, L.; Mandy, W.P.L. What Is the Male-to-Female Ratio in Autism Spectrum Disorder? A Systematic Review and Meta-Analysis. J. Am. Acad. Child Adolesc. Psychiatry 2017, 56, 466–474. [Google Scholar] [CrossRef] [PubMed]
Publisher’s Note: MDPI stays neutral with regard to jurisdictional claims in published maps and institutional affiliations. |
© 2021 by the authors. Licensee MDPI, Basel, Switzerland. This article is an open access article distributed under the terms and conditions of the Creative Commons Attribution (CC BY) license (http://creativecommons.org/licenses/by/4.0/).