
Dynophore-Based Approach in Virtual Screening: A Case of Human DNA Topoisomerase IIα

 , , ,
, , ,  , and
, and 
Abstract
:1. Introduction
2. Results and Discussion
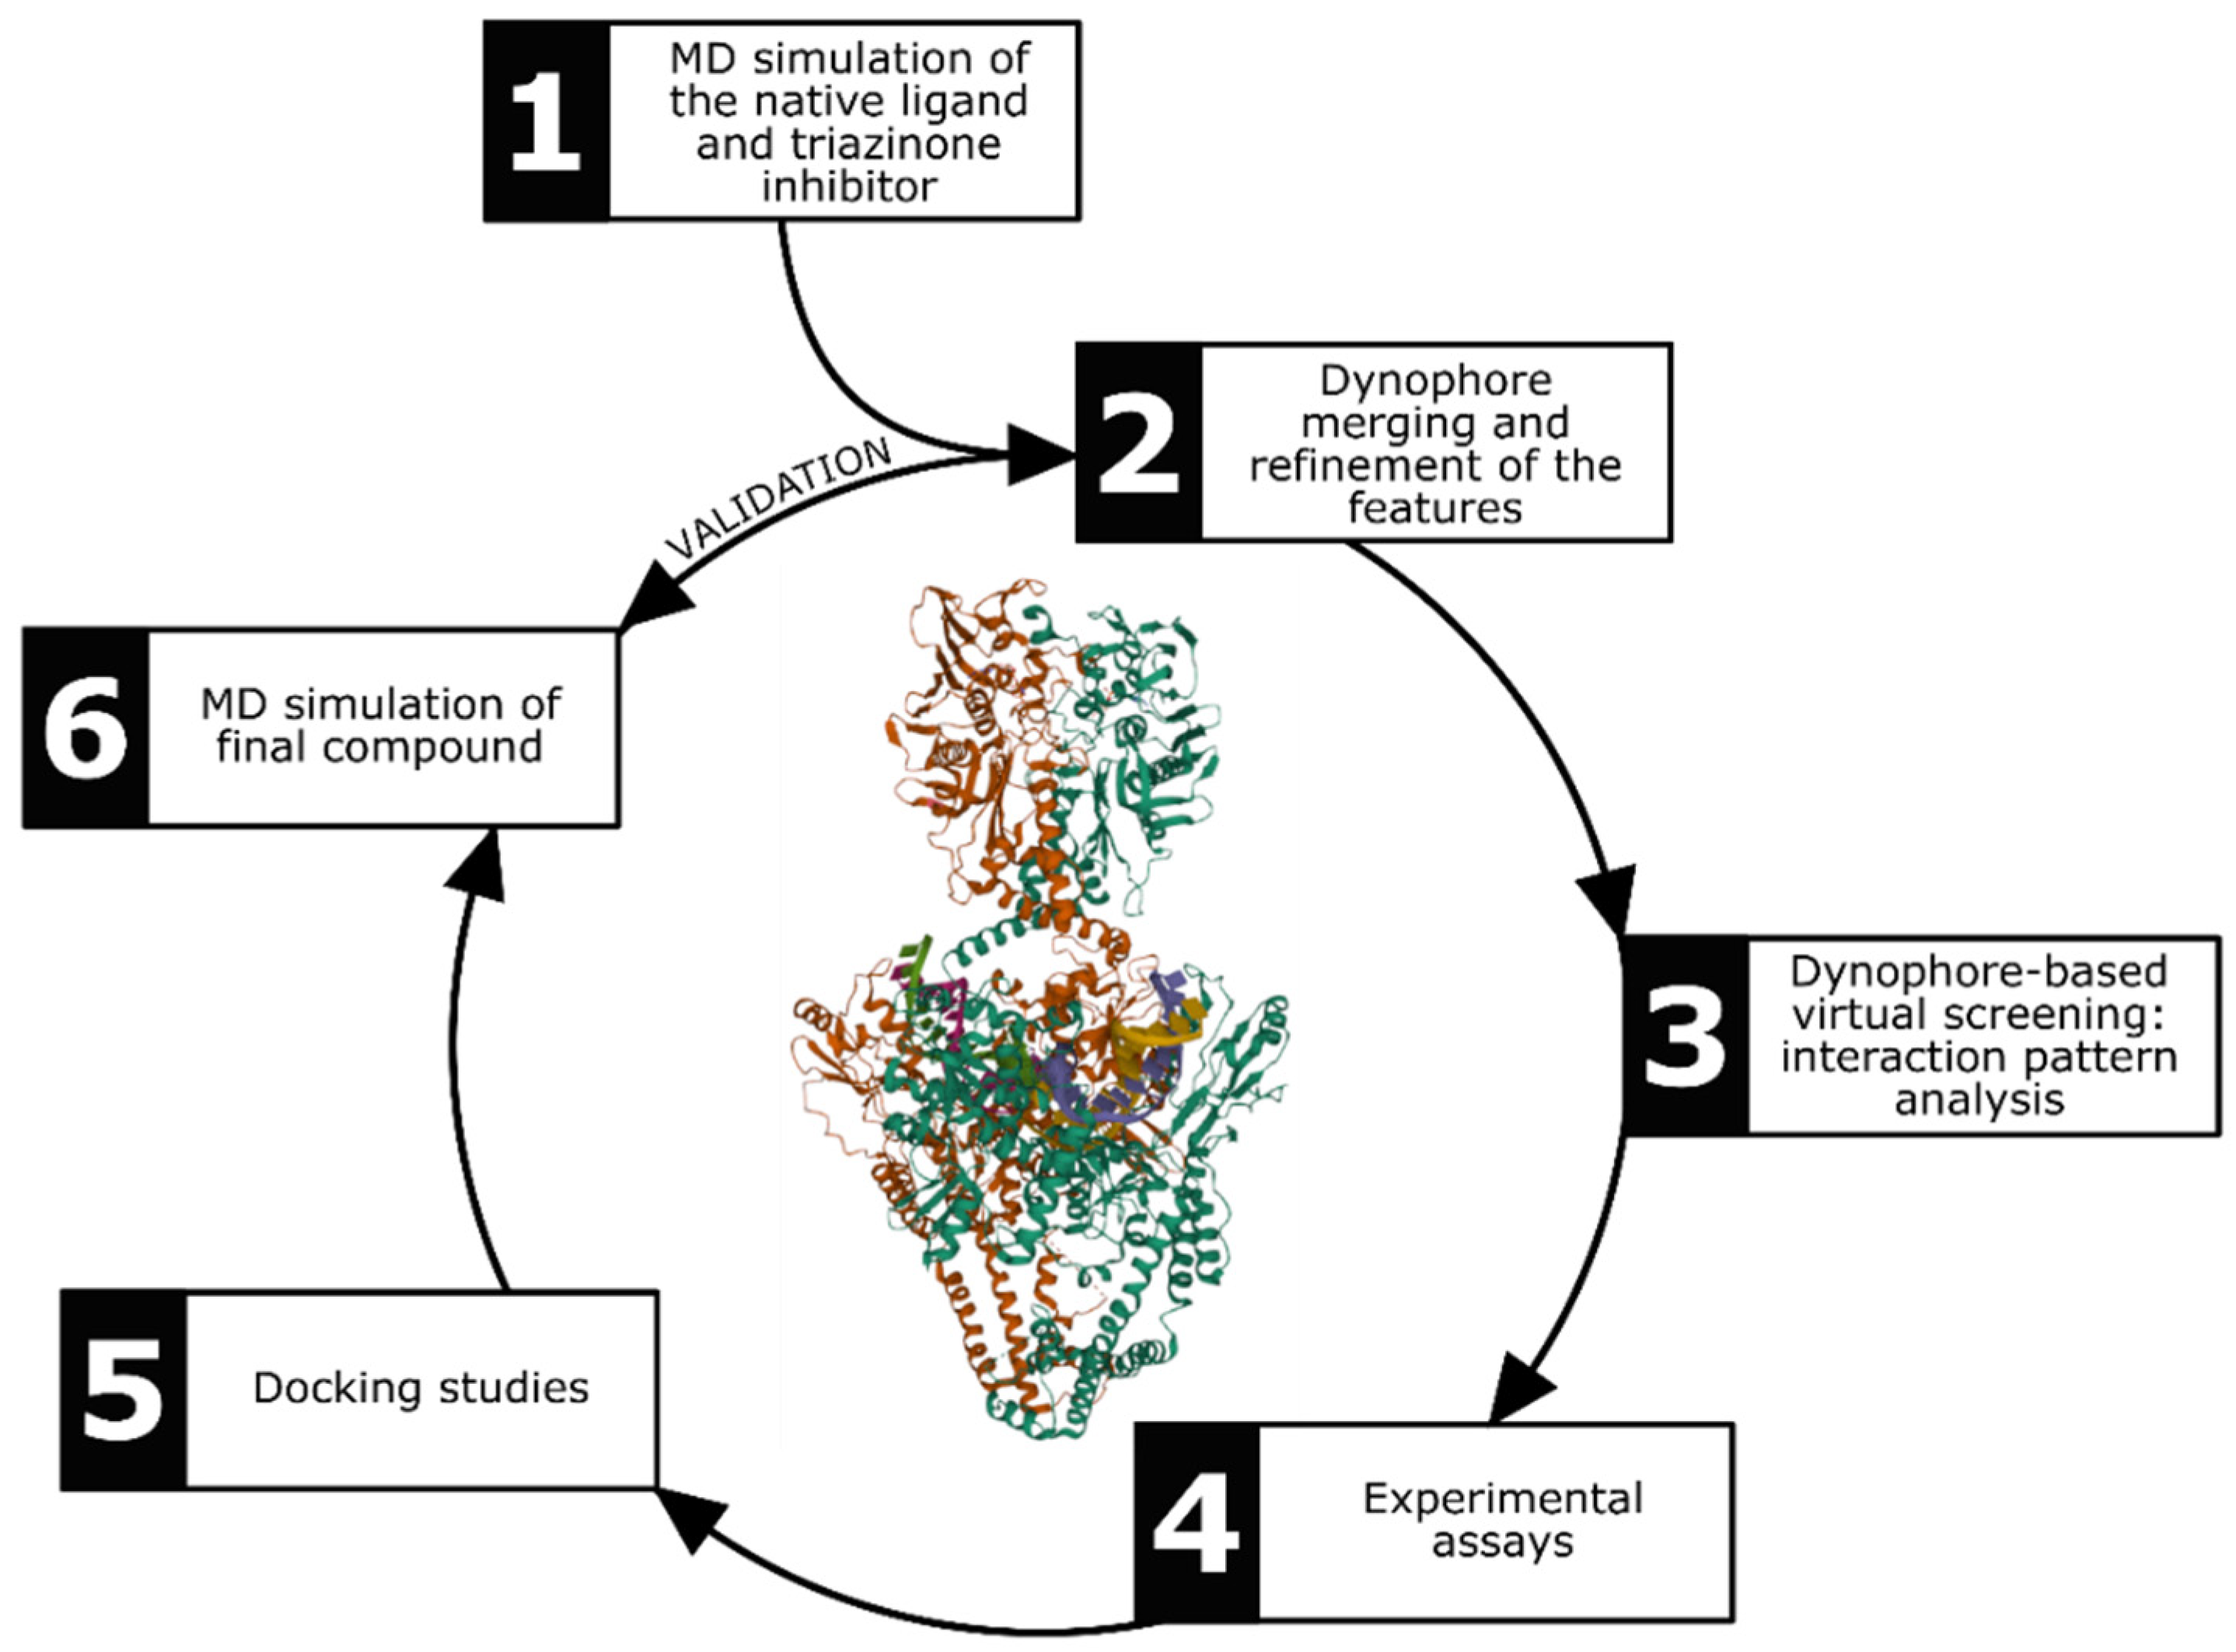
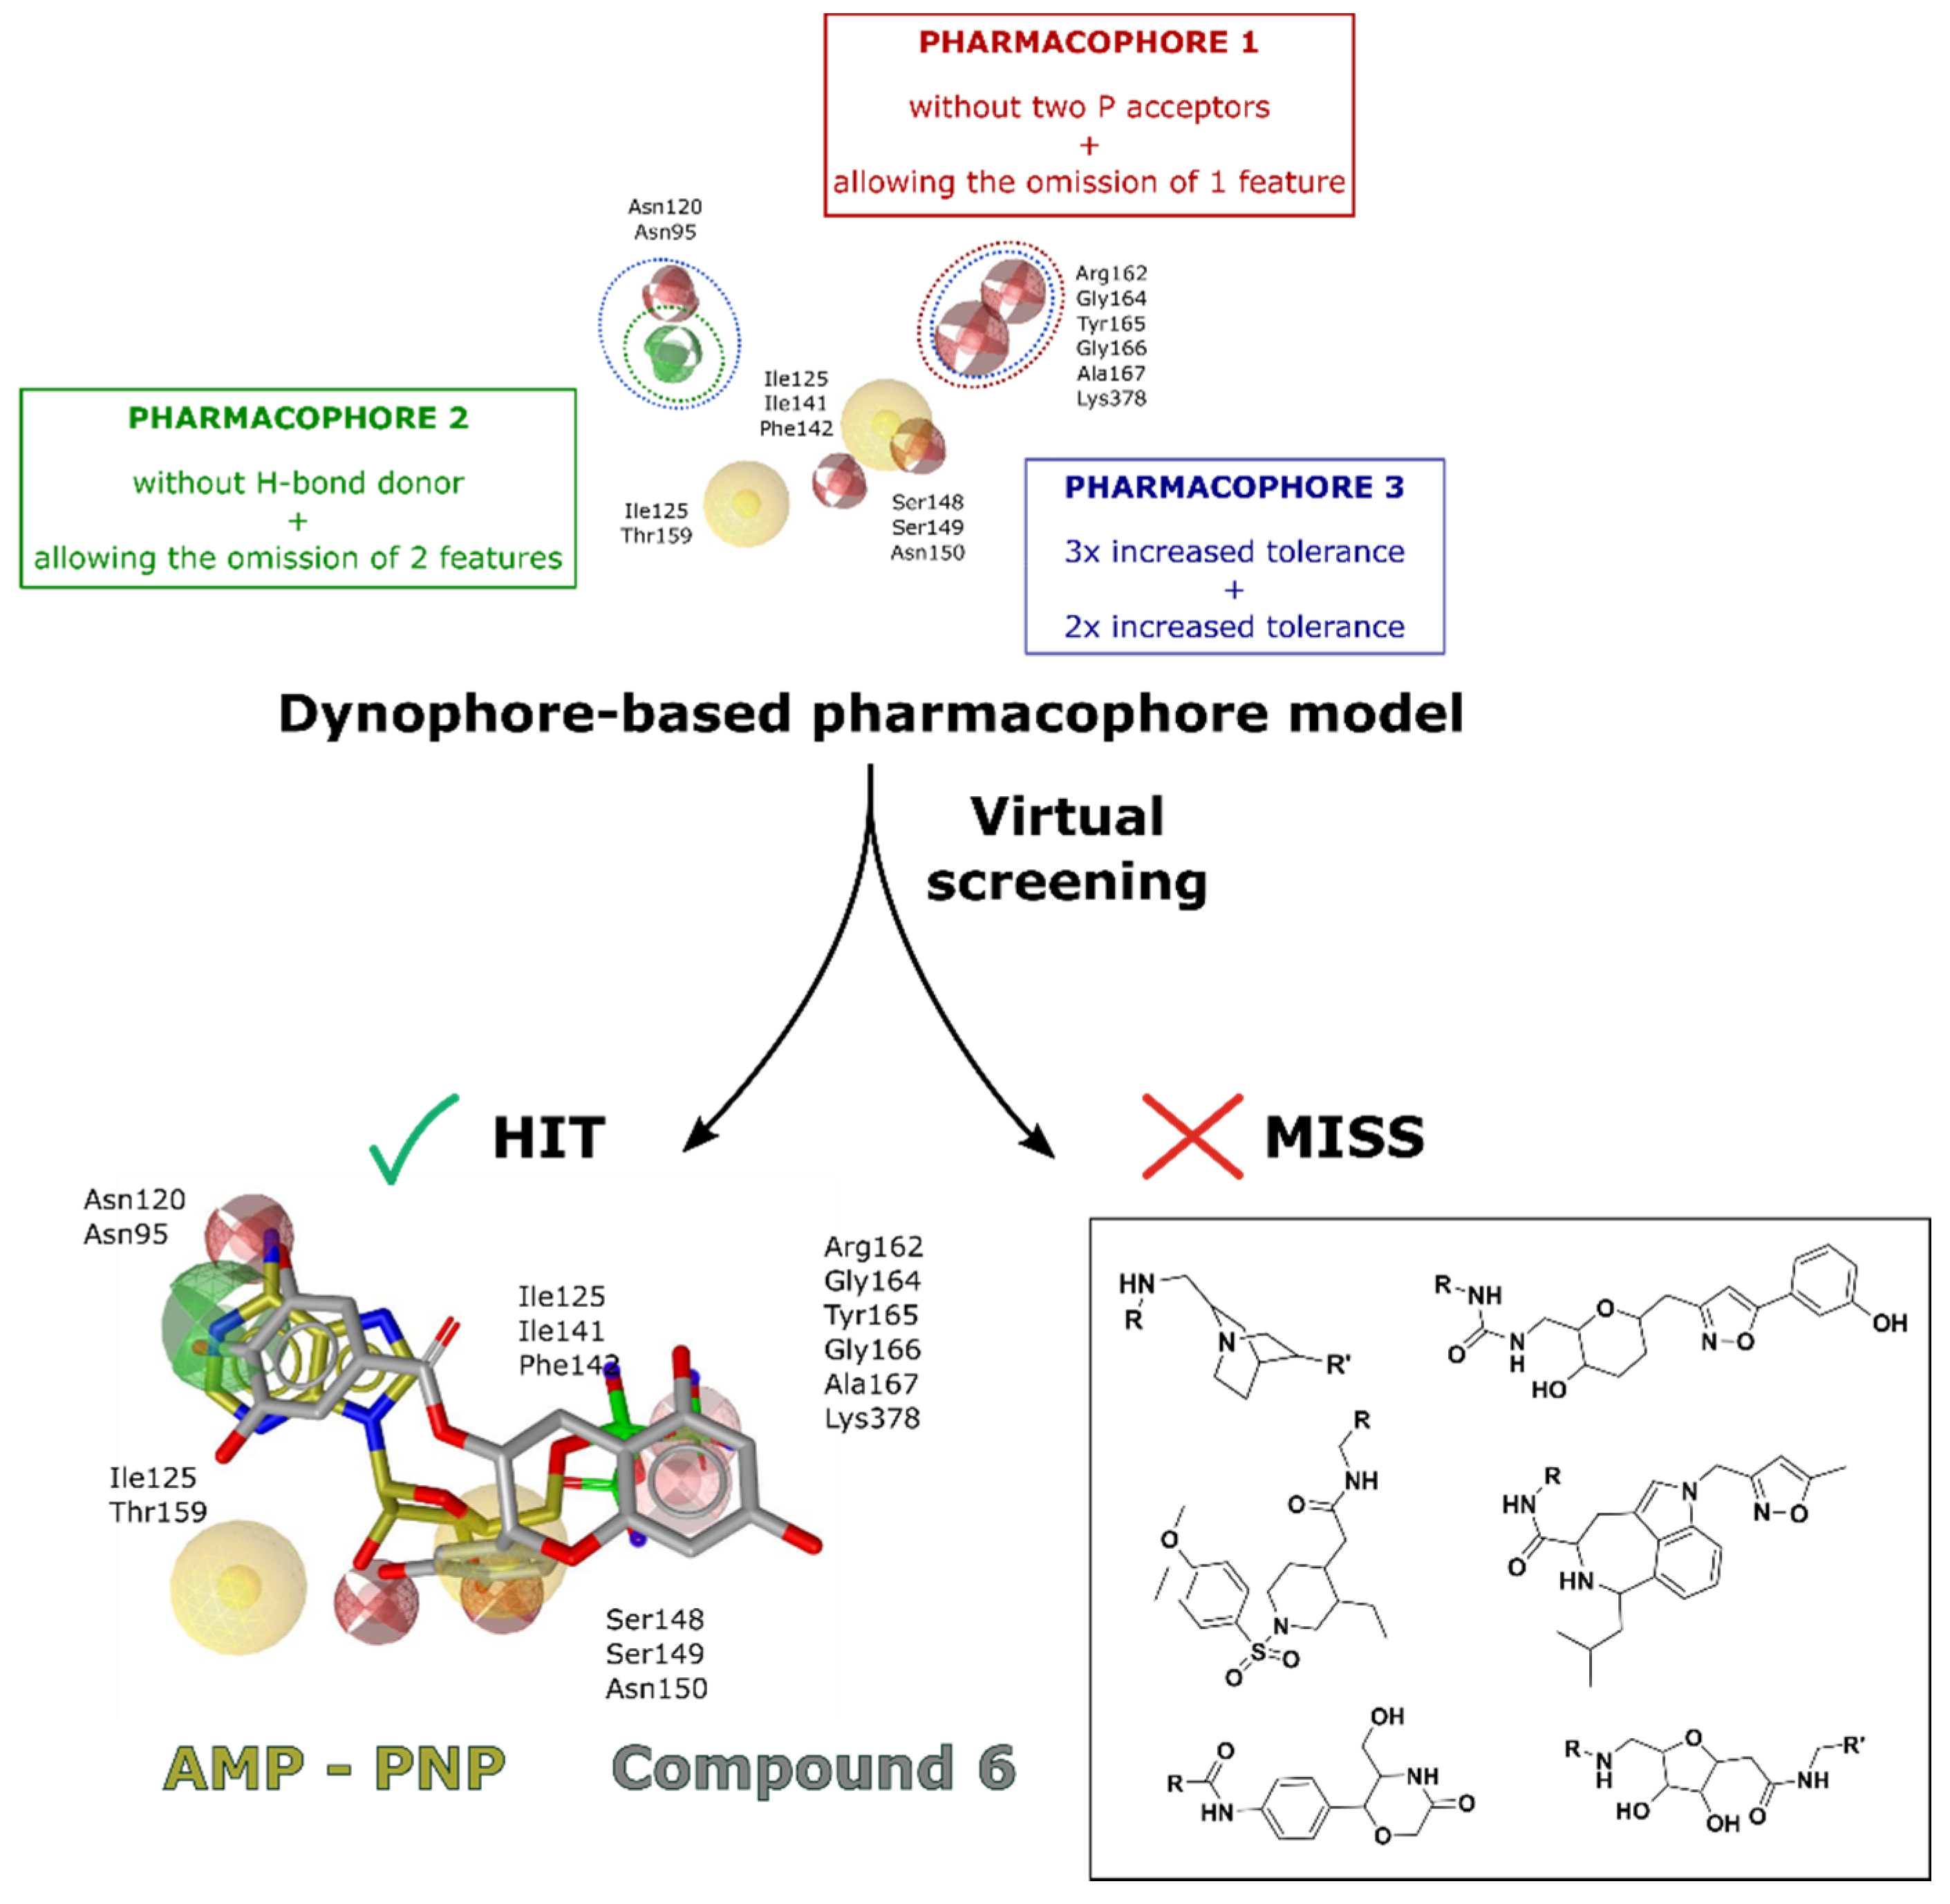
2.1. Dynophore-Based Molecular Design Strategy
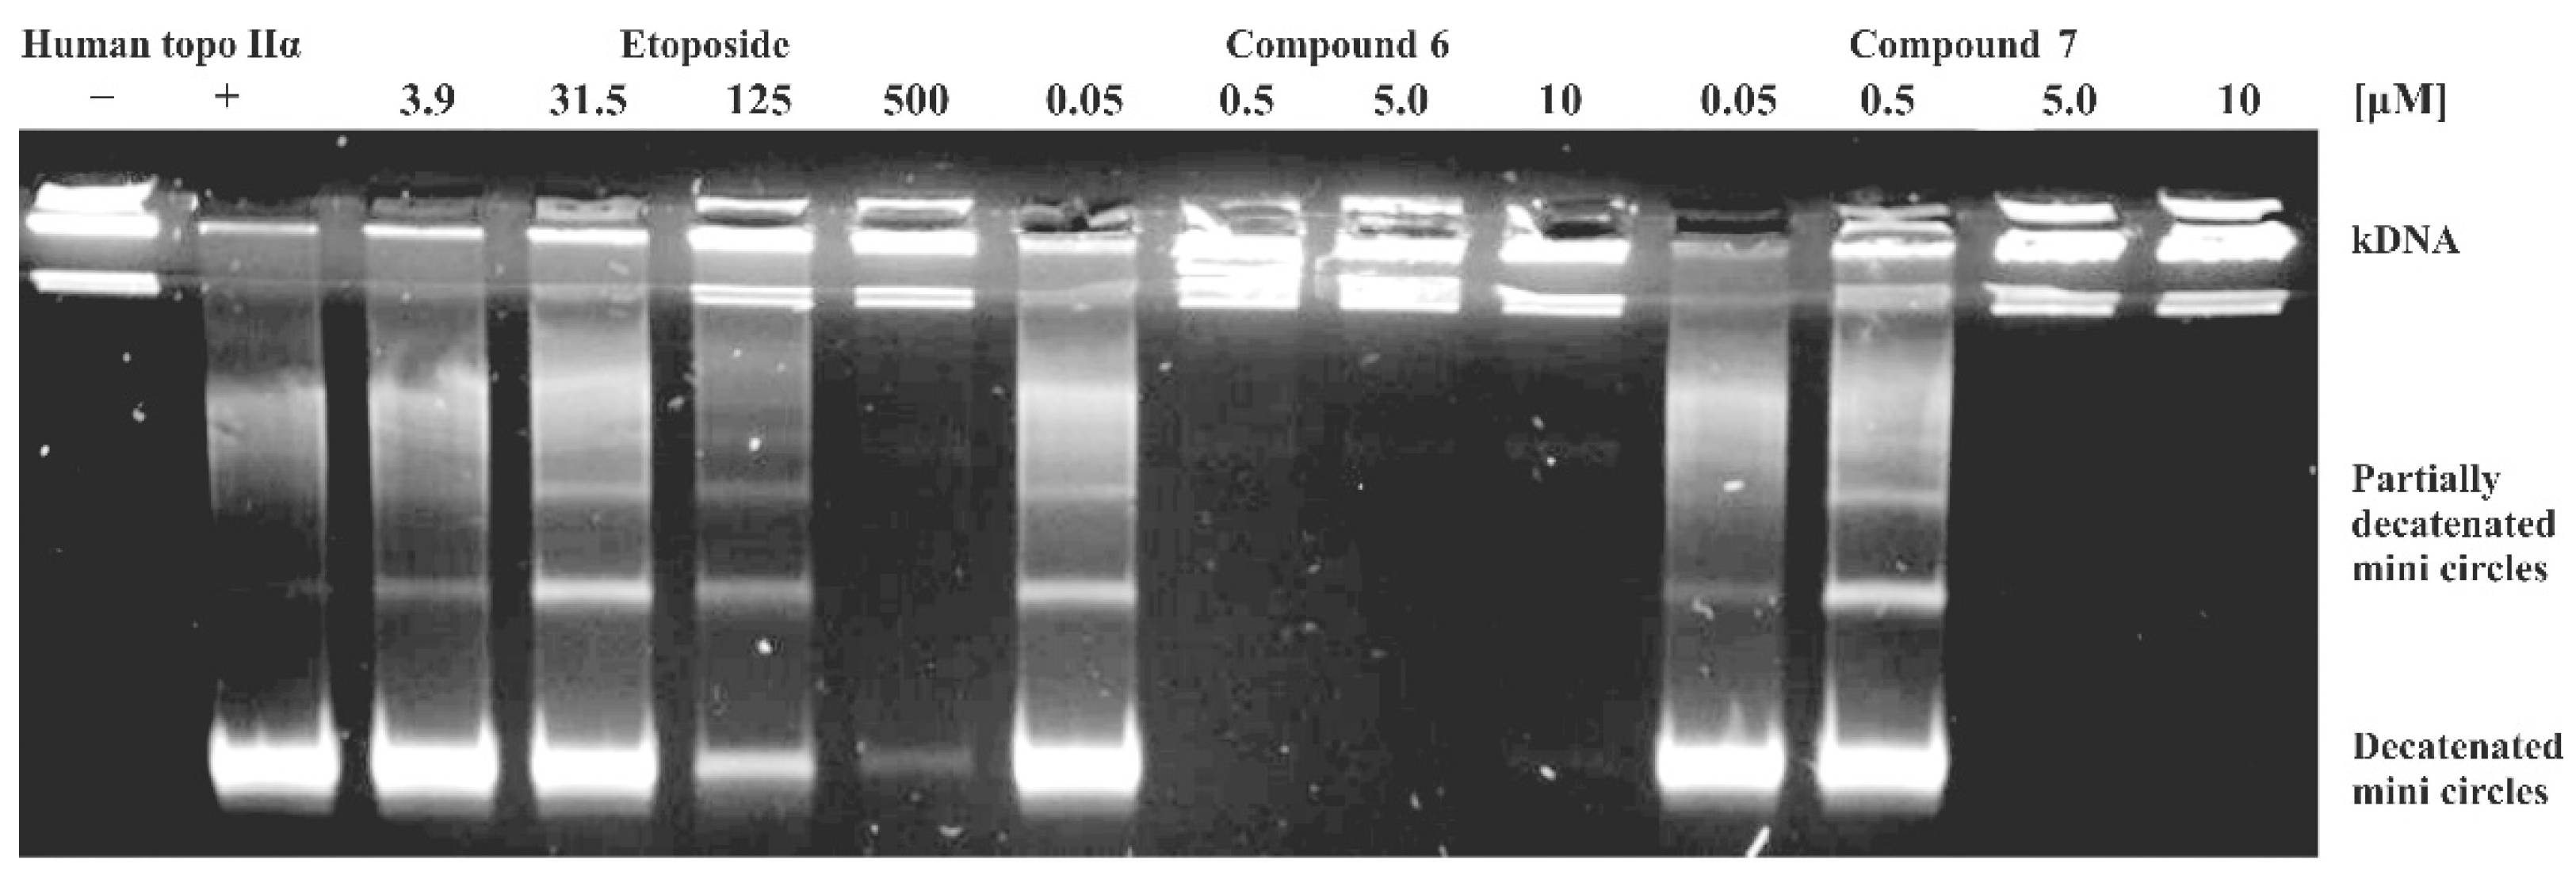
2.2. Human Topo IIα Inhibition Assays
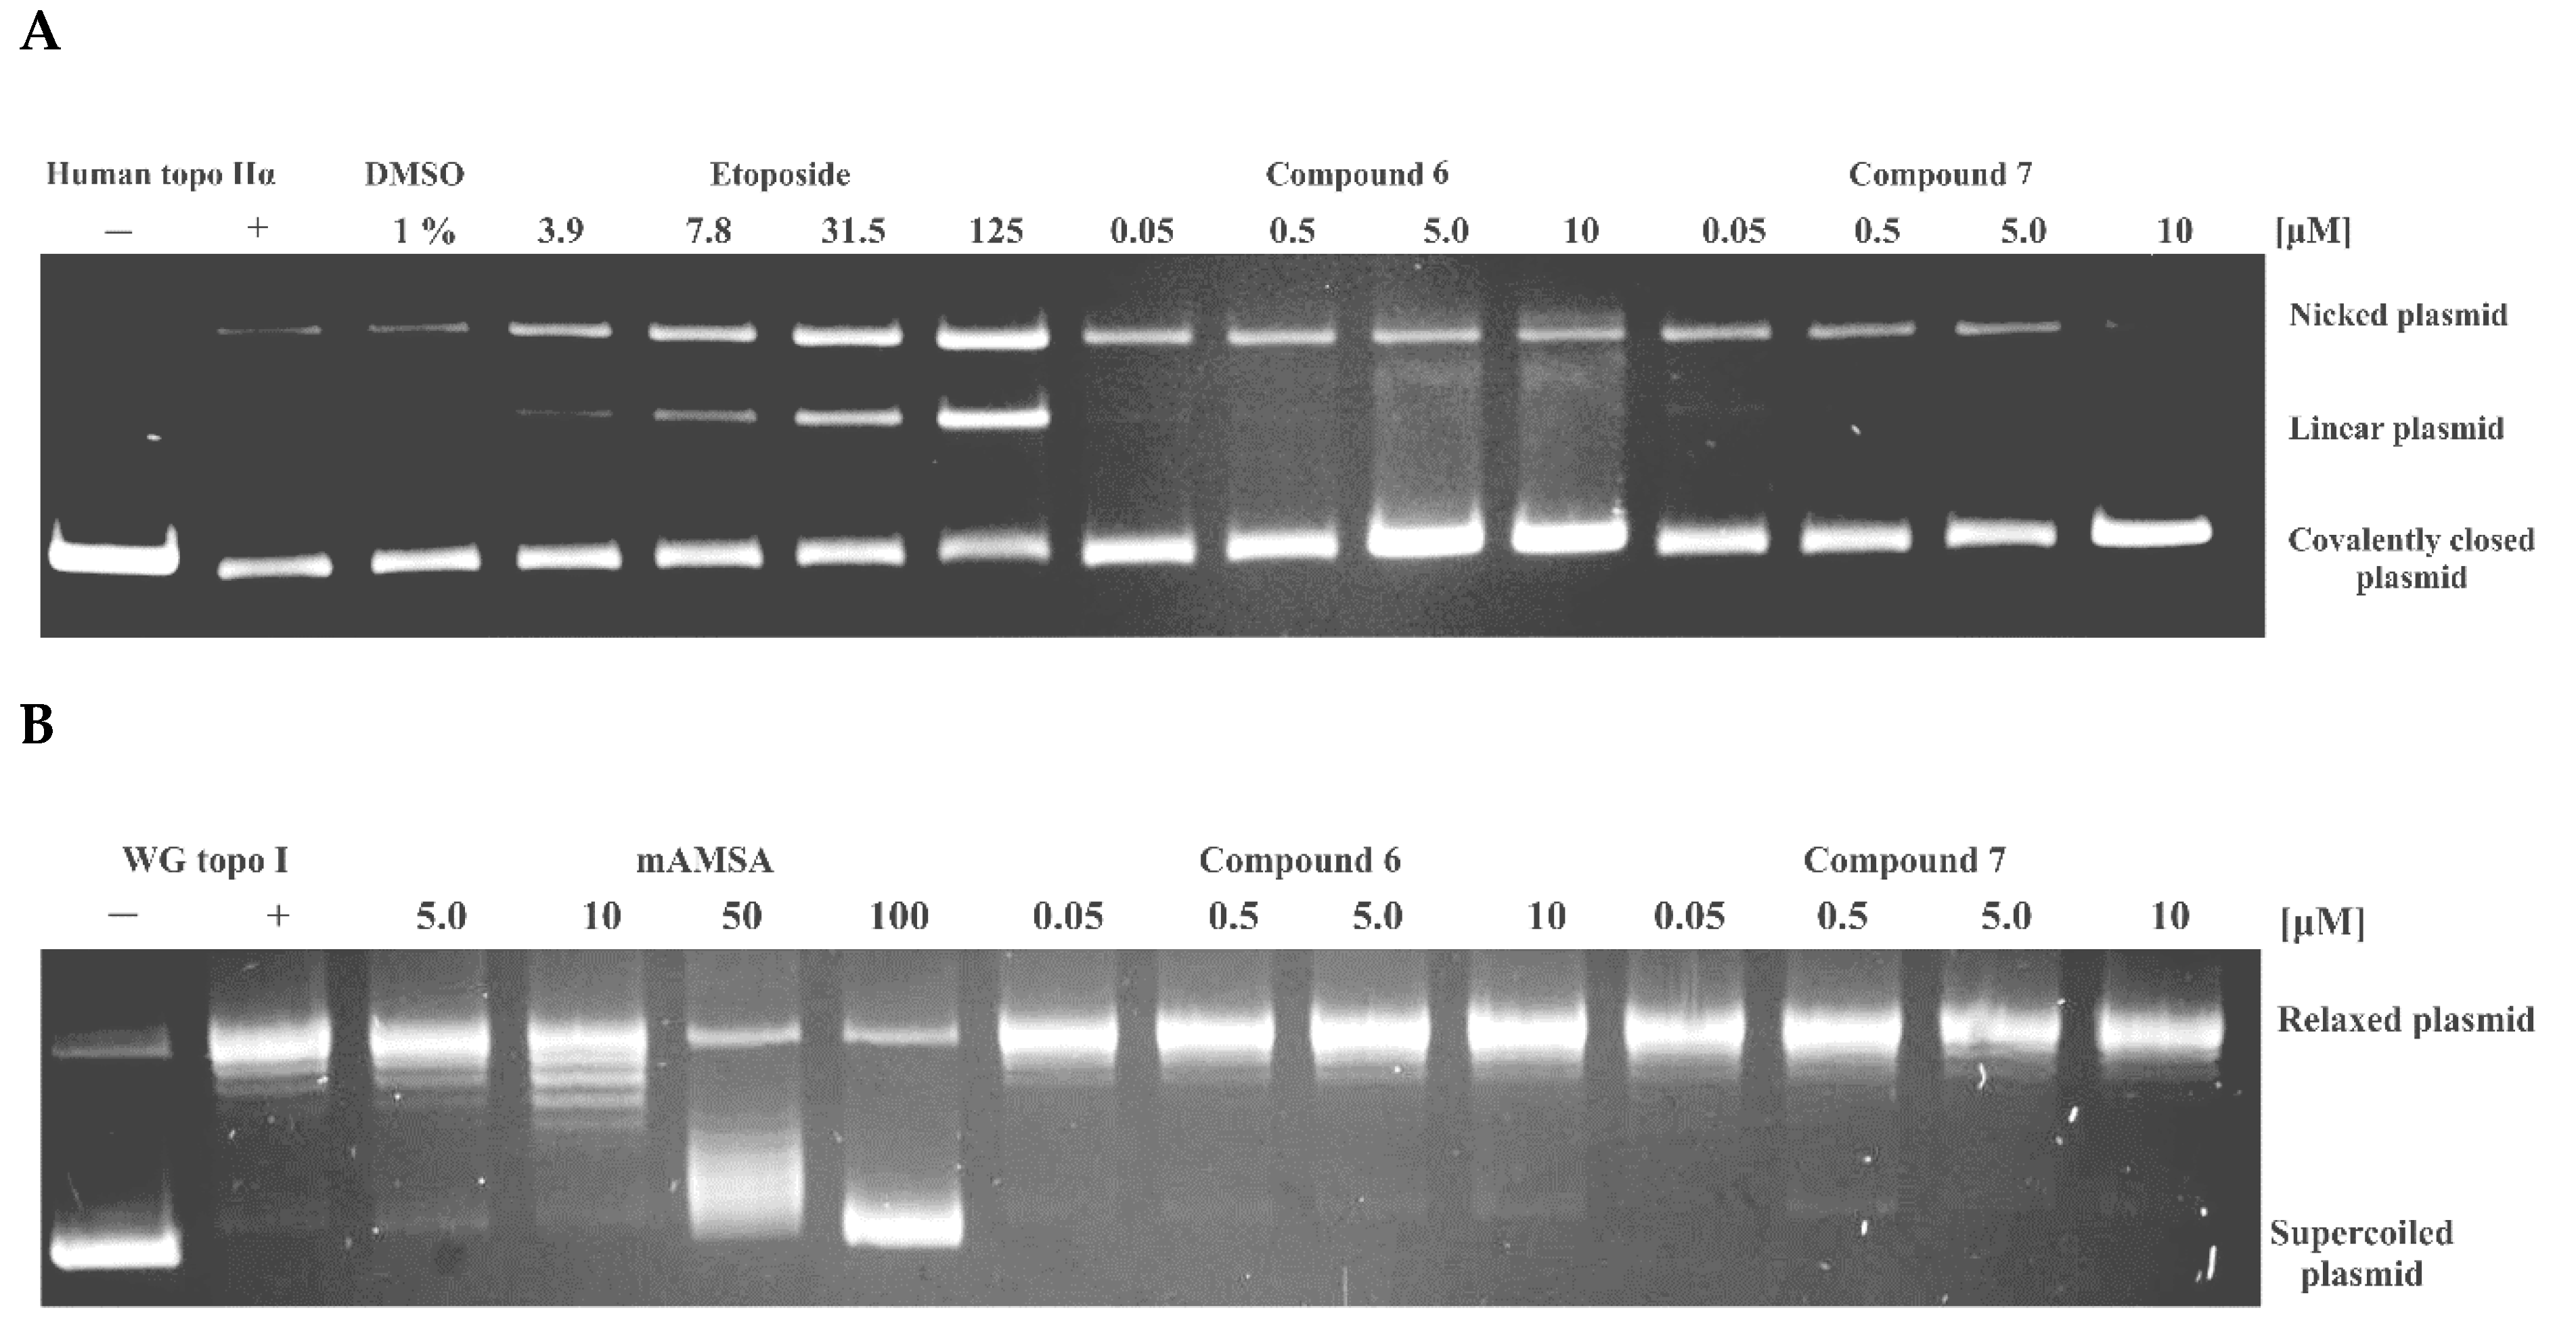
2.3. Investigation of the Inhibition Mechanism
2.4. Computational Evaluation of Binding and Reconnection to the Initial Dynophore Model
3. Conclusions
4. Materials and Methods
4.1. Generation of Dynophore Models and Pharmacophore-Based Virtual Screening
4.2. Human Topoisomerase IIα HTS Inhibition Assay
4.3. Human Topoisomerase IIα Decatenation Assay
4.4. Human Topo IIα Cleavage and Competitive assay
4.5. Wheatgerm Topo I Unwinding Assay
4.6. ATPase Assay of Human Topo Iiα
4.7. Expression and Purification of ATPase Domain of Human Topoisomerase IIα
4.8. STD NMR Spectroscopy Experiments
4.9. Molecular Docking Calculations
4.10. Molecular Dynamics Simulations
4.10.1. Cα RMSD and RMSF Calculation
4.10.2. Interaction Analysis and Distance Measurements
4.10.3. Dynamical Cross-Correlation Map (DCCM) Analysis
4.10.4. MM/GBSA Binding Free Energy Calculations
Supplementary Materials
Author Contributions
Funding
Data Availability Statement
Acknowledgments
Conflicts of Interest
References
- Klebe, G. Virtual ligand screening: Strategies, perspectives and limitations. Drug. Discov. Today 2006, 11, 580–594. [Google Scholar] [CrossRef] [PubMed]
- Teague, S.J. Implications of protein flexibility for drug discovery. Nat. Rev. Drug. Discov. 2003, 2, 527–541. [Google Scholar] [CrossRef]
- Carlson, H.A. Protein flexibility is an important component of structure-based drug discovery. Curr. Pharm. Des. 2002, 8, 1571–1578. [Google Scholar] [CrossRef]
- Boehr, D.D.; Nussinov, R.; Wright, P.E. The role of dynamic conformational ensembles in biomolecular recognition. Nat. Chem. Biol. 2009, 5, 789–796. [Google Scholar] [CrossRef] [Green Version]
- Mortier, J.; Rakers, C.; Bermudez, M.; Murgueitio, M.S.; Riniker, S.; Wolber, G. The impact of molecular dynamics on drug design: Applications for the characterization of ligand–macromolecule complexes. Drug. Discov. Today 2015, 20, 686–702. [Google Scholar] [CrossRef]
- Fischer, M.; Coleman, R.G.; Fraser, J.S.; Shoichet, B.K. Incorporation of protein flexibility and conformational energy penalties in docking screens to improve ligand discovery. Nat. Chem. 2014, 6, 575–583. [Google Scholar] [CrossRef] [PubMed]
- Perdih, A.; Hrast, M.; Barreteau, H.; Gobec, S.; Wolber, G.; Solmajer, T. Inhibitor design strategy based on an enzyme structural flexibility: A case of bacterial MurD ligase. J. Chem. Inf. Model. 2014, 54, 1451–1466. [Google Scholar] [CrossRef]
- Pach, S.; Sarter, T.M.; Yousef, R.; Schaller, D.; Bergemann, S.; Arkona, C.; Rademann, J.; Nitsche, C.; Wolber, G. Catching a Moving Target: Comparative Modeling of Flaviviral NS2B-NS3 Reveals Small Molecule Zika Protease Inhibitors. ACS Med. Chem. Lett. 2020, 11, 514–520. [Google Scholar] [CrossRef] [PubMed]
- Schaller, D.; Pach, S.; Wolber, G. PyRod: Tracing Water Molecules in Molecular Dynamics Simulations. J. Chem. Inf. Model. 2019, 59, 2818–2829. [Google Scholar] [CrossRef] [Green Version]
- Grimes, J.M.; Hall, D.R.; Ashton, A.W.; Evans, G.; Owen, R.L.; Wagner, A.; McAuley, K.E.; von Delft, F.; Orville, A.M.; Sorensen, T.; et al. Where is crystallography going? Acta Crystallogr. D Struct. Biol. 2018, 74, 152–166. [Google Scholar] [CrossRef] [Green Version]
- PDB Statistics: Overall Growth of Released Structures Per Year. Available online: https://www.rcsb.org/stats/growth/growth-released-structures (accessed on 22 November 2021).
- Muhammed, M.T.; Aki-Yalcin, E. Homology modeling in drug discovery: Overview, current applications, and future perspectives. Chem. Biol. Drug. Des. 2019, 93, 79. [Google Scholar] [CrossRef] [Green Version]
- Wieman, H. Homology-Based Modelling of Targets for Rational Drug Design. Mini Rev. Med. Chem. 2004, 4, 793–804. [Google Scholar] [CrossRef] [PubMed]
- Pinzi, L.; Rastelli, G. Molecular Docking: Shifting Paradigms in Drug Discovery. Int. J. Mol. Sci. 2019, 20, 4331. [Google Scholar] [CrossRef] [Green Version]
- Chennubhotla, C.; Bahar, I. Signal propagation in proteins and relation to equilibrium fluctuations. PLoS Comput. Biol. 2007, 3, e172. [Google Scholar] [CrossRef] [Green Version]
- Wang, J.; Jain, A.; McDonald, L.R.; Gambogi, C.; Lee, A.L.; Dokholyan, N.V. Mapping allosteric communications within individual proteins. Nat. Commun. 2020, 11, 3862. [Google Scholar] [CrossRef] [PubMed]
- Rush, T.S., 3rd; Grant, J.A.; Mosyak, L.; Nicholls, A. A shape-based 3-D scaffold hopping method and its application to a bacterial protein-protein interaction. J. Med. Chem. 2005, 48, 1489–1495. [Google Scholar] [CrossRef] [PubMed]
- Schaller, D.; Šribar, D.; Noonan, T.; Deng, L.; Nguyen, T.N.; Pach, S.; Machalz, D.; Bermudez, M.; Wolber, G. Next generation 3D pharmacophore modeling. WIREs Comput. Mol. Sci. 2020, 10, e1468. [Google Scholar] [CrossRef] [Green Version]
- Stumpfe, D.; Bajorath, J. Current Trends, Overlooked Issues, and Unmet Challenges in Virtual Screening. J. Chem. Inf. Model. 2020, 60, 4112–4115. [Google Scholar] [CrossRef]
- Rueda, M.; Bottegoni, G.; Abagyan, R. Recipes for the selection of experimental protein conformations for virtual screening. J. Chem. Inf. Model. 2010, 50, 186–193. [Google Scholar] [CrossRef] [Green Version]
- Fischer, A.; Smiesko, M.; Sellner, M.; Lill, M.A. Decision Making in Structure-Based Drug Discovery: Visual Inspection of Docking Results. J. Med. Chem. 2021, 64, 2489–2500. [Google Scholar] [CrossRef] [PubMed]
- Ripphausen, P.; Nisius, B.; Peltason, L.; Bajorath, J. Quo vadis, virtual screening? A comprehensive survey of prospective applications. J. Med. Chem. 2010, 53, 8461–8467. [Google Scholar] [CrossRef] [PubMed]
- Capranico, G.; Tinelli, S.; Austin, C.A.; Fisher, M.L.; Zunino, F. Different patterns of gene expression of topoisomerase II isoforms in differentiated tissues during murine development. Biochim. Biophys. Acta 1992, 1132, 43–48. [Google Scholar] [CrossRef]
- Watanabe, M.; Tsutsui, K.; Tsutsui, K.; Inoue, Y. Differential expressions of the topoisomerase II alpha and II beta mRNAs in developing rat brain. Neurosci. Res. 1994, 19, 51–57. [Google Scholar] [CrossRef]
- Tsutsui, K.; Tsutsui, K.; Hosoya, O.; Sano, K.; Tokunaga, A. Immunohistochemical analyses of DNA topoisomerase II isoforms in developing rat cerebellum. J. Comp. Neurol. 2001, 431, 228–239. [Google Scholar] [CrossRef]
- Delgado, J.L.; Hsieh, C.M.; Chan, N.L.; Hiasa, H. Topoisomerases as anticancer targets. Biochem. J. 2018, 475, 373–398. [Google Scholar] [CrossRef] [PubMed]
- Pogorelčnik, B.; Perdih, A.; Solmajer, T. Recent developments of DNA poisons-human DNA topoisomerase IIα inhibitors-as anticancer agents. Curr. Pharm. Design. 2013, 19, 2474–2488. [Google Scholar] [CrossRef]
- Hu, W.; Huang, X.S.; Wu, J.F.; Yang, L.; Zheng, Y.T.; Shen, Y.M.; Li, Z.Y.; Li, X. Discovery of novel topoisomerase II inhibitors by medicinal chemistry approaches. J. Med. Chem. 2018, 61, 8947–8980. [Google Scholar] [CrossRef]
- Bailly, C. Contemporary challenges in the design of topoisomerase II inhibitors for cancer chemotherapy. Chem. Rev. 2012, 112, 3611–3640. [Google Scholar] [CrossRef] [PubMed]
- Minotti, G.; Menna, P.; Salvatorelli, E.; Cairo, G.; Gianni, L. Anthracyclines: Molecular advances and pharmacologic developments in antitumor activity and cardiotoxicity. Pharmacol. Rev. 2004, 56, 185–229. [Google Scholar] [CrossRef] [Green Version]
- Felix, C.A. Secondary leukemias induced by topoisomerase-targeted drugs. Biochim. Biophys. Acta 1998, 1400, 233–255. [Google Scholar] [CrossRef]
- Pilati, P.; Nitti, D.; Mocellin, S. Cancer resistance to type II topoisomerase inhibitors. Curr. Med. Chem. 2012, 19, 3900–3906. [Google Scholar] [CrossRef] [PubMed]
- Chikamori, K.; Grozav, A.G.; Kozuki, T.; Grabowski, D.; Ganapathi, R.; Ganapathi, M.K. DNA Topoisomerase II Enzymes as Molecular Targets for Cancer Chemotherapy. Curr. Cancer Drug Tar. 2010, 10, 758–771. [Google Scholar] [CrossRef]
- Baldwin, E.L.; Osheroff, N. Etoposide, topoisomerase II and cancer. Curr. Med. Chem. Anticancer Agents 2005, 5, 363–372. [Google Scholar] [CrossRef]
- Nelson, E.M.; Tewey, K.M.; Liu, L.F. Mechanism of antitumor drug-action—Poisoning of mammalian DNA topoisomerase-II on DNA by 4′-(9-acridinylamino)-methanesulfon-meta-anisidide. Proc. Natl. Acad. Sci. USA 1984, 81, 1361–1365. [Google Scholar] [CrossRef] [PubMed] [Green Version]
- Pogorelčnik, B.; Perdih, A.; Solmajer, T. Recent advances in the development of catalytic inhibitors of human DNA topoisomerase IIα as novel anticancer agents. Curr. Med. Chem. 2013, 20, 694–709. [Google Scholar] [CrossRef]
- Pogorelčnik, B.; Janežič, M.; Sosič, I.; Gobec, S.; Solmajer, T.; Perdih, A. 4,6-Substituted-1,3,5-triazin-2(1H)-ones as monocyclic catalytic inhibitors of human DNA topoisomerase IIα targeting the ATP binding site. Bioorg. Med. Chem. 2015, 23, 4218–4229. [Google Scholar] [CrossRef]
- Pogorelčnik, B.; Brvar, M.; Zajc, I.; Filipič, M.; Solmajer, T.; Perdih, A. Monocyclic 4-amino-6-(phenylamino)-1,3,5-triazines as inhibitors of human DNA topoisomerase IIα. Bioorg. Med. Chem. Lett. 2014, 24, 5762–5768. [Google Scholar] [CrossRef]
- Pogorelčnik, B.; Brvar, M.; Žegura, B.; Filipič, M.; Solmajer, T.; Perdih, A. Discovery of mono- and disubstituted 1h-pyrazolo[3,4]pyrimidines and 9h-purines as catalytic inhibitors of human DNA topoisomerase IIα. Chem. Med. Chem. 2015, 10, 345–359. [Google Scholar] [CrossRef]
- Janežič, M.; Pogorelčnik, B.; Brvar, M.; Solmajer, T.; Perdih, A. 3-substituted-1 H -indazoles as catalytic inhibitors of the human DNA topoisomerase IIα. Chem. Sel. 2017, 2, 480–488. [Google Scholar] [CrossRef]
- Harvey, A.L. Natural products in drug discovery. Drug Discov. Today 2008, 13, 894–901. [Google Scholar] [CrossRef] [PubMed]
- Harvey, A.L.; Edrada-Ebel, R.; Quinn, R.J. The re-emergence of natural products for drug discovery in the genomics era. Nat. Rev. Drug Discov. 2015, 14, 111–129. [Google Scholar] [CrossRef] [PubMed] [Green Version]
- Bock, A.; Bermudez, M.; Krebs, F.; Matera, C.; Chirinda, B.; Sydow, D.; Dallanoce, C.; Holzgrabe, U.; De Amici, M.; Lohse, M.J.; et al. Ligand Binding Ensembles Determine Graded Agonist Efficacies at a G Protein-coupled Receptor. J. Biol. Chem. 2016, 291, 16375–16389. [Google Scholar] [CrossRef] [Green Version]
- Bergant, K.; Janežic, M.; Valjavec, K.; Sosič, I.; Pajk, S.; Štampar, M.; Žegura, B.; Gobec, S.; Filipič, M.; Perdih, A. Structure-guided optimization of 4,6-substituted-1,3,5-triazin-2(1H)-ones as catalytic inhibitors of human DNA topoisomerase IIα. Eur. J. Med. Chem. 2019, 175, 330–348. [Google Scholar] [CrossRef] [PubMed]
- Brvar, M.; Perdih, A.; Hodnik, V.; Renko, M.; Anderluh, G.; Jerala, R.; Solmajer, T. In silico discovery and biophysical evaluation of novel 5-(2-hydroxybenzylidene) rhodanine inhibitors of DNA gyrase B. Bioorg. Med. Chem. 2012, 20, 2572–2580. [Google Scholar] [CrossRef]
- Loboda, K.B.; Valjavec, K.; Štampar, M.; Wolber, G.; Žegura, B.; Filipič, M.; Dolenc, M.S.; Perdih, A. Design and synthesis of 3,5-substituted 1,2,4-oxadiazoles as catalytic inhibitors of human DNA topoisomerase IIα. Bioorg. Chem. 2020, 99, 103828. [Google Scholar] [CrossRef]
- Wu, W.B.; Ou, J.B.; Huang, Z.H.; Chen, S.B.; Ou, T.M.; Tan, J.H.; Li, D.; Shen, L.L.; Huang, S.L.; Gu, L.Q.; et al. Synthesis and evaluation of mansonone F derivatives as topoisomerase inhibitors. Eur. J. Med. Chem. 2011, 46, 3339–3347. [Google Scholar] [CrossRef]
- Bergant, K.; Janežič, M.; Perdih, A. Bioassays and in silico methods in the identification of human DNA topoisomerase IIα inhibitors. Curr. Med. Chem. 2018, 25, 3286–3318. [Google Scholar] [CrossRef]
- Cantero, G.; Campanella, C.; Mateos, S.; Cortés, F. Topoisomerase II inhibition and high yield of endoreduplication induced by the flavonoids luteolin and quercetin. Mutagenesis 2006, 21, 321–325. [Google Scholar] [CrossRef]
- Constantinou, A.; Mehta, R.; Runyan, C.; Rao, K.; Vaughan, A.; Moon, R. Flavonoids as DNA topoisomerase antagonists and poisons: Structure-activity relationships. J. Nat. Prod. 1995, 58, 217–225. [Google Scholar] [CrossRef] [PubMed]
- Bandele, O.J.; Osheroff, N. Bioflavonoids as poisons of human topoisomerase II alpha and II beta. Biochemistry 2007, 46, 6097–6108. [Google Scholar] [CrossRef] [Green Version]
- Snyder, R.D.; Gillies, P.J. Evaluation of the clastogenic, DNA intercalative, and topoisomerase II-interactive properties of bioflavonoids in Chinese hamster V79 cells. Environ. Mol. Mutagen. 2002, 40, 266–276. [Google Scholar] [CrossRef]
- Inspiralis. Available online: https://www.inspiralis.com/assets/TechnicalDocuments/Human-Topo-II-Alpha-Decatenation-Assay-Protocol4.pdf (accessed on 14 July 2021).
- Buonfiglio, R.; Recanatini, M.; Masetti, M. Protein Flexibility in Drug Discovery: From Theory to Computation. Chem. Med. Chem. 2015, 10, 1141–1148. [Google Scholar] [CrossRef]
- Salmaso, V.; Moro, S. Bridging Molecular Docking to Molecular Dynamics in Exploring Ligand-Protein Recognition Process: An Overview. Front. Pharmacol. 2018, 9, 923. [Google Scholar] [CrossRef] [Green Version]
- Cramer, J.; Sager, C.P.; Ernst, B. Hydroxyl Groups in Synthetic and Natural-Product-Derived Therapeutics: A Perspective on a Common Functional Group. J. Med. Chem. 2019, 62, 8915–8930. [Google Scholar] [CrossRef] [PubMed]
- Sydow, D. Dynophores: Novel Dynamic Pharmacophores. Master’s Thesis, Humboldt-Universität zu Berlin, Berlin, Germany, 2015. [Google Scholar] [CrossRef]
- Valjavec, K. Application of Computational Methods to Investigate the Function and Inhibition of a Type II DNA Topoisomerase Molecular Motor; University of Trieste: Trieste, Italy, 2020. [Google Scholar]
- Wolber, G.; Langer, T. LigandScout: 3-D pharmacophores derived from protein-bound ligands and their use as virtual screening filters. J. Chem. Inf. Model. 2005, 45, 160–169. [Google Scholar] [CrossRef]
- GraphPad Software. GraphPad Prism Version 7.00 for Windows; GraphPad Software: San Diego, CA, USA. Available online: www.graphpad.com (accessed on 5 January 2021).
- Hu, T.; Sage, H.; Hsieh, T.S. ATPase domain of eukaryotic DNA topoisomerase II. Inhibition of ATPase activity by the anti-cancer drug bisdioxopiperazine and ATP/ADP-induced dimerization. J. Biol. Chem. 2002, 277, 5944–5951. [Google Scholar] [CrossRef] [PubMed] [Green Version]
- Mayer, M.; Meyer, B. Group epitope mapping by saturation transfer difference NMR to identify segments of a ligand in direct contact with a protein receptor. J. Am. Chem. Soc. 2001, 123, 6108–6117. [Google Scholar] [CrossRef] [PubMed]
- Hwang, T.L.; Shaka, A.J. Water Suppression That Works. Excitation Sculpting Using Arbitrary Wave-Forms and Pulsed-Field Gradients. J. Magn. Reason. Ser. A 1995, 112, 275–279. [Google Scholar] [CrossRef]
- Jones, G.; Willett, P.; Glen, R.C.; Leach, A.R.; Taylor, R. Development and validation of a genetic algorithm for flexible docking. J. Mol. Biol. 1997, 267, 727–748. [Google Scholar] [CrossRef] [Green Version]
- Wei, H.; Ruthenburg, A.J.; Bechis, S.K.; Verdine, G.L. Nucleotide-dependent domain movement in the ATPase domain of a human type IIA DNA topoisomerase. J. Biol. Chem. 2005, 280, 37041–37047. [Google Scholar] [CrossRef] [PubMed] [Green Version]
- Bergant Loboda, K.; Janezic, M.; Stampar, M.; Zegura, B.; Filipic, M.; Perdih, A. Substituted 4,5’-Bithiazoles as Catalytic Inhibitors of Human DNA Topoisomerase IIalpha. J. Chem. Inf. Model. 2020, 60, 3662–3678. [Google Scholar] [CrossRef]
- Frisch, M.J.; Trucks, G.W.; Schlegel, H.B.; Scuseria, G.E.; Robb, M.A.; Cheeseman, J.R.; Scalmani, G.; Barone, V.; Petersson, G.A.; Nakatsuji, H.; et al. Gaussian 16 Revision. C.01; Gaussian Inc.: Wallingford, CT, USA, 2016. [Google Scholar]
- Case, D.A.; Betz, R.M.; Cerutti, D.S.; Cheatham, T.E., III; Darden, T.A.; Duke, R.E.; Giese, T.J.; Gohlke, H.; Goetz, A.W.; Homeyer, N.; et al. AMBER 2018; University of California: San Francisco, CA, USA, 2018. [Google Scholar]
- Wang, J.; Wolf, R.M.; Caldwell, J.W.; Kollman, P.A.; Case, D.A. Development and testing of a general amber force field. J. Comput. Chem. 2004, 25, 1157–1174. [Google Scholar] [CrossRef]
- Jorgensen, W.; Chandrasekhar, J.; Madura, J.; Impey, R.; Klein, M. Comparison of Simple Potential Functions for Simulating Liquid Water. J. Chem. Phys. 1983, 79, 926–935. [Google Scholar] [CrossRef]
- Papaneophytou, C.P.; Grigoroudis, A.I.; McInnes, C.; Kontopidis, G. Quantification of the effects of ionic strength, viscosity, and hydrophobicity on protein-ligand binding affinity. ACS Med. Chem. Lett. 2014, 5, 931–936. [Google Scholar] [CrossRef] [PubMed]
- Maier, J.A.; Martinez, C.; Kasavajhala, K.; Wickstrom, L.; Hauser, K.E.; Simmerling, C. ff14SB: Improving the Accuracy of Protein Side Chain and Backbone Parameters from ff99SB. J. Chem. Theory Comput. 2015, 11, 3696–3713. [Google Scholar] [CrossRef] [PubMed] [Green Version]
- Darden, T.; Darrin, Y.; Pedersen, L. Particle mesh Ewald: An N·log(N) method for Ewald sums in large systems. J. Chem. Phys. 1993, 98, 10089–10092. [Google Scholar] [CrossRef] [Green Version]
- Ryckaert, J.-P.; Ciccotti, G.; Berendsen, H.J.C. Numerical integration of the cartesian equations of motion of a system with constraints: Molecular dynamics of n-alkanes. J. Comput. Phys. 1977, 23, 327–341. [Google Scholar] [CrossRef] [Green Version]
- Case, D.A.; Betz, R.M.; Cerutti, D.S.; Cheatham, T.E., III; Darden, T.A.; Duke, R.E.; Giese, T.J.; Gohlke, H.; Goetz, A.W.; Homeyer, N.; et al. Amber 2016; University of California: San Francisco, CA, USA, 2016. [Google Scholar]
- Grant, B.J.; Rodrigues, A.P.; ElSawy, K.M.; McCammon, J.A.; Caves, L.S. Bio3d: An R package for the comparative analysis of protein structures. Bioinformatics 2006, 22, 2695–2696. [Google Scholar] [CrossRef] [Green Version]
- RC Team. R: A Language and Environment for Statistical Computing; R Foundation for Statistical Computing: Vienna, Austria, 2013. [Google Scholar]
- Humphrey, W.; Dalke, A.; Schulten, K. VMD: Visual molecular dynamics. J. Mol. Graph. Model. 1996, 14, 33–38. [Google Scholar] [CrossRef]
- Schrödinger, LLC. The PyMOL Molecular Graphics System, Version 2.0; Schrödinger, LLC.: New York, NY, USA, 2015. [Google Scholar]
- Pettersen, E.F.; Goddard, T.D.; Huang, C.C.; Couch, G.S.; Greenblatt, D.M.; Meng, E.C.; Ferrin, T.E. UCSF Chimera--a visualization system for exploratory research and analysis. J. Comput. Chem. 2004, 25, 1605–1612. [Google Scholar] [CrossRef] [PubMed] [Green Version]
- Wang, C.; Greene, D.; Xiao, L.; Qi, R.; Luo, R. Recent Developments and Applications of the MMPBSA Method. Front. Mol. Biosci. 2017, 4, 87. [Google Scholar] [CrossRef] [PubMed] [Green Version]
- Case, D.A.; Belfon, K.; Ben-Shalom, I.Y.; Brozell, S.R.; Cerutti, D.S.; Cheatham, I.T.E.; Cruzeiro, V.W.D.; Darden, T.A.; Duke, R.E.; Giambasu, G.; et al. AMBER 2020; University of California: San Francisco, CA, USA, 2020. [Google Scholar]


| Compound | Structure | IC50 [µM] |
|---|---|---|
| 1 | 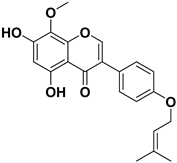 | >1000 |
| 2 | 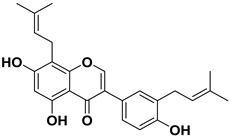 | >1000 |
| 3 |  | 124.7 |
| 4 | 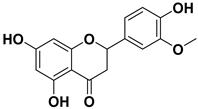 | >1000 |
| 5 |  | 19.4 |
| 6 | 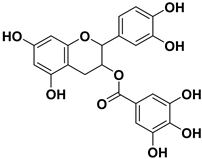 | 1.7 |
| 7 |  | 3.9 |
| 8 |  | >1000 |
| Average Percentage ATPase Activity | ||||
|---|---|---|---|---|
| [etoposide] µM | 250 | 100 | 50 | 25 |
| Percentage activity | 17.4 | 52.6 | 69.7 | 79.9 |
| [compound 6] µM | 10 | 5 | 0.5 | 0.05 |
| Percentage activity | 56.0 | 60.3 | 68.2 | 101.9 |
| [compound 7] µM | 10 | 5 | 0.5 | 0.05 |
| Percentage activity | 58.3 | 69.4 | 82.5 | 108.4 |
Publisher’s Note: MDPI stays neutral with regard to jurisdictional claims in published maps and institutional affiliations. |
© 2021 by the authors. Licensee MDPI, Basel, Switzerland. This article is an open access article distributed under the terms and conditions of the Creative Commons Attribution (CC BY) license (https://creativecommons.org/licenses/by/4.0/).
Share and Cite
Janežič, M.; Valjavec, K.; Loboda, K.B.; Herlah, B.; Ogris, I.; Kozorog, M.; Podobnik, M.; Grdadolnik, S.G.; Wolber, G.; Perdih, A. Dynophore-Based Approach in Virtual Screening: A Case of Human DNA Topoisomerase IIα. Int. J. Mol. Sci. 2021, 22, 13474. https://doi.org/10.3390/ijms222413474
Janežič M, Valjavec K, Loboda KB, Herlah B, Ogris I, Kozorog M, Podobnik M, Grdadolnik SG, Wolber G, Perdih A. Dynophore-Based Approach in Virtual Screening: A Case of Human DNA Topoisomerase IIα. International Journal of Molecular Sciences. 2021; 22(24):13474. https://doi.org/10.3390/ijms222413474
Chicago/Turabian StyleJanežič, Matej, Katja Valjavec, Kaja Bergant Loboda, Barbara Herlah, Iza Ogris, Mirijam Kozorog, Marjetka Podobnik, Simona Golič Grdadolnik, Gerhard Wolber, and Andrej Perdih. 2021. "Dynophore-Based Approach in Virtual Screening: A Case of Human DNA Topoisomerase IIα" International Journal of Molecular Sciences 22, no. 24: 13474. https://doi.org/10.3390/ijms222413474
APA StyleJanežič, M., Valjavec, K., Loboda, K. B., Herlah, B., Ogris, I., Kozorog, M., Podobnik, M., Grdadolnik, S. G., Wolber, G., & Perdih, A. (2021). Dynophore-Based Approach in Virtual Screening: A Case of Human DNA Topoisomerase IIα. International Journal of Molecular Sciences, 22(24), 13474. https://doi.org/10.3390/ijms222413474