
A Review on Electrochemical Sensors and Biosensors Used in Chlorogenic Acid Electroanalysis


Abstract
:1. Introduction
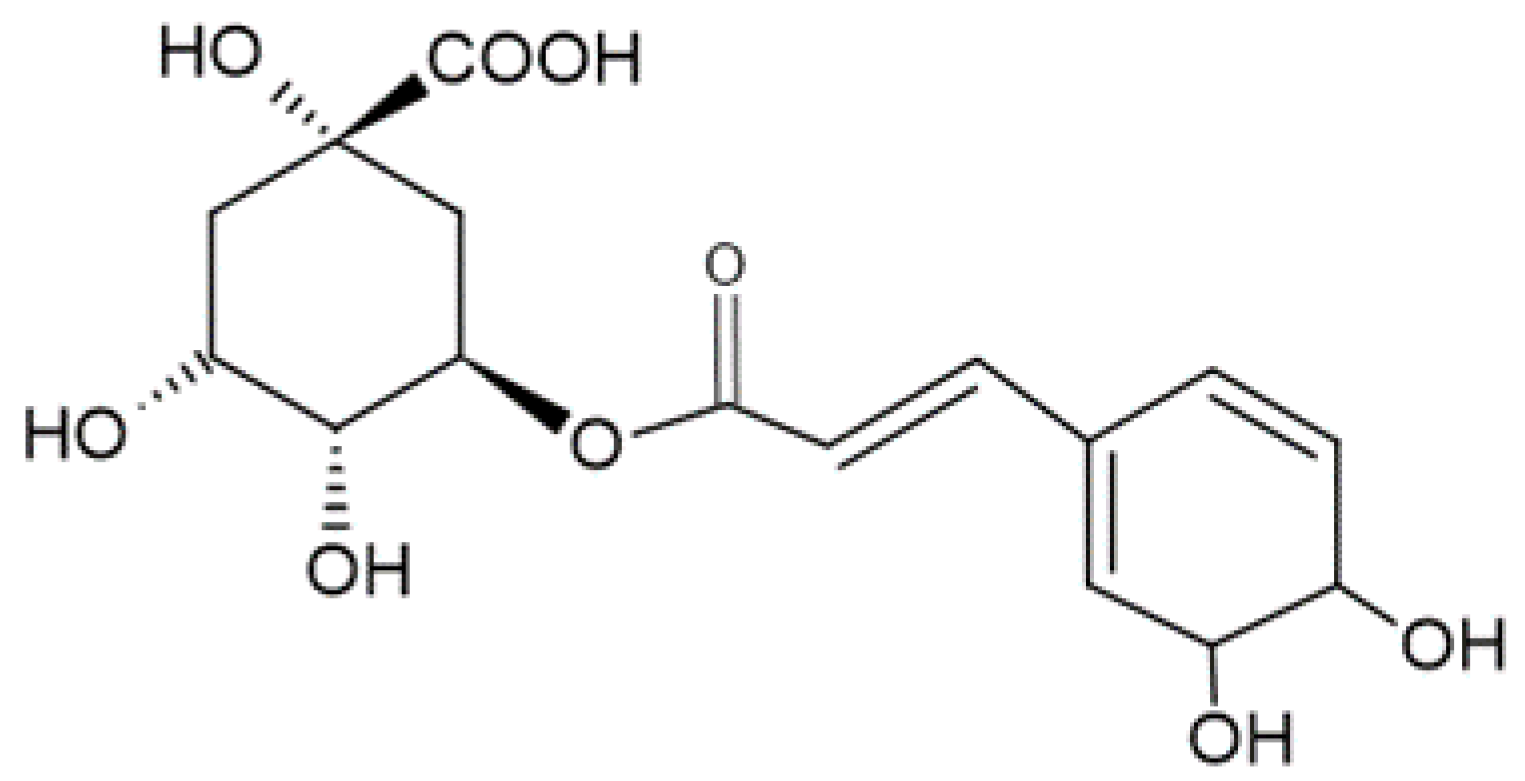
2. General Information Regarding Chlorogenic Acid
- -
- Modulates the glucose metabolism in humans; therefore, CGA has an antidiabetic effect [27] on type 2 sugar diabetes, improving the quality of insulin;
- -
- Prevents the development of cataracts as a result of its antidiabetic effect; this aspect has been indicated by the findings of studies carried out on laboratory animals;
- -
- Reduces the relative risk of cardiovascular diseases, improving human vasoreactivity; moreover, it has antihypertension properties [28];
- -
- Reduces the risk of biliary calculi production.
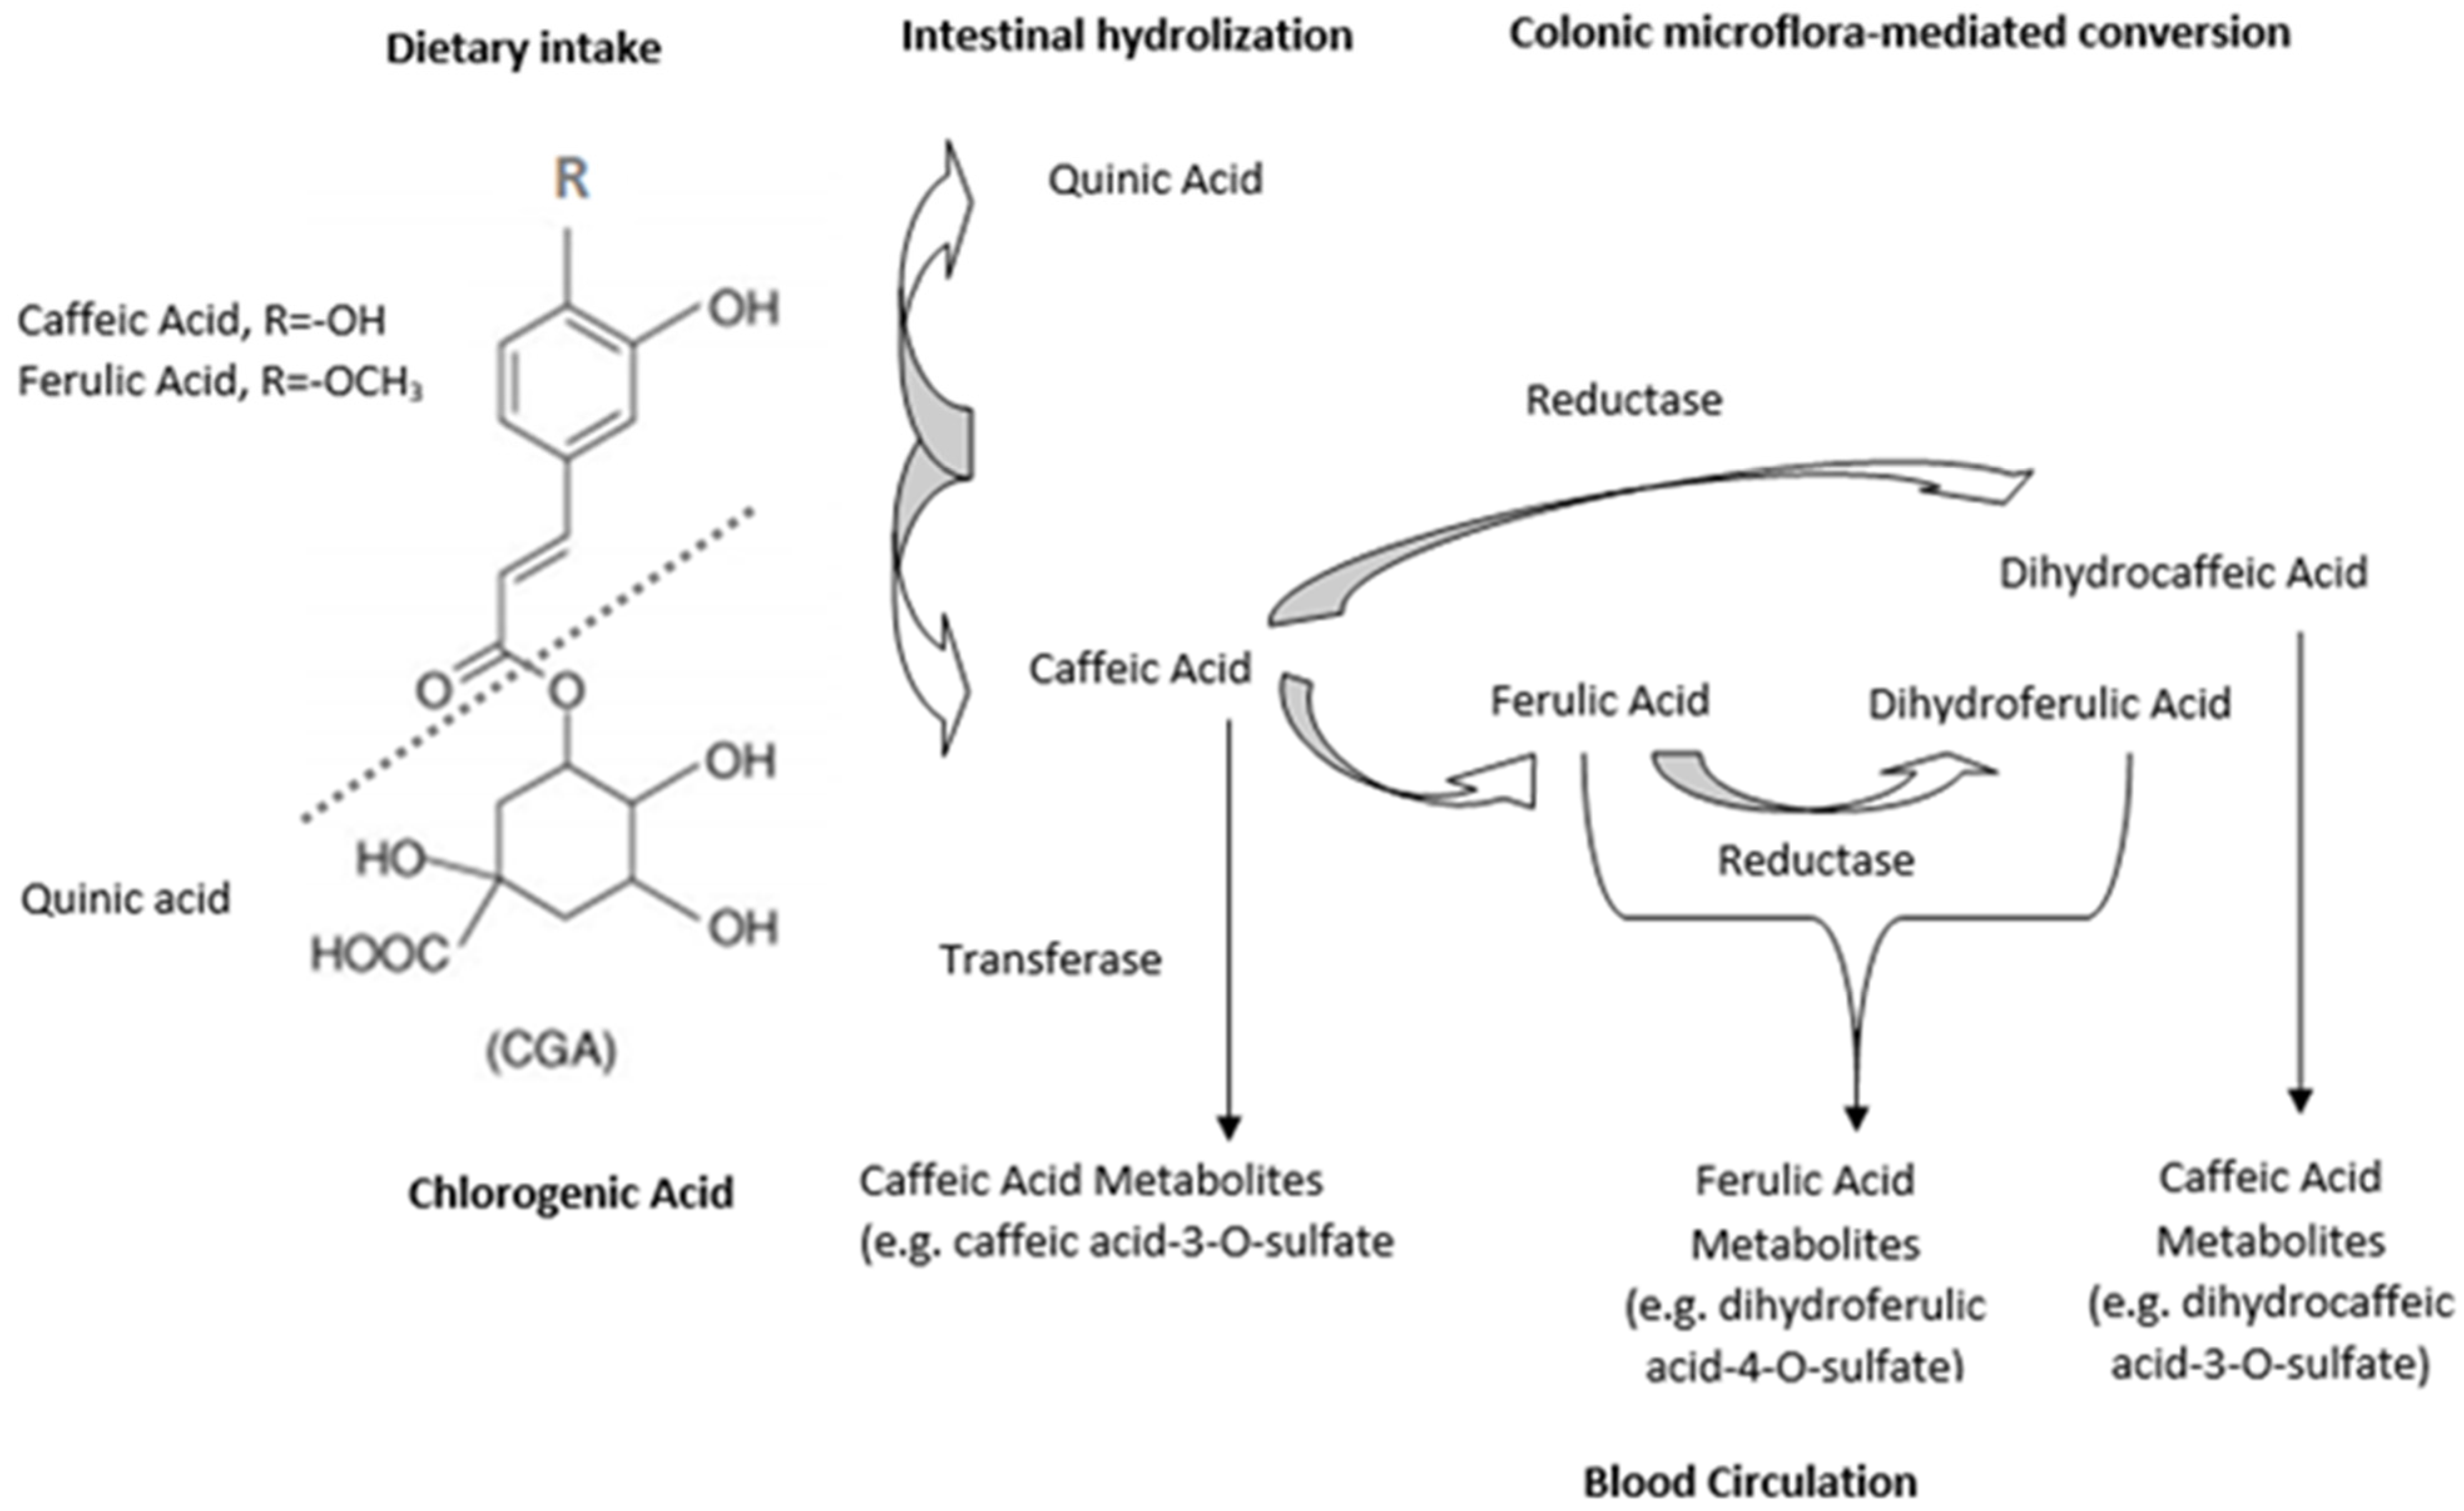
Pharmacokinetics of CGA
3. Analytical Methods Used in Determining CGA
3.1. Instrumental Methods
3.1.1. HPLC
3.1.2. Near Infrared Spectroscopy (NIRS)
3.1.3. Capillary Electrophoresis
3.1.4. Chemiluminescence
3.2. Electrochemical Methods
3.2.1. Electrochemical Sensors Used in Determining CGA
3.2.2. Electrochemical Biosensors Used in CGA Detection
4. Conclusions
Author Contributions
Funding
Institutional Review Board Statement
Informed Consent Statement
Acknowledgments
Conflicts of Interest
References
- Forzato, C.; Vida, V.; Berti, F. Biosensors and Sensing Systems for Rapid Analysis of Phenolic Compounds from Plants: A Comprehensive Review. Biosensors 2020, 10, 105. [Google Scholar] [CrossRef]
- Chaves, N.; Santiago, A.; Alías, J.C. Quantification of the Antioxidant Activity of Plant Extracts: Analysis of Sensitivity and Hierarchization Based on the Method Used. Antioxidants 2020, 9, 76. [Google Scholar] [CrossRef] [Green Version]
- Pang, Y.; Ahmed, S.; Xu, Y.; Beta, T.; Zhu, Z.; Shao, Y.; Bao, J. Bound phenolic compounds and antioxidant properties of whole grain and bran of white, red and black rice. Food Chem. 2018, 240, 212–221. [Google Scholar] [CrossRef]
- Oliver, P.; Villem, A. (Eds.) Phenolic Compounds: Structure, Uses and Health Benefits; Chemistry Research and Applications; Nova Science Publishers: New York, NY, USA, 2017; ISBN 978-1-5361-2882-6. [Google Scholar]
- Laganà, P.; Coniglio, M.; Fiorino, M.; Delgado, A.; Chammem, N.; Issaoui, M.; Gambuzza, M.; Iommi, C.; Haddad, M.; Delia, A. Phenolic Substances in Foods and Anticarcinogenic Properties: A Public Health Perspective. J. AOAC Int. 2020, 103, 935–939. [Google Scholar] [CrossRef]
- Delgado, A.M.; Issaoui, M.; Chammem, N. Analysis of Main and Healthy Phenolic Compounds in Foods. J. AOAC Int. 2019, 102, 1356–1364. [Google Scholar] [CrossRef]
- Munteanu, I.G.; Apetrei, C. Analytical Methods Used in Determining Antioxidant Activity: A Review. Int. J. Mol. Sci. 2021, 22, 3380. [Google Scholar] [CrossRef]
- Scalbert, A.; Morand, C.; Manach, C.; Rémésy, C. Absorption and metabolism of polyphenols in the gut and impact on health. Biomed. Pharmacother. 2002, 56, 276–282. [Google Scholar] [CrossRef]
- Balasundram, N.; Sundram, K.; Samman, S. Phenolic compounds in plants and agri-industrial by-products: Antioxidant activity, occurrence, and potential uses. Food Chem. 2006, 99, 191–203. [Google Scholar] [CrossRef]
- Rashmi, H.B.; Negi, P.S. Phenolic acids from vegetables: A review on processing stability and health benefits. Food Res. Int. 2020, 136, 109298. [Google Scholar] [CrossRef]
- Liu, Y.; Wang, P.; Chen, F.; Yuan, Y.; Zhu, Y.; Yan, H.; Hu, X. Role of plant polyphenols in acrylamide formation and elimination. Food Chem. 2015, 186, 46–53. [Google Scholar] [CrossRef]
- Shahidi, F.; Naczk, M. Phenolics in Food and Nutraceuticals; First Issued in Paperback; CRC Press, Taylor & Francis Group: Boca Raton, FL, USA; London, UK; New York, NY, USA, 2019; ISBN 978-0-367-39509-4. [Google Scholar]
- Shao, Y.; Bao, J. Polyphenols in whole rice grain: Genetic diversity and health benefits. Food Chem. 2015, 180, 86–97. [Google Scholar] [CrossRef]
- Bounegru, A.V.; Apetrei, C. Voltamperometric Sensors and Biosensors Based on Carbon Nanomaterials Used for Detecting Caffeic Acid—A Review. Int. J. Mol. Sci. 2020, 21, 9275. [Google Scholar] [CrossRef] [PubMed]
- Soares, S. Phenolic acids as antioxidants. Rev. Nutr. 2002, 15, 71–81. [Google Scholar] [CrossRef] [Green Version]
- King, A.; Young, G. Characteristics and Occurrence of Phenolic Phytochemicals. J. Am. Diet. Assoc. 1999, 99, 213–218. [Google Scholar] [CrossRef]
- Matei, M.F.; Jaiswal, R.; Kuhnert, N. Investigating the Chemical Changes of Chlorogenic Acids during Coffee Brewing: Conjugate Addition of Water to the Olefinic Moiety of Chlorogenic Acids and Their Quinides. J. Agric. Food Chem. 2012, 60, 12105–12115. [Google Scholar] [CrossRef] [PubMed]
- Li, G.; Wang, X.; Xu, Y.; Zhang, B.; Xia, X. Antimicrobial effect and mode of action of chlorogenic acid on Staphylococcus aureus. Eur. Food Res. Technol. 2014, 238, 589–596. [Google Scholar] [CrossRef]
- Vereshchagina, Y.V.; Bulgakov, V.P.; Grigorchuk, V.P.; Rybin, V.G.; Veremeichik, G.N.; Tchernoded, G.K.; Gorpenchenko, T.Y.; Koren, O.G.; Phan, N.H.T.; Minh, N.T.; et al. The rolC gene increases caffeoylquinic acid production in transformed artichoke cells. Appl. Microbiol. Biotechnol. 2014, 98, 7773–7780. [Google Scholar] [CrossRef]
- Santana-Gálvez, J.; Pérez-Carrillo, E.; Velázquez-Reyes, H.H.; Cisneros-Zevallos, L.; Jacobo-Velázquez, D.A. Application of wounding stress to produce a nutraceutical-rich carrot powder ingredient and its incorporation to nixtamalized corn flour tortillas. J. Funct. Foods 2016, 27, 655–666. [Google Scholar] [CrossRef]
- Bhattacharyya, S.; Majhi, S.; Saha, B.P.; Mukherjee, P.K. Chlorogenic acid–phospholipid complex improve protection against UVA induced oxidative stress. J. Photochem. Photobiol. B 2014, 130, 293–298. [Google Scholar] [CrossRef]
- Torres-Contreras, A.M.; Nair, V.; Cisneros-Zevallos, L.; Jacobo-Velázquez, D.A. Plants as biofactories: Stress-induced production of chlorogenic acid isomers in potato tubers as affected by wounding intensity and storage time. Ind. Crops Prod. 2014, 62, 61–66. [Google Scholar] [CrossRef]
- Karunanidhi, A.; Thomas, R.; van Belkum, A.; Neela, V. In vitro antibacterial and antibiofilm activities of chlorogenic acid against clinical isolates of Stenotrophomonas maltophilia including the trimethoprim/sulfamethoxazole resistant strain. BioMed Res. Int. 2013, 2013, 392058. [Google Scholar] [CrossRef] [Green Version]
- Niggeweg, R.; Michael, A.J.; Martin, C. Engineering plants with increased levels of the antioxidant chlorogenic acid. Nat. Biotechnol. 2004, 22, 746–754. [Google Scholar] [CrossRef] [PubMed]
- Fiamegos, Y.C.; Kastritis, P.L.; Exarchou, V.; Han, H.; Bonvin, A.M.J.J.; Vervoort, J.; Lewis, K.; Hamblin, M.R.; Tegos, G.P. Antimicrobial and efflux pump inhibitory activity of caffeoylquinic acids from Artemisia absinthium against gram-positive pathogenic bacteria. PLoS ONE 2011, 6, e18127. [Google Scholar] [CrossRef] [Green Version]
- Luo, H.-J.; Wang, J.-Z.; Chen, J.-F.; Zou, K. Docking study on chlorogenic acid as a potential H5N1 influenza A virus neuraminidase inhibitor. Med. Chem. Res. 2011, 20, 554–557. [Google Scholar] [CrossRef]
- Meng, S.; Cao, J.; Feng, Q.; Peng, J.; Hu, Y. Roles of chlorogenic Acid on regulating glucose and lipids metabolism: A review. Evid.-Based Complement. Altern. Med. ECAM 2013, 2013, 801457. [Google Scholar] [CrossRef] [PubMed]
- Zhao, Y.; Wang, J.; Ballevre, O.; Luo, H.; Zhang, W. Antihypertensive effects and mechanisms of chlorogenic acids. Hypertens. Res. Off. J. Jpn. Soc. Hypertens. 2012, 35, 370–374. [Google Scholar] [CrossRef] [Green Version]
- Liang, N.; Kitts, D.D. Role of Chlorogenic Acids in Controlling Oxidative and Inflammatory Stress Conditions. Nutrients 2016, 8, 16. [Google Scholar] [CrossRef] [PubMed] [Green Version]
- Lee, T.-K.; Kang, I.-J.; Kim, B.; Sim, H.J.; Kim, D.-W.; Ahn, J.H.; Lee, J.-C.; Ryoo, S.; Shin, M.C.; Cho, J.H.; et al. Experimental Pretreatment with Chlorogenic Acid Prevents Transient Ischemia-Induced Cognitive Decline and Neuronal Damage in the Hippocampus through Anti-Oxidative and Anti-Inflammatory Effects. Molecules 2020, 25, 3578. [Google Scholar] [CrossRef] [PubMed]
- Kassi, E.; Pervanidou, P.; Kaltsas, G.; Chrousos, G. Metabolic syndrome: Definitions and controversies. BMC Med. 2011, 9, 48. [Google Scholar] [CrossRef] [Green Version]
- Lou, Z.; Wang, H.; Zhu, S.; Ma, C.; Wang, Z. Antibacterial activity and mechanism of action of chlorogenic acid. J. Food Sci. 2011, 76, M398–M403. [Google Scholar] [CrossRef]
- Suzuki, A.; Kagawa, D.; Ochiai, R.; Tokimitsu, I.; Saito, I. Green coffee bean extract and its metabolites have a hypotensive effect in spontaneously hypertensive rats. Hypertens. Res. Off. J. Jpn. Soc. Hypertens. 2002, 25, 99–107. [Google Scholar] [CrossRef] [Green Version]
- Stalmach, A.; Mullen, W.; Barron, D.; Uchida, K.; Yokota, T.; Cavin, C.; Steiling, H.; Williamson, G.; Crozier, A. Metabolite Profiling of Hydroxycinnamate Derivatives in Plasma and Urine after the Ingestion of Coffee by Humans: Identification of Biomarkers of Coffee Consumption. Drug Metab. Dispos. 2009, 37, 1749–1758. [Google Scholar] [CrossRef] [PubMed] [Green Version]
- Renouf, M.; Guy, P.A.; Marmet, C.; Fraering, A.-L.; Longet, K.; Moulin, J.; Enslen, M.; Barron, D.; Dionisi, F.; Cavin, C.; et al. Measurement of caffeic and ferulic acid equivalents in plasma after coffee consumption: Small intestine and colon are key sites for coffee metabolism. Mol. Nutr. Food Res. 2010, 54, 760–766. [Google Scholar] [CrossRef] [PubMed]
- Naveed, M.; Hejazi, V.; Abbas, M.; Kamboh, A.A.; Khan, G.J.; Shumzaid, M.; Ahmad, F.; Babazadeh, D.; FangFang, X.; Modarresi-Ghazani, F.; et al. Chlorogenic acid (CGA): A pharmacological review and call for further research. Biomed. Pharmacother. Biomed. Pharmacother. 2018, 97, 67–74. [Google Scholar] [CrossRef]
- Lozano-Sánchez, J.; Borrás-Linares, I.; Sass-Kiss, A.; Segura-Carretero, A. Chapter 13—Chromatographic Technique: High-Performance Liquid Chromatography (HPLC). In Modern Techniques for Food Authentication, 2nd ed.; Sun, D.-W., Ed.; Academic Press: Cambridge, MA, USA, 2018; pp. 459–526. ISBN 978-0-12-814264-6. [Google Scholar]
- Liao, W.; Rui, Y. Evaluation of Chlorogenic Acid in Flos Lonicerae by HPLC Method. Asian J. Chem. 2010, 22, 1859–1863. Available online: http://www.webofscience.com/wos/woscc/full-record/WOS:000274581700031 (accessed on 1 October 2021).
- He, Y.; Su, J.; Yang, Q.; Liu, H.; Zhang, W. Simultaneous determination of chlorogenic acid and vitexin 2″-rhamnoside in Crataegi Fructus extracts by HPLC. J. Chin. Mater. Med. 2012, 37, 829–831. [Google Scholar]
- Borisova-Jan, L.; Fransson, D.; Claeson, P.; Burman, R. Liquid Chromatographic Method for the Determination of Caffeoylquinic Acid Derivates in Hieracium pilosella L. Phytochem. Anal. 2017, 28, 550–557. [Google Scholar] [CrossRef] [PubMed]
- Zhai, K.-F.; Duan, H.; Shi, S.-X.; Liu, L.-L.; Cao, W.-G.; Gao, G.-Z.; Shan, L.-L. Synchronised determination of chlorogenic acid and five flavonoids in mulberry leaves using HPLC with photodiode array detection. Qual. Assur. Saf. Crops Foods 2018, 10, 175–182. [Google Scholar] [CrossRef]
- Velkoska-Markovska, L.; Jankulovska, M.S.; Petanovska-Ilievska, B.; Hristovski, K. Development and validation of RRLC–UV method for determination of chlorogenic acid in green coffee. Acta Chromatogr. 2020, 32, 34–38. [Google Scholar] [CrossRef]
- Magalhaes, L.M.; Machado, S.; Segundo, M.A.; Lopes, J.A.; Pascoa, R.N.M.J. Rapid assessment of bioactive phenolics and methylxanthines in spent coffee grounds by FT-NIR spectroscopy. Talanta 2016, 147, 460–467. [Google Scholar] [CrossRef]
- Xia, Z.; Sun, Y.; Cai, C.; He, Y.; Nie, P. Rapid Determination of Chlorogenic Acid, Luteoloside and 3,5-O-dicaffeoylquinic Acid in Chrysanthemum Using Near-Infrared Spectroscopy. Sensors 2019, 19, 1981. [Google Scholar] [CrossRef] [PubMed] [Green Version]
- Yan, H.; Pu, Z.; Wang, Y.; Guo, S.; Wang, T.; Li, S.; Zhang, Z.; Zhou, G.; Zhan, Z.; Duan, J. Rapid qualitative identification and quantitative analysis of Flos Mume based on Fourier transform near infrared spectroscopy. Spectrochim. Acta Part A Mol. Biomol. Spectrosc. 2021, 249, 119344. [Google Scholar] [CrossRef]
- Fast Determination of Chlorogenic Acid in Tobacco Residues Using Microwave-Assisted Extraction and Capillary Zone Electrophoresis Technique-Web of Science Core Collection. Available online: https://www-webofscience-com.am.e-nformation.ro/wos/woscc/full-record/WOS:000282480500015 (accessed on 2 October 2021).
- Tang, Z.; Zang, S.; Zhang, X. Detection of Chlorogenic Acid in Honeysuckle Using Infrared-Assisted Extraction Followed by Capillary Electrophoresis with UV Detector. J. Chromatogr. Sci. 2012, 50, 76–80. [Google Scholar] [CrossRef] [PubMed]
- Gatea, F.; Teodor, E.D.; Matei, A.O.; Badea, G.I.; Radu, G.L. Capillary Electrophoresis Method for 20 Polyphenols Separation in Propolis and Plant Extracts. Food Anal. Methods 2015, 8, 1197–1206. [Google Scholar] [CrossRef]
- Wang, X.; Wang, J.; Yang, N. Chemiluminescent determination of chlorogenic acid in fruits. Food Chem. 2007, 102, 422–426. [Google Scholar] [CrossRef]
- Chen, X.; Mao, J.; Wen, F.; Xu, X. Determination of Phenolic Acids in Botanical Pharmaceutical Products by Capillary Electrophoresis with Chemiluminescence Detection. Anal. Lett. 2021, 54, 817–829. [Google Scholar] [CrossRef]
- Chao, M.; Ma, X. Voltammetric determination of chlorogenic acid in pharmaceutical products using poly(aminosulfonic acid) modified glassy carbon electrode. J. Food Drug Anal. 2014, 22, 512–519. [Google Scholar] [CrossRef] [Green Version]
- Ma, X.; Yang, H.; Xiong, H.; Li, X.; Gao, J.; Gao, Y. Electrochemical Behavior and Determination of Chlorogenic Acid Based on Multi-Walled Carbon Nanotubes Modified Screen-Printed Electrode. Sensors 2016, 16, 1797. [Google Scholar] [CrossRef] [Green Version]
- Apetrei, I.; Apetrei, C. Development of a Novel Biosensor Based on Tyrosinase/Platinum Nanoparticles/Chitosan/Graphene Nanostructured Layer with Applicability in Bioanalysis. Materials 2019, 12, 1009. [Google Scholar] [CrossRef] [Green Version]
- Yola, M.L.; Atar, N.; Üstündağ, Z.; Solak, A.O. A novel voltammetric sensor based on p-aminothiophenol functionalized graphene oxide/gold nanoparticles for determining quercetin in the presence of ascorbic acid. J. Electroanal. Chem. 2013, 698, 9–16. [Google Scholar] [CrossRef]
- Bard, A.J.; Faulkner, L.R. Electrochemical Methods: Fundamentals and Applications, 2nd ed.; Wiley: New York, NY, USA, 2001; ISBN 978-0-471-04372-0. [Google Scholar]
- Bounegru, A.V.; Apetrei, C. Laccase and Tyrosinase Biosensors Used in the Determination of Hydroxycinnamic Acids. Int. J. Mol. Sci. 2021, 22, 4811. [Google Scholar] [CrossRef]
- Bounegru, A.V.; Apetrei, C. Carbonaceous Nanomaterials Employed in the Development of Electrochemical Sensors Based on Screen-Printing Technique—A Review. Catalysts 2020, 10, 680. [Google Scholar] [CrossRef]
- Munteanu, I.-G.; Apetrei, C. Electrochemical Determination of Chlorogenic Acid in Nutraceuticals Using Voltammetric Sensors Based on Screen-Printed Carbon Electrode Modified with Graphene and Gold Nanoparticles. Int. J. Mol. Sci. 2021, 22, 8897. [Google Scholar] [CrossRef]
- Rodrigues Santos, W.D.J.; Santhiago, M.; Pagotto Yoshida, I.V.; Kubota, L.T. Novel electrochemical sensor for the selective recognition of chlorogenic acid. Anal. Chim. Acta 2011, 695, 44–50. [Google Scholar] [CrossRef]
- Chen, Y.; Huang, W.; Chen, K.; Zhang, T.; Wang, Y.; Wang, J. A novel electrochemical sensor based on core-shell-structured metal-organic frameworks: The outstanding analytical performance towards chlorogenic acid. Talanta 2019, 196, 85–91. [Google Scholar] [CrossRef] [PubMed]
- Wang, Y.; Chen, H.; Hu, X.; Yu, H. Highly stable and ultrasensitive chlorogenic acid sensor based on metal-organic frameworks/titanium dioxide nanocomposites. Analyst 2016, 141, 4647–4653. [Google Scholar] [CrossRef] [PubMed]
- Mohammadi, N.; Najafi, M.; Adeh, N.B. Highly defective mesoporous carbon–ionic liquid paste electrode as sensitive voltammetric sensor for determination of chlorogenic acid in herbal extracts. Sens. Actuators B Chem. 2017, 243, 838–846. [Google Scholar] [CrossRef]
- Zhang, T.; Chen, Y.; Huang, W.; Wang, Y.; Hu, X. A novel AuNPs-doped COFs composite as electrochemical probe for chlorogenic acid detection with enhanced sensitivity and stability. Sens. Actuators B Chem. 2018, 276, 362–369. [Google Scholar] [CrossRef]
- Chokkareddy, R.; Redhi, G.G.; Karthick, T. A lignin polymer nanocomposite based electrochemical sensor for the sensitive detection of chlorogenic acid in coffee samples. Heliyon 2019, 5, e01457. [Google Scholar] [CrossRef] [PubMed] [Green Version]
- Zhang, T.; Liu, M.; Zhang, Q.; Wang, Y.; Kong, X.; Wang, L.; Wang, H.; Zhang, Y. Sensitive determination of chlorogenic acid in pharmaceutical products based on the decoration of 3D macroporous carbon with Au nanoparticles via polyoxometalates. Analyst 2017, 142, 2603–2609. [Google Scholar] [CrossRef]
- Cheng, W.; Huang, J.; Liu, C.; Zeng, Q.; Tong, Y.; Wang, L.; Cheng, F. High sensitivity chlorogenic acid detection based on multiple layer-by-layer self-assembly films of chitosan and multi-walled carbon nanotubes on a glassy carbon electrode. RSC Adv. 2017, 7, 6950–6956. [Google Scholar] [CrossRef] [Green Version]
- Teker, T.; Aslanoglu, M. A novel voltammetric sensing platform based on carbon nanotubes-niobium nanoparticles for the determination of chlorogenic acid. Arab. J. Chem. 2020, 13, 5517–5525. [Google Scholar] [CrossRef]
- Huang, Z.; Zhang, Y.; Sun, J.; Chen, S.; Chen, Y.; Fang, Y. Nanomolar detection of chlorogenic acid at the cross-section surface of the pencil lead electrode. Sens. Actuators B Chem. 2020, 321, 128550. [Google Scholar] [CrossRef]
- Wee, Y.; Park, S.; Kwon, Y.H.; Ju, Y.; Yeon, K.-M.; Kim, J. Tyrosinase-immobilized CNT based biosensor for highly-sensitive detection of phenolic compounds. Biosens. Bioelectron. 2019, 132, 279–285. [Google Scholar] [CrossRef] [PubMed]
- Mazlan, S.Z.; Lee, Y.H.; Hanifah, S.A. A New Laccase Based Biosensor for Tartrazine. Sensors 2017, 17, 2859. [Google Scholar] [CrossRef] [PubMed] [Green Version]
- Stasyuk, N.; Gayda, G.; Zakalskiy, A.; Zakalska, O.; Serkiz, R.; Gonchar, M. Amperometric biosensors based on oxidases and PtRu nanoparticles as artificial peroxidase. Food Chem. 2019, 285, 213–220. [Google Scholar] [CrossRef]
- de Macêdo, I.Y.L.; Garcia, L.F.; Oliveira Neto, J.R.; de Siqueira Leite, K.C.; Ferreira, V.S.; Ghedini, P.C.; de Souza Gil, E. Electroanalytical tools for antioxidant evaluation of red fruits dry extracts. Food Chem. 2017, 217, 326–331. [Google Scholar] [CrossRef]
- Dinu, A.; Apetrei, C. A Review on Electrochemical Sensors and Biosensors Used in Phenylalanine Electroanalysis. Sensors 2020, 20, 2496. [Google Scholar] [CrossRef]
- Ye, Y.; Ji, J.; Sun, Z.; Shen, P.; Sun, X. Recent advances in electrochemical biosensors for antioxidant analysis in foodstuff. TrAC Trends Anal. Chem. 2019, 122, 115718. [Google Scholar] [CrossRef]
- Moccelini, S.K.; Spinelli, A.; Vieira, I.C. Biosensors based on bean sprout homogenate immobilized in chitosan microspheres and silica for determination of chlorogenic acid. Enzym. Microb. Technol. 2008, 43, 381–387. [Google Scholar] [CrossRef]
- Fernandes, S.C.; Moccelini, S.K.; Scheeren, C.W.; Migowski, P.; Dupont, J.; Heller, M.; Micke, G.A.; Vieira, I.C. Biosensor for chlorogenic acid based on an ionic liquid containing iridium nanoparticles and polyphenol oxidase. Talanta 2009, 79, 222–228. [Google Scholar] [CrossRef] [PubMed]
- Vasilescu, I.; Eremia, S.A.V.; Penu, R.; Albu, C.; Radoi, A.; Litescu, S.C.; Radu, G.-L. Disposable dual sensor array for simultaneous determination of chlorogenic acid and caffeine from coffee. RSC Adv. 2014, 5, 261–268. [Google Scholar] [CrossRef]
- Vlamidis, Y.; Gualandi, I.; Tonelli, D. Amperometric biosensors based on reduced GO and MWCNTs composite for polyphenols detection in fruit juices. J. Electroanal. Chem. 2017, 799, 285–292. [Google Scholar] [CrossRef]
- Tulli, F.; Gulotta, F.A.; Martino, D.M.; Paz Zanini, V.I.; Borsarelli, C.D. Ultrasensitive Amperometric Biosensing of Polyphenols Using Horseradish Peroxidase Immobilized in a Laponite/Au/DNA-Bioinspired Polycation Nanocomposite. J. Electrochem. Soc. 2018, 165, B452–B457. [Google Scholar] [CrossRef]
- Akyuz, E.; Baskan, K.S.; Tutem, E.; Apak, R. Novel Protein-Based Solid-Biosensor for Determining Pro-oxidant Activity of Phenolic Compounds. J. Agric. Food Chem. 2017, 65, 5821–5830. [Google Scholar] [CrossRef]
- Gurung, N.; Ray, S.; Bose, S.; Rai, V. A broader view: Microbial enzymes and their relevance in industries, medicine, and beyond. BioMed Res. Int. 2013, 2013, 329121. [Google Scholar] [CrossRef] [Green Version]


| Benzoic Acids | R1 | R2 | R3 | R4 | 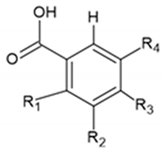 |
| Benzoic acid | H | H | H | H | |
| p-Hydroxybenzoic acid | H | H | OH | H | |
| Vanillic acid | H | OCH3 | OH | H | |
| Gallic acid | H | OH | OH | OH | |
| Syringic acid | H | OCH3 | H | OCH3 | |
| Veratric acid | H | OCH3 | OCH3 | H | |
| Salicylic acid | OH | H | H | H | |
| Cinnamic Acids | R1 | R2 | R3 | R4 |  |
| Cinnamic acid | H | H | H | H | |
| o-Coumaric acid | OH | H | H | H | |
| m-Coumaric acid | H | OH | H | H | |
| p-Coumaric acid | H | H | OH | H | |
| Ferulic acid | H | H | OH | OCH3 | |
| Caffeic acid | H | OH | OH | H |
| Electrode | LOD (M) | LOQ (M) |
|---|---|---|
| C-SPE | 6.50 × 10⁻⁷ | 2.16 × 10⁻⁶ |
| GPH-SPE | 0.73 × 10⁻⁷ | 2.45 × 10⁻⁶ |
| GPH-GNP-SPE | 0.62 × 10⁻⁷ | 1.94 × 10⁻⁷ |
| Sensitive Material | Detection Technique | Linear Range µmol·L−1 | LOD µmol·L−1 | Real Samples | Ref. |
|---|---|---|---|---|---|
| Sensors | |||||
| MIS/Au | DPV | 5 × 10⁻¹–12 | 1.48 × 10⁻¹ | Coffee Tea | [59] |
| MWCNTs/SPE | CV, DPV | 4.8 × 10⁻¹–44.59 | 3.4 × 10⁻¹ | Coffee beans | [52] |
| Fe3O4@MIL-100(Fe)/GCE | EIS, CV | 1 × 10⁻¹–460 | 5 × 10⁻² | Apple Coffee | [60] |
| UiO-66-NH2/TiO2 | CV, DPV | 1 × 10⁻²–13.0 | 7 × 10⁻³ | Coffee Tea | [61] |
| IL/DMC/PE | CV, EIS, SWV | 2 × 10⁻²–2.5 | 1 × 10⁻² | Herbal extracts of Calendula ocinalis and Echinacea purpurea | [62] |
| TAPB-DMTP-COFs/AuNPs | CV, DPV | 1 × 10⁻²–40 | 9.5 × 10⁻³ | Coffee Apple Honeysuckle | [63] |
| LGN-MWCNTs-CuONPs-GCE | CV, DPV | 5–50 | 1.25 × 10⁻² | Coffee | [64] |
| NbNPs/CNTs/GCE | CV, SWV | 2 × 10⁻³–2 | 8.2 × 10⁻⁴ | Coffee Tomato Drinks | [67] |
| PLE | SWV | 7.7 × 10⁻²–7.7 | 4.5 × 10⁻³ | Clinical samples (Human urine) | [68] |
| GPH-GNP-SPE | CV | 1 × 10⁻¹–1.20 | 6.2 × 10⁻² | Nutraceutical products based on Green Coffee extract | [58] |
| Biosensors | |||||
| Bean sprout homogenate | SWV | 3.48–320 | 8 × 10⁻¹ | Coffee | [75] |
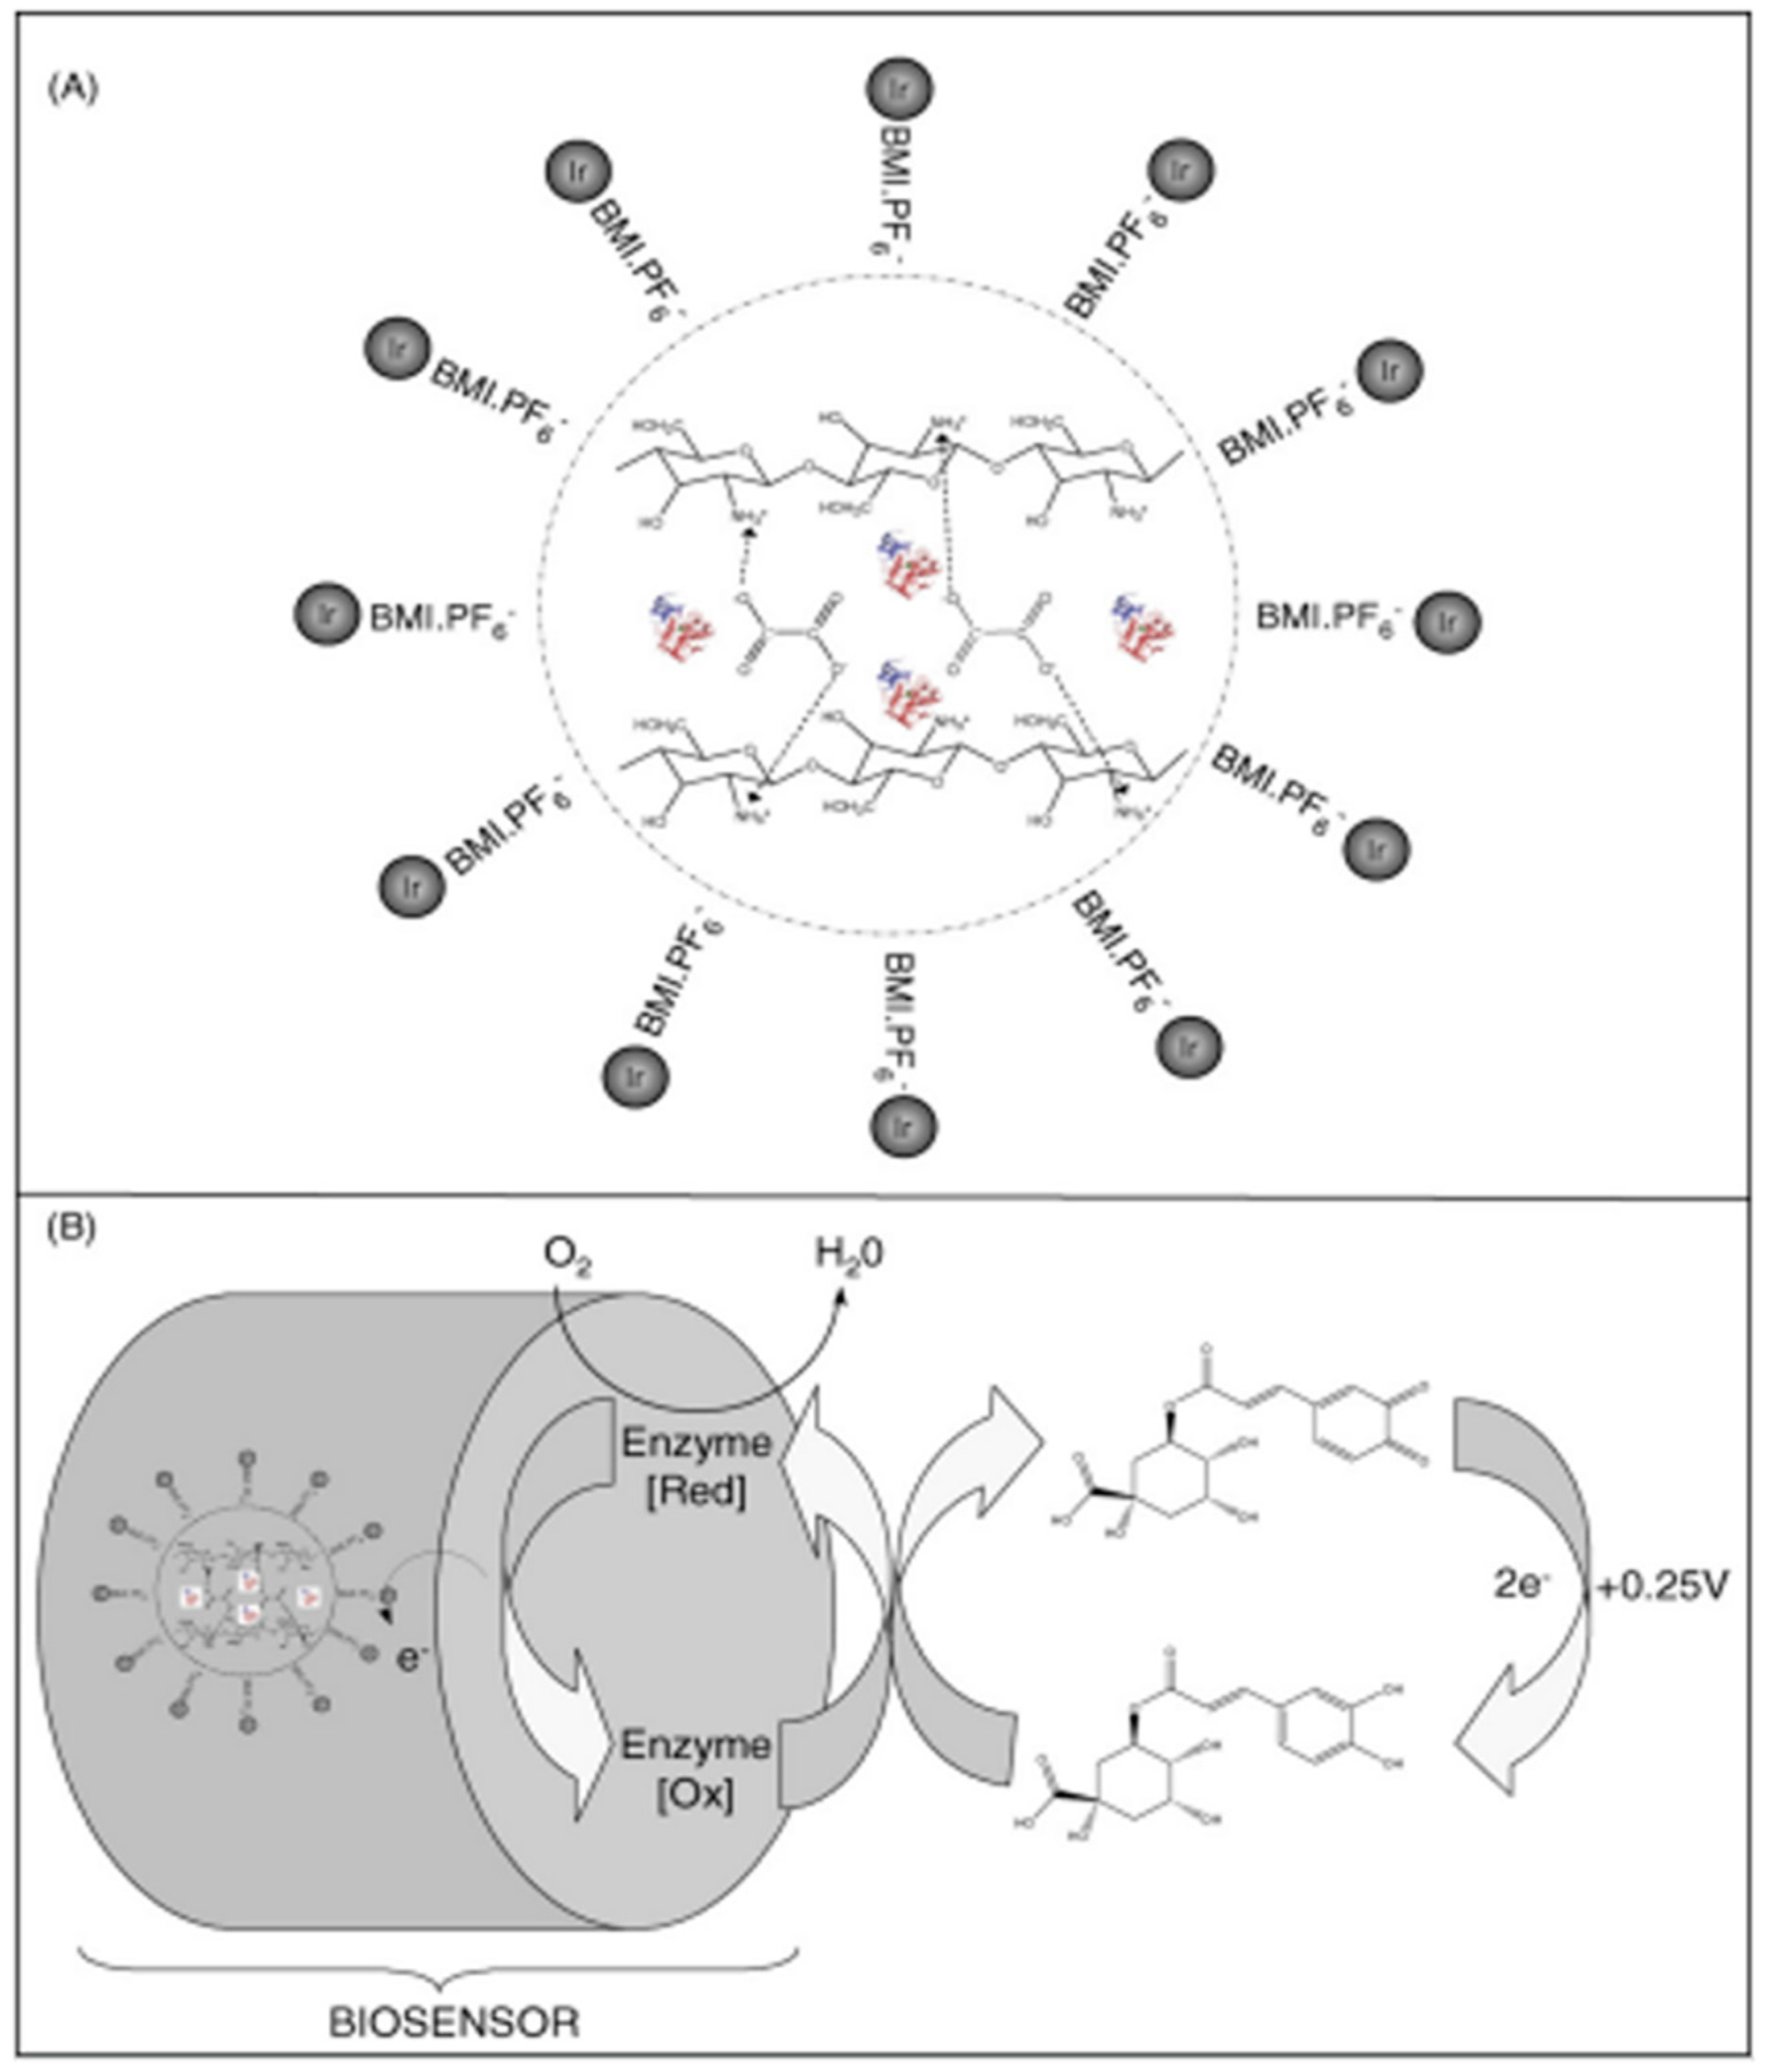
| Ir-BMI.PF6-PPO | SWV | 3.48–49.50 | 9.1 × 10⁻¹ | Decaffeinated coffee | [76] |
| C-SPE/Pt-NPs/RGO/Lacc | CV, CA | 2.91–26.47 | 2.67 | Coffee | [77] |
| GCE-CO-LAC-MWCNTs | CV, CA | 1–300 | 3 × 10⁻¹ | Juice | [78] |
| Lap/{[(VBT)(VBA)4]4+} ≈ 25/AuNP/HRP | CV, EIS | 1–120 | 2.7 × 10⁻³ | Yerba mate Green Coffee | [79] |
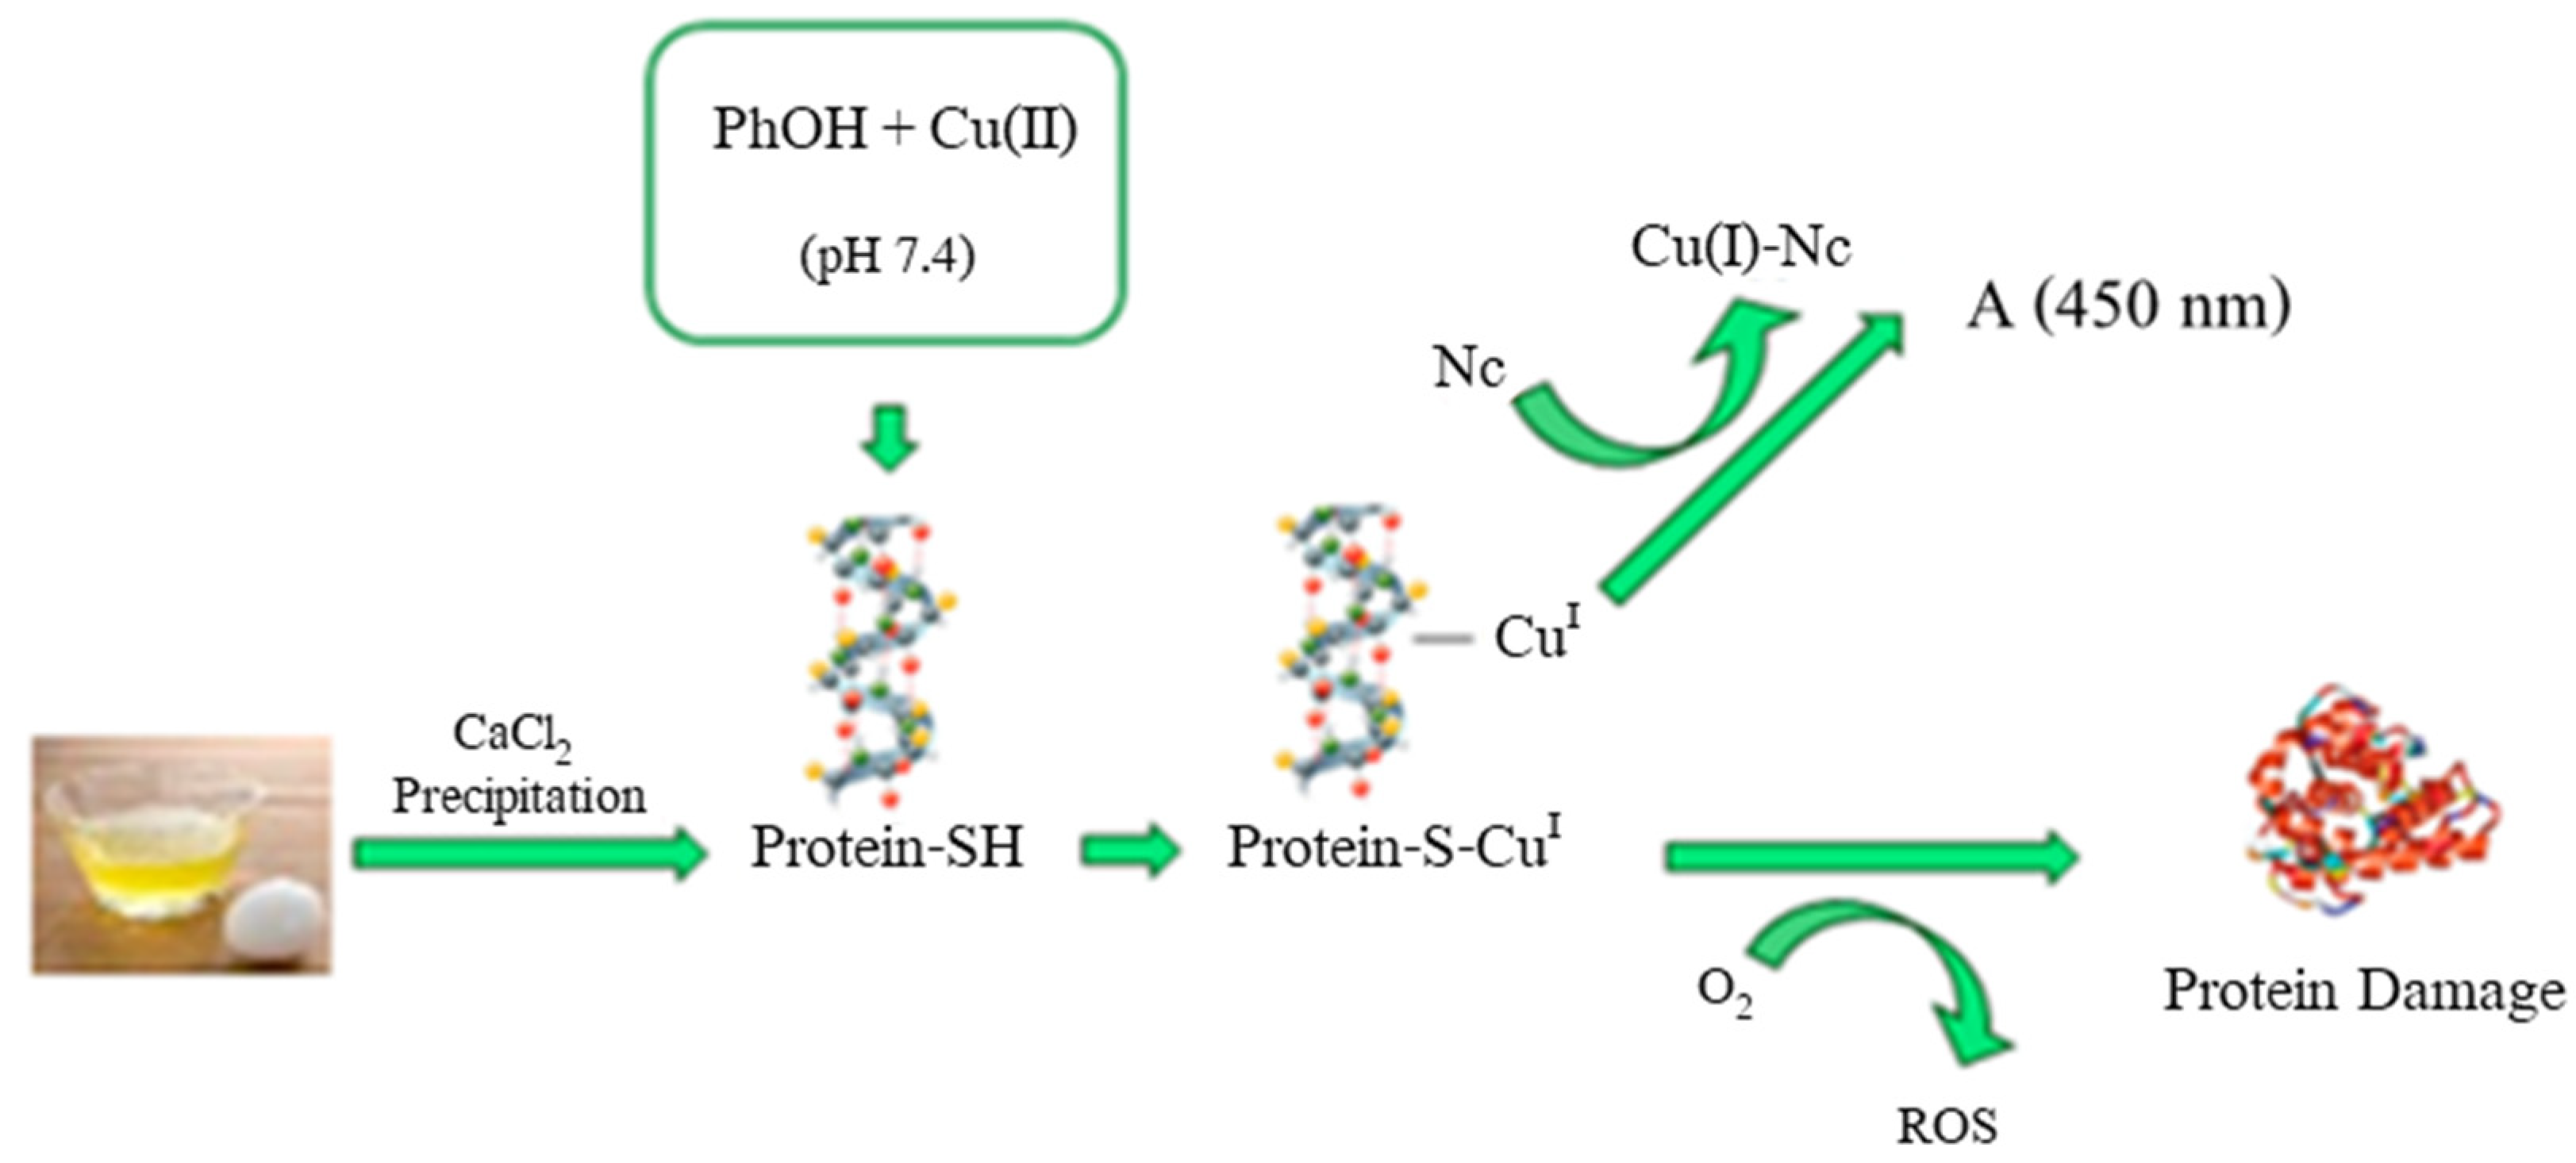
| Cu(II)-Nc protein-based biosensor | Colorimetric detection | 25.0−250 | 1.2 | Herbal plant extracts (sage, green tea, mint, and marjoram) | [80] |
Publisher’s Note: MDPI stays neutral with regard to jurisdictional claims in published maps and institutional affiliations. |
© 2021 by the authors. Licensee MDPI, Basel, Switzerland. This article is an open access article distributed under the terms and conditions of the Creative Commons Attribution (CC BY) license (https://creativecommons.org/licenses/by/4.0/).
Share and Cite
Munteanu, I.G.; Apetrei, C. A Review on Electrochemical Sensors and Biosensors Used in Chlorogenic Acid Electroanalysis. Int. J. Mol. Sci. 2021, 22, 13138. https://doi.org/10.3390/ijms222313138
Munteanu IG, Apetrei C. A Review on Electrochemical Sensors and Biosensors Used in Chlorogenic Acid Electroanalysis. International Journal of Molecular Sciences. 2021; 22(23):13138. https://doi.org/10.3390/ijms222313138
Chicago/Turabian StyleMunteanu, Irina Georgiana, and Constantin Apetrei. 2021. "A Review on Electrochemical Sensors and Biosensors Used in Chlorogenic Acid Electroanalysis" International Journal of Molecular Sciences 22, no. 23: 13138. https://doi.org/10.3390/ijms222313138
APA StyleMunteanu, I. G., & Apetrei, C. (2021). A Review on Electrochemical Sensors and Biosensors Used in Chlorogenic Acid Electroanalysis. International Journal of Molecular Sciences, 22(23), 13138. https://doi.org/10.3390/ijms222313138