
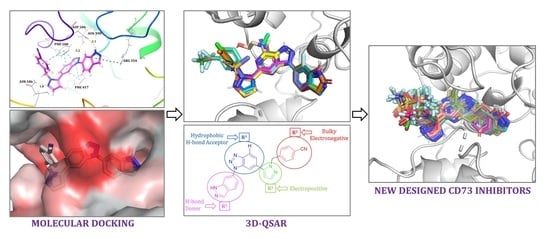
Generation of Non-Nucleotide CD73 Inhibitors Using a Molecular Docking and 3D-QSAR Approach

Abstract
:
1. Introduction
2. Results and Discussion
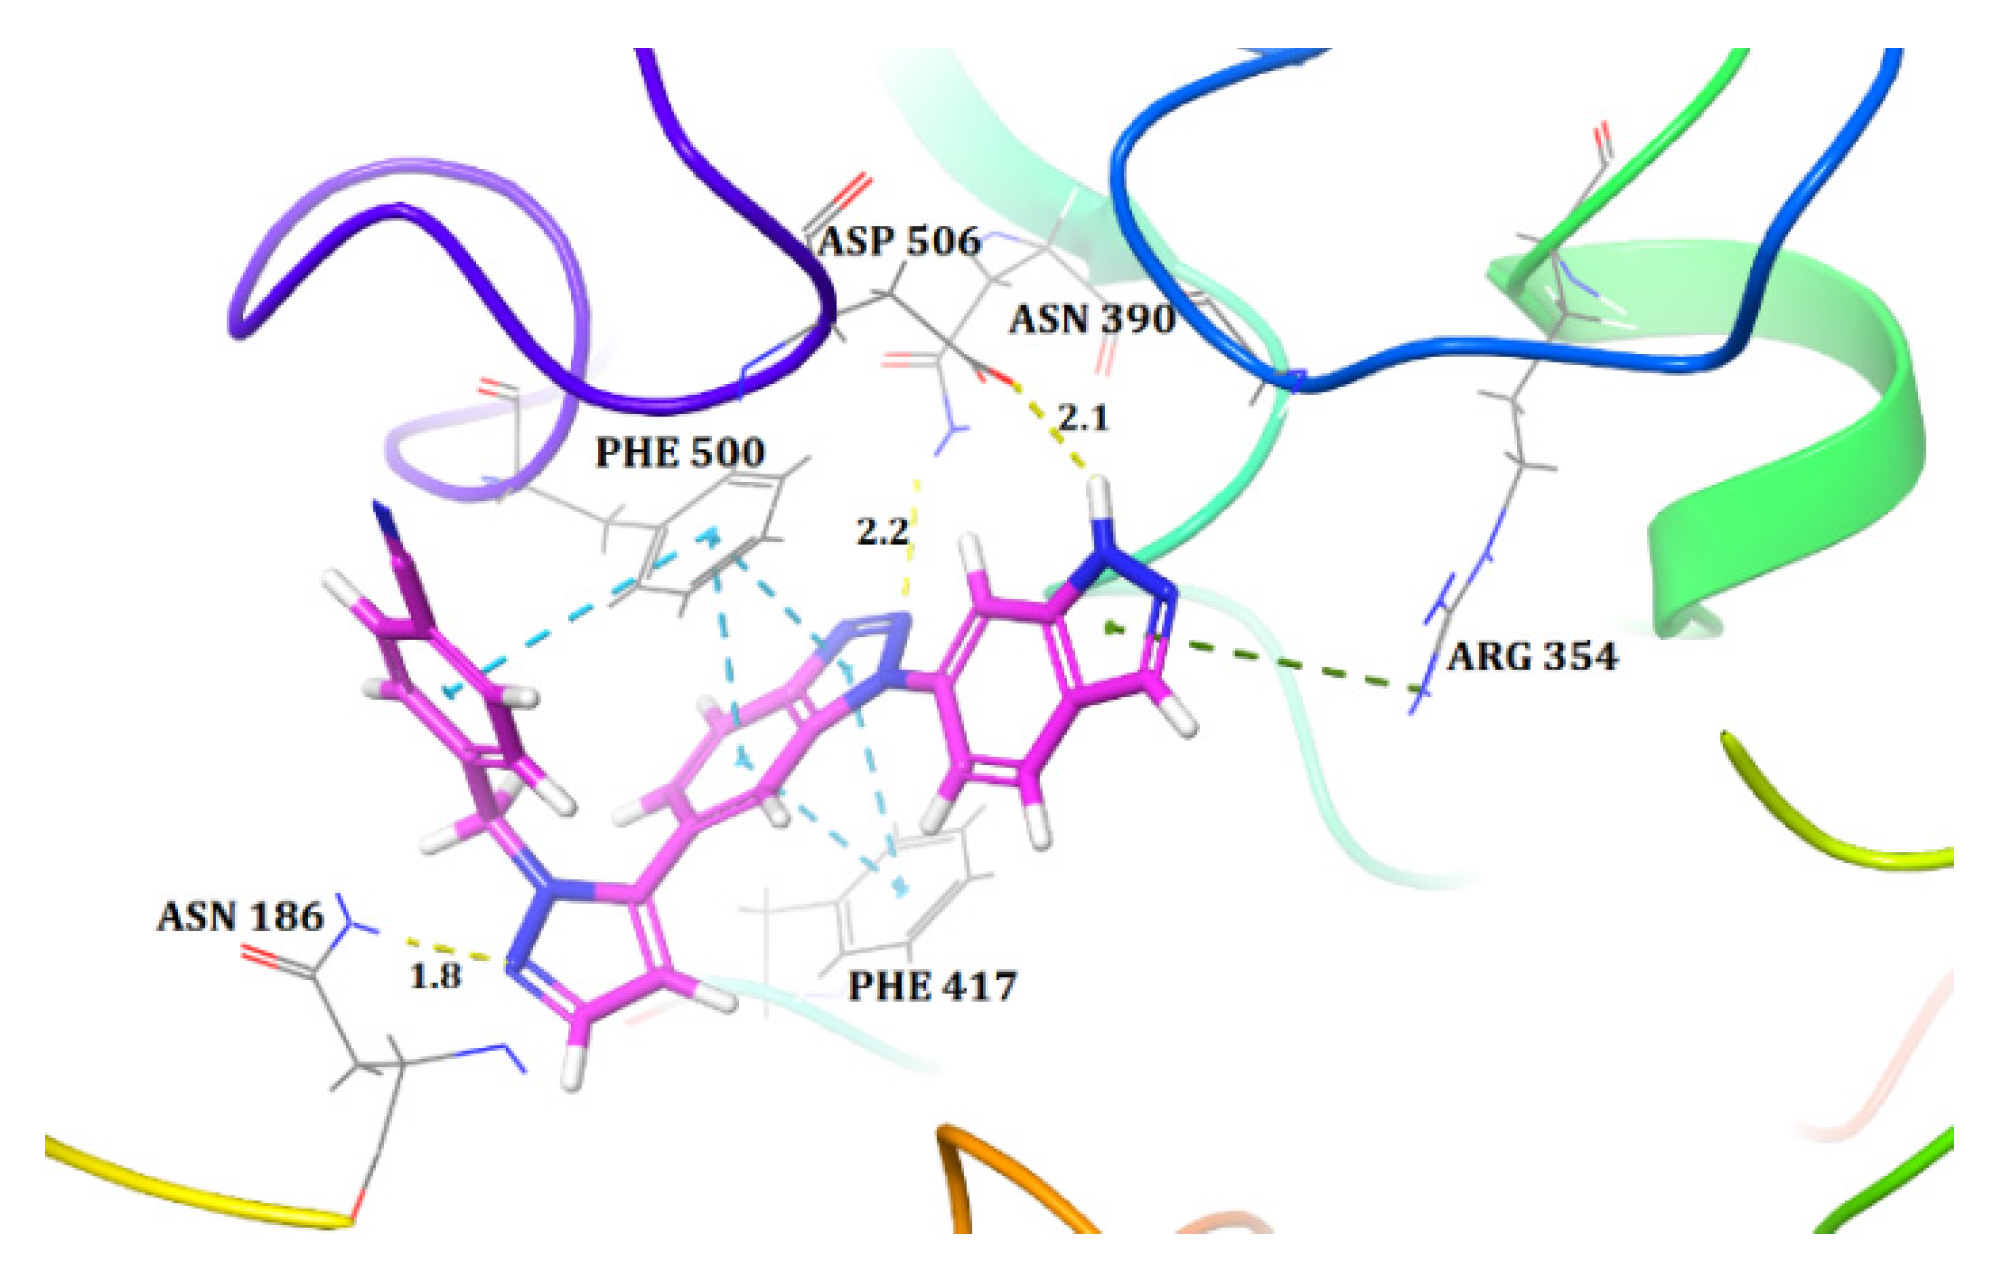
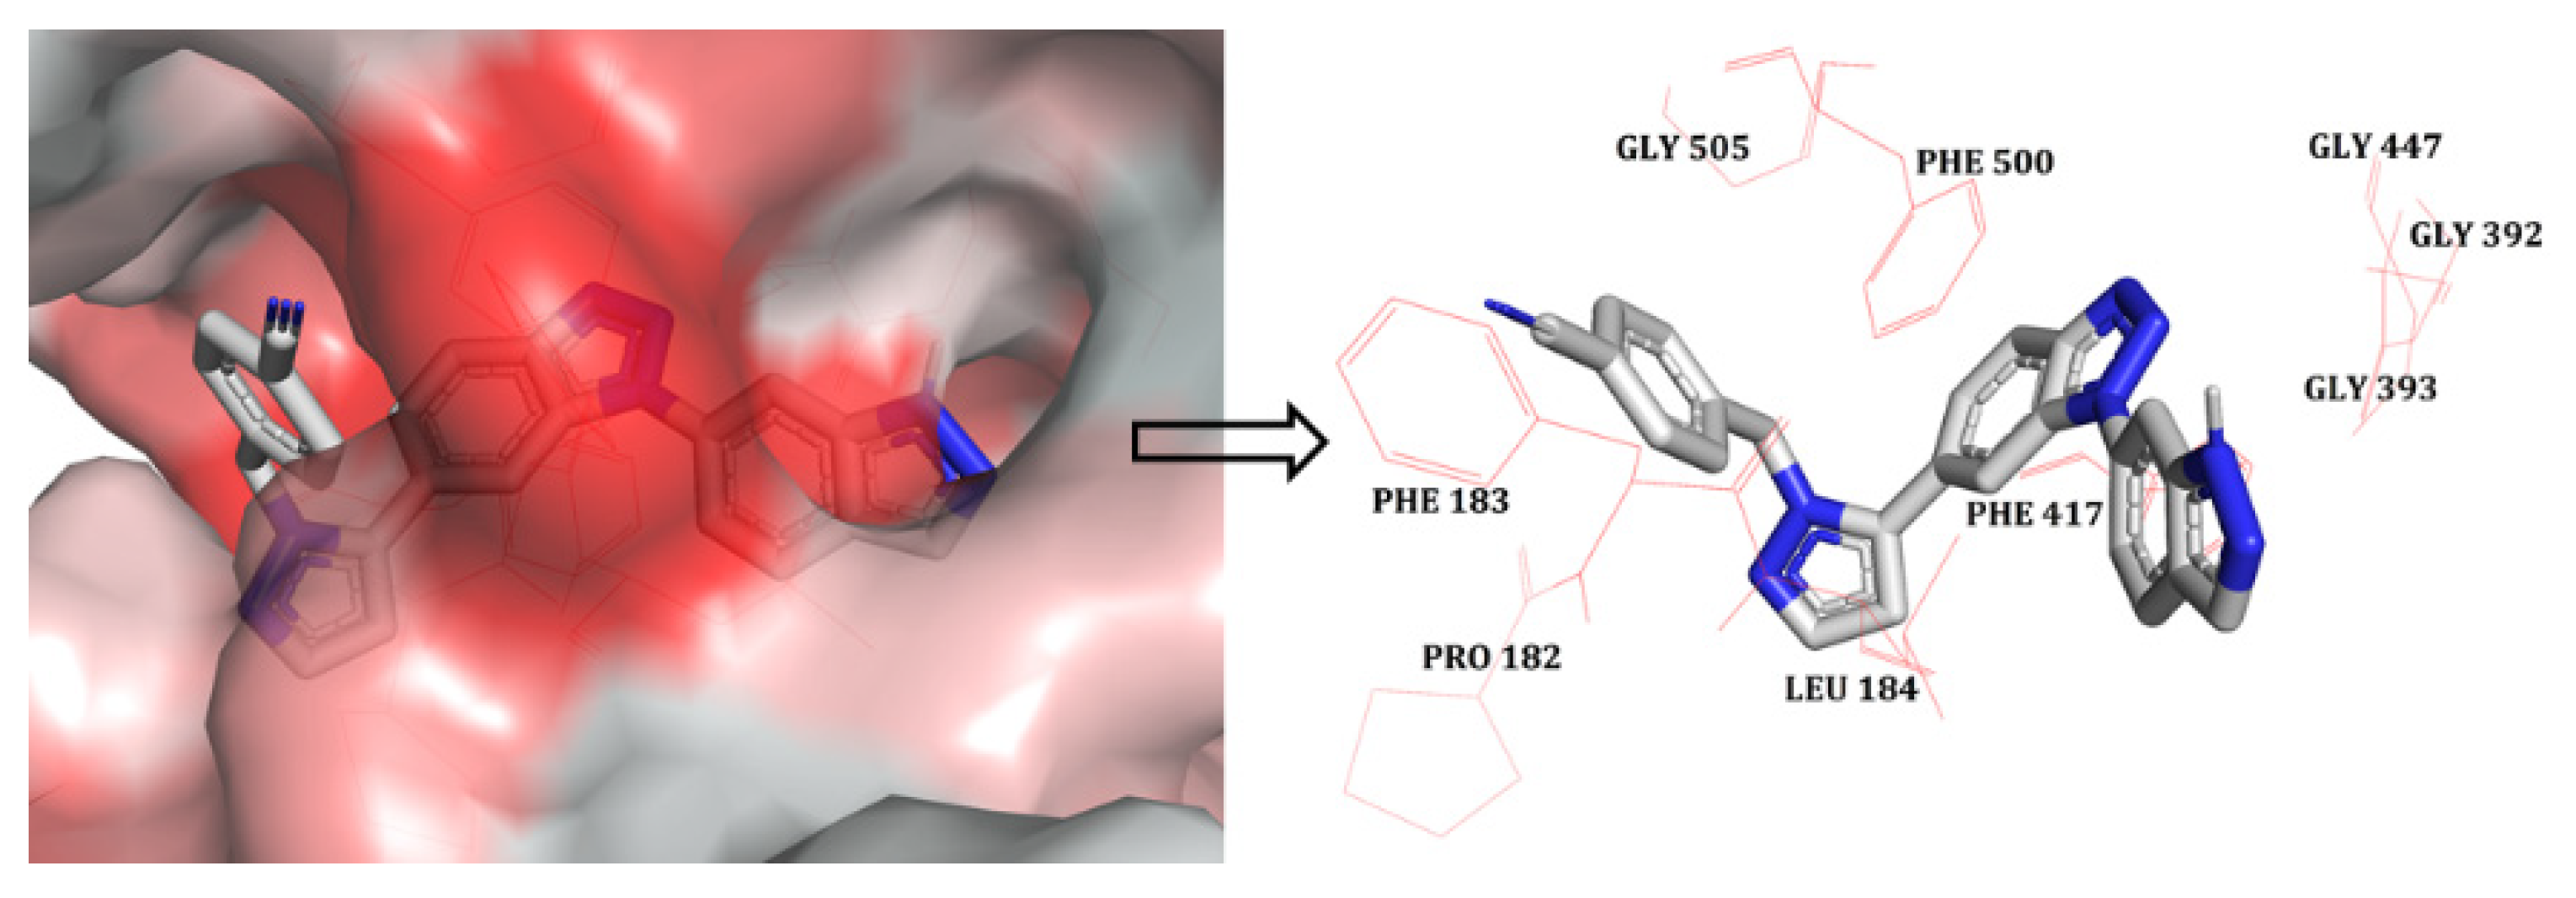
2.1. Molecular Docking
2.2. 3D-QSAR
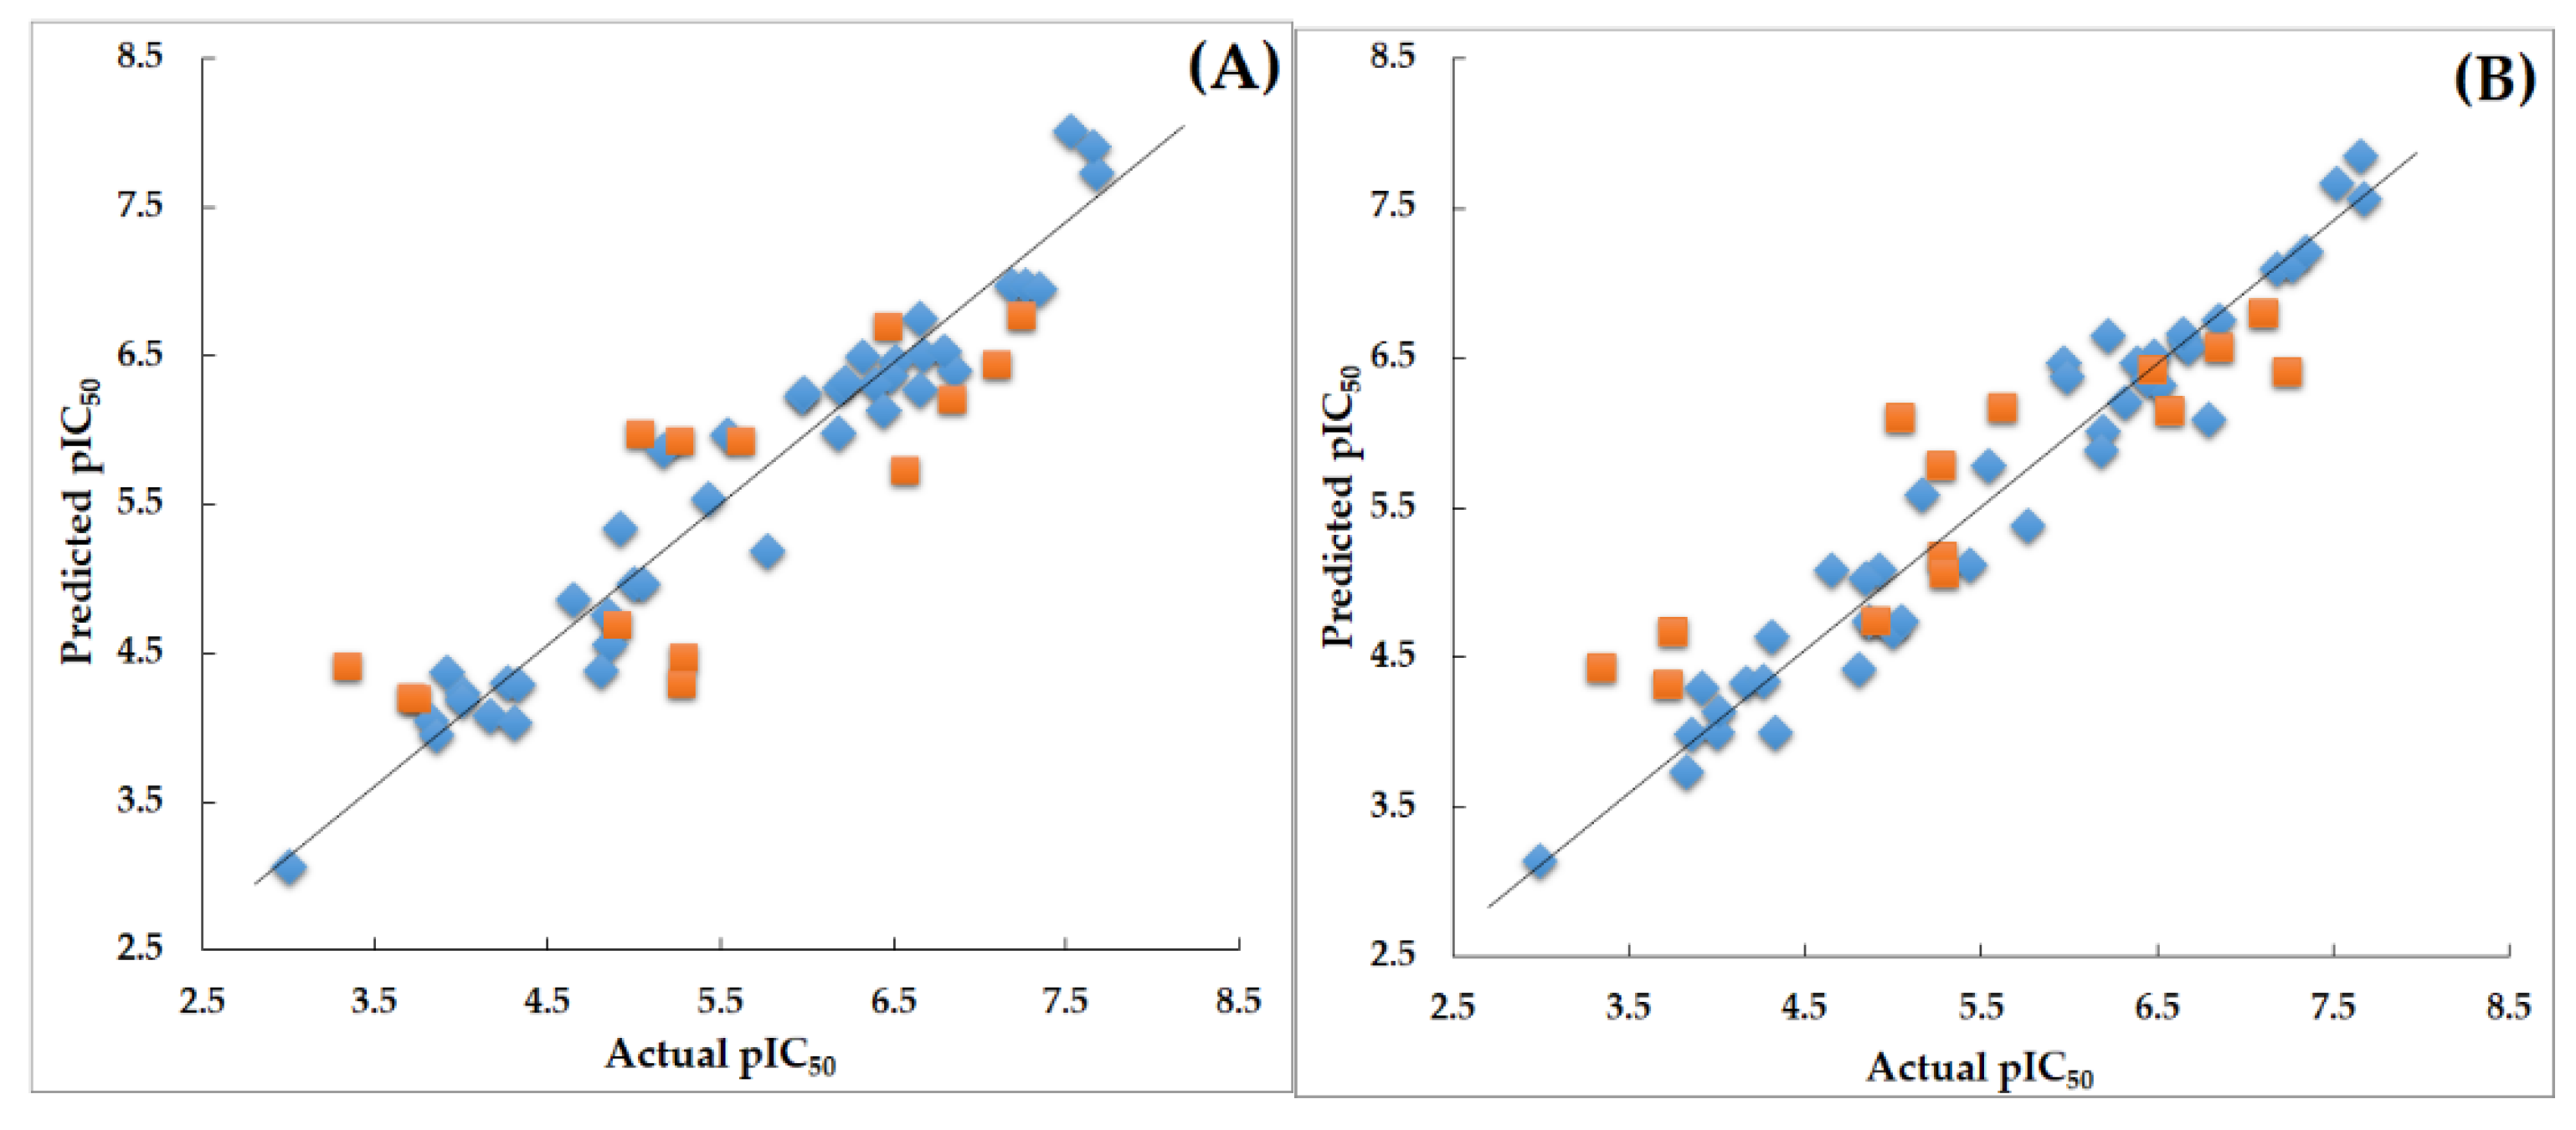
Validation of 3D-QSAR Models
2.3. Contour Map Analysis
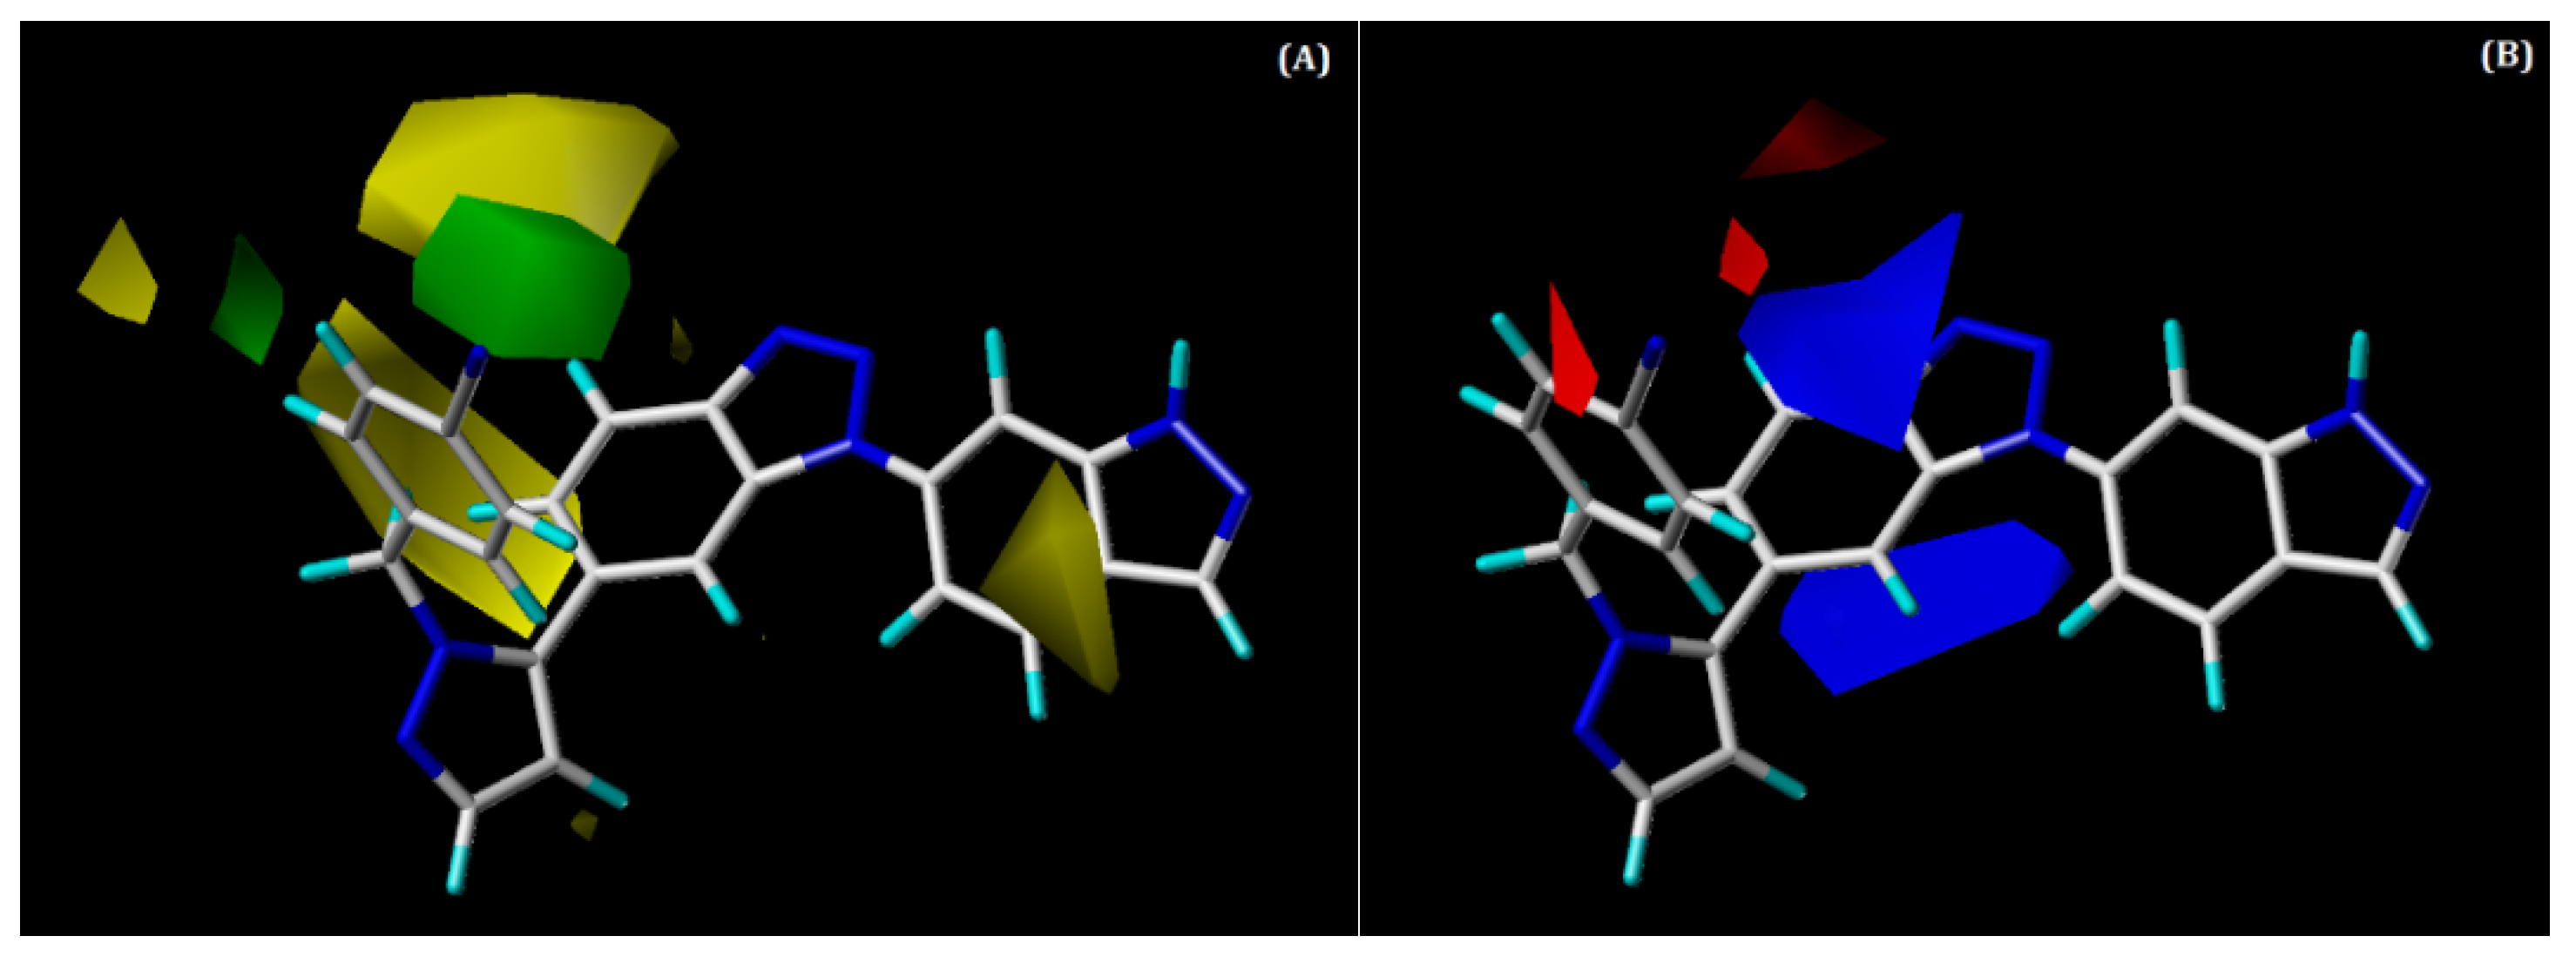
2.3.1. CoMFA Contour Maps
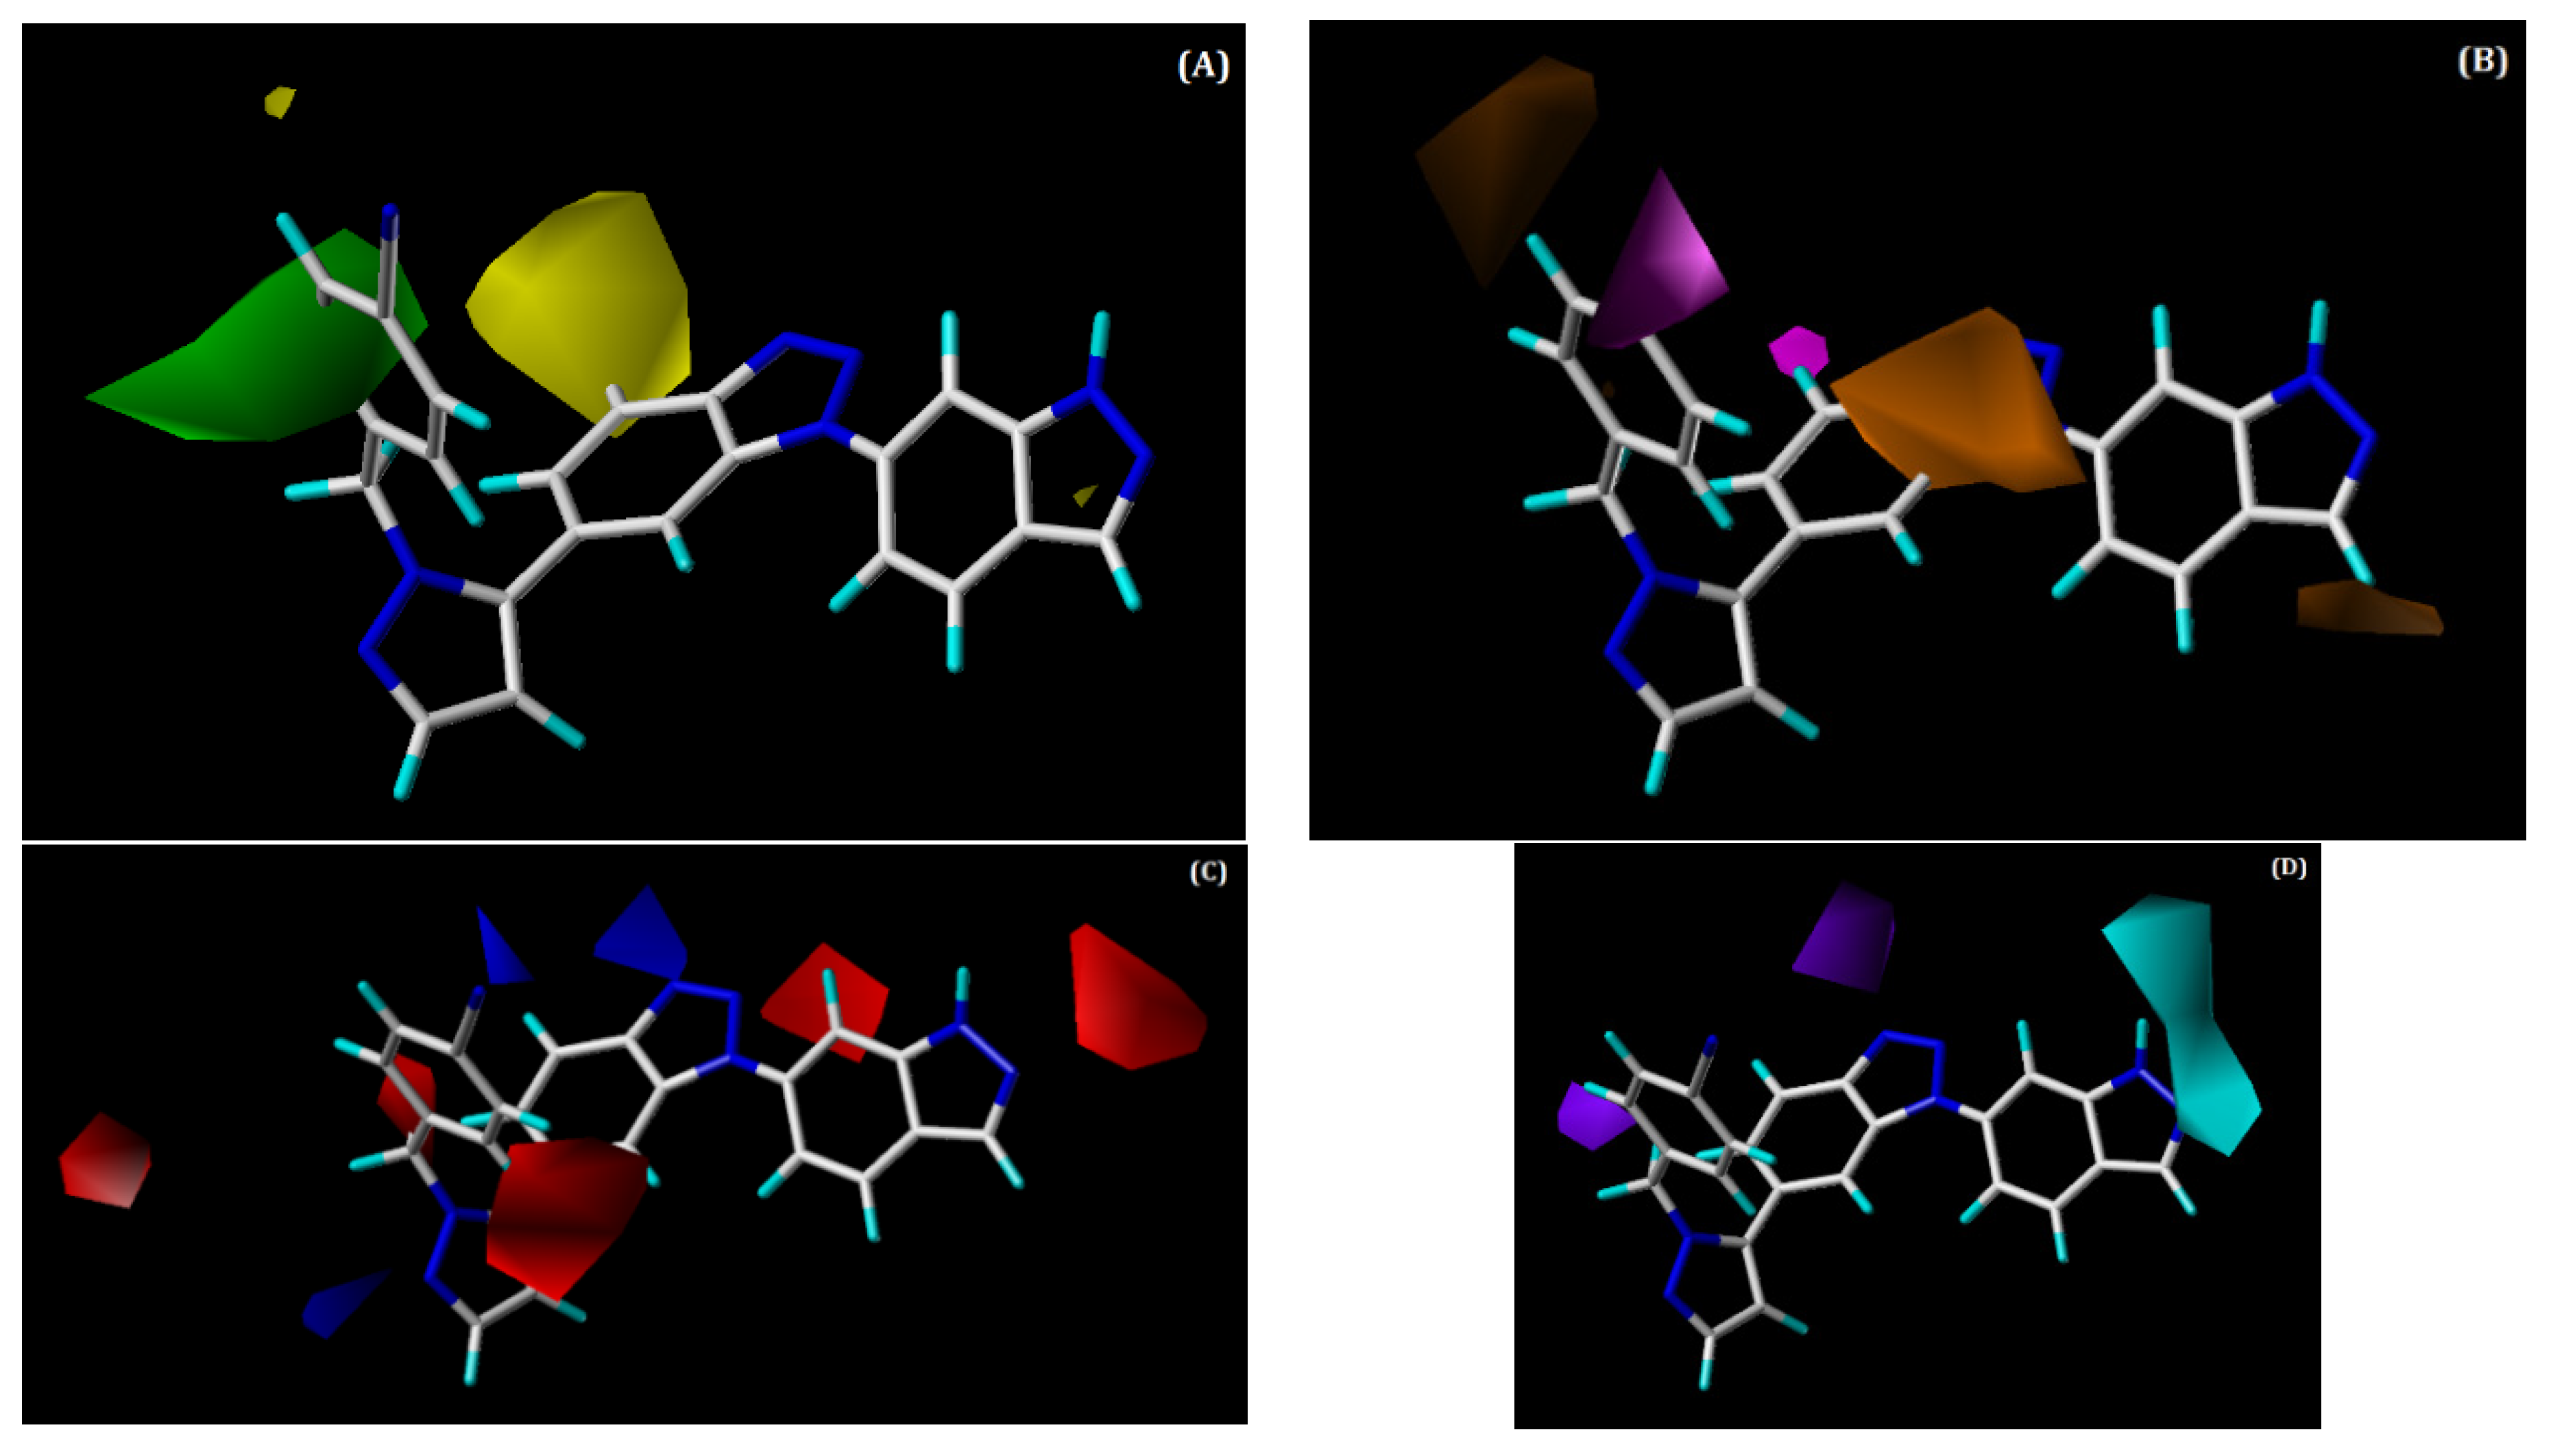
2.3.2. CoMSIA Contour Maps
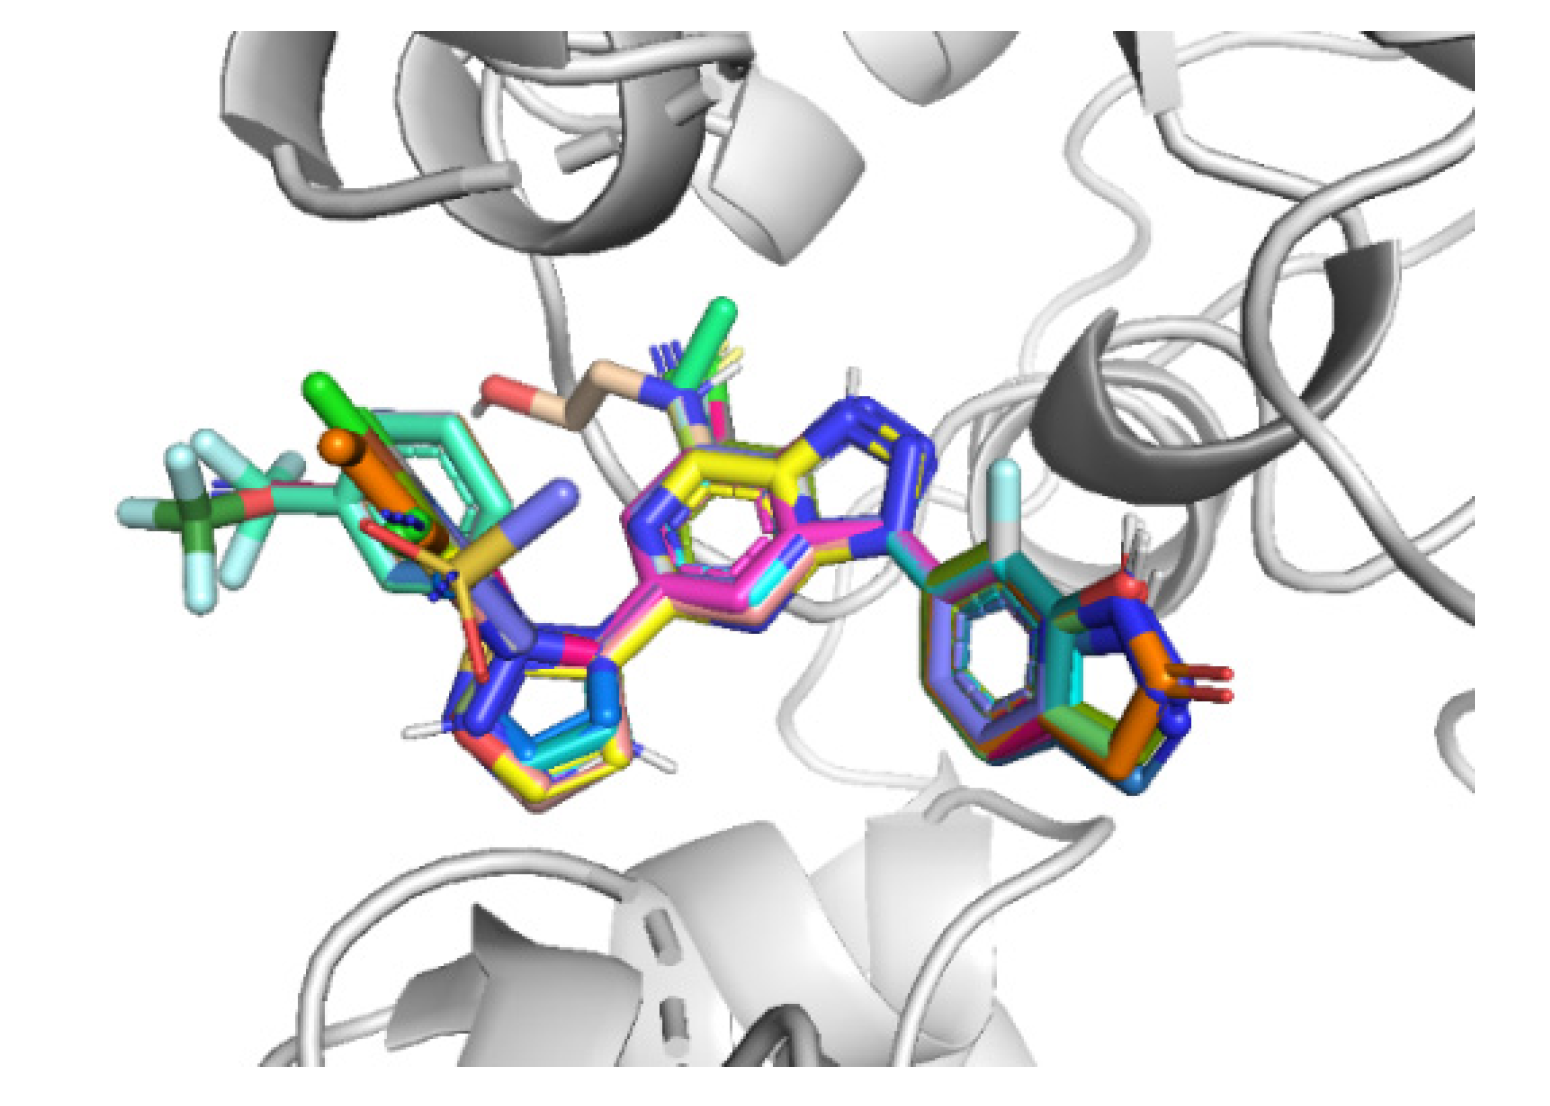
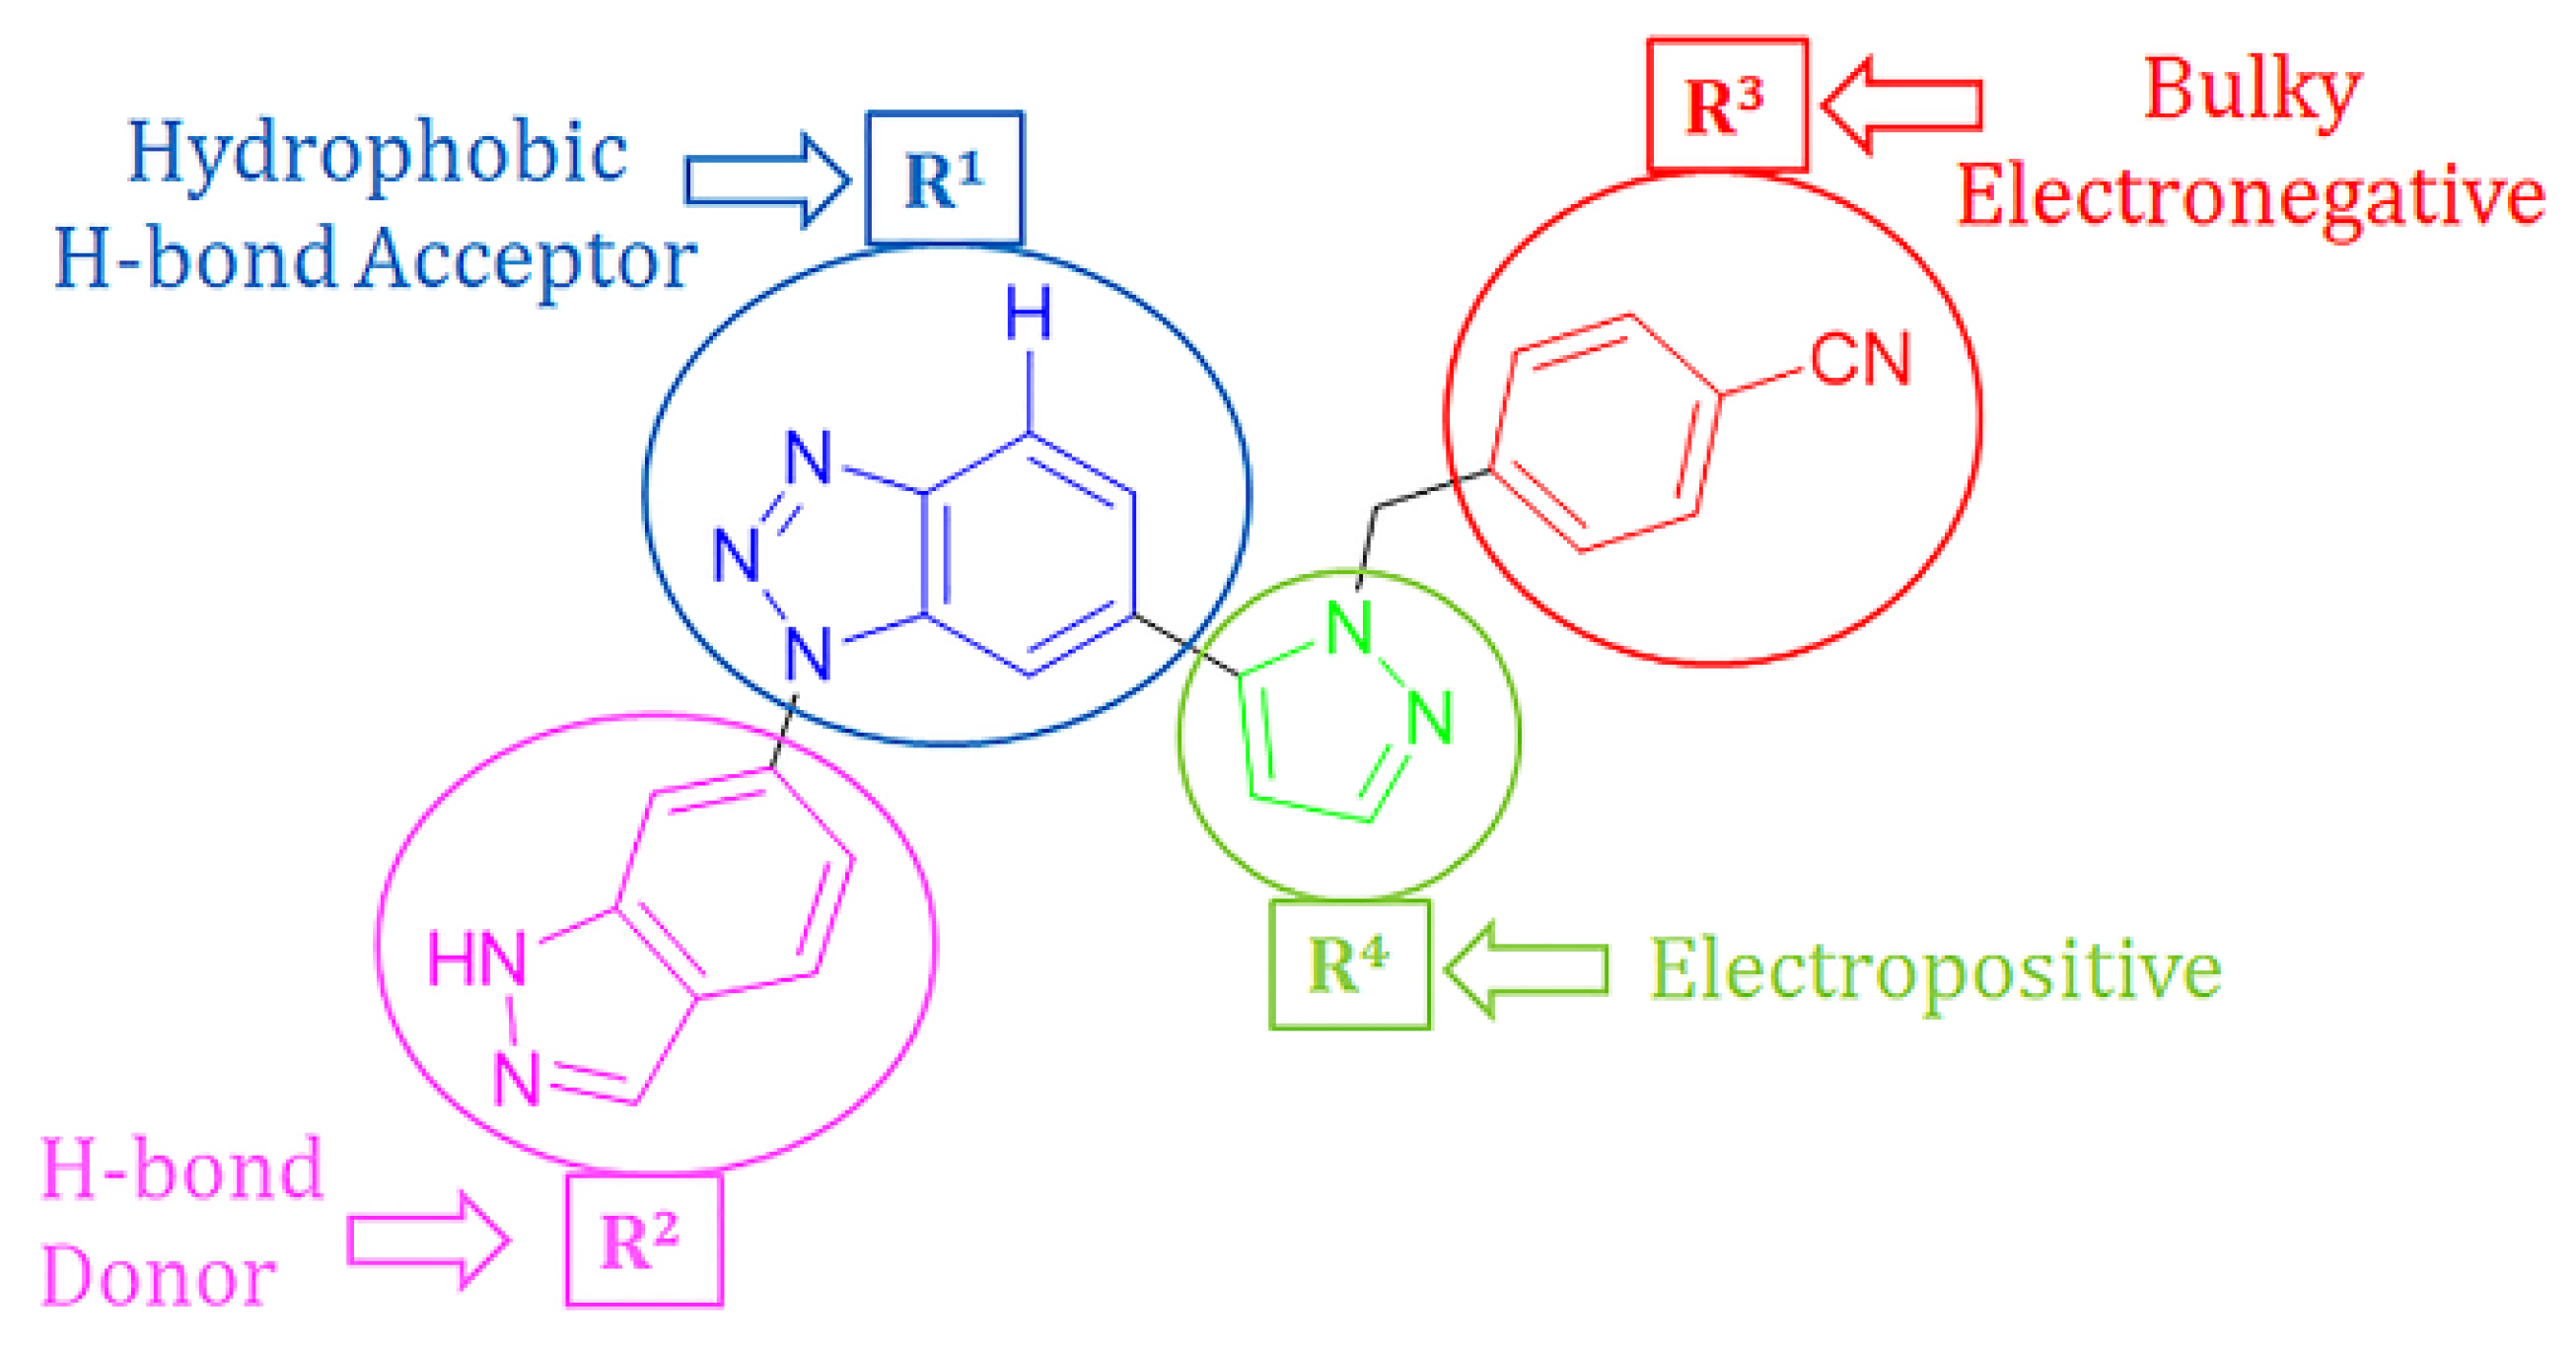
2.4. Designing New CD73 Inhibitors
3. Materials and Methods
3.1. Training Set/Test Set Selection for 3D-QSAR Analyses
3.2. Molecular Docking
3.3. Receptor-Based CoMFA and CoMSIA Models
3D-QSAR Model Validation
3.4. Design of New CD73 Inhibitors and ADMET Calculation
4. Conclusions
Supplementary Materials
Author Contributions
Funding
Institutional Review Board Statement
Informed Consent Statement
Data Availability Statement
Acknowledgments
Conflicts of Interest
References
- Beatty, J.W.; Lindsey, E.A.; Thomas-Tran, R.; Debien, L.; Mandal, D.; Jeffrey, J.L.; Tran, A.T.; Fournier, J.; Jacob, S.D.; Yan, X.; et al. Discovery of potent and selective non-nucleotide small molecule inhibitors of CD73. J. Med. Chem. 2020, 63, 3935–3955. [Google Scholar] [CrossRef]
- Nocentini, A.; Capasso, C.; Supuran, C.T. Small-molecule CD73 inhibitors for the immunotherapy of cancer: A patent and literature review (2017–present). Expert Opin. Ther. Patents 2021, 30, 1–10. [Google Scholar] [CrossRef]
- Zhao-Wei, G.; Dong, K.; Hui-zhong, Z. The Roles of CD73 in Cancer. BioMed Res. Int. 2014, 2014, 9. [Google Scholar]
- Helenius, M.; Jalkanen, S.; Yegutkin, G. Enzyme-coupled assays for simultaneous detection of nanomolar ATP, ADP, AMP, adenosine, inosine and pyrophosphate concentrations in extracellular fluids. Biochim. Biophys. Acta Bioenerg. 2012, 1823, 1967–1975. [Google Scholar] [CrossRef] [PubMed] [Green Version]
- Knapp, K.; Zebisch, M.; Pippel, J.; El-Tayeb, A.; Müller, C.E.; Sträter, N. Crystal structure of the human ec-to-5′-nucleotidase (CD73): Insights into the regulation of purinergic signaling. Structure 2012, 20, 2161–2173. [Google Scholar] [CrossRef] [Green Version]
- Antonioli, L.; Pacher, P.; Vizi, E.S.; Haskó, G. CD39 and CD73 in immunity and inflammation. Trends Mol. Med. 2013, 19, 355–367. [Google Scholar] [CrossRef] [Green Version]
- Knöfel, T.; Sträter, N. Mechanism of hydrolysis of phosphate esters by the dimetal center of 5′-nucleotidase based on crystal structures. J. Mol. Biol. 2001, 309, 239–254. [Google Scholar] [CrossRef] [PubMed]
- Yu, M.; Guo, G.; Huang, L.; Deng, L.; Chang, C.-S.; Achyut, B.R.; Canning, M.; Xu, N.; Arbab, A.S.; Bollag, R.J.; et al. CD73 on cancer-associated fibroblasts enhanced by the A2B-mediated feedforward circuit enforces an immune checkpoint. Nat. Commun. 2020, 11, 1–17. [Google Scholar] [CrossRef] [PubMed]
- Burnstock, G. Purine and pyrimidine receptors. Cell. Mol. Life Sci. 2007, 64, 1471–1483. [Google Scholar] [CrossRef] [PubMed]
- Du, X.; Moore, J.; Blank, B.R.; Eksterowicz, J.; Sutimantanapi, D.; Yuen, N.; Metzger, T.; Chan, B.; Huang, T.; Chen, X.; et al. Orally Bioavailable Small Molecule CD73 Inhibitor (OP-5244) Reverses Immunosuppression Through Blockade of Adenosine Production. J. Med. Chem. 2020, 63, 10433–10459. [Google Scholar] [CrossRef]
- Ripphausen, P.; Freundlieb, M.; Brunschweiger, A.; Zimmermann, H.; Müller, C.E.; Bajorath, J. Virtual Screening Identifies Novel Sulfonamide Inhibitors of ecto-5′-Nucleotidase. J. Med. Chem. 2012, 55, 6576–6581. [Google Scholar] [CrossRef]
- De Leve, S.; Wirsdörfer, F.; Jendrossek, V. Targeting the immunomodulatory CD73/adenosine system to im-prove the therapeutic gain of radiotherapy. Front. Immunol. 2019, 10, 698. [Google Scholar] [CrossRef] [Green Version]
- Blanchard, P.; Baujat, B.; Holostenco, V.; Bourredjem, A.; Baey, C.; Bourhis, J.; Pignon, J.-P. The MACH-CH Collaborative group. Meta-analysis of chemotherapy in head and neck cancer (MACH-NC): A comprehensive analysis by tumour site. Radiother. Oncol. 2011, 100, 33–40. [Google Scholar] [CrossRef]
- Baqi, Y.; Lee, S.-Y.; Iqbal, J.; Ripphausen, P.; Lehr, A.; Scheiff, A.B.; Zimmermann, H.; Bajorath, J.; Müller, C.E. development of potent and selective inhibitors of ecto-5′-nucleotidase based on an anthraquinone scaffold. J. Med. Chem. 2010, 53, 2076–2086. [Google Scholar] [CrossRef] [PubMed]
- Bhattarai, S.; Freundlieb, M.; Pippel, J.; Meyer, A.; Abdelrahman, A.; Fiene, A.; Lee, S.-Y.; Zimmermann, H.; Yegutkin, G.G.; Sträter, N.; et al. α,β-Methylene-ADP (AOPCP) Derivatives and Analogues: Development of Potent and Selective ecto-5′-Nucleotidase (CD73) Inhibitors. J. Med. Chem. 2015, 58, 6248–6263. [Google Scholar] [CrossRef]
- Junker, A.; Renn, C.; Dobelmann, C.; Namasivayam, V.; Jain, S.; Losenkova, K.; Irjala, H.; Duca, S.; Balasubramanian, R.; Chakraborty, S.; et al. Structure–activity relationship of purine and pyrimidine nucleotides as Ecto-5′-nucleotidase (CD73) inhibitors. J. Med. Chem. 2019, 62, 3677–3695. [Google Scholar] [CrossRef]
- Koszalka, P.; Özüyaman, B.; Huo, Y.; Zernecke, A.; Flögel, U.; Braun, N.; Buchheiser, A.; Decking, U.K.; Smith, M.L.; Sévigny, J. Targeted disruption of cd73/ecto-5′-nucleotidase alters thromboregulation and augments vascular inflammatory response. Circ. Res. 2004, 95, 814–821. [Google Scholar] [CrossRef] [PubMed] [Green Version]
- Eisenberg, D.S.; Schwarz, E.J.M.B.E.; Komaromy, M.; Wall, R. Analysis of membrane and surface protein sequences with the hydrophobic moment plot. J. Mol. Biol. 1984, 179, 125–142. [Google Scholar] [CrossRef]
- Golbraikh, A.; Tropsha, A. Predictive QSAR modeling based on diversity sampling of experimental datasets for the training and test set selection. Mol. Divers. 2000, 5, 231–243. [Google Scholar] [CrossRef] [PubMed]
- Chirico, N.; Gramatica, P. Modeling. Real external predictivity of QSAR models. Part 2. New intercomparable thresholds for different validation criteria and the need for scatter plot inspection. J. Chem. Inf. Model. 2012, 52, 2044–2058. [Google Scholar] [CrossRef] [PubMed]
- Roy, K.; Chakraborty, P.; Mitra, I.; Ojha, P.K.; Kar, S.; Das, R.N. Some case studies on application of “rm2” metrics for judging quality of quantitative structure-activity relationship predictions: Emphasis on scaling of response data. J. Comput. Chem. 2013, 34, 1071–1082. [Google Scholar] [CrossRef]
- Daina, A.; Michielin, O.; Zoete, V. SwissADME: A free web tool to evaluate pharmacokinetics, drug-likeness and medicinal chemistry friendliness of small molecules. Sci. Rep. 2017, 7, 42717. [Google Scholar] [CrossRef] [PubMed] [Green Version]
- Pires, D.E.V.; Blundell, T.L.; Ascher, D.B. pkCSM: Predicting small-molecule pharmacokinetic and toxicity properties using graph-based signatures. J. Med. Chem. 2015, 58, 4066–4072. [Google Scholar] [CrossRef]
- Thibaut, U.; Folkers, G.; Klebe, G.; Kubinyi, H.; Merz, A.; Rognan, D. Recommendations for CoMFA Studies and 3D QSAR Publications. Quant. Struct. Relatsh. 1994, 13, 1–3. [Google Scholar] [CrossRef]
- Poso, A.; von Wright, A.; Gynther, J. An empirical and theoretical study on mechanisms of mutagenic activity of hydrazine compounds. Mutat. Res. 1995, 332, 63–71. [Google Scholar] [CrossRef]
- Dagan-Wiener, A.; Nissim, I.; Ben Abu, N.; Borgonovo, G.; Bassoli, A.; Niv, M.Y. Bitter or not? BitterPredict, a tool for predicting taste from chemical structure. Sci. Rep. 2017, 7, 1–13. [Google Scholar] [CrossRef] [Green Version]
- Farid, R.; Day, T.; Friesner, R.A.; Pearlstein, R.A. New insights about HERG blockade obtained from protein modeling, potential energy mapping, and docking studies. Bioorg. Med. Chem. 2006, 14, 3160–3173. [Google Scholar] [CrossRef]
- Cousins, K.R. Computer Review of ChemDraw Ultra 12.0. J. Am. Chem. Soc. 2011, 133, 8388. [Google Scholar] [CrossRef] [PubMed]
- Brooks, W.H.; Daniel, K.G.; Sung, S.-S.; Guida, W.C. Computational validation of the importance of absolute stereochemistry in virtual screening. J. Chem. Inf. Model. 2008, 48, 639–645. [Google Scholar] [CrossRef]
- Van Den Driessche, G.; Fourches, D. Adverse drug reactions triggered by the common HLA-B 57: 01 variant: A molecular docking study. J. Cheminf. 2017, 9, 1–17. [Google Scholar] [CrossRef] [Green Version]
- Giardina, S.F.; Werner, D.S.; Pingle, M.; Feinberg, P.B.; Foreman, K.W.; Bergstrom, D.E.; Arnold, L.D.; Barany, F. Novel, Self-Assembling dimeric inhibitors of human β Tryptase. J. Med. Chem. 2020, 63, 3004–3027. [Google Scholar] [CrossRef]
- Friesner, R.A.; Murphy, R.B.; Repasky, M.P.; Frye, L.L.; Greenwood, J.R.; Halgren, T.A.; Sanschagrin, P.C.; Mainz, D.T. Extra Precision Glide: Docking and scoring incorporating a model of hydrophobic enclosure for protein−ligand complexes. J. Med. Chem. 2006, 49, 6177–6196. [Google Scholar] [CrossRef] [PubMed] [Green Version]
- Cramer, R.D.; Patterson, D.E.; Bunce, J.D. Comparative molecular field analysis (CoMFA). 1. Effect of shape on binding of steroids to carrier proteins. J. Am. Chem. Soc. 1988, 110, 5959–5967. [Google Scholar] [CrossRef]
- Klebe, G.; Abraham, U.; Mietzner, T. Molecular similarity indices in a comparative analysis (CoMSIA) of drug molecules to correlate and predict their biological activity. J. Med. Chem. 1994, 37, 4130–4146. [Google Scholar] [CrossRef] [PubMed]
- Ghosh, S.; Keretsu, S.; Cho, S.J. Designing of the N-ethyl-4-(pyridin-4-yl)benzamide based potent ROCK1 inhibitors using docking, molecular dynamics, and 3D-QSAR. PeerJ 2021, 9, e11951. [Google Scholar] [CrossRef]
- Gadhe, C.G.; Madhavan, T.; Kothandan, G.; Lee, T.-B.; Lee, K.; Cho, S.-J. Various Partial Charge Schemes on 3D-QSAR Models for P-gp Inhibiting Adamantyl Derivatives. Bull. Korean Chem. Soc. 2011, 32, 1604–1612. [Google Scholar] [CrossRef] [Green Version]
- Gadhe, C.G.; Kothandan, G.; Cho, S.J. Large variation in electrostatic contours upon addition of steric parameters and the effect of charge calculation schemes in CoMFA on mutagenicity of MX analogues. Mol. Sim. 2012, 38, 861–871. [Google Scholar] [CrossRef]

| Parameter | Full Model | Test Set 5 | ||
|---|---|---|---|---|
| CoMFA | CoMSIA (SHAD) | CoMFA | CoMSIA (SHAD) | |
| q2 | 0.763 | 0.760 | 0.844 | 0.804 |
| ONC | 5 | 6 | 5 | 4 |
| SEP | 0.635 | 0.646 | 0.525 | 0.581 |
| r2 | 0.915 | 0.943 | 0.947 | 0.954 |
| SEE | 0.380 | 0.314 | 0.306 | 0.282 |
| F value | 108.134 | 134.938 | 129.146 | 191.403 |
| LOF | - | - | 0.848 | 0.771 |
| BS-r2 | - | - | 0.968 | 0.961 |
| BS-SD | - | - | 0.012 | 0.012 |
| Q2 | - | - | 0.626 | 0.599 |
| r2pred | - | - | 0.698 | 0.757 |
| Compound | R1 | R2 | R3 | R4 | Predicted pIC50 |
|---|---|---|---|---|---|
| D5 | 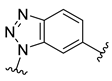 |  | 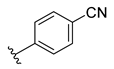 |  | 7.603 |
| D6 |  | 7.540 | |||
| D8 |  |  | 7.645 | ||
| D11 | 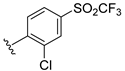 | 8.056 | |||
| D12 | 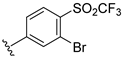 | 8.134 | |||
| D15 | 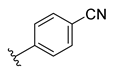 |  | 7.769 | ||
| D20 | 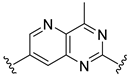 | 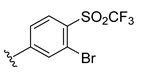 |  | 7.839 | |
| D24 | 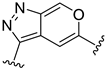 | 8.088 | |||
| D33 | 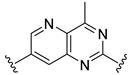 |  |  | 8.047 | |
| D45 | 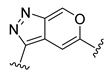 |  | 8.236 | ||
| D50 | 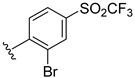 |  | 8.112 |
Publisher’s Note: MDPI stays neutral with regard to jurisdictional claims in published maps and institutional affiliations. |
© 2021 by the authors. Licensee MDPI, Basel, Switzerland. This article is an open access article distributed under the terms and conditions of the Creative Commons Attribution (CC BY) license (https://creativecommons.org/licenses/by/4.0/).
Share and Cite
Bhujbal, S.P.; Hah, J.-M. Generation of Non-Nucleotide CD73 Inhibitors Using a Molecular Docking and 3D-QSAR Approach. Int. J. Mol. Sci. 2021, 22, 12745. https://doi.org/10.3390/ijms222312745
Bhujbal SP, Hah J-M. Generation of Non-Nucleotide CD73 Inhibitors Using a Molecular Docking and 3D-QSAR Approach. International Journal of Molecular Sciences. 2021; 22(23):12745. https://doi.org/10.3390/ijms222312745
Chicago/Turabian StyleBhujbal, Swapnil P., and Jung-Mi Hah. 2021. "Generation of Non-Nucleotide CD73 Inhibitors Using a Molecular Docking and 3D-QSAR Approach" International Journal of Molecular Sciences 22, no. 23: 12745. https://doi.org/10.3390/ijms222312745
APA StyleBhujbal, S. P., & Hah, J.-M. (2021). Generation of Non-Nucleotide CD73 Inhibitors Using a Molecular Docking and 3D-QSAR Approach. International Journal of Molecular Sciences, 22(23), 12745. https://doi.org/10.3390/ijms222312745