Article

PTP61F Mediates Cell Competition and Mitigates Tumorigenesis

1
Cell Polarity, Cell Signaling & Cancer Laboratory, Department of Biochemistry & Genetics, La Trobe Institute for Molecular Science, La Trobe University, Melbourne, VIC 3086, Australia
2
Cell Cycle & Development Laboratory, Research Division, Peter MacCallum Cancer Centre, Melbourne, VIC 3002, Australia
3
Monash Biomedicine Discovery Institute, Monash University, Clayton, VIC 3800, Australia
4
Department of Biochemistry and Molecular Biology, Monash University, Clayton, VIC 3800, Australia
5
Peter MacCallum Department of Oncology, Department of Anatomy & Neuroscience, Department of Biochemistry, University of Melbourne, Melbourne, VIC 3010, Australia
*
Author to whom correspondence should be addressed.
Int. J. Mol. Sci. 2021, 22(23), 12732; https://doi.org/10.3390/ijms222312732
Submission received: 29 October 2021 / Revised: 23 November 2021 / Accepted: 23 November 2021 / Published: 25 November 2021
(This article belongs to the Special Issue Basic and Translational Models of Cooperative Oncogenesis 2.0)

Abstract

:
Tissue homeostasis via the elimination of aberrant cells is fundamental for organism survival. Cell competition is a key homeostatic mechanism, contributing to the recognition and elimination of aberrant cells, preventing their malignant progression and the development of tumors. Here, using Drosophila as a model organism, we have defined a role for protein tyrosine phosphatase 61F (PTP61F) (orthologue of mammalian PTP1B and TCPTP) in the initiation and progression of epithelial cancers. We demonstrate that a Ptp61F null mutation confers cells with a competitive advantage relative to neighbouring wild-type cells, while elevating PTP61F levels has the opposite effect. Furthermore, we show that knockdown of Ptp61F affects the survival of clones with impaired cell polarity, and that this occurs through regulation of the JAK–STAT signalling pathway. Importantly, PTP61F plays a robust non-cell-autonomous role in influencing the elimination of adjacent polarity-impaired mutant cells. Moreover, in a neoplastic RAS-driven polarity-impaired tumor model, we show that PTP61F levels determine the aggressiveness of tumors, with Ptp61F knockdown or overexpression, respectively, increasing or reducing tumor size. These effects correlate with the regulation of the RAS–MAPK and JAK–STAT signalling by PTP61F. Thus, PTP61F acts as a tumor suppressor that can function in an autonomous and non-cell-autonomous manner to ensure cellular fitness and attenuate tumorigenesis.

1. Introduction

Over the past century, Drosophila melanogaster has proven a suitable organism for modelling a range of human disorders, including cancer. The majority of the “hallmarks of cancer” are capable of being modelled in Drosophila, which, together with the high level of conservation of disease-relevant genes and its short life cycle, makes Drosophila a useful model for studying tumorigenesis (reviewed in [1,2,3]). One of the best-researched methods of tumorigenesis initiation in Drosophila is via the phenomenon of cooperative tumorigenesis—for example, upon the simultaneous activation of the growth-promoting GTPase RAS85D (commonly referred to as RAS, human orthologues HRAS, KRAS, and NRAS) and loss of the apico-basal cell polarity regulators Scribble (SCRIB) or Discs large 1 (DLG1) (human orthologues SCRIB and DLG1-4, respectively) (reviewed in [4]). Together, these alterations promote the formation of neoplastic, invasive tumors in developing Drosophila via the activation of anti-apoptotic signals, and contribute to the co-option of c-Jun N-terminal Kinase (JNK) signalling into a proliferation-promoting signalling pathway (reviewed in [5]). However, RAS85D activation or polarity impairment individually cause only “pre-tumorigenic” tissue disruptions—RAS85D activation leads to benign tissue overgrowth [6,7], while polarity impairment leads to increased cell proliferation and cell death, differentiation defects, and increased cell migration/invasion [7,8,9,10,11,12,13,14]. Interestingly, whole tissues depleted of SCRIB or DLG1 massively overgrow, but when polarity-impaired cells are generated in a clonal manner in Drosophila developing epithelial tissues (the wing or eye-antennal imaginal discs), scrib or dlg1 mutant cells are subject to a tissue surveillance and homeostasis mechanism known as cell competition [10,15]. The core concept of cell competition is that cells within a tissue are intrinsically competing with one another—that is, the fitness of each cell is surveyed relative to their neighbouring cells, and cells that are less fit are actively eliminated to maintain tissue homeostasis (reviewed in [16]). This is a conserved mechanism, though it is not so well studied in mammals as it is in flies (reviewed in [17]). Colloquially, eliminated cells are referred to as “loser cells”, while those that eliminate and replace them are concomitantly termed “winner cells”. In Drosophila epithelial tissues, scrib/dlg1 mutant clones undergo cell competition, and are eliminated by their wild-type neighbours [10,15]. Modulations in several highly conserved signalling pathways are involved in eliminating polarity-impaired cells during cell competition, including the JNK, the Hippo tissue growth inhibitory, the Janus kinase-signal transducer and activator of transcription (JAK–STAT), and the Epidermal Growth Factor Receptor (EGFR)-RAS–mitogen activated protein kinase (MAPK) signalling pathways (reviewed in [16]). The roles and targets of each cell competition-induced signalling pathway and the interplay between them are not completely understood, but many are regulated via the actions of protein tyrosine kinase (PTK) pathways, making the investigation of protein tyrosine phosphatases (PTPs) that regulate these pathways in cell competition a logical step.
Phosphorylation of proteins by protein kinases and dephosphorylation by protein phosphatases are critical for regulating the spatial and temporal activity of many signalling pathways. Protein phosphatases are broadly classified into three groups: protein serine/threonine phosphatases, PTPs, and dual-specificity phosphatases (DUSPs) (reviewed in [18,19,20]). While the majority of protein phosphorylation in mammalian cells occurs on serine/threonine, rather than tyrosine, tyrosine phosphorylation-dependent signalling is critical for the ability of cells to communicate with their extracellular environment and each other. More than 100 structurally and functionally diverse PTPs have been identified in the human genome [20]. In the vinegar fly model organism, Drosophila melanogaster, there are currently 44 known PTPs (including DUSPs), all with conserved human orthologues, though not all human PTPs have fly orthologues [21,22,23]. As in mammals, PTPs in Drosophila belong to either the transmembrane receptor or non-receptor subtypes [21]. The Drosophila non-receptor protein tyrosine phosphatase 61F (Ptp61F) functions as a negative regulator in a number of highly conserved signalling pathways, including the JAK–STAT pathway [24,25,26,27], the Insulin-like Receptor (INR) pathway [24,27,28,29], the EGFR- pathway [27,28], and the platelet-derived growth factor (PDGF)- and vascular endothelial growth factor (VEGF)-receptor-related (PVR) pathway [27]. PTP61F has two mammalian orthologues, PTP1B (encoded by PTPN1) and TCPTP (encoded by PTPN2), which share 74% catalytic domain sequence identity and 86% similarity (reviewed in [30,31]). PTP1B was the first mammalian PTP identified [32], and is localised to the cytoplasmic face of the endoplasmic reticulum and has an important role in immunity and metabolism, acting to dephosphorylate substrates such as the INR [33,34,35] and JAK-family PTKs JAK-2 and Tyk2 [36]. PTP1B can serve as a tumor suppressor, but also as an oncoprotein, as elevated PTP1B levels can contribute to the activation of SRC-family PTKs [37,38] and mediate signalling by the HER-2 oncoprotein [39,40]. PTPN2 encodes two splice variants: A 48 kDa TCPTP (TC48) which, like PTP1B, is localised to the endoplasmic reticulum, and a 45 kDa variant (TC45) that is targeted to the nucleus but shuttles between the nuclear and cytoplasmic environments [41,42,43,44]. Consequently, TCPTP has access to both nuclear substrates, such as STAT-1/3/5, and cytoplasmic substrates, such as INR and JAK-1/3 [31,44]. Interestingly, TCPTP and PTP1B have both overlapping and distinct functions in mammals [31]. More generally, TCPTP is thought to serve as a tumor suppressor, particularly in T cell acute lymphoblastic leukemia [45,46], and possibly in breast cancer [47] and liver cancer [48,49]. However, the role of Ptp61F in Drosophila cancer models has not been explored.
This study therefore aimed to explore the role of Ptp61F in cell competition and cooperative tumorigenesis, examining how its up-/downregulation affects clonal growth and cell polarity-impaired RAS-driven tumor growth. We report that PTP61F acts as a negative regulator of the JAK–STAT signalling pathway and thereby coordinates cell survival and clonal growth during cell competition. Furthermore, we show that it acts as a negative regulator of RAS85D-driven polarity-impaired cooperative tumorigenesis and inhibits the RAS–MAPK and JAK–STAT signalling pathways that are normally hyperactive in this context.

2. Results

2.1. Ptp61F Impairment Confers a Competitive Advantage on Epithelial Clones

Various highly conserved well-characterised signalling pathways are involved in cell competition in Drosophila epithelial tissues, such as EGFR-RAS–MAPK and JAK–STAT signalling (reviewed in [16]). These pathways are variably orchestrated by reversible tyrosine phosphorylation. Therefore, we reasoned that PTPs might play an unappreciated role in cell competition. We selected the Drosophila tyrosine phosphatase protein tyrosine phosphatase 61F (Ptp61F) as a candidate, as it has been shown to negatively regulate EGFR-RAS–MAPK and JAK–STAT signalling [27].
First, we utilised a technique known as “twin-clone generation”, whereby a single recombination event simultaneously generates GFP-double-positive wild-type clones and GFP-negative mutant clones, in a background of GFP-single-positive wild-type Drosophila third-instar larval (L3) epithelial tissues (technique adapted from Froldi et al. [50]). In control L3 wing imaginal discs, generating twin-clones where both are wild-type, though one twin is GFP-double positive and the other is GFP negative (Figure 1A,A’), leads to clones where the GFP-double-positive clones are consistently slightly larger than their GFP-negative twins, perhaps due to background genetic effects (Figure 1E). However, when the GFP-negative clones are homozygous mutant for Ptp61F (Figure 1B,B’), using the null allele Ptp61FΔ [24], the trend is reversed and Ptp61FΔ/Δ clones are consistently larger than their wild-type twins (Figure 1E). Analysing the GFP-negative/GFP-double-positive size ratio for each twin-clone pair further revealed a statistically significant, ~30% increase in the size ratios between wild-type/wild-type and wild-type/Ptp61FΔ/Δ twin-clones in wing imaginal discs (N.B. for all statistical test results, see the corresponding figure legend).
These results are supported by similar findings in experiments using L3 eye-antennal imaginal discs, where wild-type/wild-type twins once again were observed to have a slightly larger GFP-double-positive twin (Figure 1C,C’,F), but wild-type/Ptp61FΔ/Δ twins have a consistently larger GFP-negative, Ptp61F mutant twin (Figure 1D,D’,F). Similar to the wing discs, the GFP-negative/GFP-double-positive size ratio was significantly larger in wild-type/Ptp61FΔ/Δ twins compared to wild-type/wild-type twins, by ~2-fold. Altogether, these data show that loss of Ptp61F confers a competitive advantage upon epithelial tissue clones, possibly by promoting cell survival and/or proliferation.

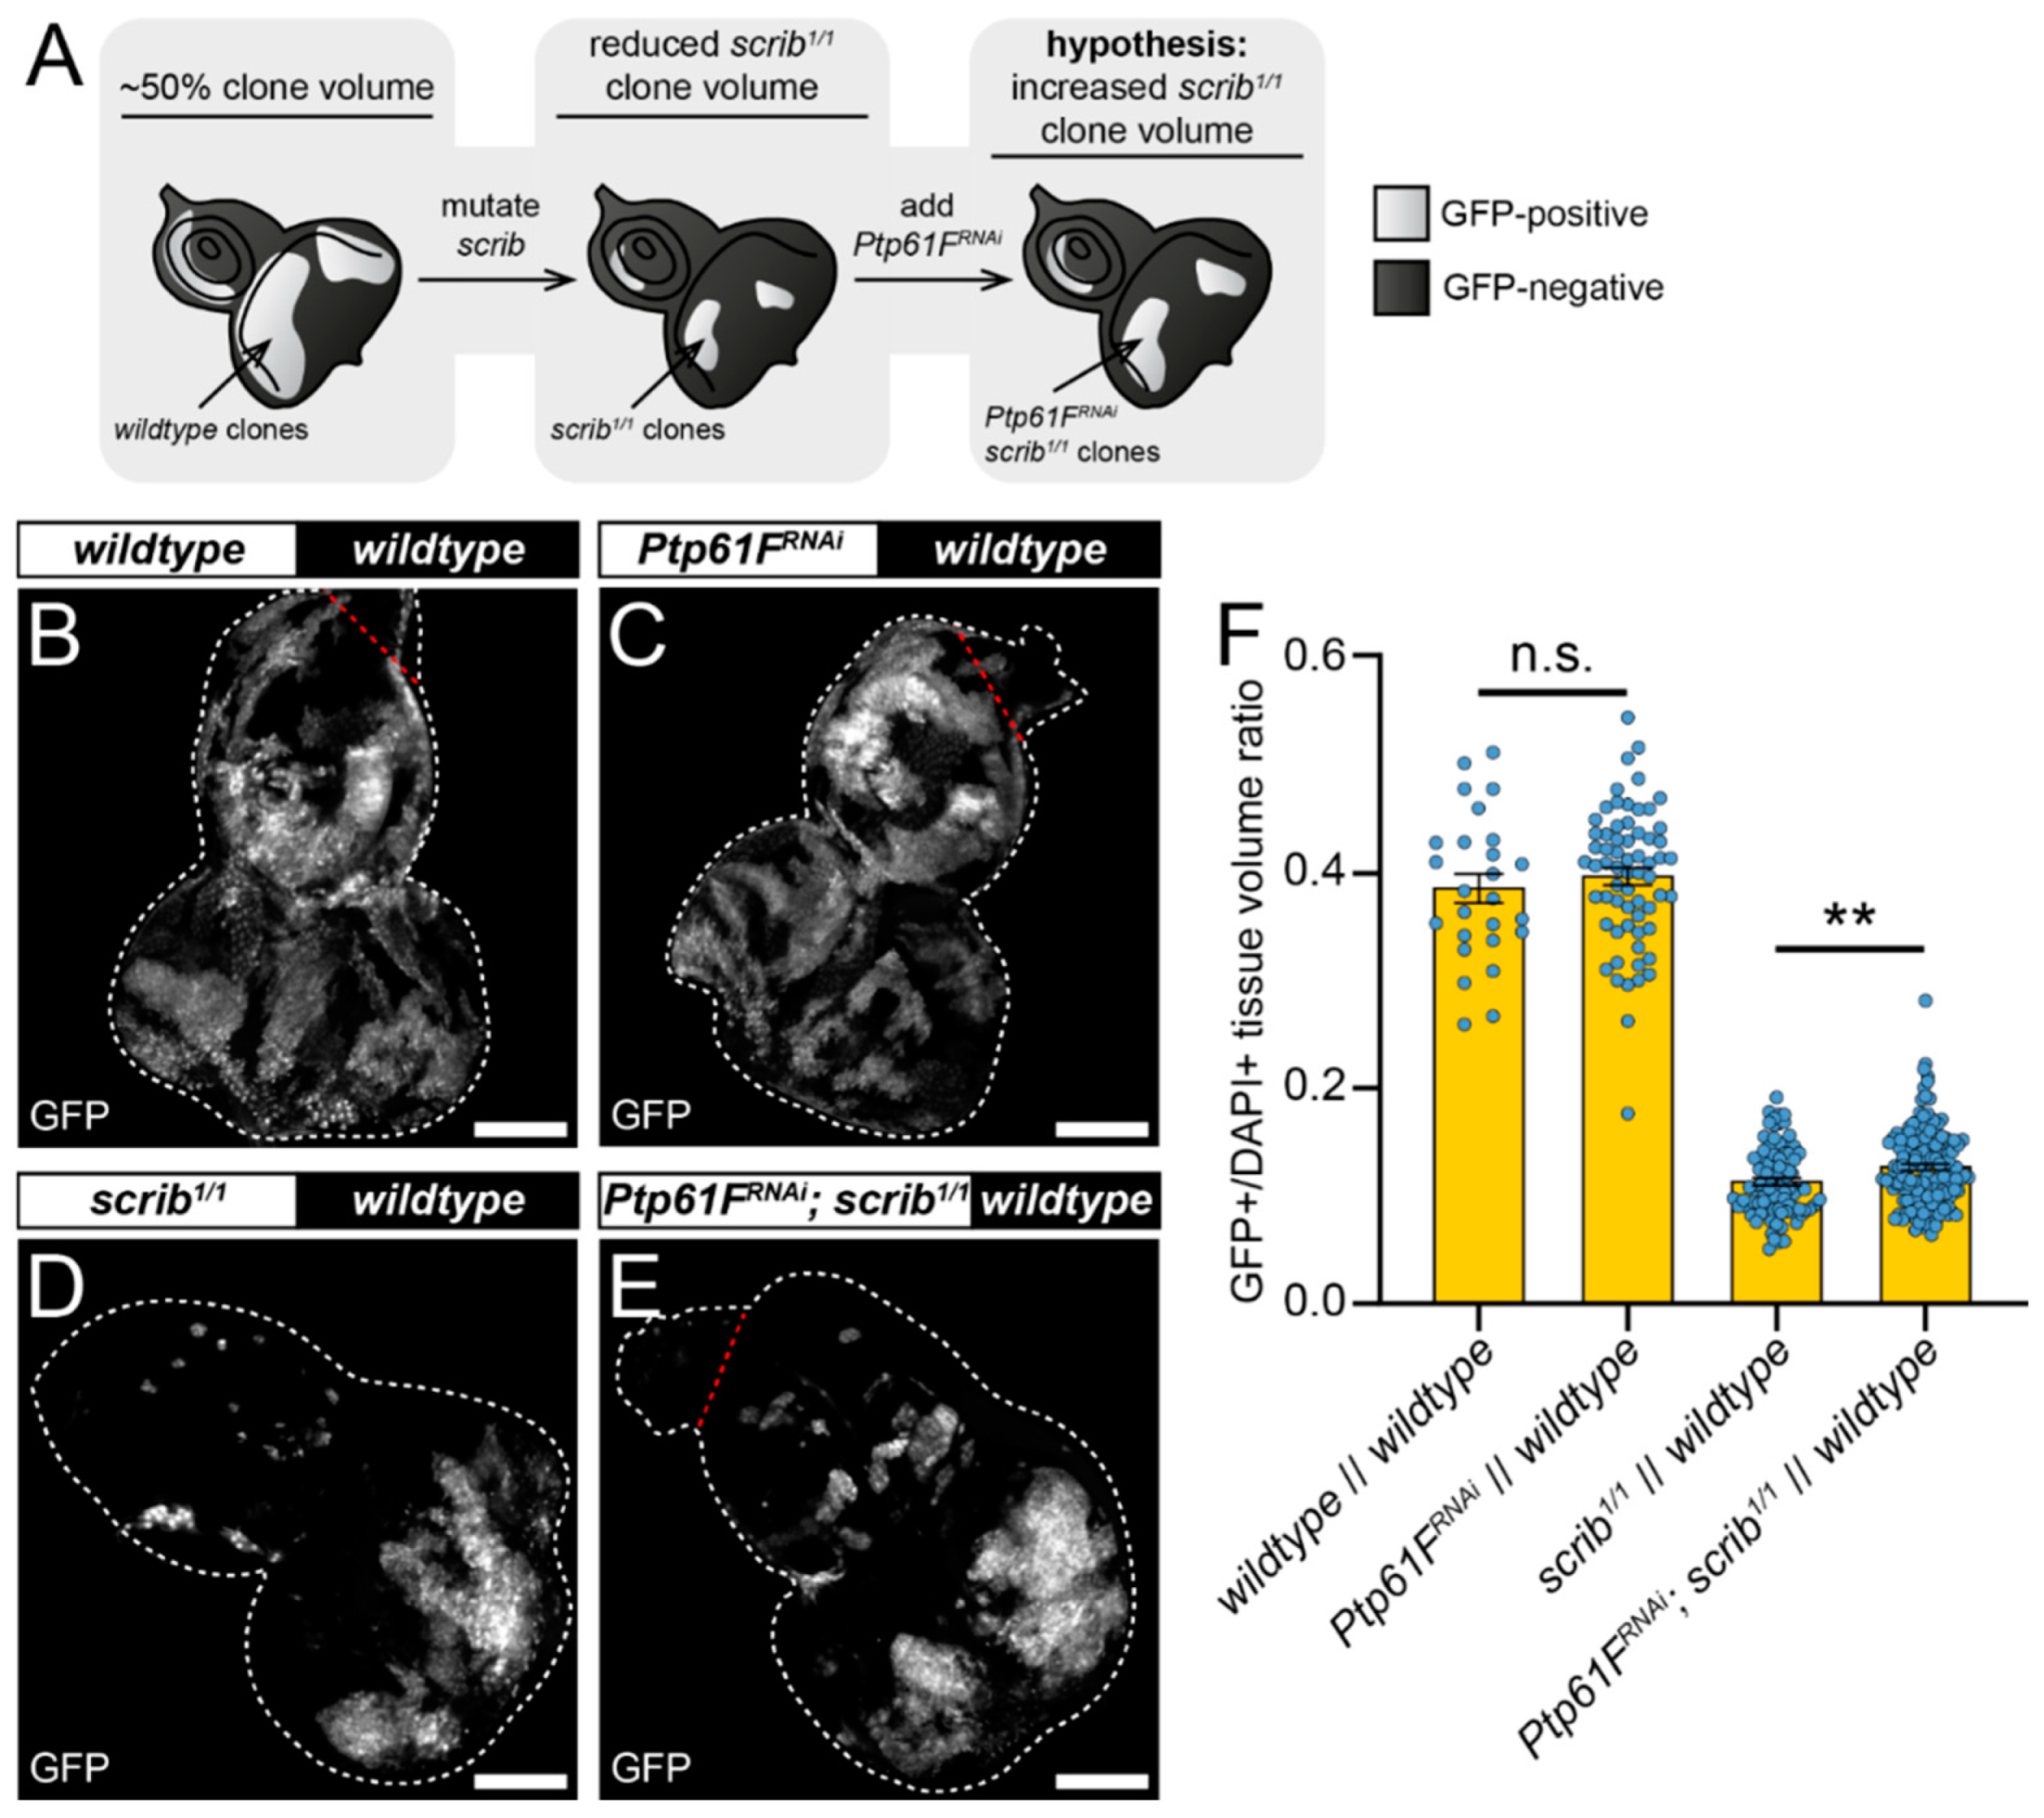
2.2. Ptp61F Regulates Polarity-Impaired Clone Survival/Growth during Cell Competition

One mode of cell competition in Drosophila occurs during the removal of polarity-impaired cells from larval epithelial tissues—scrib or dlg1 mutant cells are actively outcompeted and eliminated from epithelial tissue by several different cell competition mechanisms and signalling pathways (reviewed in [16]). Using the genetic tools available in Drosophila, patches of mutant cells can be generated clonally in tissues of interest to model cell competition. Our twin-clone analyses suggested that PTP61F has a role in suppressing the ability of cells to compete, reducing their relative fitness and facilitating their elimination, as knocking-out Ptp61F clonally allows cells to outcompete their neighbours (Figure 1). We next asked whether Ptp61F reduction in cells that are relatively less fit (e.g., scrib mutant cells) might abrogate their elimination phenotype (Figure 2A). To investigate this, we utilised the mosaic analysis with a repressible cell marker (MARCM) technique, allowing for transgenes of interest and cell markers to be expressed in cells mutated for a gene-of-interest [51]. Using L3 eye-antennal imaginal discs, we examined how Ptp61F knockdown affected the growth of clones with mutant scrib (scrib1) that have a loser cell fate. In control discs, where both GFP-marked clones and the remainder of the tissue were otherwise wild-type (except that a UAS-myr RFP transgene was present in RNAi-free control samples as a UAS balancing element, and UAS-Dcr-2 (a.k.a. Dicer) was also present in all samples), the induced clones make up ~40% of the tissue volume (Figure 2B,F). Expression of RNAi against Ptp61F (v37436) alone did not significantly alter this clonal tissue volume, with it remaining ~40% (Figure 2C,F) (RNAi efficacy demonstrated in Figure S1; Ptp61F mRNA levels reduced by ~60%). As expected, inducing clones homozygous for mutant scrib led to their contributing to a markedly smaller proportion of the total tissue volume: Around ~11% (Figure 2D,F). However, expression of RNAi against Ptp61F within those scrib1/1 clones led to a small but statistically significant increase in their total volume: to an average of ~13% of the total tissue (Figure 2E,F). These data suggest that Ptp61F has a role, albeit small, in suppressing the ability of polarity-impaired cells to “fight back” against the efforts of neighbouring wild-type cells to eliminate them.

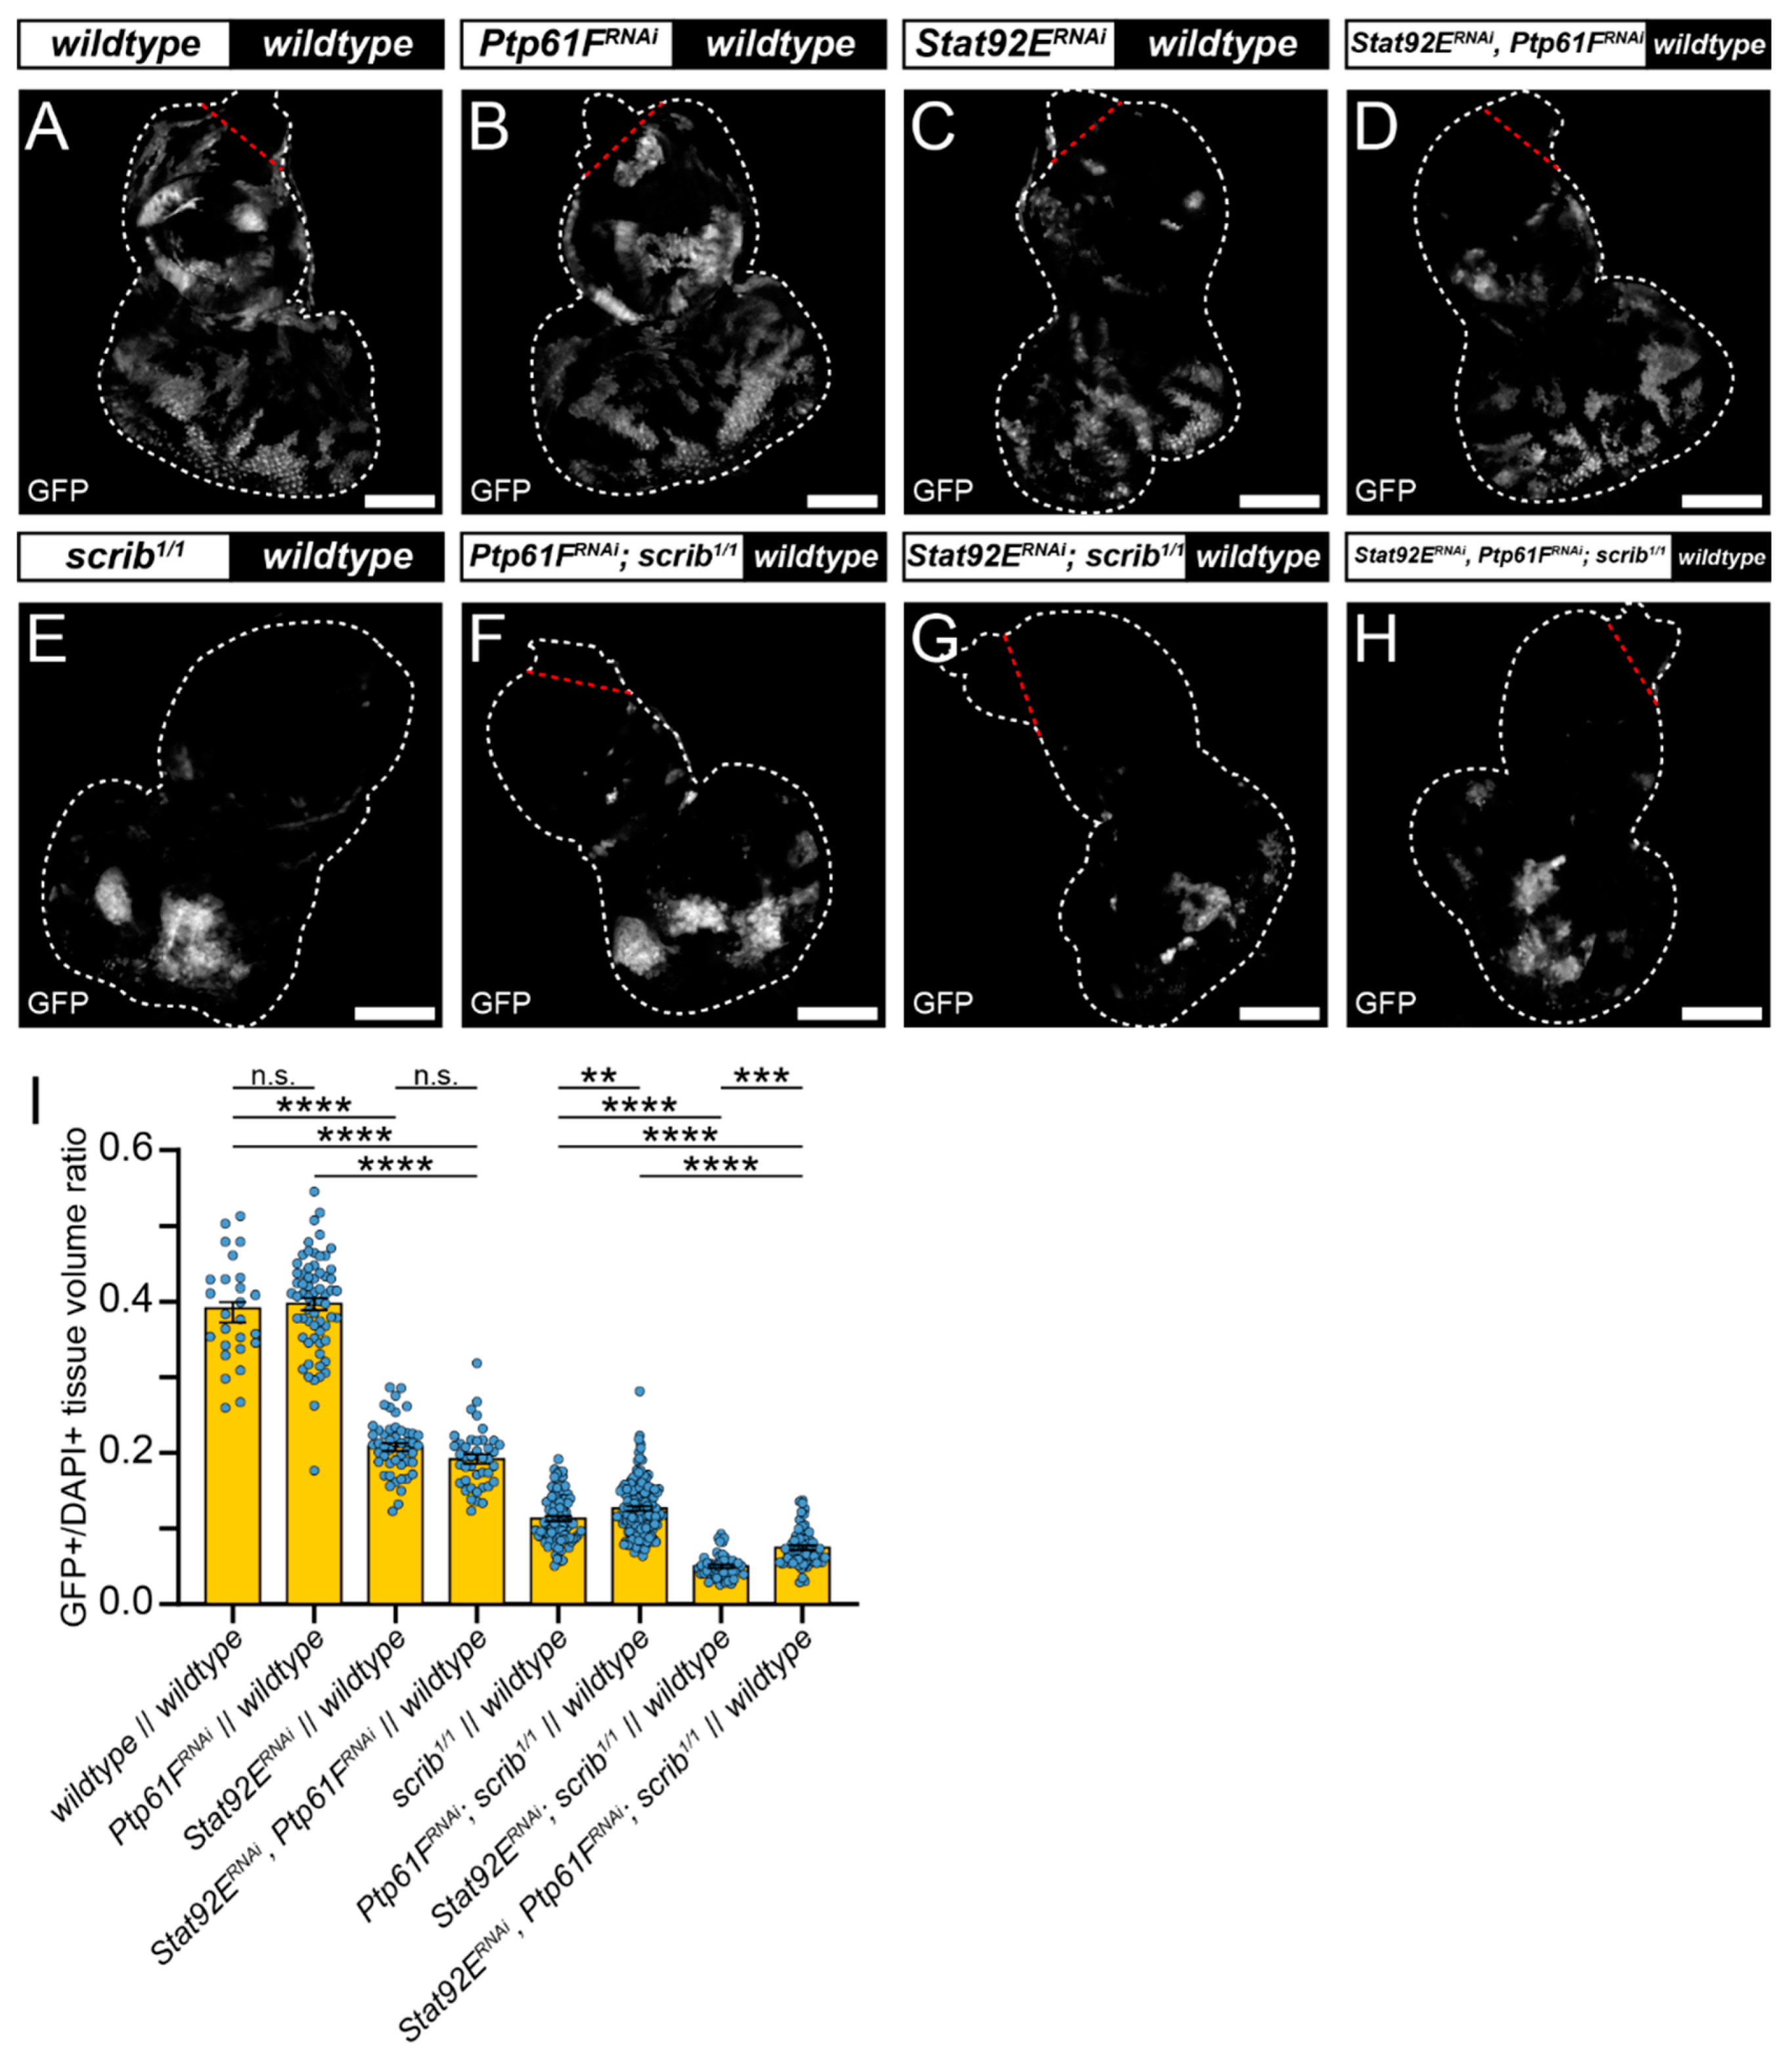
2.3. JAK–STAT Signalling Plays a Role in the Fitness of Scrib-Mutant Clones and Is Required Downstream of Ptp61F Knockdown for the Increased Survival of Scrib-Mutant Clones

Our data thus far have demonstrated a new role for PTP61F as contributing to polarity-impaired cell competition. Previous studies have shown that PTP61F can attenuate JAK–STAT signalling in Drosophila [24,25,26,27,52], but whether PTP61F regulates JAK–STAT signalling in the context of cell competition is unclear. Moreover, although JAK–STAT signalling is known to play a role in the wild-type winner cells during polarity-impaired cell competition [53], it is unclear whether JAK–STAT signalling has a role within the polarity-impaired loser cells. Therefore, using MARCM techniques, we investigated the requirement of JAK–STAT signalling in the competitiveness of polarity-impaired cells, and whether this occurs downstream of PTP61F.
We used RNAi against Stat92E (v43866) (RNAi efficacy demonstrated in Figure S1; Stat92E mRNA levels reduced by ~40%) to determine whether JAK–STAT signalling is necessary for scrib-mutant clone elimination. Eye-antennal discs expressing Stat92ERNAi had clones contributing to ~20% of the tissue volume, a significantly smaller fraction than the wild-type controls at ~40% (compare Figure 3A,C, quantified in Figure 3I), consistent with Stat92E influencing clonal fitness. Similarly, discs with Stat92ERNAi-expressing scrib1/1 clones contributed to ~5% of the tissue volume, a significantly smaller proportion than the scrib1/1 controls at ~11% (compare Figure 3E,G, quantified in Figure 3I). These data suggest that STAT92E functions within scrib-mutant clones during cell competition to oppose their elimination.
Next, we examined whether elevated JAK–STAT signalling was driving scrib-mutant clone growth suppression upon Ptp61F knockdown. To do so, we combined knockdown of Stat92E and Ptp61F in MARCM-generated clonal tissue. In otherwise wild-type clones, expression of both Stat92ERNAi and Ptp61FRNAi resulted in clones that contributed to ~20% of the tissue, a non-significant effect relative to the Stat92E knockdown alone (also ~20%; compare Figure 3C,D, quantified in Figure 3I). However, these clones were significantly smaller than the Ptp61FRNAi-only clones (tissue volume of ~40%; compare Figure 3B,D, quantified in Figure 3I). By contrast, in scrib-mutant clones (which contribute to 11% of the tissue), simultaneous Ptp61F and Stat92E knockdown led to clones contributing to ~7% of the tissue, a statistically significant decrease in clonal tissue volume compared to scrib-mutant Ptp61F knockdown-only clones at ~13% (compare Figure 3F,H, quantified in Figure 3I), revealing a requirement for Stat92E in the Ptp61F-knockdown-mediated rescue of scrib-mutant clone size. In comparison with scrib-mutant Stat92E knockdown-only clones, which make up only ~5% of the tissue, simultaneous Ptp61F and Stat92E knockdown in scrib-mutant clones resulted in a statistically significant increase to 7% in clonal tissue volume (compare Figure 3G,H, quantified in Figure 3I), showing that the presence of Ptp61F contributes to the competitive disadvantage of scrib-mutant Stat92E knockdown clones. Together, these data show that STAT92E levels influence the survival of scrib-mutant clones, and that the increased survival of scrib-mutant clones upon Ptp61F knockdown is dependent on Stat92E.

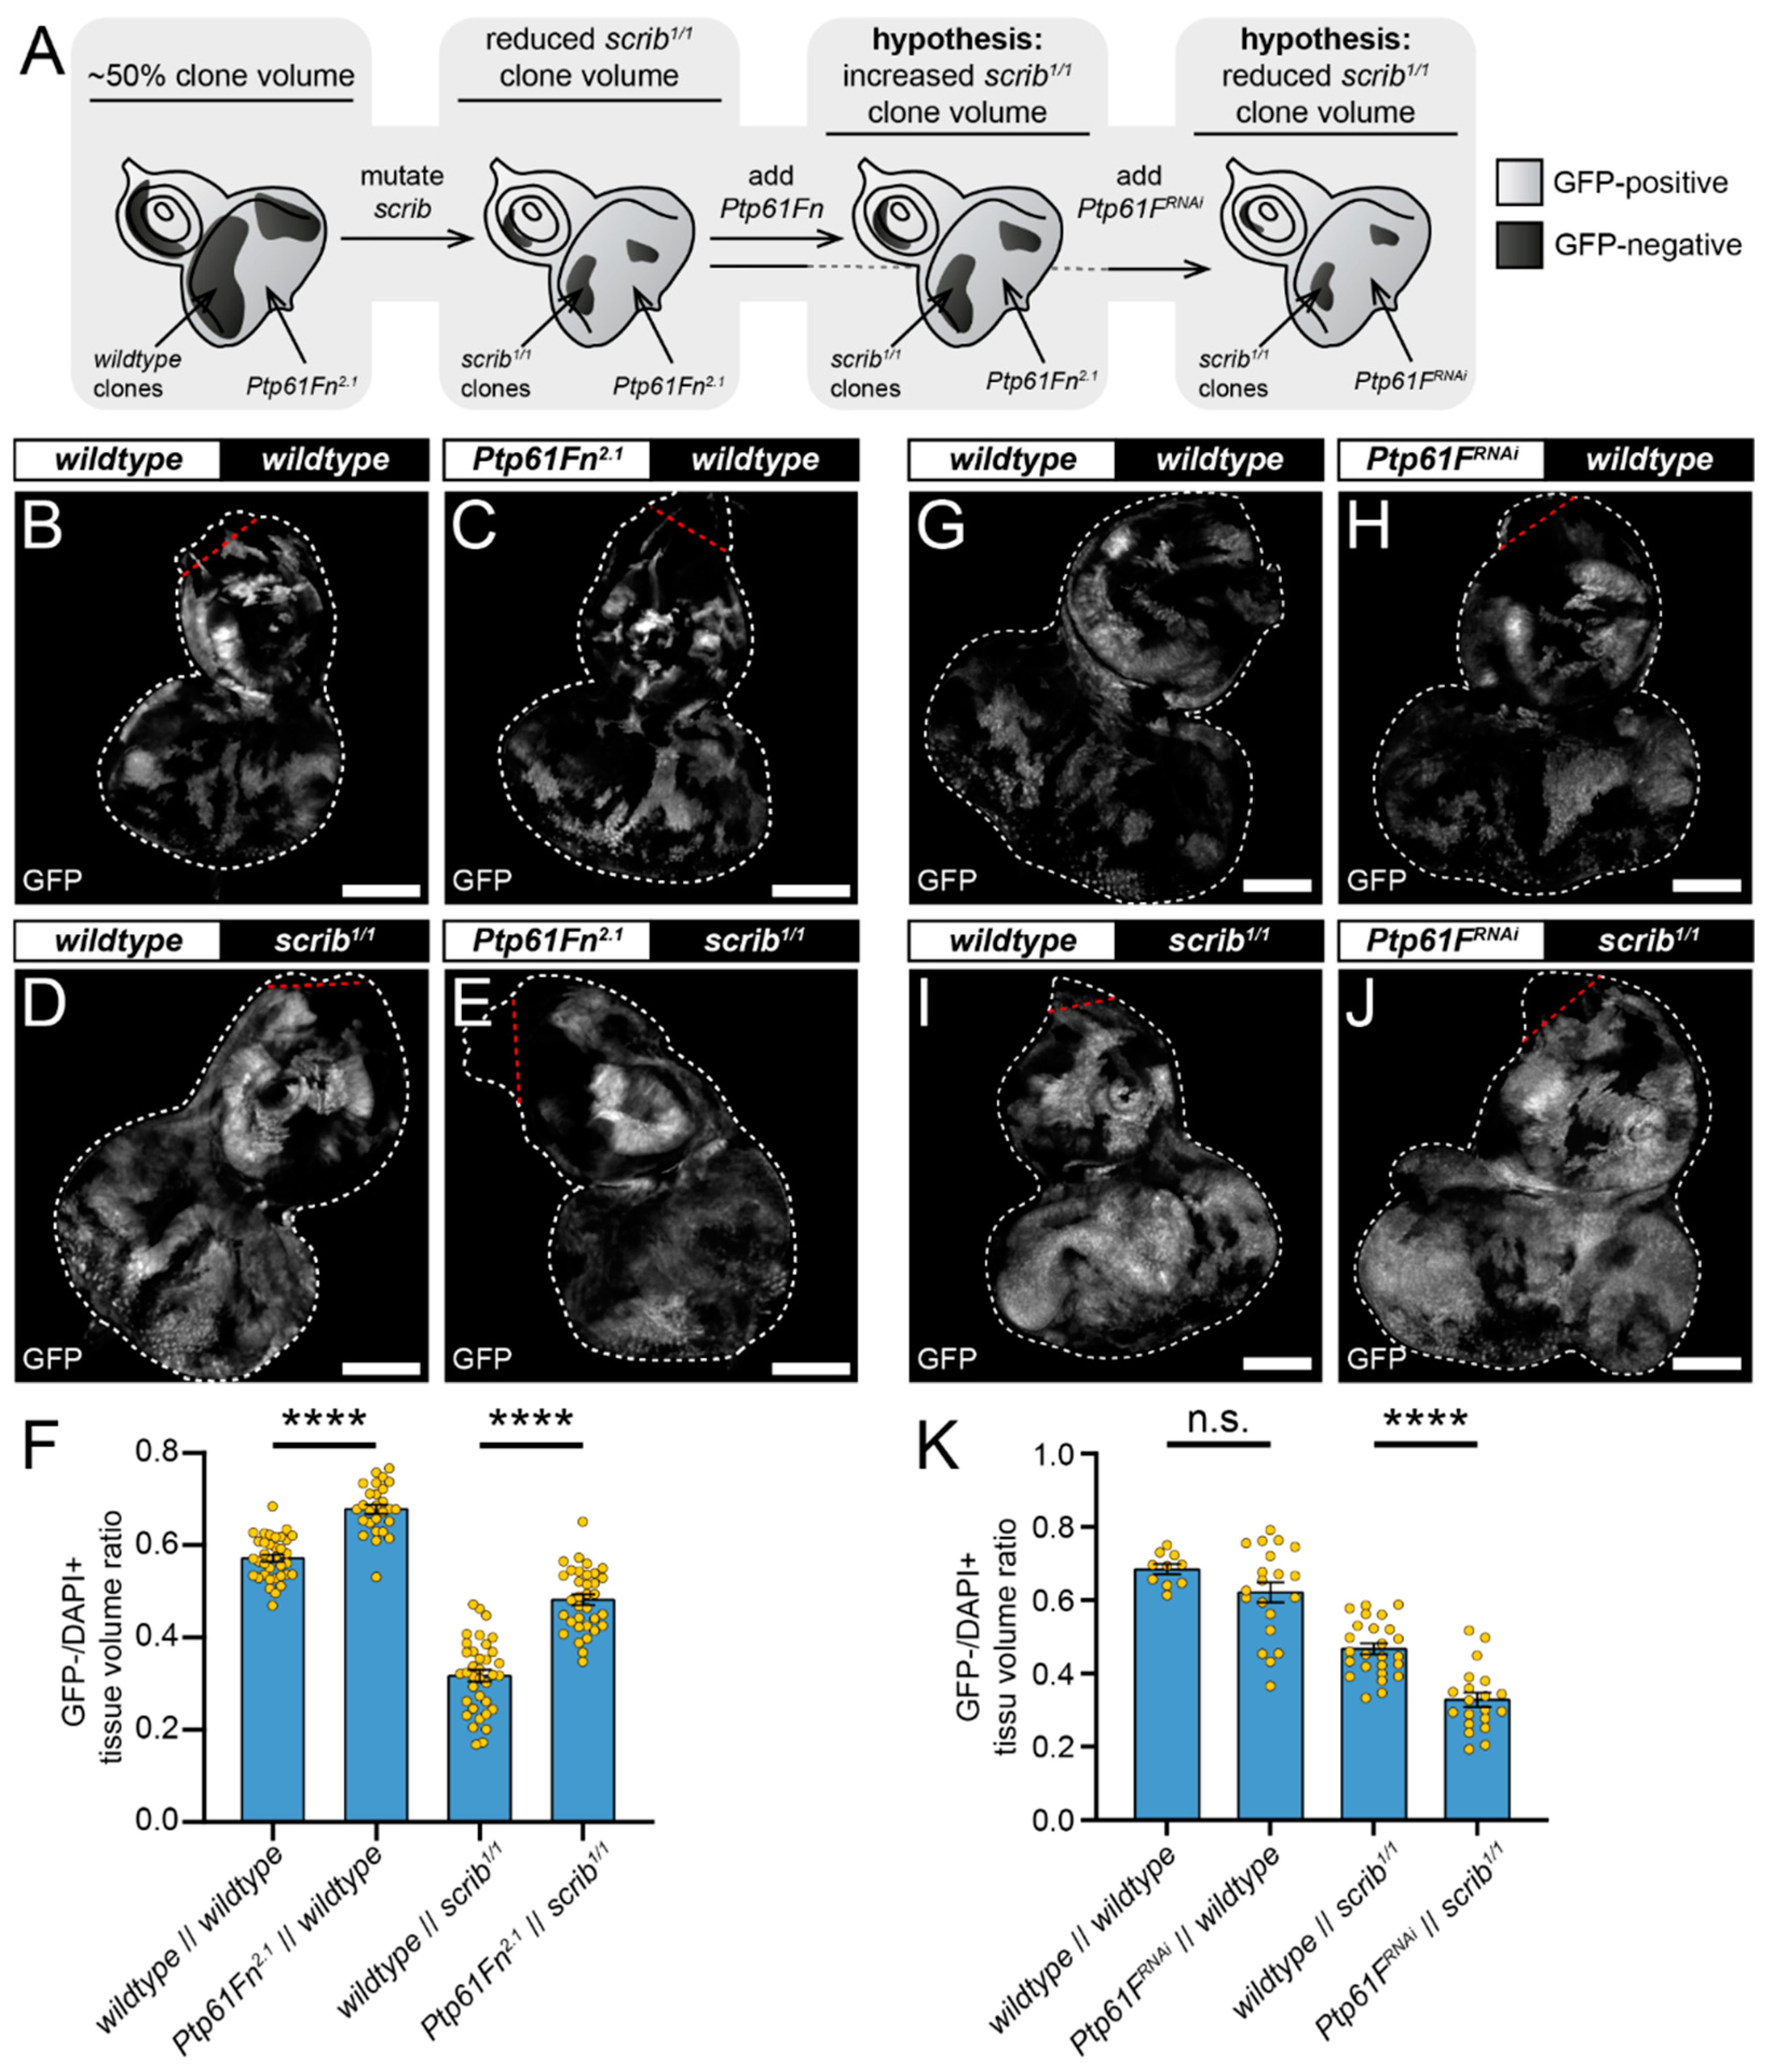
2.4. Ptp61F Regulates Wild-Type Clone-Mediated Elimination of Polarity-Impaired Clones during Cell Competition

Our results indicate that PTP61F is necessary within polarity-impaired cells to help promote their elimination. However, since JAK–STAT signalling in the wild-type “winner” cells neighbouring scrib mutant cells has been shown to be important for scrib mutant cell elimination [53], it was possible that PTP61F activity might also be involved in the competitive function of “winner” cells. To investigate the role of PTP61F in cells neighbouring polarity-impaired cells during competition, we utilised the reverse mosaic analysis with a repressible cell marker (revMARCM), which allows the generation of GFP-negative clones mutant for a gene-of-interest within a tissue expressing GFP together with other transgenes [51]. Using L3 eye-antennal imaginal discs, we used revMARCM to examine the effect of overexpression of a Ptp61F isoform on the growth of neighbouring clones that were homozygous mutant for the scrib allele, scrib1 (Figure 4A). Control discs, where GFP-negative clones and the rest of the tissue was functionally wild-type, contained GFP-negative clones with an average volume of ~60% of the tissue (Figure 4B,F). By contrast, when GFP-negative clones formed in a background of tissue that was overexpressing the nuclear-localised form of Ptp61F (hereafter referred to as Ptp61Fn, expressed using the 2nd chromosome line Ptp61Fn2.1, the B isoform of PTP61F proteins, which is more potent than the A isoform) [24], the GFP-negative clones contributed to ~70% of the tissue, a statistically significant increase (Figure 4C,F). This suggested that PTP61Fn activity within clones reduces their fitness relative to their wild-type clone neighbours.
We next examined the effect of Ptp61Fn expression (GFP positive) on the clonal growth of neighbouring homozygous scrib mutant (scrib1) clones (GFP negative). As expected, when surrounded by wild-type tissue the GFP-negative scrib-mutant clones were reduced in volume and made up, on average, ~30% of the total volume (Figure 4D,F). Ptp61Fn expression (GFP positive) in the cells neighbouring the scrib-mutant clones led to a statistically significant increase in the scrib-mutant clone volume (GFP negative), to an average of ~50% of the total (Figure 4E,F). This further supports our assertion that PTP61Fn negatively impacts the ability of a cell to compete with their neighbours and, by extension, negatively affects the ability of otherwise wild-type cells to outcompete and eliminate scrib-mutant cells.
Using revMARCM techniques, we then also examined the effect of Ptp61F knockdown in the wild-type cells (GFP positive) surrounding scrib-mutant cells (GFP negative) (Figure 4A). In this instance, wild-type control tissues had a GFP-negative to total tissue volume ratio of ~70% (Figure 4G,K), while expression of Ptp61FRNAi in the GFP+ tissue led to a small, non-significant reduction in GFP-negative clone (wild-type) volume to ~60% (Figure 4H,K). Meanwhile, knockout of scrib (GFP negative) resulted here in GFP-negative clones contributing to ~45% of the total tissue (Figure 4I,K), but the introduction of Ptp61FRNAi expression in neighbouring cells (GFP positive) led to a significant reduction in that ratio to ~30% (Figure 4J,K). These data are consistent with our revMARCM results with PTP61Fn overexpression, and together show that PTP61F levels within winner cells strongly influence cell competition of polarity-impaired cells, more so than the modest effect when knocked down within the scrib mutant cells (15% compared with 2%). Most likely, PTP61F’s non-cell-autonomous effect is achieved by regulating JAK–STAT signalling activity in the wild-type cells, which is known to be necessary in winner cells for the elimination of adjacent scrib-mutant cells, and functions in a manner independent of cell proliferation [53].

2.5. Ptp61F Suppresses Activated Ras85D-Driven Polarity-Impaired Epithelial Tumorigenesis

To investigate whether Ptp61F in also involved in tumor progression, we utilised an activated RAS85D-driven polarity-impaired model of tumorigenesis [54]. In this model, controlled expression of a constitutively active form of RAS85D, known as RAS85DV12 (a.k.a. RASV12 or RASACT), was combined with RNAi-mediated knockdown of the cell polarity regulator dlg1 (a component of the Scribble cell polarity module) in the entire eye-antennal epithelium using eyFLP; Actin >> GAL4 (EAG, and EAGRD when including Ras85DV12 and dlg1RNAi). This leads to neoplastic tumor formation in the eye-antennal epithelium and organismal death as oversized (“giant”) larvae or pupae. Using this model, we examined the effect of RNAi-mediated knockdown of Ptp61F or overexpression of nuclear-localising Ptp61Fn on tumor growth (Figure 5A–D’) and Drosophila development (Figure 5E–H). Dissection of L3 eye-antennal imaginal disc-brain complexes revealed that, as previously described [54], the eye-antennal tissue of EAGRD > GFP larvae exhibited neoplastic overgrowth compared to the EAG > GFP control (Figure 5A,B) and led to developmental delay/arrest, primarily at the early pupal stage (Figure 5E,G). Expression of RNAi targeting Ptp61F in EAGRD>GFP larvae resulted in increased tumor size (Figure 5C,C’) and a developmental delay/arrest, with the majority of animals observed being arrested at a “giant” larval stage (Figure 5E,F). In contrast, Ptp61Fn expression substantially suppressed tumor growth (Figure 5D,D’) and alleviated the developmental delay/arrest, as the majority of individuals reached the late pupal stage (Figure 5E,H). Notably, control animals expressing Ptp61FRNAi or Ptp61Fn via the EAG system did not appear to suffer any developmental issues and produced adults at expected frequencies (Figure 5E). Therefore, these results suggest that PTP61F suppresses activated RAS85D-driven polarity-impaired epithelial tumorigenesis in Drosophila.

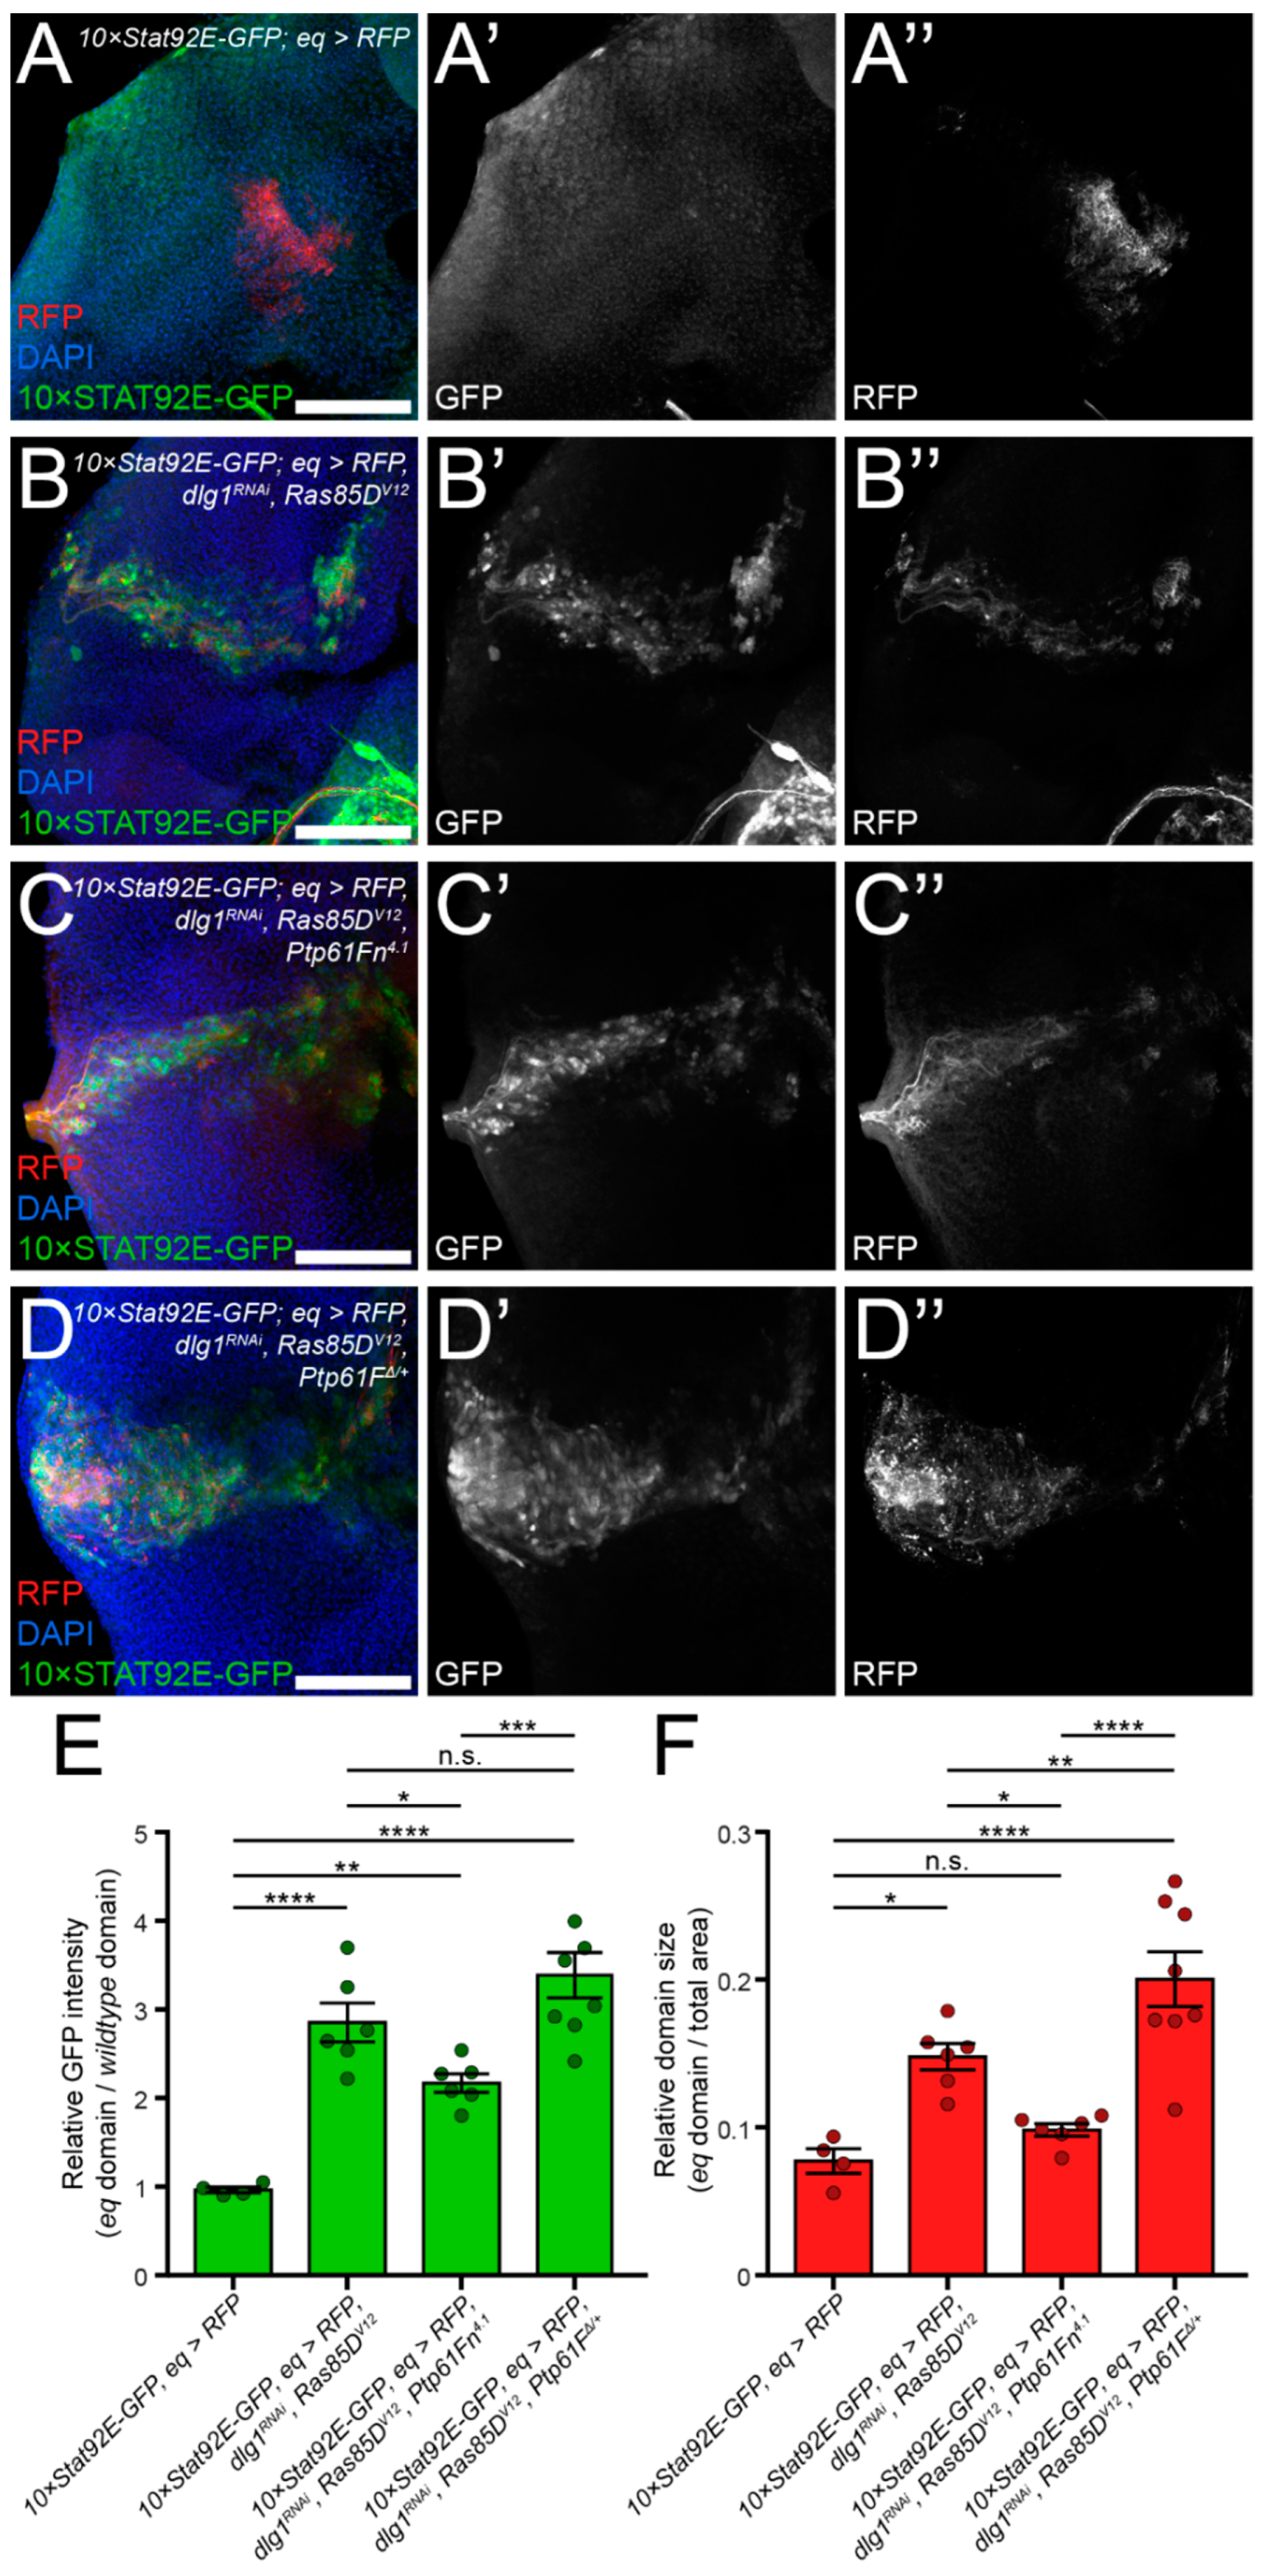
2.6. Drosophila Ptp61F Represses pTyr, RAS–MAPK, and JAK–STAT Signalling in Activated Ras85D-Driven Polarity-Impaired Tumors

To investigate the signalling pathways regulated by PTP61F in its suppression of activated Ras85D-driven polarity-impaired epithelial tumorigenesis, we first examined the effects of Ptp61F overexpression or knockdown on the activation of tyrosine phosphorylation-dependent signalling pathways. To this end we immunoblotted EAGRD tumor lysates (using dissected L3 eye-antennal imaginal discs) with an antibody that detects tyrosine phosphorylated proteins (pTyr). Consistent with the established role of PTP61F as a tyrosine phosphatase, the expression of Ptp61Fn resulted in markedly decreased tyrosine phosphorylation, relative to the control, whereas Ptp61F knockdown (via Ptp61FRNAi) increased the overall tyrosine phosphorylation observed (Figure 6A,B).
We then assessed whether RAS–mitogen-activated protein kinase (MAPK) signalling, a PTK-activated pathway (reviewed in [55,56]), might also be affected by PTP61F overexpression or knockdown in RAS-driven polarity-impaired tumors. Using an antibody specific for the phosphorylated and activated form of the mammalian MAPK ERK1/2 (pERK), we observed that eye-antennal tissue from EAGRD larvae had substantially upregulated pERK (relative to total ERK) when compared to the EAG control (Figure 6C,D, compare lanes 3 and 6). Consistent with our previous findings [27], we found that the overexpression of PTP61Fn decreased pERK (by ~75%, Figure 6C,D, compare lanes 1 and 3), while Ptp61F knockdown increased pERK (by ~25%, Figure 6C,D, compare lanes 2 and 3). These data suggest that PTP61F attenuates RAS–MAPK signalling in Ras85DV12-driven polarity-impaired tumors.
Since PTP61F has been shown to negatively regulate JAK–STAT signalling in Drosophila tissues [24,25,26], and polarity-impaired tissues upregulate JAK–STAT signalling [15,57,58], we then asked whether STAT92E expression and signalling was repressed by PTP61F in activated Ras85DV12-driven polarity-impaired eye-antennal epithelial tissue. To monitor JAK–STAT signalling we used the Stat92E-binding site lacZ reporter (Stat92E-lacZ) [59] and analysed EAGRD tumorous eye-antennal epithelial tissue for β-galactosidase (β-gal) expression via Western blotting (Figure 6C,D). Using this system, we found that in EAGRD and EAG eye-antennal tissue, the expression of Ptp61Fn2.1 substantially repressed β-gal levels (to ~50%, Figure 6C,D, compare lanes 1 and 3). However, we found that the Ptp61FRNAi-mediated knockdown of PTP61F was not sufficient to increase β-gal expression (Figure 6C,D, compare lanes 2 and 3). Taken together with our data on the effect of PTP61F on pERK levels in these tumorous tissues, these data show that PTP61F inhibits both JAK–STAT and RAS–MAPK signalling to attenuate EAGRD-driven tumorigenesis.
To further assess the effects of PTP61F on JAK–STAT signalling in situ, we used the equatorial-GAL4 (eq-GAL4) system to express Ras85DV12 and dlg1RNAi in a patch of cells in the centre of the developing eye epithelium (marked with UAS-RFP), coupled with an endogenous reporter of JAK–STAT signalling, 10×Stat92E-GFP [60]. As expected, Ras85DV12 and dlg1RNAi expression robustly increased (by ~3-fold) Stat92E-GFP expression in the eq domain, as well as expanded the relative domain size indicating that tissue growth was stimulated (compare Figure 7B,B’,B’’ and Figure 7A,A’,A’’, quantified in Figure 7E,F). Strikingly, expression of Ptp61Fn4.1 (3rd chromosome line) in Ras85DV12- and dlg1RNAi-expressing tissue significantly decreased (by ~25%) Stat92E-GFP expression in, and reduced the relative area of, the eq domain indicating that tissue growth was inhibited (compare Figure 7C,C’,C’’ and Figure 7B,B’,B’’, quantified in Figure 7E,F). To reduce the level of PTP61F, rather than with RNAi, we used the Ptp61FΔ null allele [24]. Flies heterozygous for Ptp61FΔ (therefore expecting a reduction in PTP61F levels of 50% in the mutant tissue as well as wild-type tissue) and expressing both Ras85DV12 and dlg1RNAi in the eq domain resulted in a non-significant increase in Stat92E-GFP levels, although the relative eq domain size was significantly increased (compare Figure 7D,D’,D’’ and Figure 7B,B’,B’’, quantified in Figure 7E,F), indicating that tissue growth of the tumorous tissue was increased relative to the wild-type tissue. Consistent with the Western blot analyses (Figure 6C,D), these data demonstrate that increased Ptp61F expression represses JAK–STAT signalling and tissue growth in activated Ras85D-driven polarity-impaired epithelial tumors.

3. Discussion

3.1. Summary of the Result of This Study

In this study, we have examined a role for PTP61F, the Drosophila orthologue of the mammalian PTPs PTP1B and TCPTP, in pre-tumorigenic and tumorigenic tissue models. We observed that the loss of Ptp61F allows otherwise wild-type clones to outcompete their wild-type neighbours, and Ptp61F knockdown allows polarity-impaired “loser” cell clones to overcome some of their relative fitness disadvantage. We then demonstrated that the competitive advantage conferred on polarity-impaired mutant clones by Ptp61F knockdown is dependent on Stat92E. Furthermore, PTP61F can also function non-cell autonomously; overexpression of Ptp61F in “winner” cells increases the survival of the neighbouring polarity-impaired clones, whereas Ptp61F knockdown in the wild-type “winner” cells decreases the survival of polarity-impaired cells. This non-cell-autonomous function of PTP61F has a considerably stronger effect upon polarity-impaired clonal survival than its cell-autonomous function within the polarity-impaired cells. We also show that in larvae possessing Ras85DV12/dlg1RNAi-driven tumors, Ptp61F knockdown promoted tumor growth and suppressed organism development, while PTP61F overexpression suppressed tumor growth and partially rescued the defective development of the tumorous animals. We demonstrated that, in Ras85DV12/dlg1RNAi-driven tumorigenic tissues, Ptp61F knockdown increased levels of tyrosine phosphorylated proteins and RAS–MAPK signalling, while Ptp61F overexpression attenuated tyrosine phosphorylation, and RAS–MAPK and JAK–STAT signalling. Altogether our results suggest that Ptp61F acts as a tumor suppressor, limiting the competitive ability of cells, and downregulating the cell survival and proliferation otherwise driven by the RAS–MAPK and JAK–STAT signalling pathways.

3.2. PTP61F in Signalling Pathway Regulation during Cell Competition

We have shown, along with previous studies [24,25,26,27,28], that PTP61F is capable of downregulating the JAK–STAT and RAS–MAPK signalling pathways. Although well established as evolutionarily conserved regulators of cell proliferation and tissue growth, JAK–STAT and RAS–MAPK signalling are also involved in polarity-impairment-induced cell competition (reviewed in [16]). During both cell competition and cooperative tumorigenesis (of the kind examined in this study), both JAK–STAT and RAS–MAPK signalling pathways function to promote cell proliferation and tissue growth of the “winner” cells or tumorous cells. Additionally, during polarity-impairment-induced cell competition, JAK–STAT signalling has been shown to function in the “winner” cells adjacent to the polarity-deficient “loser” cells for the elimination of the polarity mutant cells [53]. Indeed, in isolation, STAT92E is capable of promoting a “winner” phenotype in cells if activated, and a “loser” fate if suppressed [61]. Current models suggest that polarity-impaired cells are eliminated through an intercellular feedback loop of cooperating JAK–STAT and JNK signalling pathways; JNK signalling is inherently upregulated in polarity-impaired cells, due to RHO1-WND (JNKKK) and EGR (TNF)-GRND (TNFR) signalling [10,11,14,62,63,64], which together with Yorkie (YKI, a co-transcriptional activator that is inhibited by the Hippo negative tissue growth control pathway) induces transcription and secretion of the Unpaired (UPD) family of ligands (Figure 8) [57,58]. These ligands activate the JAK–STAT signalling pathway in neighbouring wild-type cells via the receptor Domeless (DOME), and the pathway then upregulates compensatory proliferation, to replace the soon-to-be eliminated polarity-impaired cells, as well as promoting JNK signalling within the polarity-impaired cell via an unknown “competition signal” (Figure 8) [53]. Apart from the obvious questions regarding the nature of this “competition signal”, this model lacks an explanation for how JAK–STAT signalling is suppressed in the polarity-impaired cells. It is well established that UPD family ligands can signal in both a paracrine manner (such as during polarity-impairment-induced cell competition, promoting “winner” cell compensatory proliferation [53,58]) and an autocrine manner (such as during cooperative tumorigenesis driven by activated RAS and polarity-impairment, promoting tumor cell survival and proliferation leading to tumor overgrowth [58,65]). Therefore, based on our findings, and those of other groups regarding the requirement for JAK–STAT signalling in cell competition [15,53,58,61], we envisage that JAK–STAT regulators control the relative levels of JAK–STAT signalling in the wild-type winner cells versus the polarity-impaired loser cells. During cell competition, low levels/activity of PTP61F in the winner cells may facilitate elevated JAK–STAT signalling in these cells, while high levels/activity of PTP61F in the polarity-impaired cells may contribute to the downregulation of JAK–STAT signalling within these mutant cells (Figure 8). However, since the observed effect of PTP61F knockdown in the polarity-impaired cells was only small, whilst knockdown of STAT92E had a more robust effect on reducing scrib mutant clonal size, it is likely that other JAK–STAT regulators are also involved. Interestingly, we have also found a role for other established JAK–STAT pathway regulators acting in cooperation with Ptp61F during cell competition; namely Socs44A and Socs36E, which are thought to mediate the lysosomal degradation of Domeless, the Drosophila JAK–STAT pathway receptor and thereby downregulate pathway signalling (reviewed in [66,67]). We observed that both Socs44A and Socs36E knockdown, similar to Ptp61F knockdown, had a suppressive effect on the elimination of scrib-mutant clones, though it was a slightly larger difference (Socs44A/Socs36E knockdown clones resulting in a ~5% increase in tissue volume relative to only ~2% for Ptp61F knockdown clones) (Figure S2). Thus, multiple negative regulators of JAK–STAT signalling may act together to suppress JAK–STAT activity in loser cells during polarity-impaired cell competition (Figure 8). It is unclear, however, how these JAK–STAT regulatory genes might themselves be regulated in imaginal disc tissues and during cell competition. It has been demonstrated that Ptp61F expression can be repressed by JAK–STAT signalling in the developing testis [68], but, conversely, upregulated by JAK–STAT signalling in the embryo [52]. Socs36E is also thought to be upregulated by JAK–STAT signalling during embryogenesis and oogenesis [69], contributing to a negative feedback loop [70,71], but Socs44A expression is not regulated by JAK–STAT signalling [69]. How PTP61F (as well as the SOCS proteins) is regulated in Drosophila imaginal disc development and in tissues undergoing cell competition will be important to determine. Transcriptional and post-transcriptional regulation of PTPN1 in mammalian tissues is, by contrast, relatively well understood (reviewed in [72]), and might provide a starting point for these investigations.
PTP61F is a known regulator of the phosphorylation-dependent RAS–MAPK signalling pathway [27,28], and we have demonstrated here a role for PTP61F in regulating RAS–MAPK signalling in an activated RAS-driven polarity-impaired cooperative tumorigenesis model. RAS–MAPK signalling has not been comprehensively explored in polarity-impairment-induced cell competition, but has recently been shown to be regulated by cell–cell interactions involving protein tyrosine phosphatase 10D (PTP10D) and Stranded at second (SAS) [73]. This is a recently identified cell competition regulatory mechanism that relies on physical interactions between SAS, located on the “winner” cells, and PTP10D, located on the “loser” cells [73]. PTP10D is a receptor-like or transmembrane PTP that is also capable of downregulating RAS–MAPK signalling [73]. In polarity-impaired “loser” cells deficient for this PTP10D–SAS interaction, it is believed the Epidermal Growth Factor Receptor (EGFR) is activated and promotes excess cell proliferation, due to RAS–MAPK pathway cooperation with co-opted JNK signalling [73]. Notably, other than PTP61F, PTP10D is the only PTP demonstrated to have a role during polarity-impairment-induced cell competition. Given the established role for each of these PTPs in downregulating RAS–MAPK signalling, is plausible that PTP61F might also contribute to the suppression of this pathway in polarity-impaired “loser” cells. It is not known whether the PTP10D–SAS system has any regulatory effect upon JAK–STAT signalling, but it is clear it has an overall greater effect upon relative fitness of the polarity-impaired cells than PTP61F does. However, since we have shown that STAT92E knockdown in scrib mutant clones has a strong effect on their size, it is likely that JAK–STAT activity in the polarity-impaired clones influences their survival. Although PTP61F may play only a small part in the regulation of JAK–STAT activity in polarity-impaired cells, this is likely due to redundant JAK–STAT inhibitory mechanisms, such as those involving other PTPs and the SOCS family members, SOCS44A and SOCS36E, as we have shown (Figure S2). It is also possible that additional cell competition regulatory mechanisms also contribute to polarity-impaired cell elimination, such as the “Flower code” [74,75], and the Toll signalling pathway [76]. Importantly, our results revealed a robust effect of Ptp61F up- or downregulation in the wild-type cells surrounding scrib mutant cells, consistent with the reported non-cell-autonomous role played by JAK–STAT signalling in polarity-impaired mutant cell elimination [53], and suggesting that the control of PTP61F expression levels in the surrounding wild-type cells, and thereby JAK–STAT signalling in these cells, may be an important regulatory mechanism in polarity-impaired cell competition. Moving forward, understanding how the various cell competition regulatory systems (e.g., SAS-PTP10D, “Flower code”, Toll signalling) control PTP61F (as well as SOCS44A and SOCS36E) expression, and JAK–STAT signalling during cell competition will be important to determine.

3.3. Human Orthologs of PTP61F in Tumorigenesis

We have demonstrated Ptp61F acts as a tumor suppressor within the context of Ras85DV12/dlg1RNAi-driven cooperative tumorigenesis, a robust Drosophila model of cancer development (reviewed in [4]). As mentioned, both mammalian orthologues of PTP61F, PTP1B and TCPTP (encoded by PTPN1 and PTPN2, respectively), have roles in multiple cancers, though not necessarily as tumor suppressors (reviewed in [48,72]). Although PTP1B can act as a tumor suppressor, and its deletion in mice promotes increased development of acute leukemia with age [77], PTP1B predominantly functions as an oncoprotein, and its inhibition or deletion can attenuate oncogene-induced tumorigenesis. Indeed, PTP1B has been shown to function as an oncoprotein in breast [39,40], prostate [78,79], gastric [80], and colon [37] cancers, as well as squamous cell carcinoma [81]. In many cases, including breast cancers, PTP1B levels are increased and this correlates with advancement of the disease and worsened prognoses [39,40]. In mice, the deletion or inhibition of PTP1B attenuates the development of mammary tumors driven by mutant ErbB2 (HER-2) as well as their metastases, indicating that PTP1B plays an oncogenic role in the initiation of tumorigenesis [39,40,82]. The precise mechanisms by which increased PTP1B promotes tumorigenesis in ErbB2-driven breast cancers remain unknown, but this may be reliant on the promotion of RAS–MAPK signalling. Interestingly, PTP1B can serve as a positive regulator of RAS signalling by dephosphorylating and inactivating the RAS signalling suppressor docking protein 1 (DOK1, Drosophila orthologue Dok) [40,83,84].
By contrast, TCPTP is better understood as a tumor suppressor than an oncoprotein. Interestingly, TCPTP can exist as two variants derived from alternate mRNA splicing: A 48 kDa variant (TC48) that (like PTP1B) is targeted to the endoplasmic reticulum, and a 45 kDa variant (TC45) that shuttles between the nuclear and cytoplasmic environments [41,42,43,44]. As such, TCPTP has the capacity to attenuate tyrosine phosphorylation-dependent signalling in both the cytoplasm and nucleus. TCPTP shares multiple potentially oncogenic targets with PTP61F, including the EGFR-family member ErbB1 (also related to Drosophila EGFR), platelet-derived growth factor receptors (PDGFRs; related to Drosophila PVR signalling), insulin receptor (IR; related to Drosophila INR signalling), and multiple members of the JAK–STAT signalling pathway (JAK1/3 and STAT1/3/5/6, related to Drosophila Hopscotch (HOP) and STAT92E) (reviewed in [44,48]). TCPTP deficiency is thought to contribute to the progression of solid tumors and haemotological malignancies, including T cell acute lymphoblastic leukemia (T-ALL) [45,46], and some breast cancers [47]. The tumor-suppressive role of TCPTP in T-ALLs is attributed to its capacity to attenuate oncogenic protein tyrosine kinase signalling, including that mediated by JAK1 [46], and the aberrant fusion protein NUP214-ABL1 [45]. In mice, the conditional deletion of Ptpn2 can also contribute to the development of skin cancers [85], as well as hepatocellular carcinomas [86,87], due to the promotion of STAT3 signalling. There is also evidence that deficiencies in TCPTP might contribute to tumorigenesis by promoting genome instability due to cell cycle checkpoint skipping [88,89]. Our findings with regard to PTP61F are consistent with the tumor-suppressive roles of TCPTP. Indeed, in unpublished studies, we have shown that although PTP1B, TC48, and TC45 can all attenuate the eye overgrowth associated with INR expression in Drosophila, only TC45 rescues the fecundity defects in Ptp61FΔ/Δ animals. Therefore, our findings in flies may provide important insights into how TCPTP deficiencies may lead to perturbations in cell competition and tumorigenesis in mammals.
It is currently unknown to what extent the various properties of PTP1B and TCPTP are conserved in PTP61F, besides some of those we have discussed above. In this study, we have revealed novel roles for PTP61F as a polarity impairment-induced cell competition regulator and a tumor suppressor in activated RAS-driven polarity-impaired (Ras85DV12/dlg1RNAi) tumorigenesis. These roles align with those that might be expected, particularly for TCPTP, and support the utility of Drosophila melanogaster for the examination of PTPs in cancer research. Furthermore, this work highlights the need for exploration of potential roles for PTP1B and TCPTP in mammalian cell competition. Cell competition as a mechanism for mammalian tissue homeostasis and tumor suppression is an emerging field (reviewed in [90]), and one with multiple parallels to observations from Drosophila, including the ability of cell polarity-impairment to induce the cell competition surveillance mechanisms [91,92]. Similar forays could be made into examining the role of PTPs in polarity-impaired cooperative tumorigenesis in mammals. Whilst the involvement of JAK–STAT signalling has not been comprehensively examined in polarity-impaired mouse models of cancer or in human cancer [93,94], cooperation between RAS–MAPK and JAK–STAT signalling has been noted in hepatocellular carcinoma [95], and more recently a conserved cooperation between RAS–MAPK and JAK–STAT signalling was observed in the development of radiation resistance in RAS-driven tumor models [96]. Polarity impairment and RAS oncogenes show strong cooperation in mouse cancer models [93,97], and elevated JAK–STAT signalling has been observed in at least one instance [93], but whether PTP1B and TCPTP are involved in mammalian polarity-impaired cancer models is currently unknown. As polarity impairment is a common event in human cancers, and occurs as an early event in cancer development [98,99,100,101], understanding the role that PTP1B and TCPTP play in the regulation of signalling pathways in polarity-impaired cancer models may provide new ways by which to target cancers at an early stage to enhance cell competition mechanisms and tumor suppressor functions.

4. Materials and Methods

4.1. Fly Stocks and General Husbandry

For a complete list of all fly stocks used in this study, please refer to Table S1. For a list of complete genotypes, see Table S2. All stocks and crosses were raised and undertaken on a standard cornmeal/molasses/yeast medium within temperature-controlled incubators at 25 °C, unless otherwise indicated.

4.2. Imaging and Sample Preparation

L3 eye-antennal or wing imaginal discs were dissected in 1× phosphate-buffered saline (PBS, Amresco (Radnor, PA, USA) #E703) and fixed in 4% paraformaldehyde (Alfa Aesar (Haverhill, MA, USA) #43368) in PBS with 0.1% Triton X-100 (PBST) for 15–30 min. Samples were then washed in 0.1–0.3% PBST (0.1% or 0.3% Triton X-100). If no immunohistochemical staining was required, samples were then incubated in DAPI solution (for DNA detection, DAPI solution prepared at 1 μg/mL, used at 1:1000, Sigma-Aldrich (St. Louis, MO, USA) #D9542) and/or phalloidin-tetramethylrhodamine isothiocyanate-Rhodamine solution (for F-actin detection, stock prepared at 0.3 mM, used at 1:1000, Sigma-Aldrich #P1951) in 0.1% Triton X-100. After DNA/F-actin staining, samples were mounted in 80% glycerol. Samples were analysed via confocal microscopy using either a Leica TCS SP5 or a Zeiss LSM 780. Images were processed, analysed, and assembled using some combination of LAS AF Lite (Leica (Wetzlar, Germany)), Zen 2012 (Zeiss (Oberkochen, Germany)), Fiji [102], Photoshop 5.1/2019/2020 (Adobe (San Jose, CA, USA)), and Imaris v.7 (Bitplane (Zürich, Switzerland)).

4.3. Twin-Clone Generation and Quantification

Larvae were heat shocked at 37 °C for 1 h approximately 72 h after egg laying. L3 imaginal discs were then dissected and prepared as described, and clearly distinct twin-clones had their sizes were measured across Z-stacks using Fiji [102]. Statistical analyses comparing the size ratio between the wild-type/wild-type twin-clones and the wild-type/Ptp61FΔ/Δ twin-clones was performed using Student’s unpaired t-test in Prism 7/8/9 (GraphPad (San Diego, CA, USA)). Technique adapted from Froldi et al. [50].

4.4. MARCM and Reverse MARCM

Crosses were set up and left overnight at room temperature. Adults were then turned daily into new vials and allowed to lay for ~24 h at 25 °C. L3 animals were then collected after ~144 h (6 days after the egg laying period). Samples were collected and prepared as described across multiple days to be similarly aged, and then stored at 4 °C in 80% glycerol as necessary prior to mounting.

4.5. Clone Volume Quantification and Statistical Analyses

Samples were imaged by adjusting the gain levels to just below saturation for the GFP and DAPI detection channels, and Z-stacks were acquired using an LSM 780 confocal microscope with Zen 2012 (Zeiss). Clone and whole tissue volume measurements were performed using Imaris v.7 (Bitplane). First, a surface was generated and used to mask and remove extraneous tissue from the sample. Then, the program automatically set threshold values for the GFP and DAPI channels, and surfaces were generated to identify the volumes of the whole tissue (DAPI positive) and clones (GFP positive). Finally, the GFP-positive/DAPI-positive tissue volume ratio was obtained, to give the proportion of each sample populated by clonal tissue. Data were collated using Excel (Microsoft) and statistically analysed using Prism 7/8/9 (GraphPad). The particular statistical tests employed are detailed in the respective figure legends. Note, for the samples in Figure 3, these experiments were performed under the same conditions and soon afterwards those using Ptp61FRNAi discussed in Figure 2. Therefore, we utilised the same samples as controls.

4.6. Statistical Analyses of Signal Intensity and the eq Expression Domain Area

Z-stack images of the eye region of eye-antennal imaginal discs derived from L3 animals were obtained using identical microscope settings and used to generate maximum intensity projection images. Average pixel intensity of 10×STAT92E-GFP expression was measured using histogram tool in Photoshop 5.1 (Adobe), using an area of 400–2500 pixels located just posterior of the morphogenetic furrow. Average pixel intensity both within and without the eq expression domain was measured (n = ~10 for each sample) and expressed as the ratio of eq expression domain pixel intensity to wild-type tissue pixel intensity. Data were collated using Excel (Microsoft), and analysed using Prism 7/8 (GraphPad).

4.7. Western Blotting, Analyses, and Antibodies

Samples were prepared from ~20 eye-antennal imaginal discs and homogenized in lysis buffer (0.1 M Tris-HCl (pH 6.8), 2% SDS, 5 mM EDTA, 5 mM DTT) containing cOmplete Protease Inhibitor Cocktail (Roche (Basel, Switzerland) #11697498001), and 1 mM Na3(VO)4 and 5 mM NaF2 as phosphatase inhibitors. Samples were boiled for 5 min in 1 × Laemmli SDS buffer plus 5% (v/v) β-mercaptoethanol and proteins resolved by SDS-PAGE (10%). Gels were run at 100 V, and Precision Plus Protein Standards (Bio-Rad (Hercules, CA, USA)) were used as a ladder. Western blotting was performed with a Trans-Blot Turbo Transfer pack (Bio-Rad, #170-4156, #170-4158) and Immun-Blot PVDF membrane (Bio-Rad, #1620177). Membranes were blocked in 5% skim milk blocking solution and washed with TBST, then placed in primary antibody solutions overnight. Primary antibodies used were: mouse anti-Phosphotyrosine, clone 4G10 (Merck & Co. (Kenilworth, NJ, USA) #05-321), rabbit anti-phospho-p44/42 MAPK (Erk1/2) (Thr202/Tyr204) (a.k.a. pERK, Cell Signaling Technology (Danvers, MA, USA) #9101), rabbit anti-ERK 2 (D-2) (a.k.a. ERK, Santa Cruz Biotechnology (Dallas, TX, USA) #sc-1647), mouse anti-α-Tubulin (DM1A) (Cell Signaling Technology #3873), and mouse anti-β-Galactosidase (Sigma-Aldrich #G4644). Blots were then washed in TBST and incubated in secondary antibodies for at least 60 min. Secondary antibodies used include goat anti-mouse IgM/G/A (H+L) F(ab’)2 HRP conjugate (Millipore (Burlington, MA, USA) #AQ502P) and goat-anti-rabbit IgG F(ab’)2 HRP conjugate (Millipore #AQ132P). Proteins were visualised using Clarity Western ECL Substrate (Bio-Rad #170-5061). Band intensity was measured using Fiji [102], and data analysed using Excel (Microsoft).

4.8. RNA Extraction, cDNA Synthesis, and qRT-PCR

RNAi lines were crossed to eyFLP; Actin>CD2>GAL4, UAS-GFP, and raised at 25 °C. L3 eye-antennal discs (n > 10 per for each genotype) were obtained as described for immunofluorescence above, with RNA extraction and cDNA synthesis then performed as previously described [103]. qRT-PCR was performed using a Power SYBR Green PCR Master Mix (Applied Biosystems (Waltham, MA, USA) #4367659) on a QuantStudio 12K Flex Real-Time PCR System (Applied Biosystems). The data were normalised to expression of the housekeeping genes Gapdh2 and Rpl32. The primer sequences used are as follows: Stat92E, forward 5′-TGCTCCGTTTCTCCGACAG-3′ and reverse 5′-CTAGCATGGTGACCAGTCC-3′; Ptp61F, forward 5′-GTGCGGCGATGGTTCAAATTA-3′ and reverse 5′-CTTAAGGAATGCGTTCGGCG-3′; Gapdh2, forward 5′-GCAAGCAAGCCGATAGATAAACA-3′ and reverse 5′-CGTTGGCGCCCTTATCAATG-3′; Rpl32, forward 5′-CCAGTCGGATCGATATGCTAA-3′ and reverse 5′-GTTCGATCCGTAACCGATGT-3′.

Supplementary Materials

The following are available online at https://www.mdpi.com/article/10.3390/ijms222312732/s1.

Author Contributions

Conceptualization, H.E.R. and T.T.; Methodology, J.E.L.M., L.F.W., K.A. and P.K.G.; Formal Analysis, J.E.L.M., L.F.W., K.A. and M.P.; Investigation, J.E.L.M., L.F.W., K.A. and P.K.G.; Writing—Original Draft Preparation, J.E.L.M. and H.E.R.; Writing—Review and Editing, M.P., T.T. and H.E.R.; Supervision, T.T. and H.E.R.; Project Administration, H.E.R. and T.T.; Funding Acquisition, H.E.R. and T.T. All authors have read and agreed to the published version of the manuscript.

Funding

J.E.L.M. was supported by an Australian Research Council Discovery grant to H.E.R. and T.T. (DP170102549). H.E.R. was supported by a NHMRC Senior Research Fellowship level B (APP1020056), and by the La Trobe Institute for Molecular Science and La Trobe University. T.T. was supported by an NHMRC Principal Research Fellowship (APP1103037). M.P. was supported by a Cancer Council Victoria grant to H.E.R. (APP1041817). L.F.W. and K.A. were supported by an Australian Research Council Grant (DP-130103154) to T.T. and H.E.R.

Institutional Review Board Statement

Not applicable.

Informed Consent Statement

Not applicable.

Data Availability Statement

Not applicable.

Acknowledgments

We thank Peter Burke for help maintaining the Drosophila stocks, and all other members of our labs for constructive discussions. We thank Peter Lock and the LIMS Bioimaging Facility for microscopy equipment and technical support. We thank Mark Lee for his assistance with samples quantifications. We thank Sarah Diepstraten for assistance with figure generation and qRT-PCR. We thank Katrina Mitchell and Greg Somers for the Stat92E qRT-PCR primers. We thank the Australian Drosophila research community, the BDSC and the VDRC for providing fly stocks, OzDros for stock importation services, and Flybase for the wealth of information. We also thank Linda Parsons and Jan Manent suggestions and general experimental assistance. We thank the Developmental Studies Hybridoma Bank, which was created by the National Institute of Child Health and Human Development of the National Institutes of Health and is based at The University of Iowa, for supplying antibodies. Indicated transgenic fly stocks were obtained from the Vienna Drosophila Resource Center [104].

Conflicts of Interest

The authors declare no conflict of interest.

References

  1. Cheng, L.Y.; Parsons, L.M.; Richardson, H.E. Modelling Cancer in Drosophila: The Next Generation. In eLS; John Wiley & Sons, Ltd.: Chichester, UK, 2013. [Google Scholar]
  2. Gonzalez, C. Drosophila melanogaster: A model and a tool to investigate malignancy and identify new therapeutics. Nat. Rev. Cancer 2013, 13, 172–183. [Google Scholar] [CrossRef] [PubMed]
  3. Sonoshita, M.; Cagan, R.L. Modeling Human Cancers in Drosophila. In Current Topics in Developmental Biology—Fly Models of Human Diseases; Pick, L., Ed.; Academic Press: Cambridge, MA, USA, 2017; pp. 287–309. [Google Scholar]
  4. Richardson, H.E.; Portela, M. Modelling Cooperative Tumorigenesis in Drosophila. BioMed Res. Int. 2018, 2018, 4258387. [Google Scholar] [CrossRef] [PubMed] [Green Version]
  5. La Marca, J.E.; Richardson, H.E. Two-Faced: Roles of JNK Signalling During Tumourigenesis in the Drosophila Model. Front. Cell Dev. Biol. 2020, 8, 42. [Google Scholar] [CrossRef] [PubMed] [Green Version]
  6. Karim, F.D.; Rubin, G.M. Ectopic expression of activated Ras1 induces hyperplastic growth and increased cell death in Drosophila imaginal tissues. Development 1998, 125, 1–9. [Google Scholar] [CrossRef]
  7. Pagliarini, R.A.; Xu, T. A Genetic Screen in Drosophila for Metastatic Behavior. Science 2003, 302, 1227–1231. [Google Scholar] [CrossRef] [PubMed]
  8. Bilder, D.; Li, M.; Perrimon, N. Cooperative Regulation of Cell Polarity and Growth by Drosophila Tumor Suppressors. Science 2000, 289, 113–116. [Google Scholar] [CrossRef] [Green Version]
  9. Bilder, D.; Perrimon, N. Localization of apical epithelial determinants by the basolateral PDZ protein Scribble. Nature 2000, 403, 676–680. [Google Scholar] [CrossRef]
  10. Brumby, A.M.; Richardson, H.E. Scribble mutants cooperate with oncogenic Ras or Notch to cause neoplastic overgrowth in Drosophila. EMBO J. 2003, 22, 5769–5779. [Google Scholar] [CrossRef]
  11. Leong, G.R.; Goulding, K.R.; Amin, N.; Richardson, H.E.; Brumby, A.M. Scribble mutants promote aPKC and JNK-dependent epithelial neoplasia independently of Crumbs. BMC Biol. 2009, 7, 62. [Google Scholar] [CrossRef] [Green Version]
  12. Ma, X.; Xu, W.; Zhang, D.; Yang, Y.; Li, W.; Xue, L. Wallenda regulates JNK-mediated cell death in Drosophila. Cell Death Dis. 2015, 6, 1737. [Google Scholar] [CrossRef] [Green Version]
  13. Igaki, T.; Pagliarini, R.A.; Xu, T. Loss of Cell Polarity Drives Tumor Growth and Invasion through JNK Activation in Drosophila. Curr. Biol. 2006, 16, 1139–1146. [Google Scholar] [CrossRef] [Green Version]
  14. Uhlirova, M.; Jasper, H.; Bohmann, D. Non-cell-autonomous induction of tissue overgrowth by JNK/Ras cooperation in a Drosophila tumor model. Proc. Natl. Acad. Sci. USA 2005, 102, 13123–13128. [Google Scholar] [CrossRef] [Green Version]
  15. Chen, C.-L.; Schroeder, M.; Kango-Singh, M.; Tao, C.; Halder, G. Tumor suppression by cell competition through regulation of the Hippo pathway. Proc. Natl. Acad. Sci. USA 2012, 109, 484–489. [Google Scholar] [CrossRef] [PubMed] [Green Version]
  16. Fahey-Lozano, N.; La Marca, J.E.; Portela, M.; Richardson, H.E. Drosophila Models of Cell Polarity and Cell Competition in Tumourigenesis. In Advances in Experimental Medicine and Biology—The Drosophila Model in Cancer; Deng, W.-M., Ed.; Springer: Cham, Switzerland, 2019; pp. 36–74. [Google Scholar]
  17. Madan, E.; Gogna, R.; Moreno, E. Cell competition in development: Information from flies and vertebrates. Curr. Opin. Cell Biol. 2018, 55, 150–157. [Google Scholar] [CrossRef]
  18. Cohen, P.T.W. Novel protein serine/threonine phosphatases: Variety is the spice of life. Trends Biochem. Sci. 1997, 22, 245–251. [Google Scholar] [CrossRef]
  19. Tonks, N.K. Protein tyrosine phosphatases—From housekeeping enzymes to master regulators of signal transduction. FEBS J. 2013, 280, 346–378. [Google Scholar] [CrossRef] [Green Version]
  20. Tonks, N.K. Protein tyrosine phosphatases: From genes, to function, to disease. Nat. Rev. Mol. Cell Biol. 2006, 7, 833–846. [Google Scholar] [CrossRef] [PubMed]
  21. Hatzihristidis, T.; Liu, S.; Pyszcz, L.; Hutchins, A.P.; Gabaldon, T.; Tremblay, M.; Miranda-Saavedra, D. PTP-central: A comprehensive resource of protein tyrosine phosphatases in eukaryotic genomes. Methods 2014, 65, 156–164. [Google Scholar] [CrossRef] [Green Version]
  22. Morrison, D.K.; Murakami, M.S.; Cleghon, V. Protein Kinases and Phosphatases in the Drosophila Genome. J. Cell Biol. 2000, 150, 57–62. [Google Scholar] [CrossRef]
  23. Thurmond, J.; Goodman, J.L.; Strelets, V.B.; Attrill, H.; Gramates, L.S.; Marygold, S.J.; Matthews, B.B.; Millburn, G.; Antonazzo, G.; Trovisco, V.; et al. FlyBase 2.0: The next generation. Nucleic Acids Res. 2018, 47, 759–765. [Google Scholar] [CrossRef] [Green Version]
  24. Buszard, B.J.; Johnson, T.K.; Meng, T.-C.; Burke, R.; Warr, C.G.; Tiganis, T. The Nucleus- and Endoplasmic Reticulum-Targeted Forms of Protein Tyrosine Phosphatase 61F Regulate Drosophila Growth, Life Span, and Fecundity. Mol. Cell. Biol. 2013, 33, 1345–1356. [Google Scholar] [CrossRef] [PubMed] [Green Version]
  25. Müller, P.; Kuttenkeuler, D.; Gesellchen, V.; Zeidler, M.P.; Boutros, M. Identification of JAK/STAT signalling components by genome-wide RNA interference. Nature 2005, 436, 871–875. [Google Scholar] [CrossRef] [PubMed] [Green Version]
  26. Saadin, A.; Starz-Gaiano, M. Identification of Novel Regulators of the JAK/STAT Signaling Pathway that Control Border Cell Migration in the Drosophila Ovary. G3 Genes Genomes Genet. 2016, 6, 1991–2002. [Google Scholar] [CrossRef] [PubMed] [Green Version]
  27. Willoughby, L.F.; Manent, J.; Allan, K.; Lee, H.; Portela, M.; Wiede, F.; Warr, C.; Meng, T.-Z.; Tiganis, T.; Richardson, H.E. Differential regulation of protein tyrosine kinase signalling by Dock and the PTP61F variants. FEBS J. 2017, 284, 2231–2250. [Google Scholar] [CrossRef] [Green Version]
  28. Tchankouo-Nguetcheu, S.; Udinotti, M.; Durand, M.; Meng, T.Z.; Taouis, M.; Rabinow, L. Negative regulation of MAP kinase signaling in Drosophila by Ptp61F/PTP1B. Mol. Genet. Genom. 2014, 289, 795–806. [Google Scholar] [CrossRef] [Green Version]
  29. Wu, C.-L.; Buszard, B.; Teng, C.H.; Chen, W.L.; Warr, C.G.; Tiganis, T.; Meng, T.C. Dock/Nck facilitates PTP61F/PTP1B regulation of insulin signalling. Biochem. J. 2011, 439, 151–159. [Google Scholar] [CrossRef] [Green Version]
  30. Hatzihristidis, T.; Desai, N.; Hutchins, A.P.; Meng, T.-C.; Tremblay, M.; Miranda-Saavedra, D. A Drosophila-centric view of protein tyrosine phosphatases. FEBS Lett. 2015, 589, 951–966. [Google Scholar] [CrossRef] [Green Version]
  31. Tiganis, T. PTP1B and TCPTP—Nonredundant phosphatases in insulin signaling and glucose homeostasis. FEBS J. 2013, 280, 445–458. [Google Scholar] [CrossRef]
  32. Tonks, N.K.; Diltz, C.D.; Fischer, E.H. Purification of the major protein-tyrosine-phosphatases of human placenta. J. Biol. Chem. 1988, 263, 6722–6730. [Google Scholar] [CrossRef]
  33. Elchebly, M. Increased Insulin Sensitivity and Obesity Resistance in Mice Lacking the Protein Tyrosine Phosphatase-1B Gene. Science 1999, 283, 1544–1548. [Google Scholar] [CrossRef]
  34. Galic, S.; Hauser, C.; Kahn, B.B.; Haj, F.G.; Neel, B.G.; Tonks, N.K.; Tiganis, T. Coordinated Regulation of Insulin Signaling by the Protein Tyrosine Phosphatases PTP1B and TCPTP. Mol. Cell. Biol. 2005, 25, 819–829. [Google Scholar] [CrossRef] [Green Version]
  35. Klaman, L.D.; Boss, O.; Perroni, O.; Kim, J.K.; Martino, J.L.; Zabolotny, J.M.; Moghal, N.; Lubkin, M.; Kim, Y.B.; Sharpe, A.; et al. Increased Energy Expenditure, Decreased Adiposity, and Tissue-Specific Insulin Sensitivity in Protein-Tyrosine Phosphatase 1B-Deficient Mice. Mol. Cell. Biol. 2000, 20, 5479–5489. [Google Scholar] [CrossRef] [Green Version]
  36. Myers, M.P. TYK2 and JAK2 are substrates of protein-tyrosine phosphatase 1B. J. Biol. Chem. 2001, 276, 47771–47774. [Google Scholar] [CrossRef] [PubMed] [Green Version]
  37. Zhu, S.; Bjorge, J.D.; Fujita, D.J. PTP1B Contributes to the Oncogenic Properties of Colon Cancer Cells through Src Activation. Cancer Res. 2007, 67, 10129–10137. [Google Scholar] [CrossRef] [Green Version]
  38. Arias-Romero, L.E.; Saha, S.; Villamar-Cruz, O.; Yip, S.C.; Ethier, S.P.; Zhang, Z.-Y.; Chernoff, J. Activation of Src by Protein Tyrosine Phosphatase 1B Is Required for ErbB2 Transformation of Human Breast Epithelial Cells. Cancer Res. 2009, 69, 4582–4588. [Google Scholar] [CrossRef] [Green Version]
  39. Bentires-Alj, M.; Neel, B.G. Protein-Tyrosine Phosphatase 1B Is Required for HER2/Neu–Induced Breast Cancer. Cancer Res. 2007, 67, 2420–2424. [Google Scholar] [CrossRef] [PubMed] [Green Version]
  40. Julien, S.G.; Dube, N.; Read, M.; Penney, J.; Paquet, M.; Han, Y.; Kennedy, B.P.; Muller, W.; Tremblay, M. Protein tyrosine phosphatase 1B deficiency or inhibition delays ErbB2-induced mammary tumorigenesis and protects from lung metastasis. Nat. Genet. 2007, 39, 338–346. [Google Scholar] [CrossRef] [PubMed]
  41. Lorenzen, J.A.; Dadabay, C.Y.; Fischer, E.H. COOH-terminal sequence motifs target the T cell protein tyrosine phosphatase to the ER and nucleus. J. Cell Biol. 1995, 131, 631–643. [Google Scholar] [CrossRef] [PubMed]
  42. Mosinger, B.; Tillmann, U.; Westphal, H.; Tremblay, M.L. Cloning and characterization of a mouse cDNA encoding a cytoplasmic protein-tyrosine-phosphatase. Proc. Natl. Acad. Sci. USA 1992, 89, 499–503. [Google Scholar] [CrossRef] [Green Version]
  43. Tiganis, T.; Flint, A.J.; Adam, S.A.; Tonks, N.K. Association of the T-cell Protein Tyrosine Phosphatase with Nuclear Import Factor p97. J. Biol. Chem. 1997, 272, 21548–21557. [Google Scholar] [CrossRef] [Green Version]
  44. Tiganis, T.; Bennett, A.M. Protein tyrosine phosphatase function: The substrate perspective. Biochem. J. 2007, 402, 1–15. [Google Scholar] [CrossRef]
  45. Kleppe, M.; Lahortiga, I.; El Chaar, T.; De Keersmaecker, K.; Mentens, N.; Graux, C.; Van Roosbroeck, K.; Ferrardo, A.A.; Langerak, A.; Meijerink, J.P.P.; et al. Deletion of the protein tyrosine phosphatase gene PTPN2 in T-cell acute lymphoblastic leukemia. Nat. Genet. 2010, 42, 530–535. [Google Scholar] [CrossRef]
  46. Kleppe, M.; Soulier, J.; Asnafi, V.; Mentens, N.; Hornakova, T.; Knoops, L.; Constantinescu, S.; Sigaux, F.; Meijerink, J.P.; Vandenberghe, P.; et al. PTPN2 negatively regulates oncogenic JAK1 in T-cell acute lymphoblastic leukemia. Blood 2011, 117, 7090–7098. [Google Scholar] [CrossRef] [PubMed] [Green Version]
  47. Shields, B.J.; Wiede, F.; Gurzov, E.N.; Wee, K.; Hauser, C.; Zhu, H.-J.; Molloy, T.J.; O’Toole, S.A.; Daly, R.; Sutherland, R.L.; et al. TCPTP Regulates SFK and STAT3 Signaling and Is Lost in Triple-Negative Breast Cancers. Mol. Cell. Biol. 2013, 33, 557–570. [Google Scholar] [CrossRef] [PubMed] [Green Version]
  48. Tiganis, T. The Role of TCPTP in Cancer. In Protein Tyrosine Phosphatases in Cancer; Neel, B.G., Tonks, N.K., Eds.; Springer: New York, NY, USA, 2016; pp. 145–168. [Google Scholar]
  49. Grohmann, M.; Wiede, F.; Dodd, G.; Gurzov, E.N.; Ooi, G.; Butt, T.; Rasmiena, A.A.; Kaur, S.; Gulati, T.; Goh, P.K.; et al. Obesity Drives STAT-1-Dependent NASH and STAT-3-Dependent HCC. Cell 2018, 175, 1289–1306. [Google Scholar] [CrossRef] [PubMed] [Green Version]
  50. Froldi, F.; Ziosi, M.; Garoia, F.; Pession, A.; Grzeschik, N.A.; Bellosta, P.; Strand, D.; Richardson, H.E.; Pession, A.; Griffoni, D. The lethal giant larvae tumour suppressor mutation requires dMyc oncoprotein to promote clonal malignancy. BMC Biol. 2010, 8, 33. [Google Scholar] [CrossRef] [Green Version]
  51. Lee, T.; Luo, L. Mosaic Analysis with a Repressible Cell Marker for Studies of Gene Function in Neuronal Morphogenesis. Neuron 1999, 22, 451–461. [Google Scholar] [CrossRef] [Green Version]
  52. Baeg, G.-H.; Zhou, R.; Perrimon, N. Genome-wide RNAi analysis of JAK/STAT signaling components in Drosophila. Genes Dev. 2005, 19, 1861–1870. [Google Scholar] [CrossRef] [Green Version]
  53. Schroeder, M.C.; Chen, C.-L.; Gajewski, K.; Halder, G. A non-cell-autonomous tumor suppressor role for Stat in eliminating oncogenic scribble cells. Oncogene 2013, 32, 4471–4479. [Google Scholar] [CrossRef] [Green Version]
  54. Willecke, M.; Toggweiler, J.; Basler, K. Loss of PI3K blocks cell-cycle progression in a Drosophila tumor model. Oncogene 2011, 30, 4067–4074. [Google Scholar] [CrossRef] [Green Version]
  55. Casci, T.; Freeman, M. Control of EGF Receptor Signalling: Lessons from Fruitflies. Cancer Metastasis Rev. 1999, 18, 181–201. [Google Scholar] [CrossRef]
  56. Malartre, M. Regulatory mechanisms of EGFR signalling during Drosophila eye development. Cell. Mol. Life Sci. 2016, 73, 1825–1843. [Google Scholar] [CrossRef] [PubMed]
  57. Bunker, B.D. The transcriptional response to tumorigenic polarity loss in Drosophila. eLife 2015, 4, 03189. [Google Scholar] [CrossRef] [PubMed]
  58. Wu, M.; Pastor-Pareja, J.C.; Xu, T. Interaction between RasV12 and scribbled clones induces tumour growth and invasion. Nature 2010, 463, 545–548. [Google Scholar] [CrossRef] [PubMed] [Green Version]
  59. Tsai, Y.-C.; Yao, J.G.; Chen, P.-H.; Posakony, J.W.; Barolo, S.; Kim, J.; Sun, H. Upd/Jak/STAT signaling represses wg transcription to allow initiation of morphogenetic furrow in Drosophila eye development. Dev. Biol. 2007, 306, 760–771. [Google Scholar] [CrossRef] [Green Version]
  60. Bach, E.A.; Ekas, L.A.; Ayala-Camargo, A.; Flaherty, M.S.; Lee, H.; Perrimon, N.; Baeg, G.-H. GFP reporters detect the activation of the Drosophila JAK/STAT pathway in vivo. Gene Expr. Patterns 2007, 7, 323–331. [Google Scholar] [CrossRef]
  61. Rodrigues, A.B.; Zoranovic, T.; Ayala-Camargo, A.; Grewal, S.; Reyes-Robles, T.; Krasny, M.; Wu, C.; Johnston, L.A.; Bach, E.A. Activated STAT regulates growth and induces competitive interactions independently of Myc, Yorkie, Wingless and ribosome biogenesis. Development 2012, 139, 4051–4061. [Google Scholar] [CrossRef] [Green Version]
  62. Andersen, D.S.; Colombani, J.; Palmerini, V.; Chakrabandhu, K.; Boone, E.; Röthlisberger, M.; Toggweiler, J.; Basler, K.; Mapelli, M.; Hueber, A.-O.; et al. The Drosophila TNF receptor Grindelwald couples loss of cell polarity and neoplastic growth. Nature 2015, 522, 482–486. [Google Scholar] [CrossRef]
  63. Ma, X.; Chen, Y.; Zhang, S.; Xu, W.; Shao, Y.; Li, W.; Li, M.; Xue, L. Rho1–Wnd signaling regulates loss-of-cell polarity-induced cell invasion in Drosophila. Oncogene 2016, 35, 846–855. [Google Scholar] [CrossRef]
  64. Igaki, T.; Pastor-Pareja, J.C.; Aonuma, H.; Miura, M.; Xu, T. Intrinsic Tumor Suppression and Epithelial Maintenance by Endocytic Activation of Eiger/TNF Signaling in Drosophila. Dev. Cell 2009, 16, 458–465. [Google Scholar] [CrossRef] [Green Version]
  65. Herranz, H.; Hong, X.; Hung, N.T.; Voorhoeve, P.M.; Cohen, S. Oncogenic cooperation between SOCS family proteins and EGFR identified using a Drosophila epithelial transformation model. Genes Dev. 2012, 26, 1602–1611. [Google Scholar] [CrossRef] [PubMed] [Green Version]
  66. Croker, B.A.; Kiu, H.; Nicholson, S.E. SOCS regulation of the JAK/STAT signalling pathway. Semin. Cell Dev. Biol. 2008, 19, 414–422. [Google Scholar]
  67. Stec, W.J.; Zeidler, M.P. Drosophila SOCS Proteins. J. Signal Transduct. 2011, 2011, 894510. [Google Scholar] [CrossRef] [Green Version]
  68. Issigonis, M.; Matunis, E. The Drosophila BCL6 homolog ken and barbie promotes somatic stem cell self-renewal in the testis niche. Dev. Biol. 2012, 368, 181–192. [Google Scholar] [CrossRef] [Green Version]
  69. Rawlings, J.S. Two Drosophila suppressors of cytokine signaling (SOCS) differentially regulate JAK and EGFR pathway activities. BMC Cell Biol. 2004, 5, 38. [Google Scholar] [CrossRef] [Green Version]
  70. Callus, B.A.; Mathey-Prevot, B. SOCS36E, a novel Drosophila SOCS protein, suppresses JAK/STAT and EGF-R signalling in the imaginal wing disc. Oncogene 2002, 21, 4812–4821. [Google Scholar] [CrossRef] [PubMed] [Green Version]
  71. Karsten, P.; Häder, S.; Zeidler, M.P. Cloning and expression of Drosophila SOCS36E and its potential regulation by the JAK/STAT pathway. Mech. Dev. 2002, 117, 343–346. [Google Scholar] [CrossRef]
  72. Labbé, D.P.; Tremblay, M.L. PTP1B: From Metabolism to Cancer. In Protein Tyrosine Phosphatases in Cancer; Neel, B.G., Tonks, N.K., Eds.; Springer: New York, NY, USA, 2016; pp. 169–200. [Google Scholar]
  73. Yamamoto, M.; Ohsawa, S.; Kunimasa, K.; Igaki, T. The ligand Sas and its receptor PTP10D drive tumour-suppressive cell competition. Nature 2017, 542, 246–250. [Google Scholar] [CrossRef]
  74. Portela, M.; Casas-Tinto, S.; Rhiner, C.; Lopez-Gay, J.M.; Dominguez, O.; Soldini, D.; Moreno, E. Drosophila SPARC Is a Self-Protective Signal Expressed by Loser Cells during Cell Competition. Dev. Cell 2010, 19, 562–573. [Google Scholar] [CrossRef] [Green Version]
  75. Rhiner, C.; Lopez-Gay, J.M.; Soldini, D.; Casas-Tinto, C.; Martin, F.A.; Lombardia, L.; Moreno, E. Flower Forms an Extracellular Code that Reveals the Fitness of a Cell to its Neighbors in Drosophila. Dev. Cell 2010, 18, 985–998. [Google Scholar] [CrossRef] [Green Version]
  76. Katsukawa, M.; Ohsawa , S.; Zhang , L.; Yan , Y.; Igaki , T. Serpin Facilitates Tumor-Suppressive Cell Competition by Blocking Toll-Mediated Yki Activation in Drosophila. Curr. Biol. 2018, 28, 1756–1767. [Google Scholar] [CrossRef] [Green Version]
  77. Le Sommer, S.; Ohsawa, S.; Zhang, L.; Yan, Y.; Igaki, T. Deficiency in Protein Tyrosine Phosphatase PTP1B Shortens Lifespan and Leads to Development of Acute Leukemia. Cancer Res. 2018, 78, 75–87. [Google Scholar] [CrossRef] [Green Version]
  78. Lessard, L.; Labbe, D.P.; Deblois, G.; Begin, L.R.; Hardy, S.; Mes-Masson, A.M.; Saad, F.; Trotman, L.C.; Viguere, V.; Tremblay, M.L. PTP1B Is an Androgen Receptor–Regulated Phosphatase That Promotes the Progression of Prostate Cancer. Cancer Res. 2012, 72, 1529–1537. [Google Scholar] [CrossRef] [PubMed] [Green Version]
  79. Wu, C.; Zhang, L.; Bourne, P.A.; Reeder, J.E.; di Sant’Agnese, P.A.; Yao, J.; Na, Y.; Huang, J. Protein tyrosine phosphatase PTP1B is involved in neuroendocrine differentiation of prostate cancer. Prostate 2006, 66, 1125–1135. [Google Scholar] [CrossRef] [PubMed]
  80. Wang, J.; Liu, B.; Chen, X.; Su, L.; Pu, W.; Wu, J.; Zhu, Z. PTP1B expression contributes to gastric cancer progression. Med. Oncol. 2012, 29, 948–956. [Google Scholar] [CrossRef]
  81. Wang, X.-M.; Shang, L.; Zhang, Y.; Hao, J.-J.; Shi, F.; Luo, W.; Zhang, T.-T.; Wang, B.-S.; Yang, Y.; Liu, Z.-H.; et al. PTP1B Contributes to Calreticulin-Induced Metastatic Phenotypes in Esophageal Squamous Cell Carcinoma. Mol. Cancer Res. 2013, 11, 986–994. [Google Scholar] [CrossRef] [Green Version]
  82. Krishnan, N.; Koveal, D.; Miller, D.H.; Xue, B.; Dipikaa Akshinthala, S.; Kragelj, J.; Ringkjøbing Jensen, M.; Gauss, C.M.; Page, R.; Blackledge, M.; et al. Targeting the disordered C terminus of PTP1B with an allosteric inhibitor. Nat. Chem. Biol. 2014, 10, 558–566. [Google Scholar] [CrossRef] [Green Version]
  83. Dubé, N.; Cheng, A.; Tremblay, M.L. The role of protein tyrosine phosphatase 1B in Ras signaling. Proc. Natl. Acad. Sci. USA 2004, 101, 1834–1839. [Google Scholar] [CrossRef] [PubMed] [Green Version]
  84. Mertins, P.; Eberl, H.C.; Renkawitz, J.; Oslen, J.V.; Tremblay, M.L.; Mann, M.; Ullrich, A.; Daub, H. Investigation of Protein-tyrosine Phosphatase 1B Function by Quantitative Proteomics. Mol. Cell. Proteom. 2008, 7, 1763–1777. [Google Scholar] [CrossRef] [Green Version]
  85. Lee, H.; Kim, M.; Baek, M.; Morales, L.D.; Jang, I.-S.; Slaga, T.; DiGiovanni, J.; Kim, D.J. Targeted disruption of TC-PTP in the proliferative compartment augments STAT3 and AKT signaling and skin tumor development. Sci. Rep. 2017, 7, 45077. [Google Scholar] [CrossRef] [Green Version]
  86. Hoshida, Y.; Villanueva, A.; Kobayashi, M.; Peix, J.; Chiang, D.Y.; Camargo, A.; Gupta, S.; Moore, J.; Wrobel, M.; Lerner, J.; et al. Gene Expression in Fixed Tissues and Outcome in Hepatocellular Carcinoma. N. Engl. J. Med. 2008, 359, 1995–2004. [Google Scholar] [CrossRef] [Green Version]
  87. Lee, C.F.; Ling, Z.Q.; Zhao, T.; Fang, S.H.; Chang, W.-C.; Lee, S.-C.; Lee, K.-R. Genomic-wide analysis of lymphatic metastasis-associated genes in human hepatocellular carcinoma. World J. Gastroenterol. 2009, 15, 356–365. [Google Scholar] [CrossRef] [PubMed]
  88. Shields, B.J.; Hauser, C.; Bukczynska, P.E.; Court, N.W.; Tiganis, T. DNA Replication Stalling Attenuates Tyrosine Kinase Signaling to Suppress S Phase Progression. Cancer Cell 2008, 14, 166–179. [Google Scholar] [CrossRef] [PubMed] [Green Version]
  89. Shields, B.J.; Tiganis, T. Replication checkpoint control by a PTK/STAT3/Cyclin D1 axis. Cell Cycle 2009, 8, 223–230. [Google Scholar] [CrossRef]
  90. Kon, S.; Fujita, Y. Cell competition-induced apical elimination of transformed cells, EDAC, orchestrates the cellular homeostasis. Dev. Biol. 2021, 476, 112–116. [Google Scholar] [CrossRef] [PubMed]
  91. Norman, M. Loss of Scribble causes cell competition in mammalian cells. J. Cell Sci. 2012, 125, 59–66. [Google Scholar] [CrossRef] [Green Version]
  92. Tamori, Y.; Bialucha, C.; Tian, A.-G.; Kajita, M.; Huan, Y.-C.; Norman, M.; Harrison, N.; Poulton, J.; Ivanovitch, K.; Disch, L.; et al. Involvement of Lgl and Mahjong/VprBP in Cell Competition. PLoS Biol. 2010, 8, 1000422. [Google Scholar] [CrossRef] [PubMed] [Green Version]
  93. McCaffrey, L.M.; Montalbano, J.A.; Mihai, C.; Macara, I.G. Loss of the Par3 polarity protein promotes breast tumorigenesis and metastasis. Cancer Cell 2012, 22, 601–614. [Google Scholar] [CrossRef] [Green Version]
  94. Stephens, R.; Lim, K.; Portela, M.; Kvansakul, M.; Humbert, P.O.; Richardson, H.E. The Scribble Cell Polarity Module in the Regulation of Cell Signaling in Tissue Development and Tumorigenesis. J. Mol. Biol. 2018, 430, 3585–3612. [Google Scholar] [CrossRef]
  95. Calvisi, D.F.; Ladu, S.; Gorden, A.; Farina, M.; Conner, E.A.; Lee, J.-S.; Factor, V.M.; Thorgeirsson, S.S. Ubiquitous Activation of Ras and Jak/Stat Pathways in Human HCC. Gastroenterology 2006, 130, 1117–1128. [Google Scholar] [CrossRef]
  96. Dong, Y.-L. Cooperation between oncogenic Ras and wild-type p53 stimulates STAT non-cell autonomously to promote tumor radioresistance. Commun. Biol. 2021, 4, 374. [Google Scholar] [CrossRef] [PubMed]
  97. Pearson, H.B.; Mancera-Perez, P.A.; Dow, L.E.; Ryan, A.; Tennstedt, P.; Bogani, D.; Elsum, I.; Greenfield, A.; Tuveson, D.A.; Simon, R.; et al. SCRIB expression is deregulated in human prostate cancer, and its deficiency in mice promotes prostate neoplasia. J. Clin. Investig. 2011, 121, 4257–4267. [Google Scholar] [CrossRef] [PubMed] [Green Version]
  98. Gödde, N.J.; Pearson, H.B.; Smith, L.K.; Humbert, P.O. Dissecting the role of polarity regulators in cancer through the use of mouse models. Exp. Cell Res. 2014, 328, 249–257. [Google Scholar] [CrossRef]
  99. Lee, M.; Vasioukhin, V. Cell polarity and cancer—Cell and tissue polarity as a non-canonical tumor suppressor. J. Cell Sci. 2008, 121, 1141–1150. [Google Scholar] [CrossRef] [PubMed] [Green Version]
  100. Muthuswamy, S.K.; Xue, B. Cell Polarity as a Regulator of Cancer Cell Behavior Plasticity. Annu. Rev. Cell Dev. Biol. 2012, 28, 599–625. [Google Scholar] [CrossRef] [PubMed] [Green Version]
  101. Royer, C.; Lu, X. Epithelial cell polarity: A major gatekeeper against cancer? Cell Death Differ. 2011, 18, 1470–1477. [Google Scholar] [CrossRef] [Green Version]
  102. Schindelin, J.; Arganda-Carreras, I.; Frise, E.; Kaynig, V.; Longair, M.; Pietzsch, T.; Preibisch, S.; Rueden, C.; Saalfeld, S.; Schmid, B.; et al. Fiji: An open-source platform for biological-image analysis. Nat. Methods 2012, 9, 676–682. [Google Scholar] [CrossRef] [Green Version]
  103. La Marca, J.E.; Diepstraten, S.T.; Hodge, A.L.; Wang, H.; Hart, A.H.; Richardson, H.E.; Somers, W.G. Strip and Cka negatively regulate JNK signalling during Drosophila spermatogenesis. Development 2019, 146, dev174292. [Google Scholar] [CrossRef] [Green Version]
  104. Dietzl, G.; Chen, D.; Schnorrer, F.; Su, K.-C.; Barinova, Y.; Fellner, M.; Gasser, B.; Kinsey, K.; Oppel, S.; Scheiblauer, S.; et al. A genome-wide transgenic RNAi library for conditional gene inactivation in Drosophila. Nature 2007, 448, 151–156. [Google Scholar] [CrossRef]
Figure 1. Ptp61F loss enhances epithelial clone relative fitness. (AD) Confocal images of L3 imaginal tissues of the indicated genotypes (boxes at top, white indicates GFP-positive clones, black indicates remaining GFP-negative tissue) taken from animals where twin-clones were generated. The twins were either GFP-double positive (outlined in green) or GFP negative (outlined in red), with all other cells being GFP-single positive. (A,B) Twin clone analysis in wing imaginal discs. (A,A’) In wing imaginal discs, the GFP-double-positive clones in wild-type/wild-type twins are slightly larger (twin-clone size ratio x ¯ = 0.895 ± 0.091). (B,B’) The reverse is true for wing disc wild-type/Ptp61FΔ/Δ twin-clones, with the GFP-negative mutant clones being generally larger (twin-clone size ratio x ¯ = 1.244 ± 0.093). (CD) Twin clone analysis in eye-antennal imaginal discs. (C,C’) In eye-antennal imaginal discs, the GFP-double-positive clones in wild-type/wild-type twin-clones are again generally larger (twin-clone size ratio x ¯ = 0.680 ± 0.072). (D,D’) Similarly, eye-antennal wild-type/Ptp61FΔ/Δ twin-clones have generally larger GFP-negative mutant clones (twin-clone size ratio x ¯ = 1.712 ± 0.228). (E) Quantification of L3 wing imaginal disc clone size profiles from wild-type/wild-type and wild-type/Ptp61FΔ/Δ twin-clone pairs. Green bars indicate the GFP-double-positive clone of the twin-clone pair, and red bars indicate the GFP-negative clone, and use the lower x-axis. Yellow rectangles indicate the average GFP-negative/GFP-double-positive clone area ratios, and use the upper x-axis, showing that Ptp61FΔ/Δ clones are significantly larger that the wild-type twin-clones (Student’s t-test, d.f. = 39, t = 3.169, p < 0.01). (F) Quantification of L3 eye-antennal imaginal disc clone size profiles from wild-type/wild-type and wild-type/Ptp61FΔ/Δ twin-clone pairs. Green bars indicate the GFP-double-positive clone of the twin-clone pair, and red bars indicate the GFP-negative clone, and use the lower x-axis. Yellow rectangles indicate the average GFP-negative/GFP-double-positive clone area ratios, and use the upper x-axis, showing that Ptp61FΔ/Δ clones are significantly larger that the wild-type twin-clones (Student’s t-test, d.f. = 47, t = 4.272, p < 0.0001). ** = p < 0.01, **** = p < 0.0001. Error bars = S.E.M. Note that clones were observed in all regions of both the eye-antennal and wing disc tissues, but that the figures show representative clones with GFP-negative/GFP-double-positive clone area ratios close to the average. Confocal microscopy images are single planes. Boxes in (AD) are represented in (A’D’), and dotted lines outline the tissue. Scale bars = 100 μm.
Ijms 22 12732 g001
Figure 2. Ptp61F contributes to scrib-mutant clone elimination. (A) Diagram of our experimental process and hypothesis. (BE) Confocal images of L3 eye-antennal imaginal discs of the indicated genotypes (boxes at top, white indicates GFP-positive clones, black indicates remaining GFP-negative tissue) taken from animals where clones were generated via MARCM to express transgenes in scrib-mutant, GFP-positive cells. (B,C) When GFP-positive tissue is wild-type (B) it makes up ~40% of the tissue (n = 26, x ¯ = 0.386 ± 0.013), and Ptp61FRNAi expression (C) does not significantly alter the contribution of the clones to the tissue (n = 64, x ¯ = 0.397 ± 0.008) (Student’s t-test, d.f. = 88, t = 0.7263, p > 0.05). (D,E) scrib-mutant clones (D) make up only ~11% of the tissue (n = 88, x ¯ = 0.113 ± 0.003), but Ptp61FRNAi expressed in scrib-mutant clones (E) leads to a small, but statistically significant increase in clonal volume to ~13% (n = 144, x ¯ = 0.127 ± 0.003) (Student’s t-test, d.f. = 230, t = 2.829, p < 0.01). (F) Quantification of the clone tissue volume contributions, as measured by the ratio of GFP-positive tissue to DAPI-positive tissue, showing that Ptp61F knockdown significantly increases the size of scrib-mutant clones. Note that Dcr-2 is also expressed wherever GFP is expressed. ** = p < 0.01. Error bars = S.E.M. Confocal microscopy images are maximum intensity projections. White dotted lines outline the tissue, red dotted lines indicate tissue excluded from quantification for consistency. Scale bars = 100 μm.
Ijms 22 12732 g002
Figure 3. Stat92E is required for rescue of scrib-mutant clone size by Ptp61F knockdown. (AH) Confocal images of L3 eye-antennal imaginal discs of the indicated genotypes (boxes at top, white indicates GFP-positive clones, black indicates remaining GFP-negative tissue) taken from animals where clones were generated via MARCM to express transgenes in GFP-positive cells. (AD) Wild-type clones (A) and Ptp61FRNAi-expressing (B) clones appear largely the same (for statistics see Figure 2). Stat92ERNAi expression in a wild-type background ((C); n = 48, x ¯ = 0.208 ± 0.005) leads to significantly smaller clones compared to the wild-type control (one-way ANOVA ((F) (3,175) = 193.3, p < 0.0001), with Tukey’s multiple comparisons (p < 0.0001)), and combining Stat92E and Ptp61F knockdown in a wild-type background ((D); n = 41, x ¯ = 0.192 ± 0.006) does not result in significantly different clone sizes to Stat92E knockdown alone (one-way ANOVA ((F) (3,175) = 193.3, p > 0.05), with Tukey’s multiple comparisons (p > 0.05)), but does significantly reduce the average clone size relative to Ptp61FRNAi clones (one-way ANOVA ((F) (3,175) = 193.3, p > 0.05), with Tukey’s multiple comparisons (p > 0.05)). (EH) Clones homozygous mutant for scrib (E) have their reduced volume somewhat rescued by Ptp61F knockdown (F) (for statistics see Figure 2). Knockdown of Stat92E in a scrib-mutant background ((G); n = 51, x ¯ = 0.050 ± 0.002) leads to clones that are significantly smaller in their contribution to the tissue volume than the scrib-mutant control (one-way ANOVA ((F) (3,342) = 97.72, p < 0.0001), with Tukey’s multiple comparisons (p < 0.0001)). Simultaneous knockdown of Stat92E and Ptp61F in scrib1/1 clones ((H); n = 63, x ¯ = 0.075 ± 0.003) led to a statistically significant increase in clone volume relative to scrib-mutant, Stat92E knockdown clones (one-way ANOVA ((F) (3,342) = 97.72, p < 0.0001), with Tukey’s multiple comparisons (p < 0.001)), and also resulted in a statistically significant decrease in clone volume compared to scrib-mutant, Ptp61FRNAi-expressing clones (one-way ANOVA ((F) (3,342) = 97.72, p < 0.0001), with Tukey’s multiple comparisons (p < 0.0001)). (I) Quantification of the clone tissue volume contributions, as measured by the ratio of GFP-positive tissue to DAPI-positive tissue, showing that simultaneous Ptp61F and Stat92E knockdown significantly increases the size of scrib-mutant clones compared to Stat92E knockdown alone in scrib-mutant clones. Note that some sample sets here are taken from Figure 2, as the experiments were performed under the same conditions and soon afterwards allowing them to be utilised as controls. Note that Dcr-2 is also expressed wherever GFP is expressed. ** = p < 0.01, *** = p < 0.001, **** = p < 0.0001. Error bars = S.E.M. Confocal microscopy images are single planes. White dotted lines outline the tissue, red dotted lines indicate tissue excluded from quantification for consistency. Scale bars = 100 μm.
Ijms 22 12732 g003
Figure 4. Nuclear-localised PTP61F expression reduces the relative fitness of wild-type cells during polarity-impaired cell competition. (A) Diagram of our experimental process and hypothesis. (BE,GJ) Confocal images of L3 eye-antennal imaginal discs of the indicated genotypes (boxes at top, white indicates GFP-positive clones, black indicates remaining GFP-negative tissue) taken from animals where clones had been generated via revMARCM to express transgenes in cells that are otherwise wild-type, alongside cells that are GFP-negative and scrib-mutant. (B,C) When GFP-negative tissue is wild-type it makes up ~60% of the whole tissue when GFP-positive clones are wild-type ((B); n = 36, x ¯ = 0.572 ± 0.008), but Ptp61Fn2.1 expression leads to the GFP-negative tissue making up ~70% of the total tissue volume ((C); n = 27, x ¯ = 0.679 ± 0.010), a statistically significant increase (Student’s t-test, d.f. = 61, t = 8.456, p < 0.0001). (D,E) When GFP-negative tissue is homozygous mutant for scrib1, it only contributes to ~30% of the whole tissue when surrounded by wild-type clones ((D); n = 36, x ¯ = 0.317 ± 0.013), but Ptp61Fn2.1 expression significantly increases the scrib1/1 GFP-negative tissue contribution to ~50% of the total volume ((E); n = 34, x ¯ = 0.482 ± 0.011), also a statistically significant result (Student’s t-test, d.f. = 68, t = 9.331, p < 0.0001). (F) Quantification of the clone tissue volume contributions in (BE), as measured by the ratio of GFP-negative tissue to DAPI-positive tissue. (G,H) When the tissue is entirely functionally wild-type GFP-positive clones make up ~60% of the tissue ((G); n = 10, x ¯ = 0.685 ± 0.014), and when Ptp61FRNAi is expressed adjacent to wild-type clones ((H); n = 20, x ¯ = 0.621 ± 0.028), there is no significant difference in contributing volumes (Student’s t-test, d.f. = 28, t = 1.565, p > 0.05). (I,J) Contrastingly, when wild-type GFP-positive clones are adjacent to scrib-mutant clones, the mutant tissue makes up ~50% of the tissue ((I); n = 25, x ¯ = 0.467 ± 0.015), but when Ptp61FRNAi is expressed adjacent to scrib-mutant clones ((J); n = 20, x ¯ = 0.328 ± 0.020), the mutant clone sizes are significantly reduced to ~33% (Student’s t-test, d.f. = 43, t = 5.730, p < 0.0001). (K) Quantification of the clone tissue volume contributions in (GJ), as measured by the ratio of GFP-negative tissue to DAPI-positive tissue. Note that Dcr-2 is also expressed wherever GFP is expressed in (GJ). **** = p < 0.0001. Error bars = S.E.M. Confocal microscopy images are single planes. White dotted lines outline the tissue, red dotted lines indicate tissue excluded from quantification for consistency. Scale bars = 100 μm (BE,GJ).
Ijms 22 12732 g004
Figure 5. Activated RAS85D-driven polarity-impaired tumorigenesis is modified by PTP61F levels in L3 eye-antennal epithelial tissue. (AD) Confocal images of eye-antennal/epithelial-brain complexes of the indicated genotypes taken from L3 animals (generated using the eyFLP; Act >> GAL4 (EAG) system, also expressing GFP, Ras85DV12 and RNAi against dlg1 (EAGRD)). Tissues are stained with phalloidin to detect F-actin and DAPI to detect DNA. (A) EAG > GFP tissue shows the regular morphology of the eye-antennal discs (outlined in white) and the optic lobes and ventral nerve cord of the larval brain (outlined in yellow). (B) EAGRD > GFP tissue shows tissue overgrowth and perturbed cell morphology. (C,C’) EAGRD-driven tissue overgrowth is enhanced by co-expression of RNAi against Ptp61F. (D,D’) EAGRD-driven tissue overgrowth is suppressed by overexpression of Ptp61Fn2.1. (E) Quantification of the effect of EAG/EAGRD and alteration of Ptp61F levels on development. While EAG-driven expression of GFP, Ptp61FRNAi, or Ptp61Fn2.1 does not appear to have any effect on development, EAGRD-driven expression of GFP in the control results in developmental arrest in most animals (~90%) at the early pupal stage, while ~5% of animals stall as overgrown (giant) larvae and ~5% reach the late pupal stage. EAGRD-driven expression of Ptp61FRNAi further stalled development, with no late-stage pupae being observed, and only ~40% reaching the early pupal stage, while EAGRD-driven expression of Ptp61Fn2.1 somewhat rescued development, with ~80% of animals reaching the late pupal stage, though none successfully eclosed. (FH) Examples of how the developmental phenotypes were graded. The distinction between early and late pupae relied on the observation of adult structures such as wings and legs (arrows). Confocal microscopy images are maximum intensity projections. White dotted lines outline the eye-antennal imaginal discs, and yellow dotted lines outline the brain structures where relevant. Scale bars = 100 μm.
Ijms 22 12732 g005
Figure 6. PTP61F represses tyrosine phosphorylation and JAK–STAT activity in activated RAS85D-driven polarity-impaired tumors. (A) Western blotting for the presence of tyrosine phosphorylated (pTyr) proteins and Tubulin protein levels in lysates from L3 eye-antennal imaginal disc tissues. Ptp61FRNAi or Ptp61Fn2.1 was expressed throughout the eye-antennal tissue using the EAGRD system. (B) Quantification of pTyr levels. Relative to the Tubulin loading control, pTyr levels are higher in EAGRD samples expressing Ptp61FRNAi, and lower in those expressing Ptp61Fn2.1, relative to the control. (C) Western blotting for β-gal (STAT92E-lacZ), phosphorylated and activated ERK (pERK), and ERK protein levels in lysates from L3 eye-antennal imaginal disc tissues. Ptp61FRNAi or Ptp61Fn2.1 was expressed throughout the eye-antennal tissue using the EAG or EAGRD systems. (D) Quantification of pERK and β-gal levels. While pERK is essentially undetectable in the EAG controls (relative to total ERK as a loading control), it is upregulated in EAGRD samples, and even more so upon Ptp61F knockdown, while being reduced upon PTP61Fn overexpression. JAK-STAT activity (as assessed using the STAT92E-lacZ reporter and measuring β-gal levels) was reduced upon Ptp61Fn expression, but Ptp61F knockdown had no notable effect. Note that in both (B,D), the numbered columns correspond to the numbered lanes in (A,C), respectively.
Ijms 22 12732 g006
Figure 7. PTP61F represses JAK–STAT signalling pathway activity in activated RAS85D-driven polarity-impaired tumorigenic tissue. (AD) Confocal images of L3 eye imaginal disc epithelial tissue containing the 10×Stat92E-GFP reporter of JAK–STAT signalling pathway activity, the eq-GAL4 driver transgene and UAS-RFP expression to mark the eq expression domain, was examined for expression levels of STAT92E-GFP and also stained with DAPI to mark DNA. (BD) Ras85DV12 and RNAi against dlg1 are also expressed to generate tumorigenic tissue within the eq domain. (A,A,A’’) eq > RFP control discs demonstrate basal levels of STAT92E-GFP expression, a readout of JAK–STAT pathway activity. (B,B’,B’’) eq > RFP, Ras85DV12, dlg1RNAi discs possess an enlarged eq expression domain and elevated levels of STAT92E-GFP. (C,C’,C’’) eq > RFP, Ras85DV12, dlg1RNAi discs also expressing Ptp61Fn4.1 show a reduction in the eq expression domain area, as well as a slight reduction in STAT92E-GFP level. (D,D’,D’’) eq > RFP, Ras85DV12, dlg1RNAi discs that are heterozygous mutant for Ptp61F (Ptp61FΔ/+) show further expansion of the eq expression domain, but only a non-significant increase in STAT92E-GFP expression. (E) Quantification of the STAT92E-GFP pixel intensity within the eq expression domain relative to surrounding wild-type tissue, showing that overexpression of PTP61F reduces STAT92E-GFP expression. (F) Quantification of the eq domain area relative to the total eye disc area. Ptp61Fn4.1 expression decreases the size of the eq expression domain, whilst heterozygosity for Ptp61F increases the eq domain region, relative to the eq > RFP, Ras85DV12, dlg1RNAi control. Statistical tests used were one-way ANOVAs with Newman–Keuls multiple comparisons tests. * = p < 0.05, ** = p < 0.01, *** = p < 0.001, **** = p < 0.0001. Error bars = S.E.M. Confocal microscopy images are maximum intensity projections. Scale bars = 50 µm.
Ijms 22 12732 g007
Figure 8. A model for PTP61F and JAK–STAT signalling during polarity-deficient cell competition. During polarity-deficient cell competition, the current model places the JAK–STAT pathway as having a role exclusively in the wild-type winner cells. JAK–STAT pathway activating ligands, the UPD molecules, are produced and secreted by polarity-deficient loser cells due to YKI activity and JNK signalling. JNK signalling itself is thought to be activated by RHO1-WND signalling, EGR-GRND signalling, and by a “competition signal” originating in the wild-type cells. This signal appears to lie downstream of JAK–STAT signalling, completing a cyclic process that culminates in the death and elimination of the polarity-deficient cells and the compensatory proliferation and persistence of the wild-type cells. However, we have identified a new role for JAK–STAT signalling within polarity-deficient cells. PTP61F, SOCS44A, and SOCS36E are all capable of downregulating the activity of the JAK–STAT signalling, and their knockdown slightly increases polarity-deficient cell survival, whereas knockdown of STAT92E has a strong effect on reducing polarity-deficient cell survival. This suggests JAK–STAT signalling is active within the polarity-deficient cells, contributing to their relative fitness. Whether JAK–STAT signalling is activated by autocrine UPD ligand signalling is unclear. Additionally, PTP61F also has an important non-cell-autonomous role in the wild-type cells in influencing the elimination of polarity-impaired cells, presumably by negatively regulating JAK–STAT signalling. Previously known data are shown in muted colours, while our findings are shown in bolder colours. Abbreviations: UPD = Unpaired, DOME = Domeless, HOP = Hopscotch, EGR = Eiger, GRND = Grindelwald, YKI = Yorkie, PTP61F = protein tyrosine phosphatase 61F, STAT92E = signal-transducer and activator of transcription protein at 92E, SOCS44A = suppressor of cytokine signalling at 44A, SOCS36E = suppressor of cytokine signalling at 36E, WND = Wallenda, JNK = c-Jun N-terminal Kinase, SWH = Salvador-Warts-Hippo, JRA = Jun-related antigen, KAY = Kayak.
Ijms 22 12732 g008
Publisher’s Note: MDPI stays neutral with regard to jurisdictional claims in published maps and institutional affiliations.

