
Pro-Inflammatory Serum Amyloid a Stimulates Renal Dysfunction and Enhances Atherosclerosis in Apo E-Deficient Mice

 , and
, and 
Abstract
:1. Introduction
2. Methods
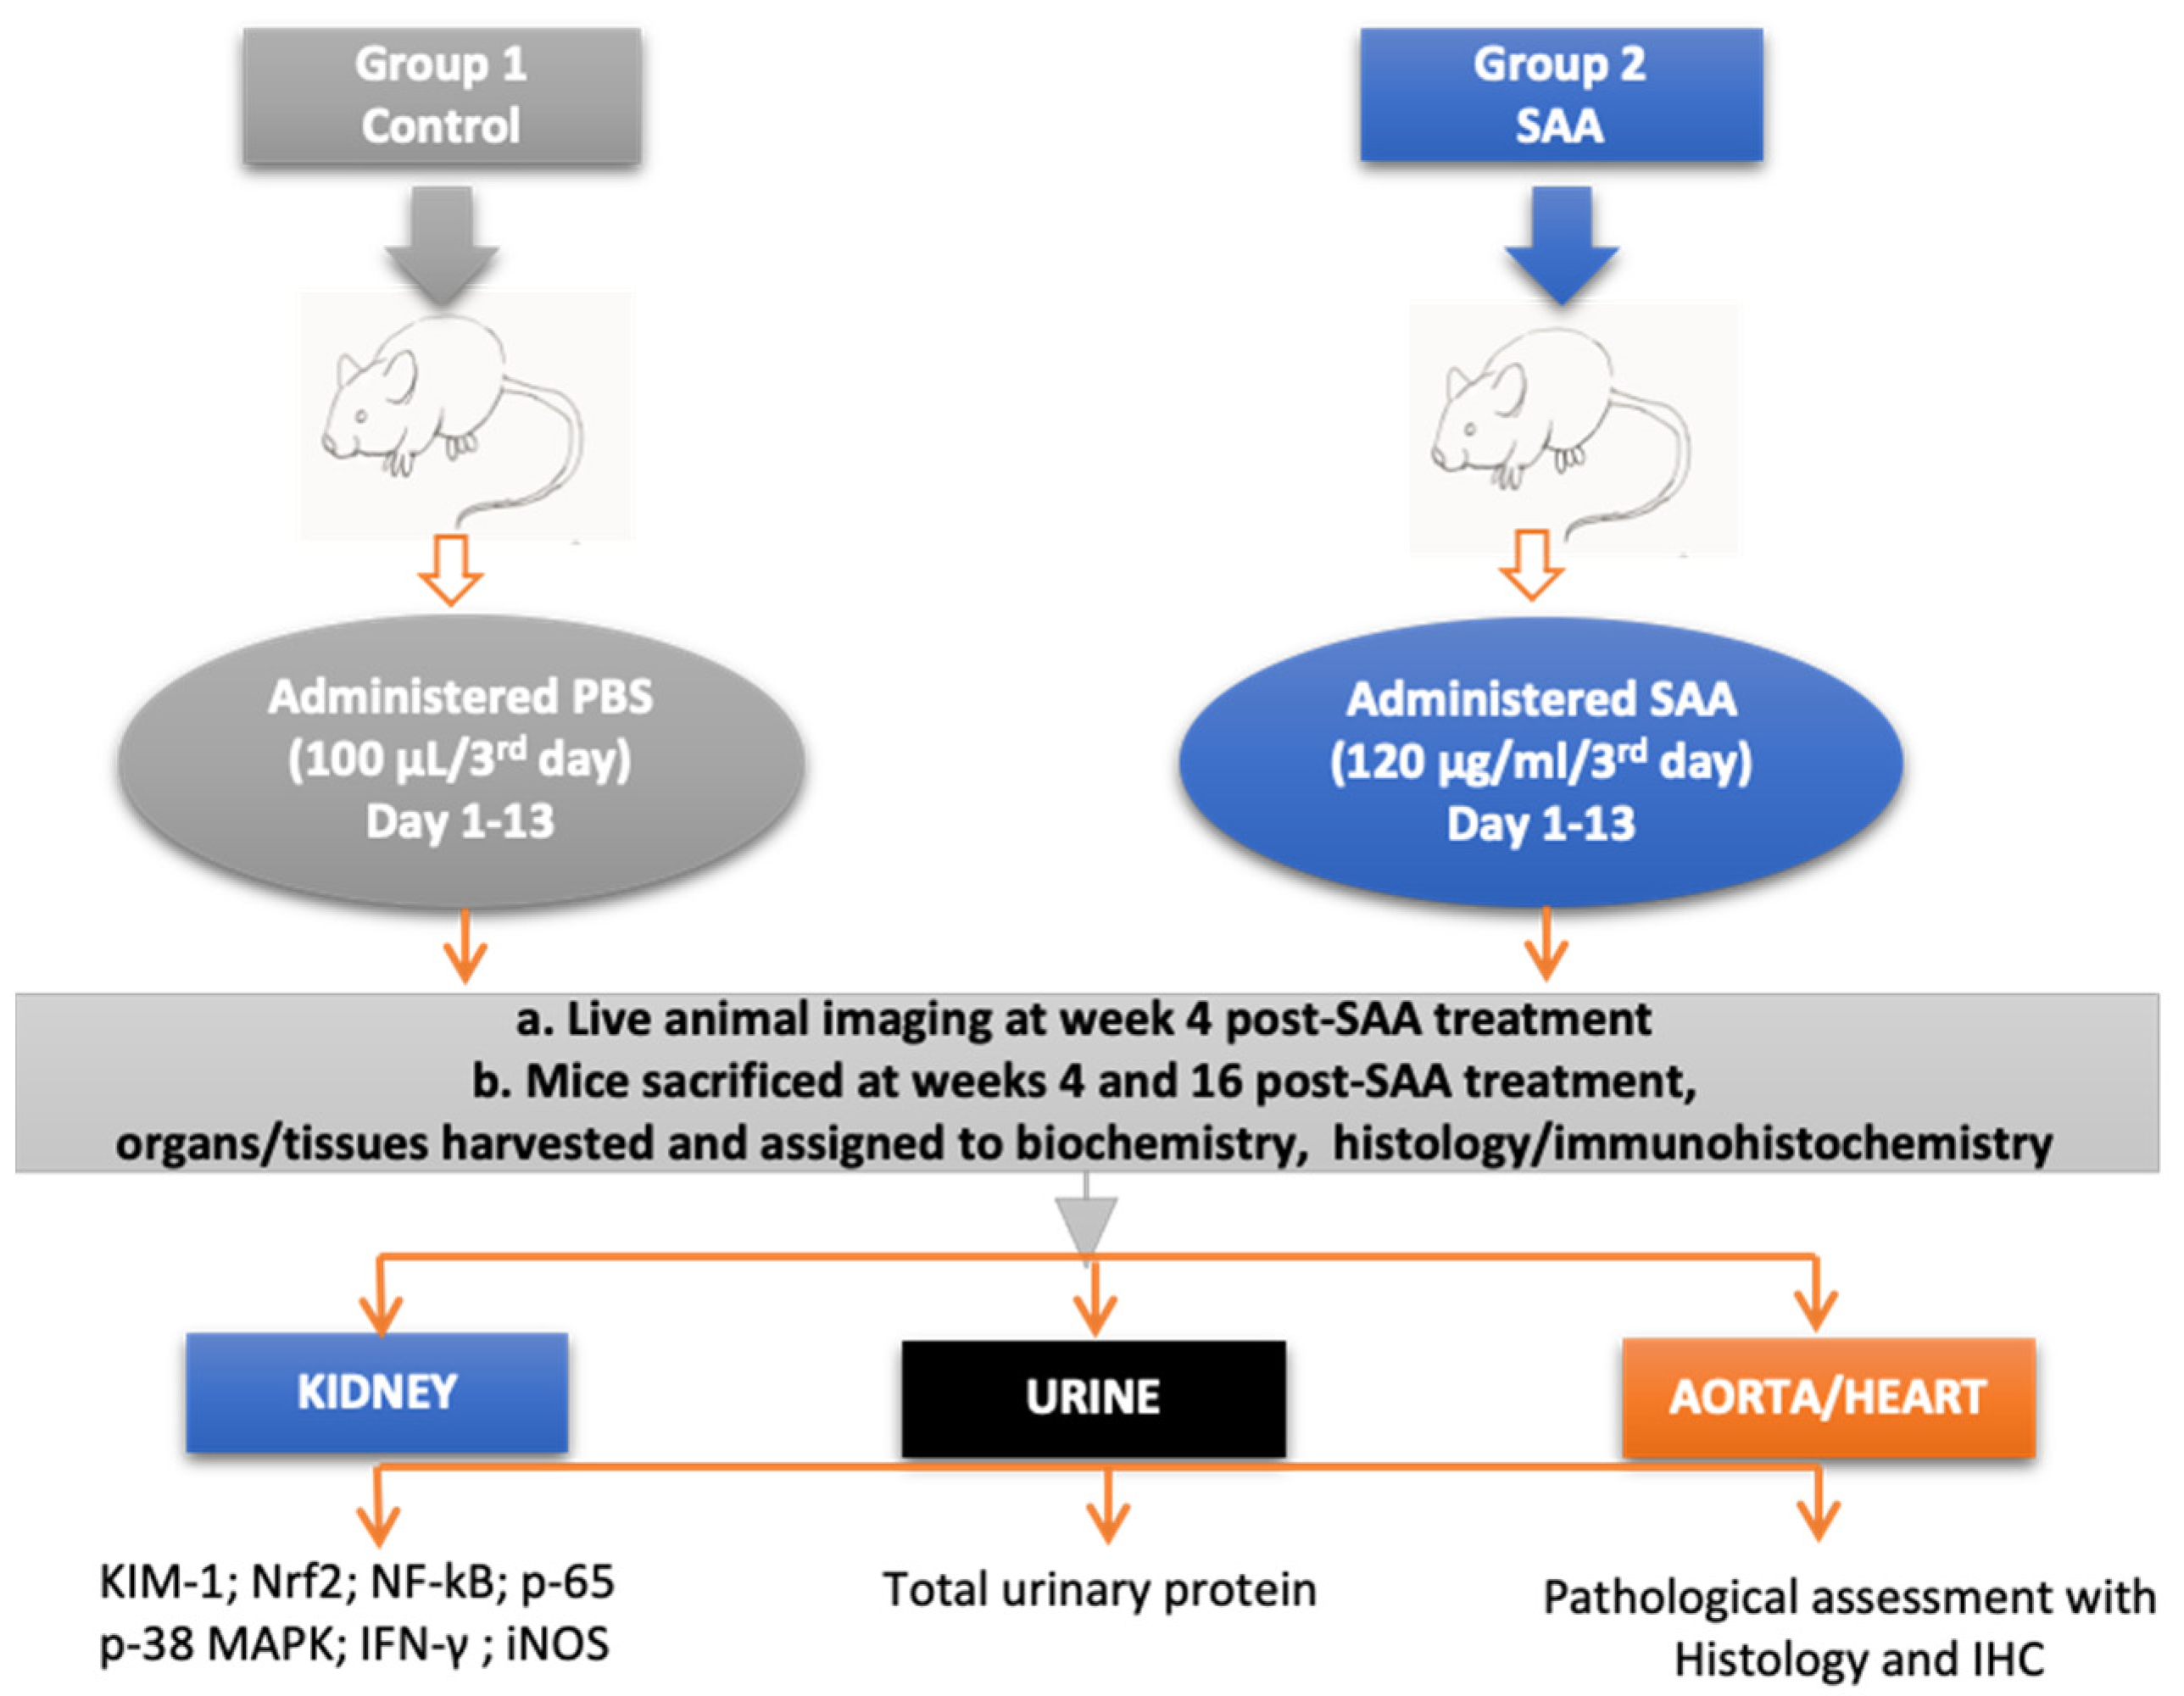
2.1. Murine Model
2.2. Experimental Groups
2.3. Live Animal Imaging
2.4. Urine Collection
2.5. Collection of Kidney Specimens
2.6. Kidney Homogenisation
2.7. Biochemical Assays
2.8. Assessment of Renal Injury Biomarkers
2.9. Assessment of Interferon-Gamma (IFN-γ) Content
2.10. SDS-PAGE and Western Blot Studies for p-p38 MAPK
3. Immunofluorescence (IF) Studies
3.1. Immunohistochemistry (IHC) Studies
3.2. Assessment of Tissue Fibrosis with Picrosirius Red Staining
4. Histological Assessment of Atherosclerotic Lesion Size and Composition
5. Statistical Analysis
6. Results
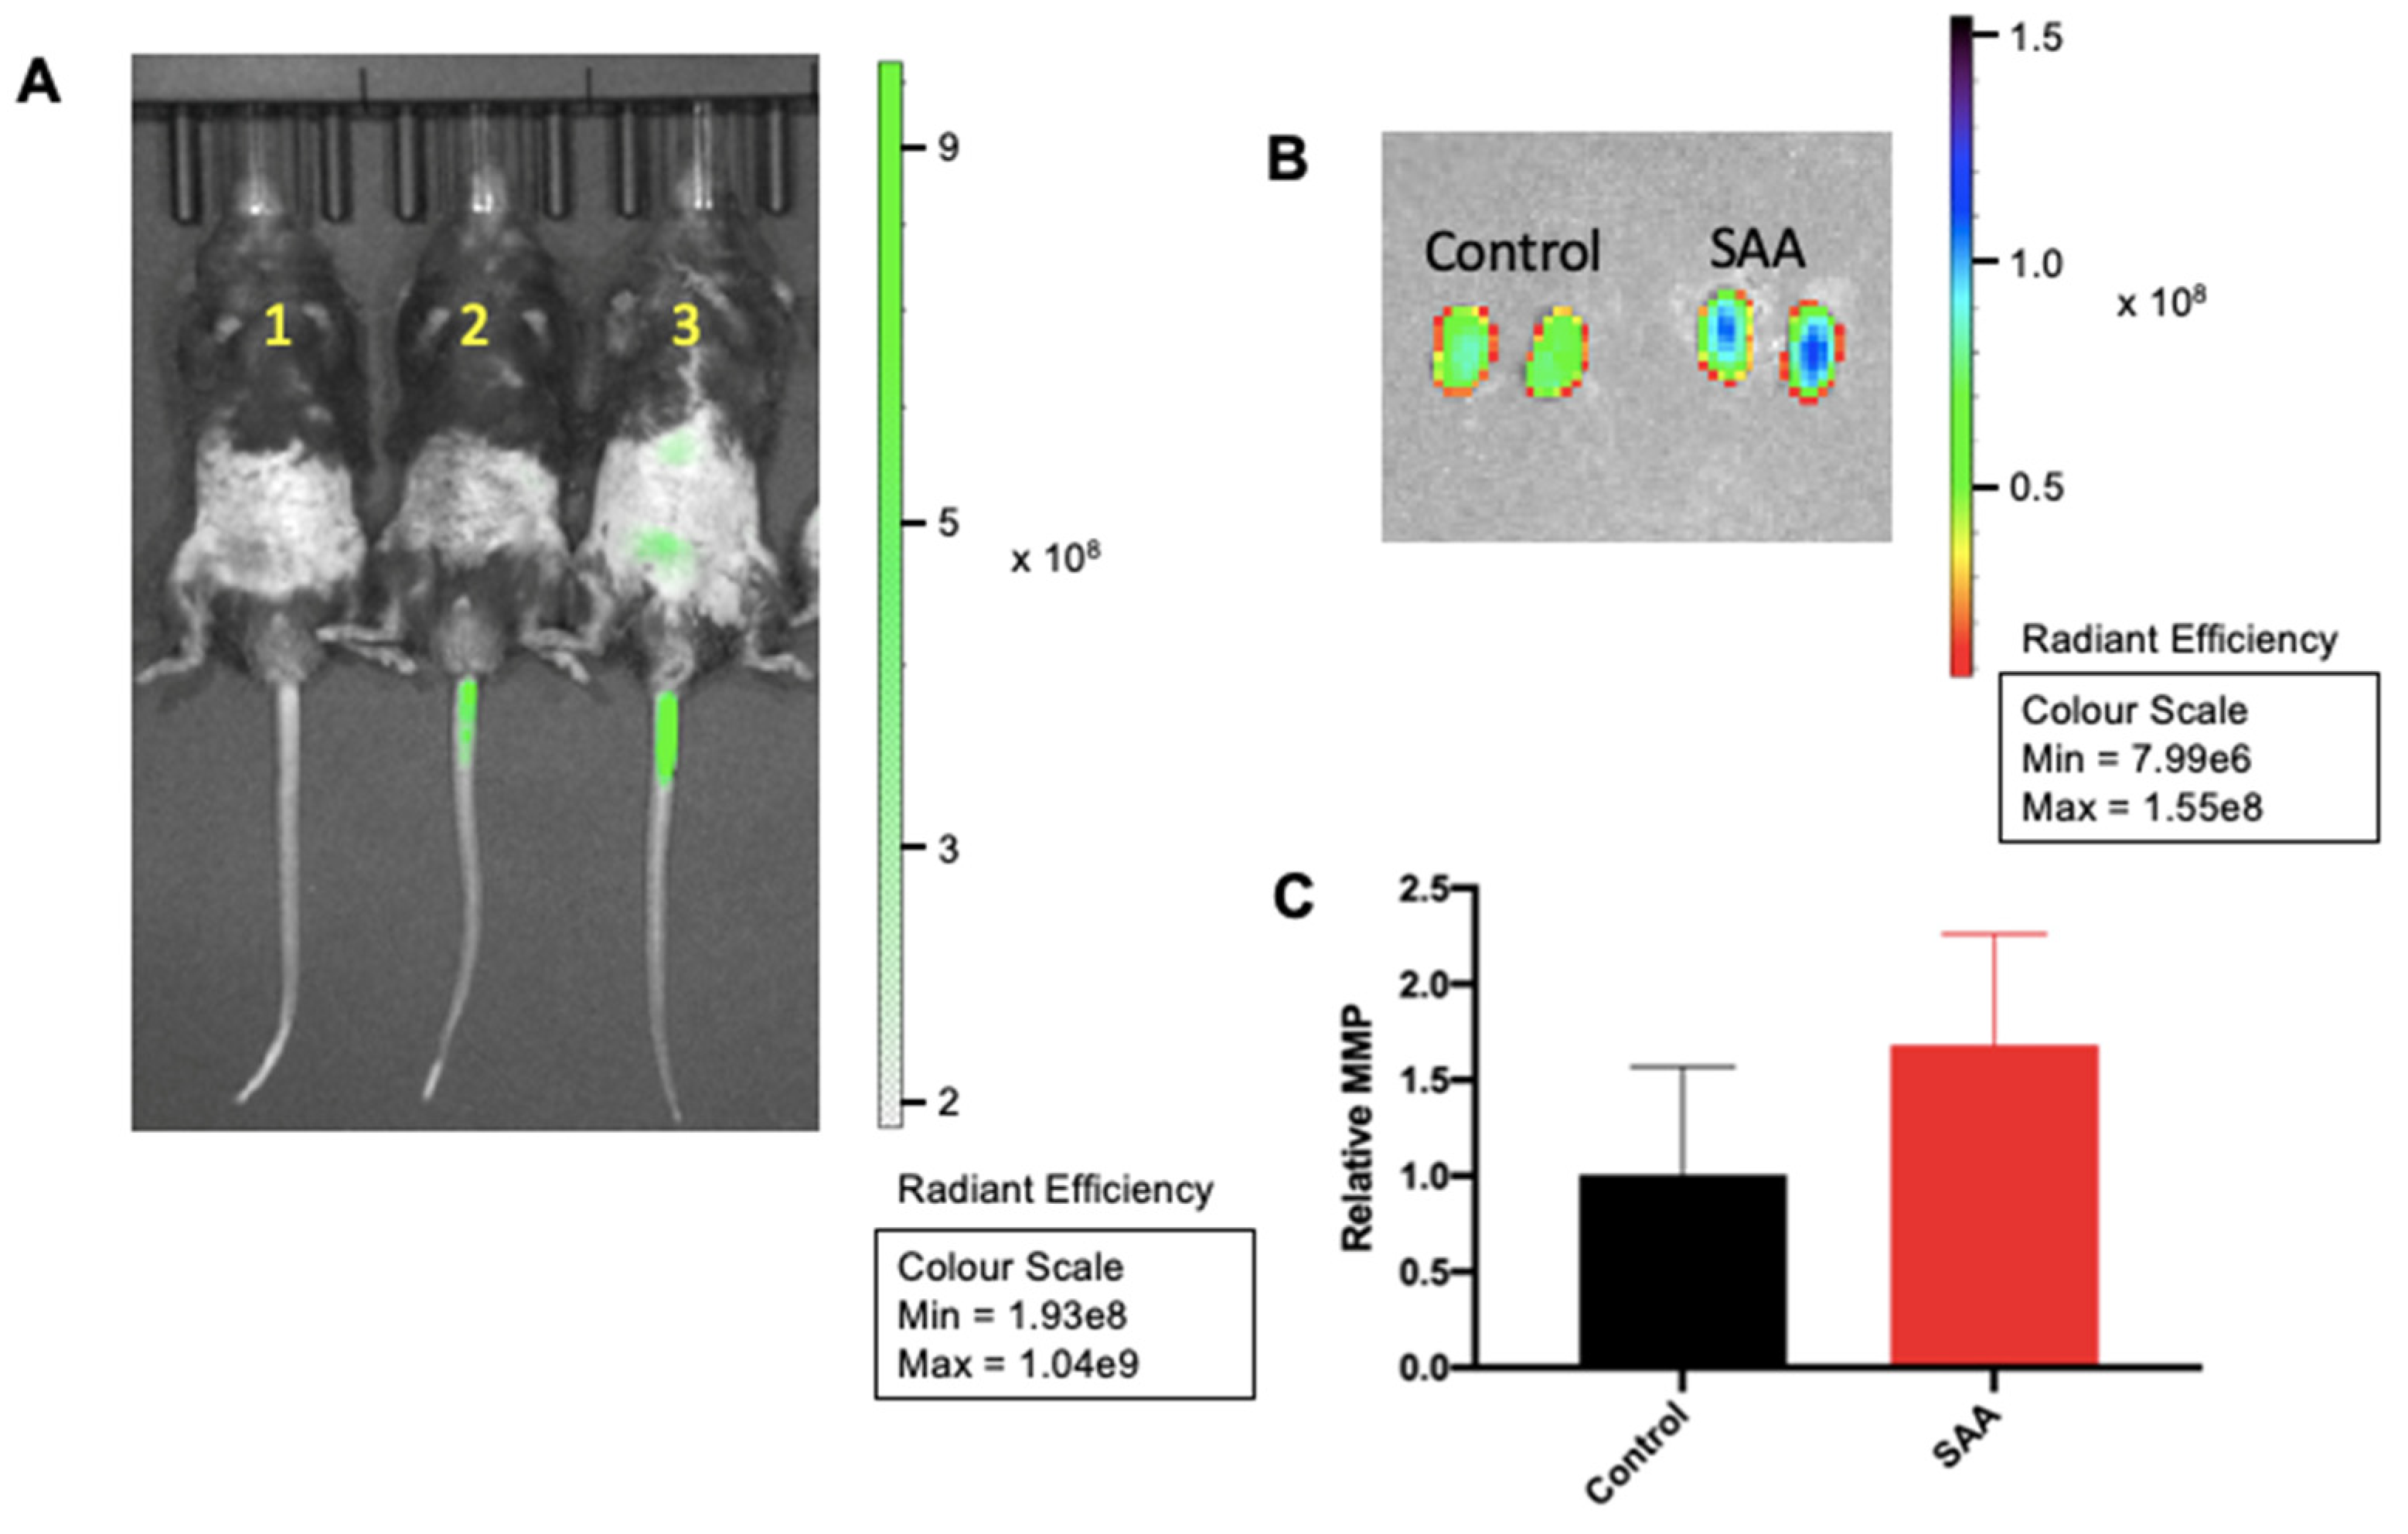
6.1. SAA Administration Stimulate MMPsense in Mouse Kidneys
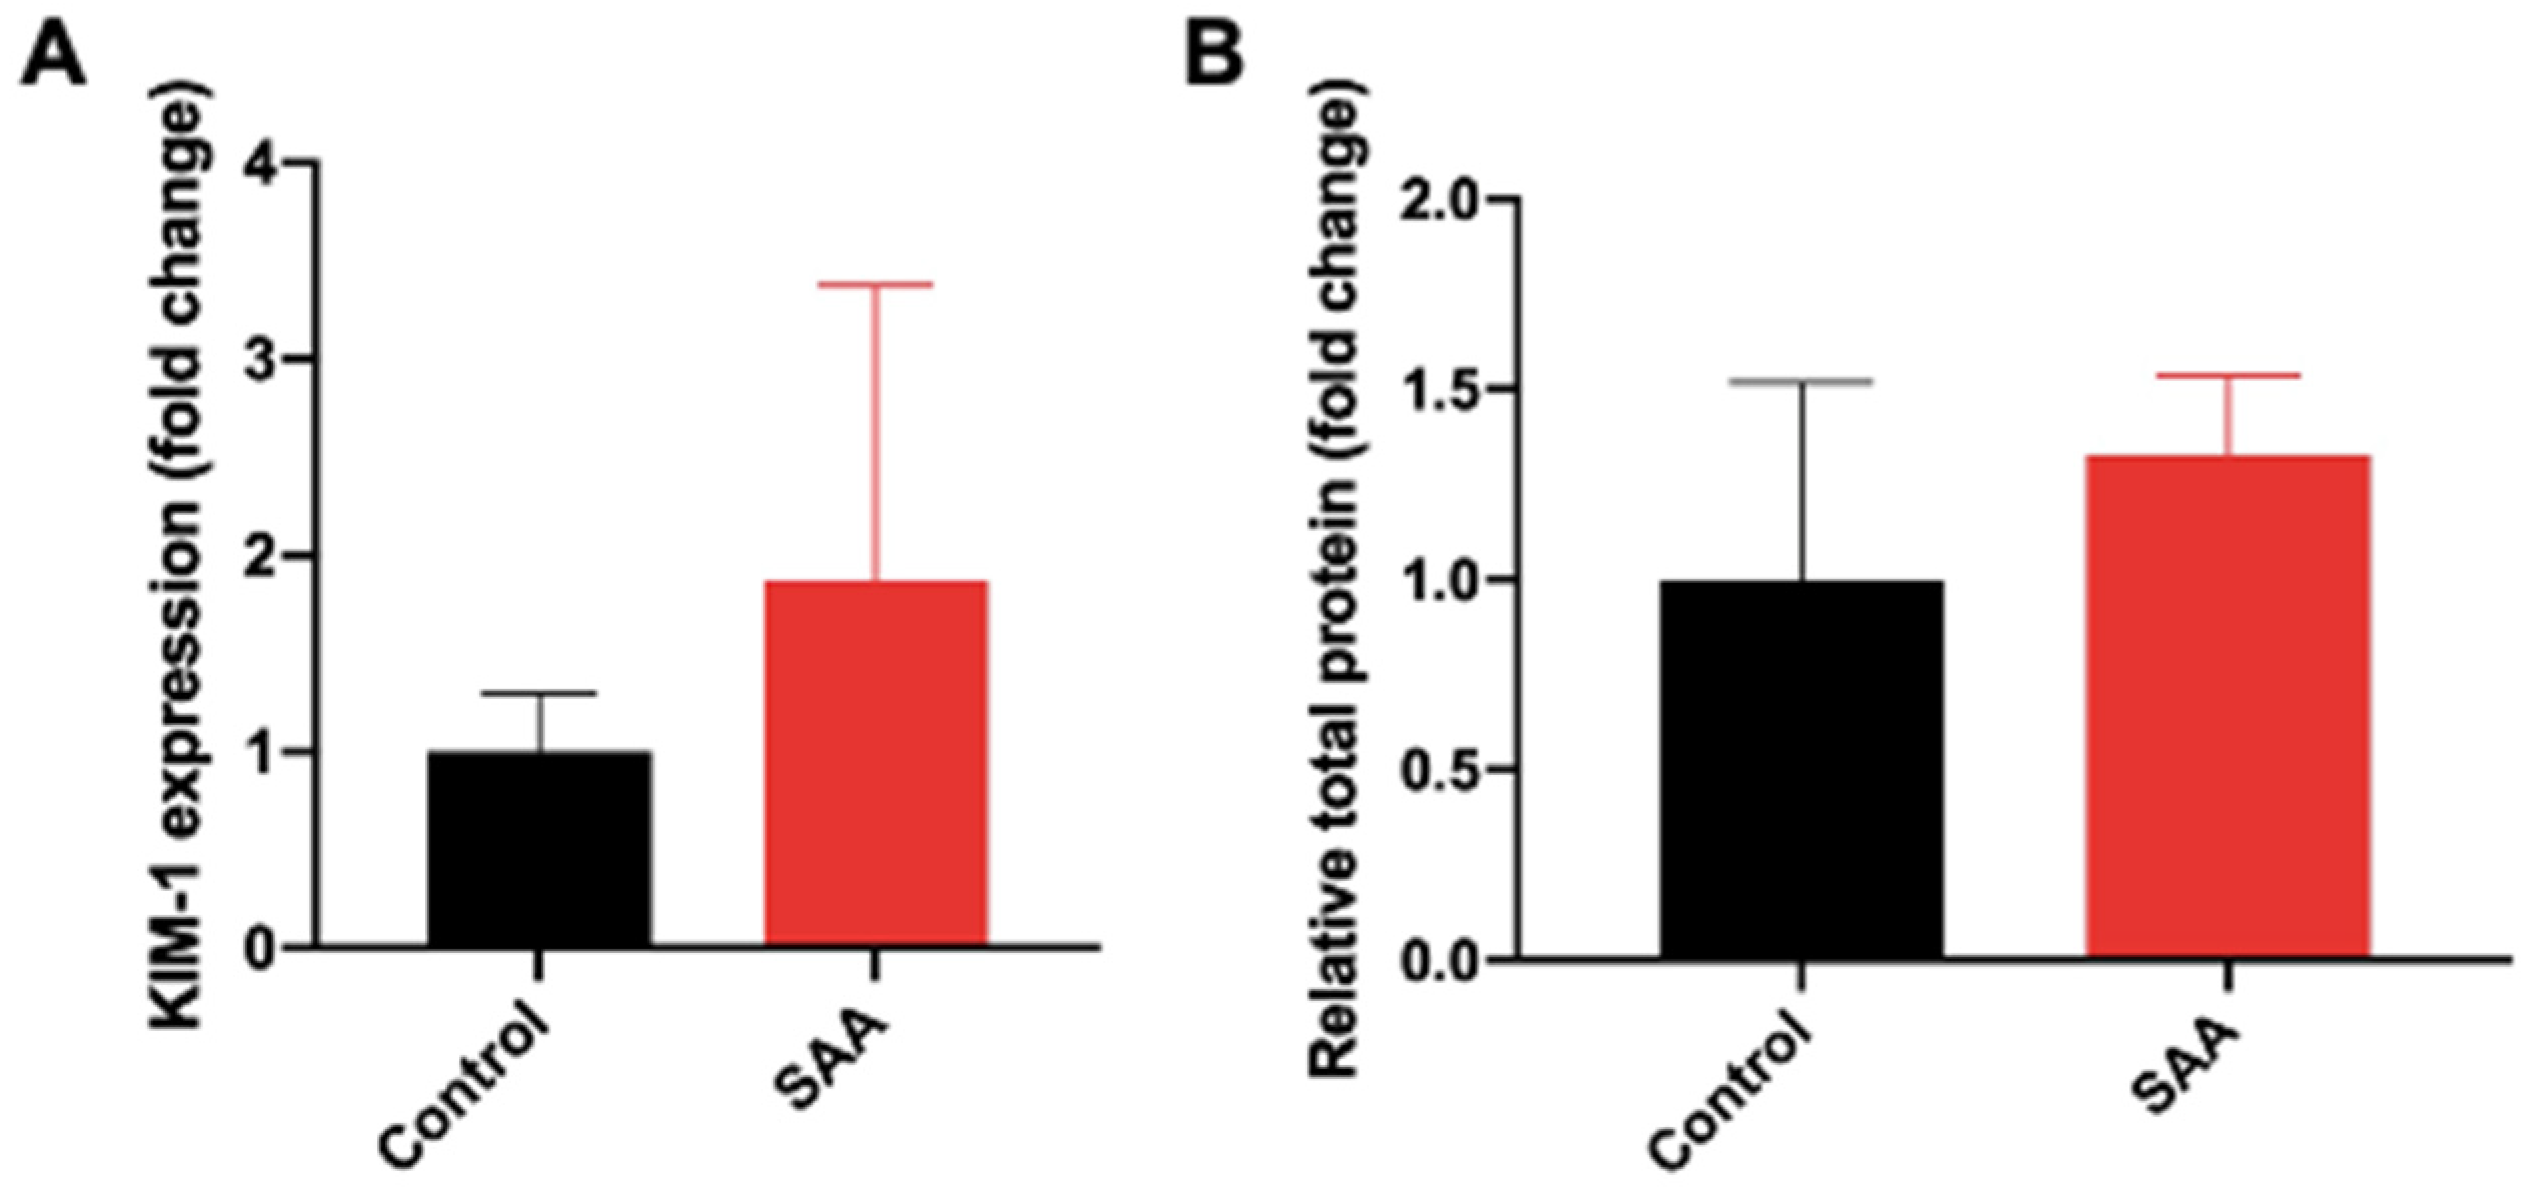
6.2. SAA Administration Causes Increased Expression of KIM-1 and Increased Secretion in Total Urinary Proteins
6.3. SAA Administration Stimulates Tissue Antioxidant Response
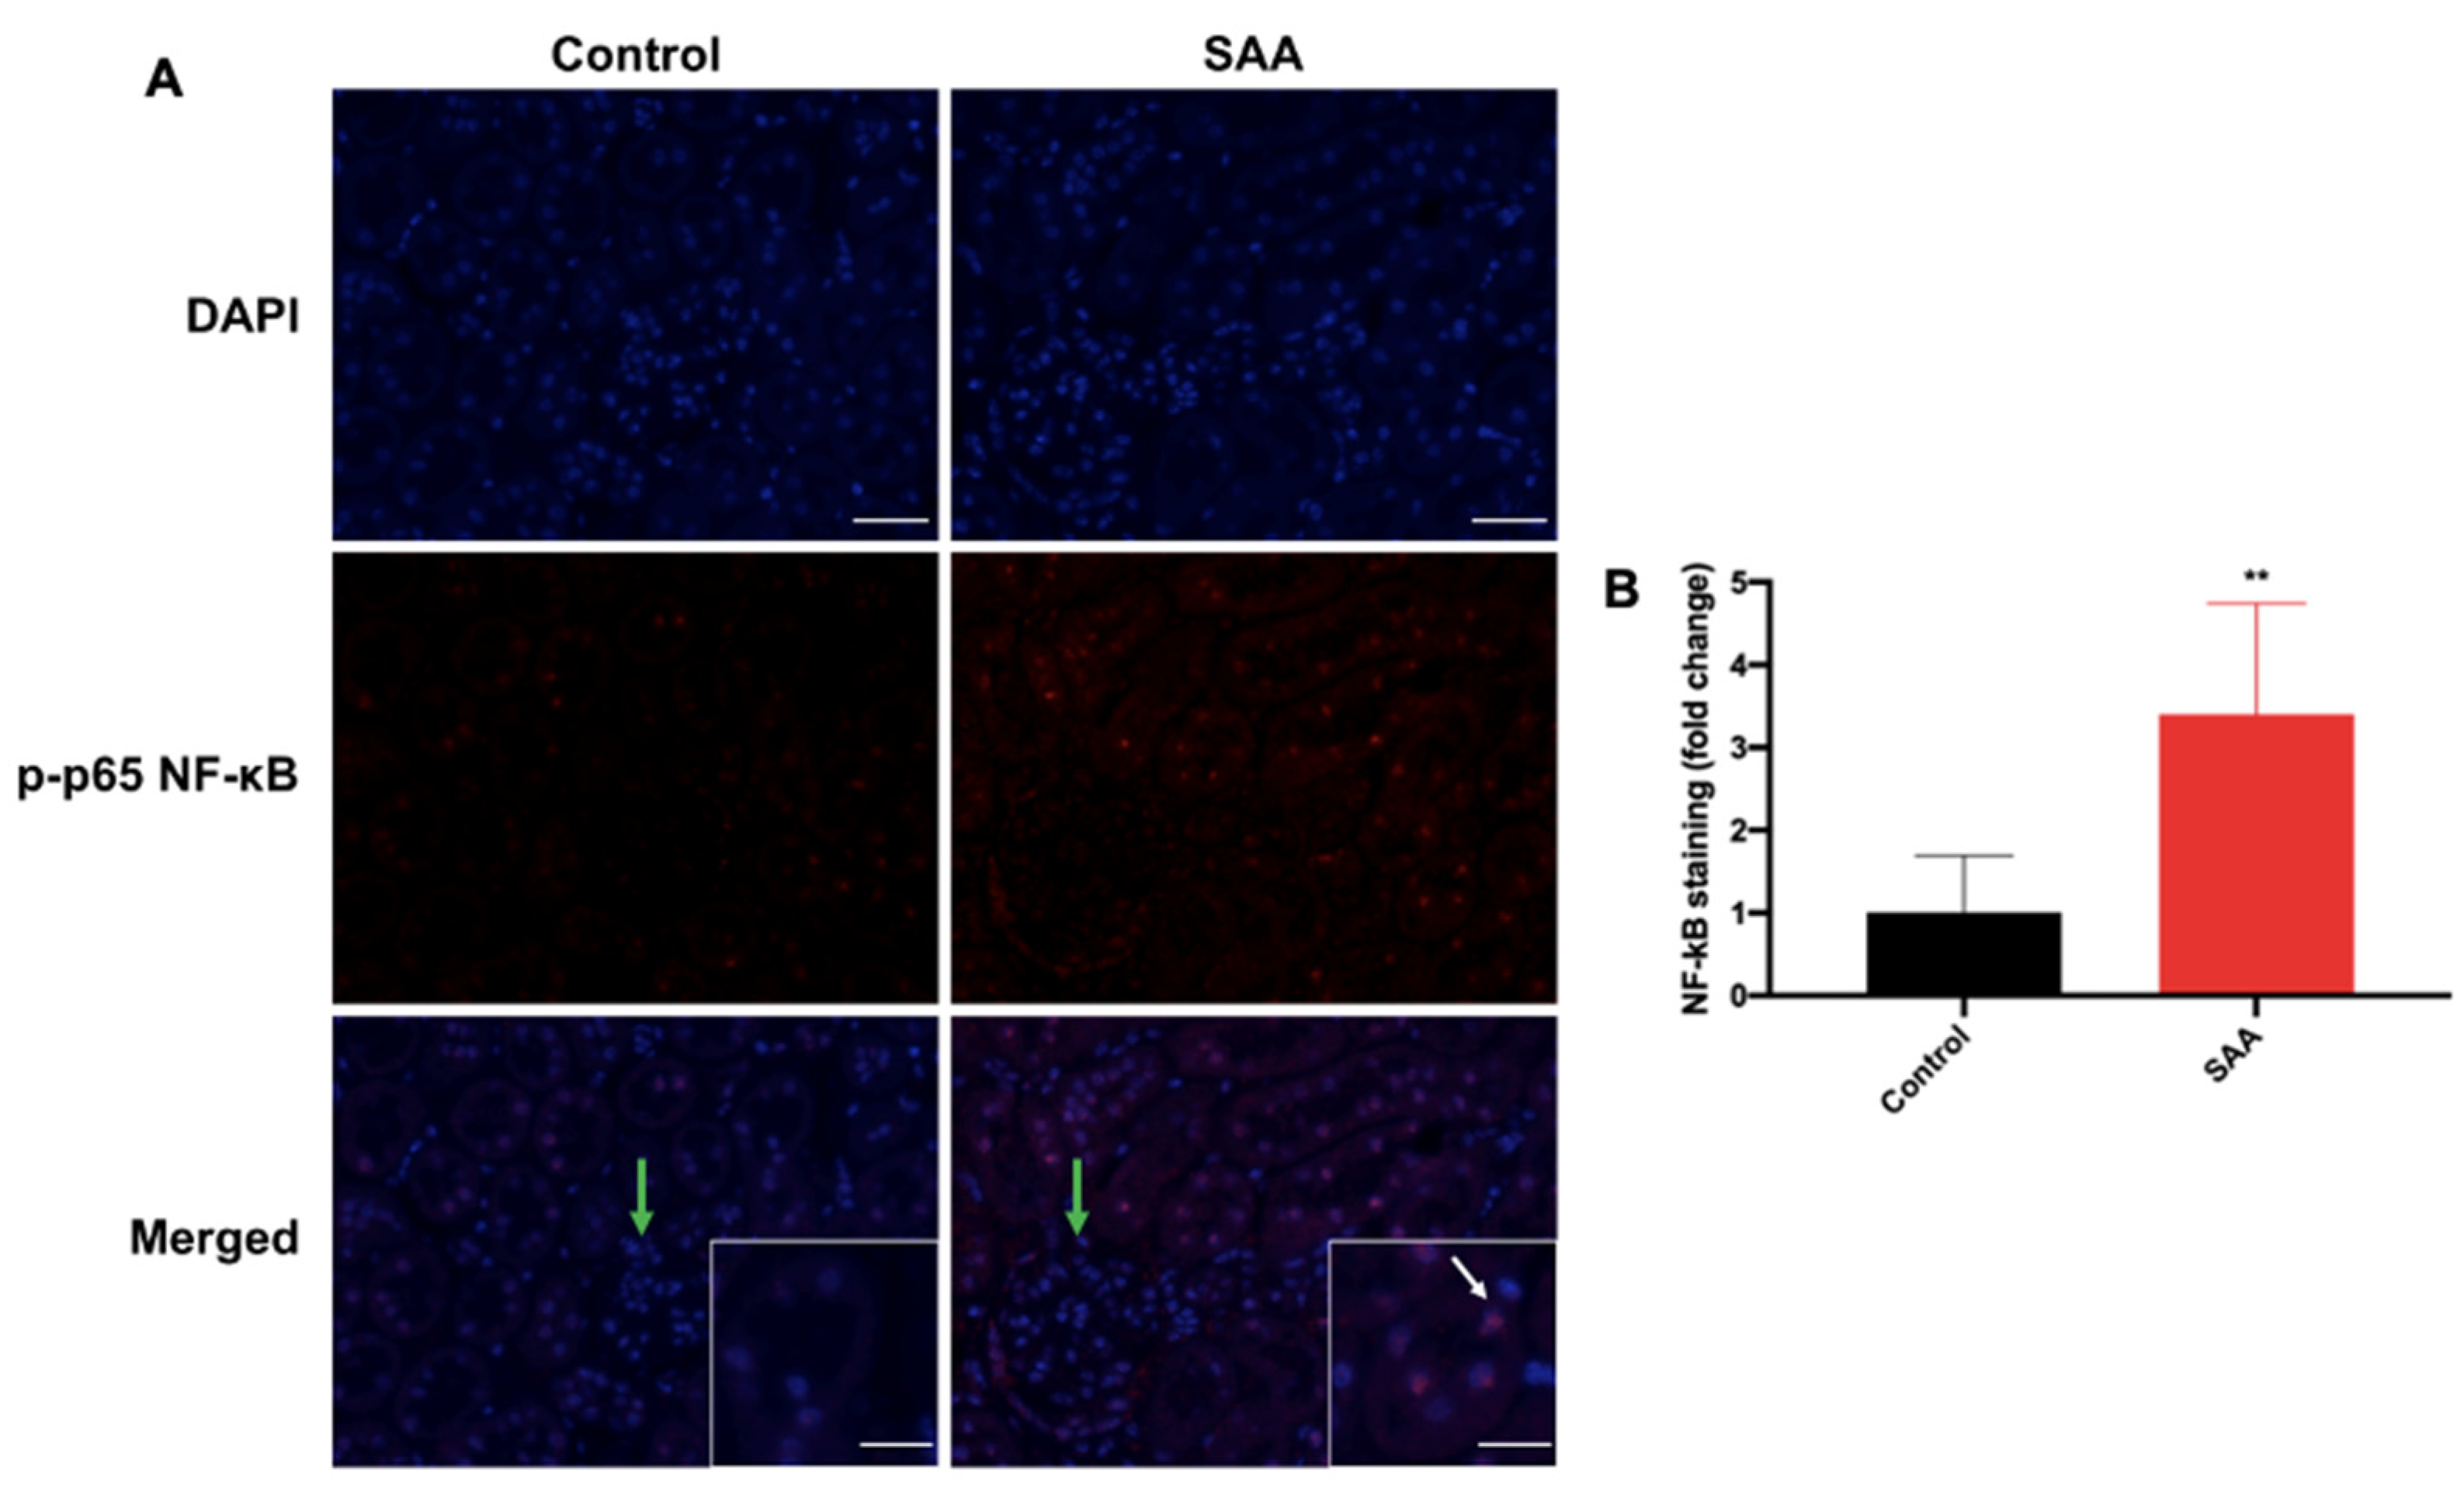
6.4. SAA Administration Stimulates Phospho-NF-kB p-65 Expression in the Renal Tissue
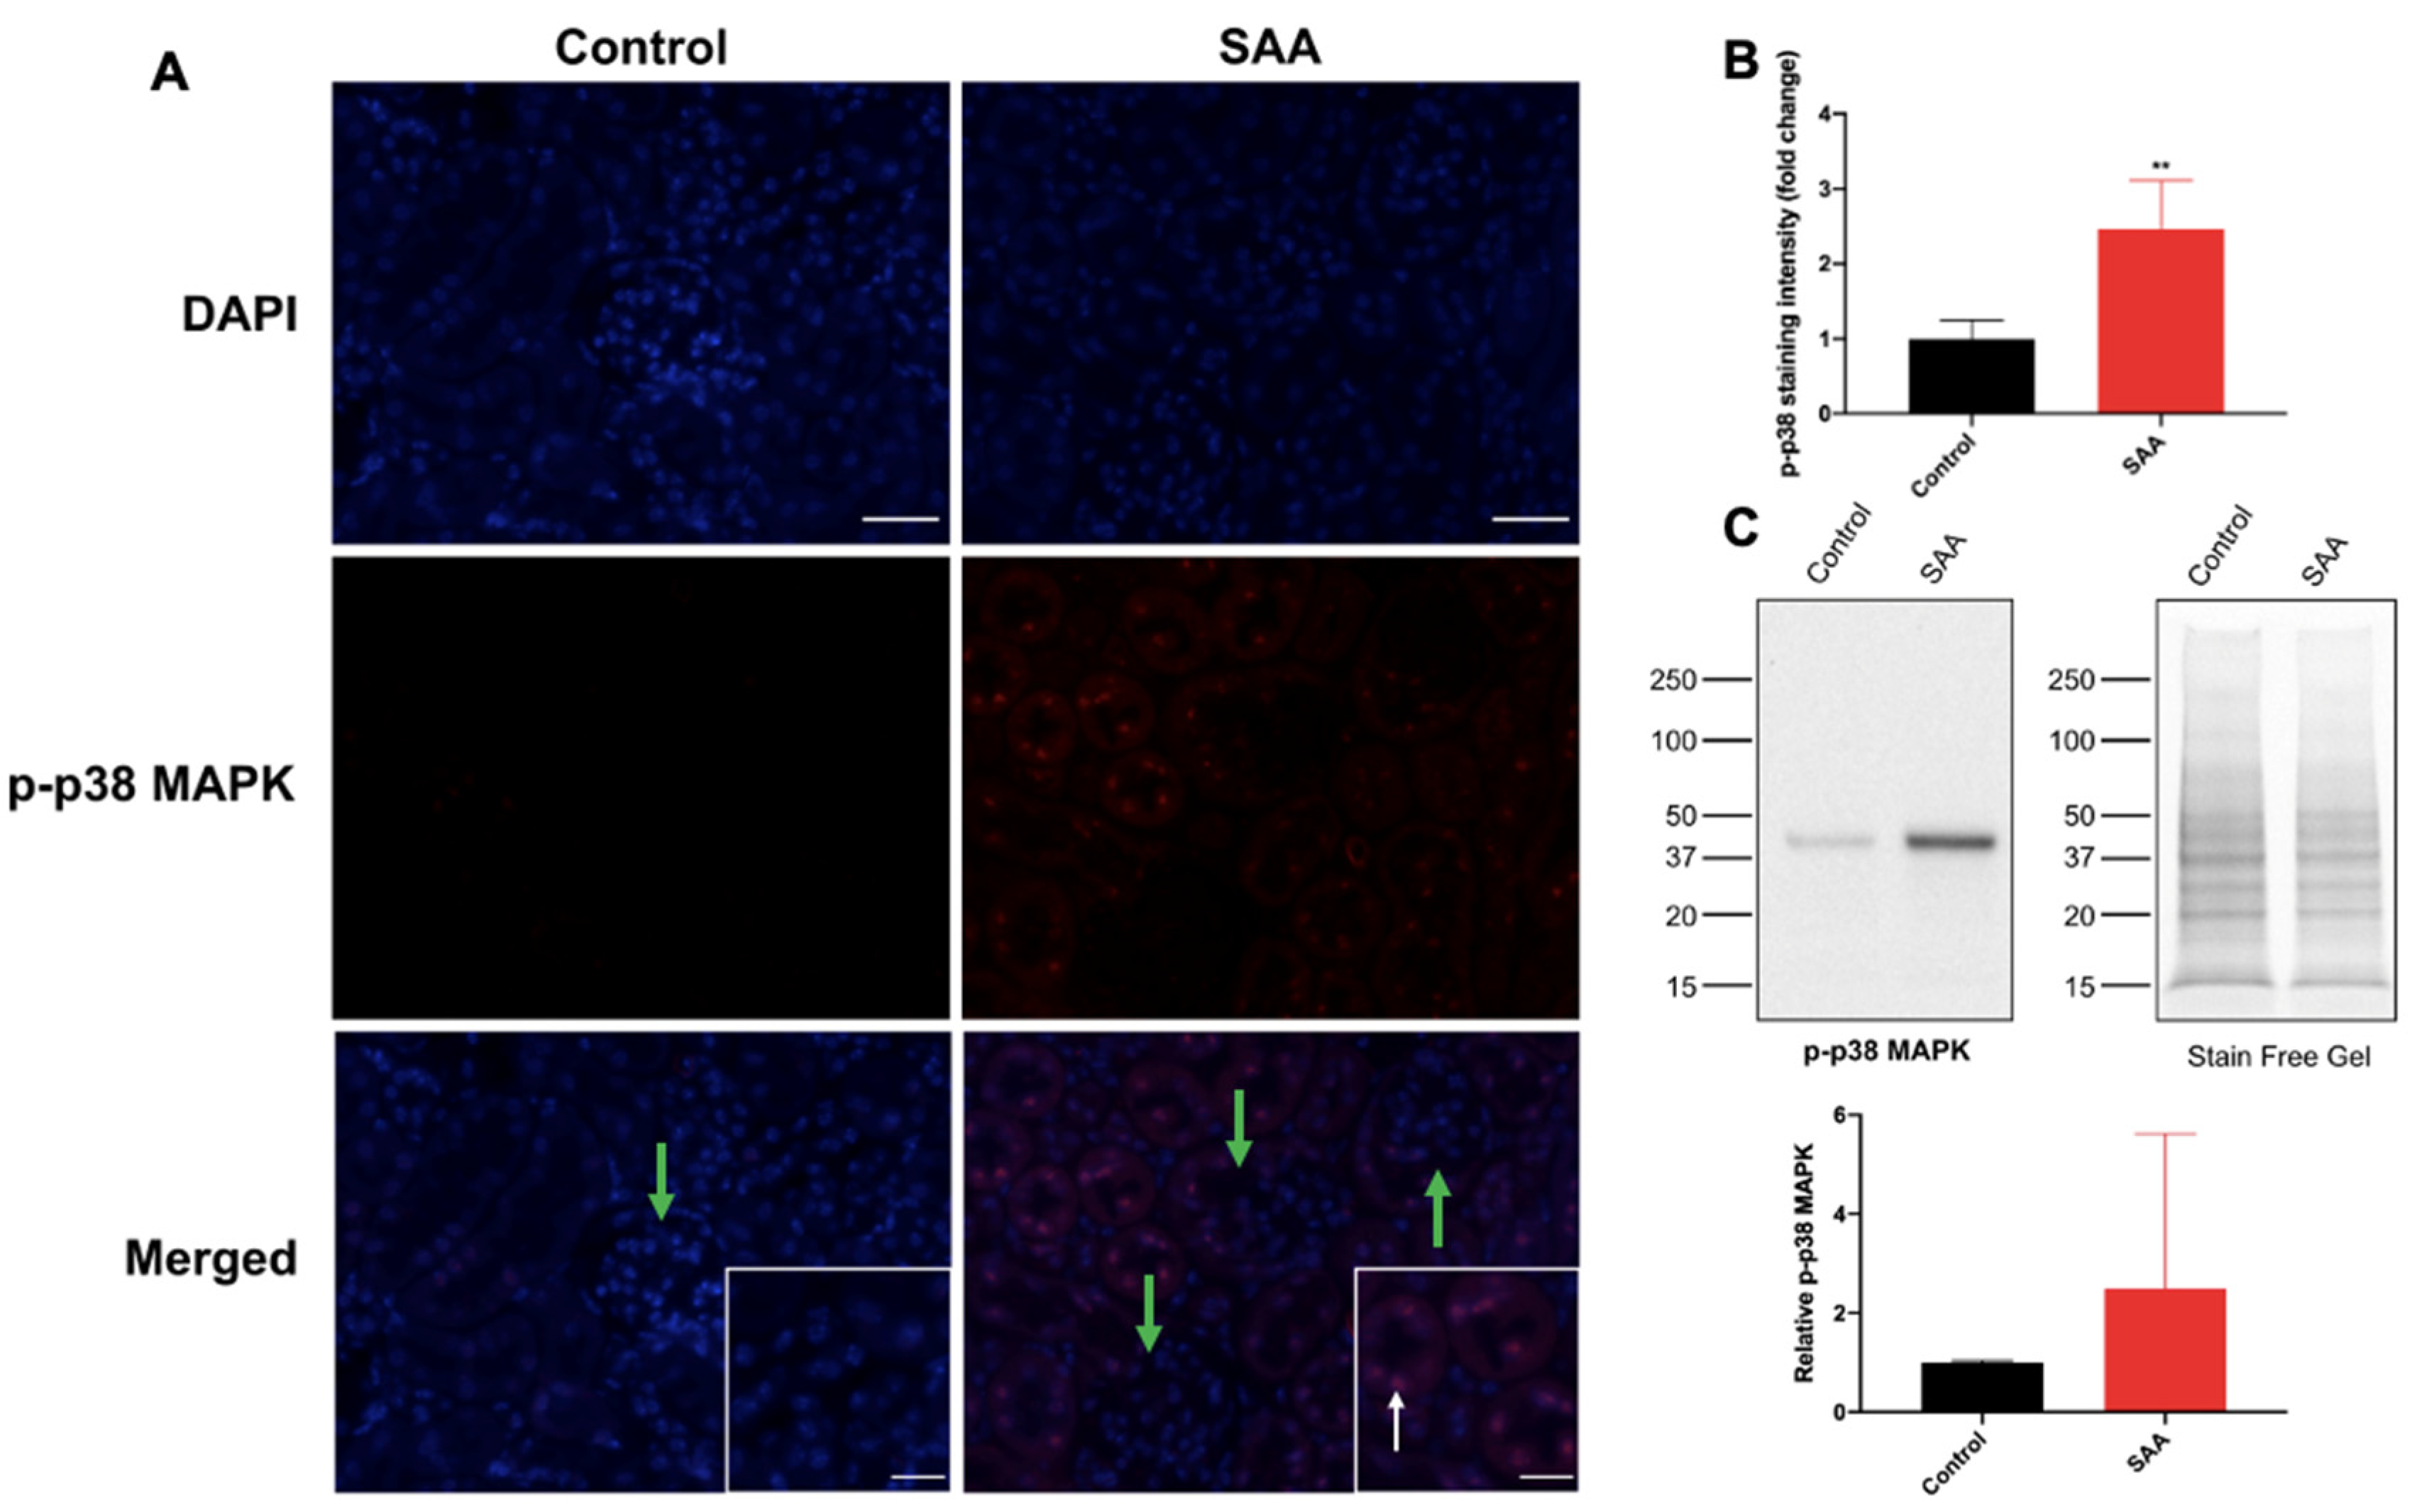
6.5. SAA Administration Stimulates p-38 MAPK in Renal Tissue
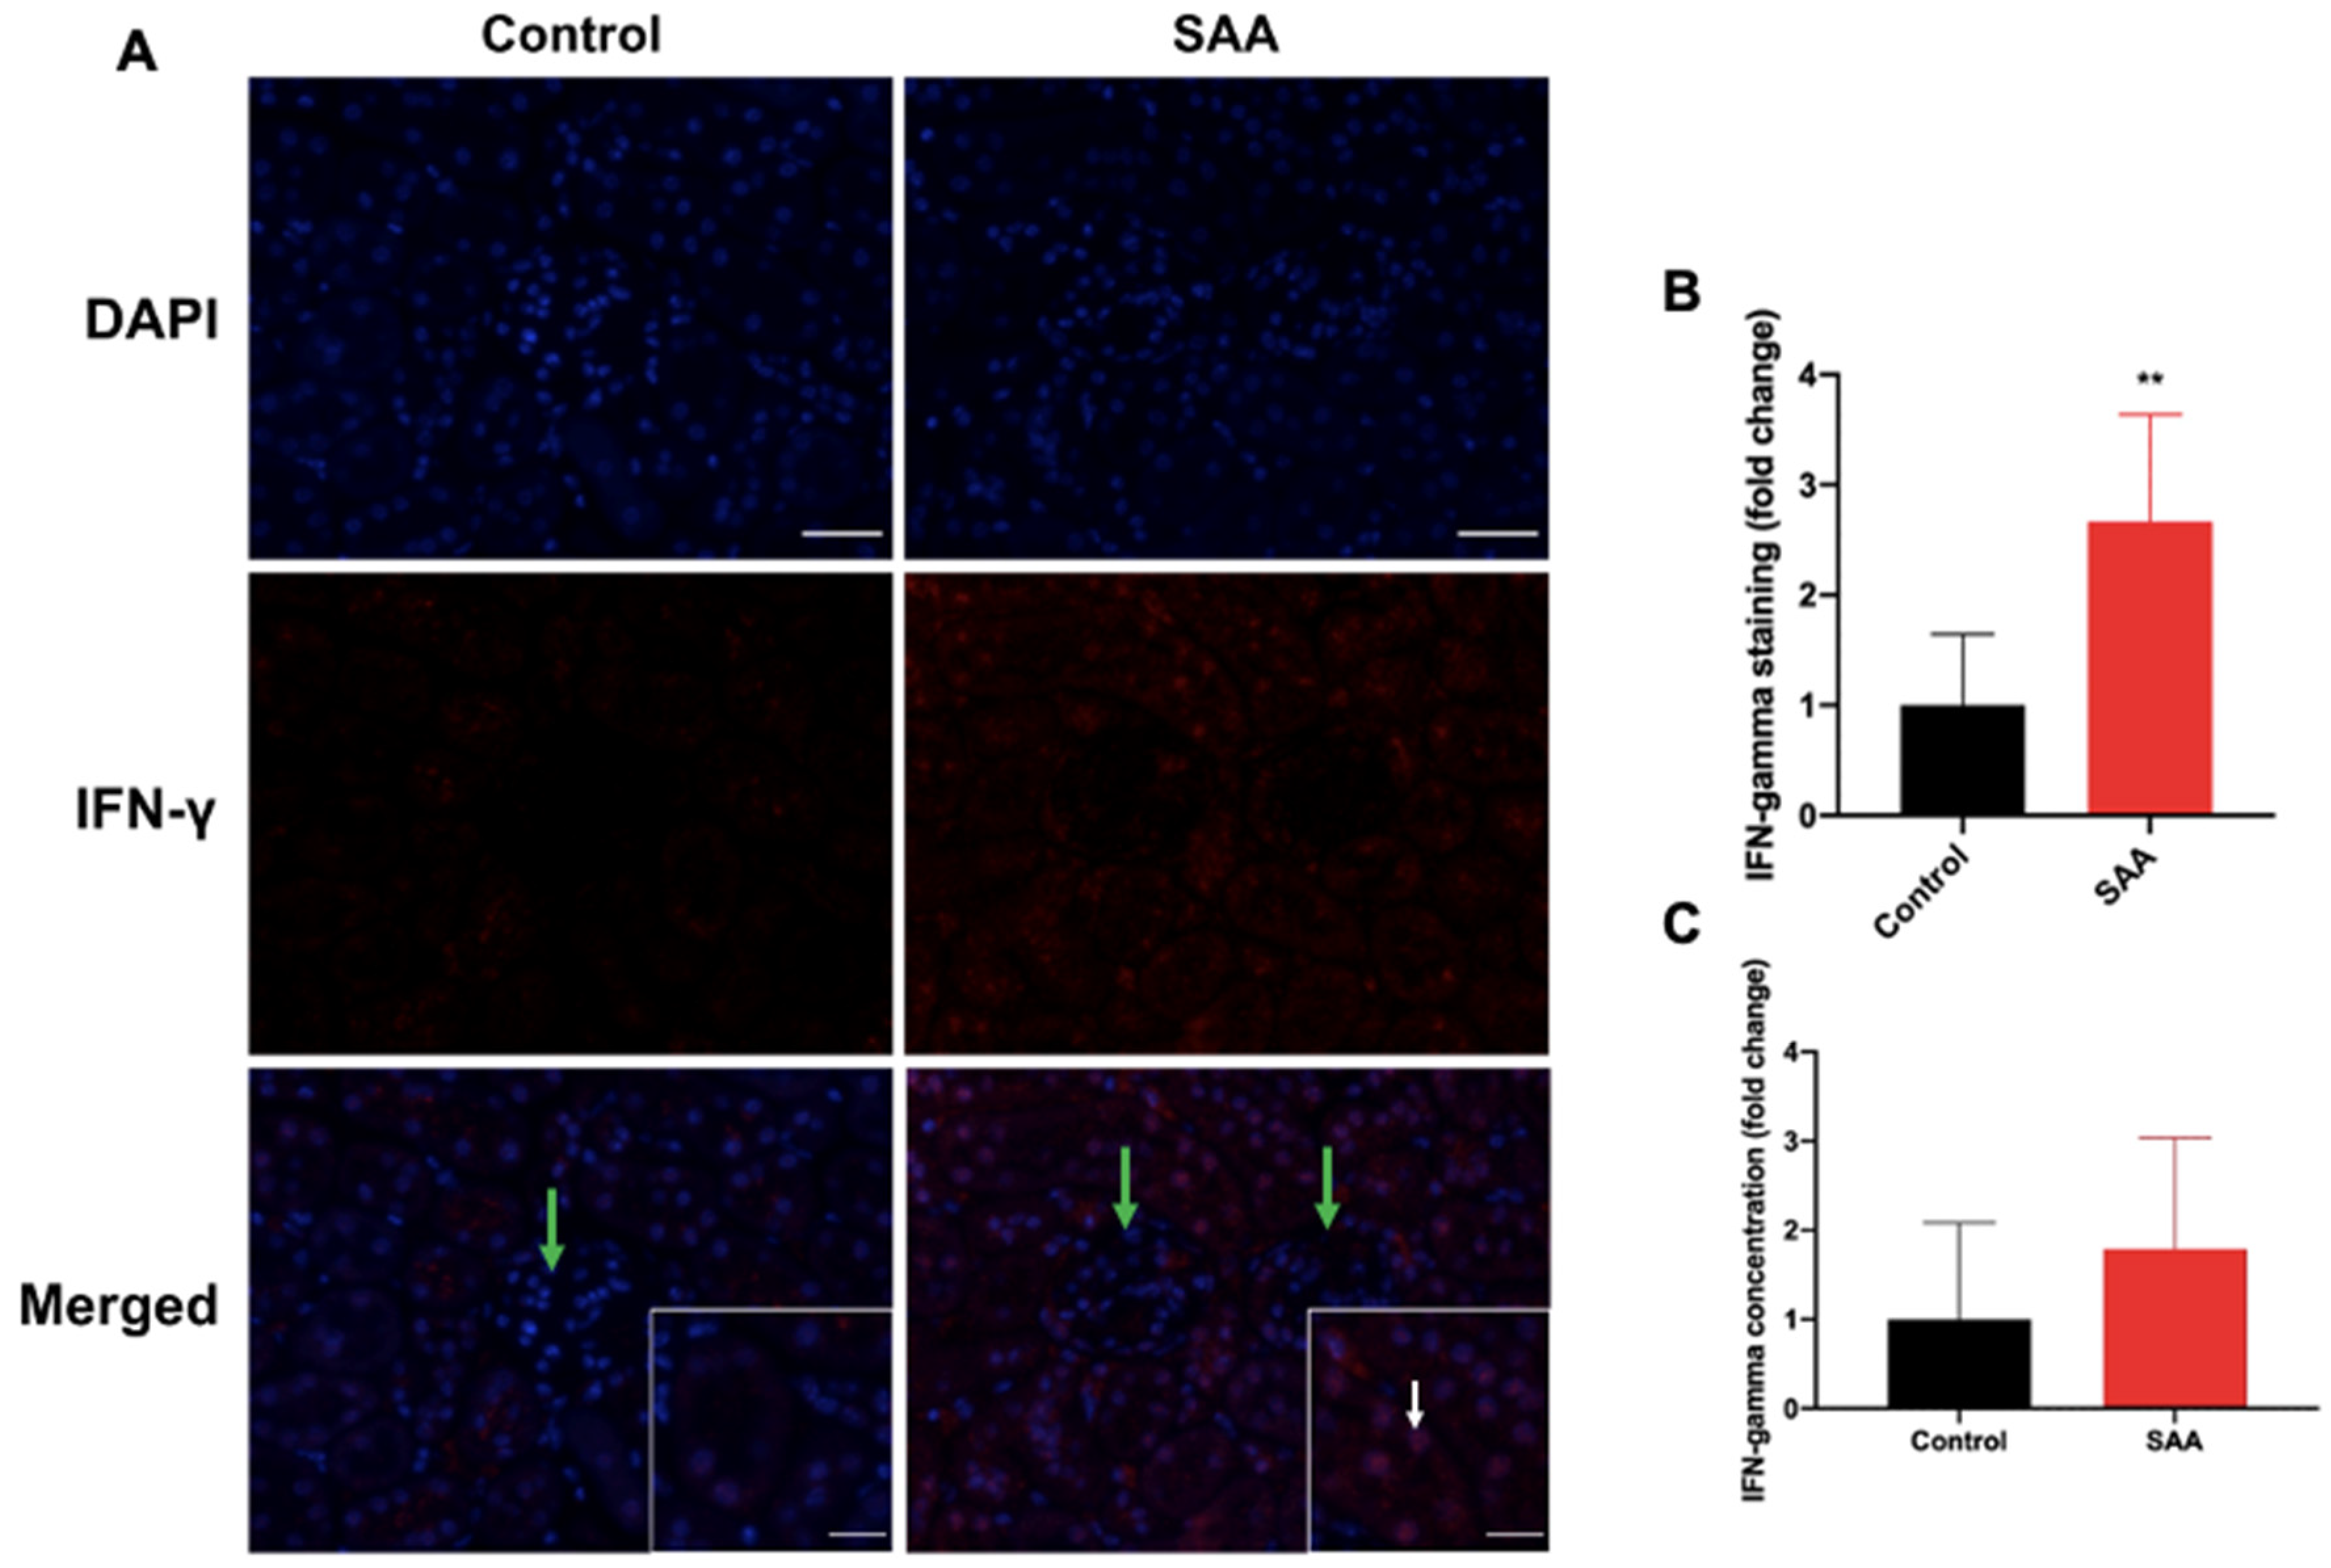
6.6. SAA Administration Stimulates IFN-γ Expression in the Renal Tissue
6.7. SAA Administration Stimulates Inducible iNOS Expression in the Renal Tissue
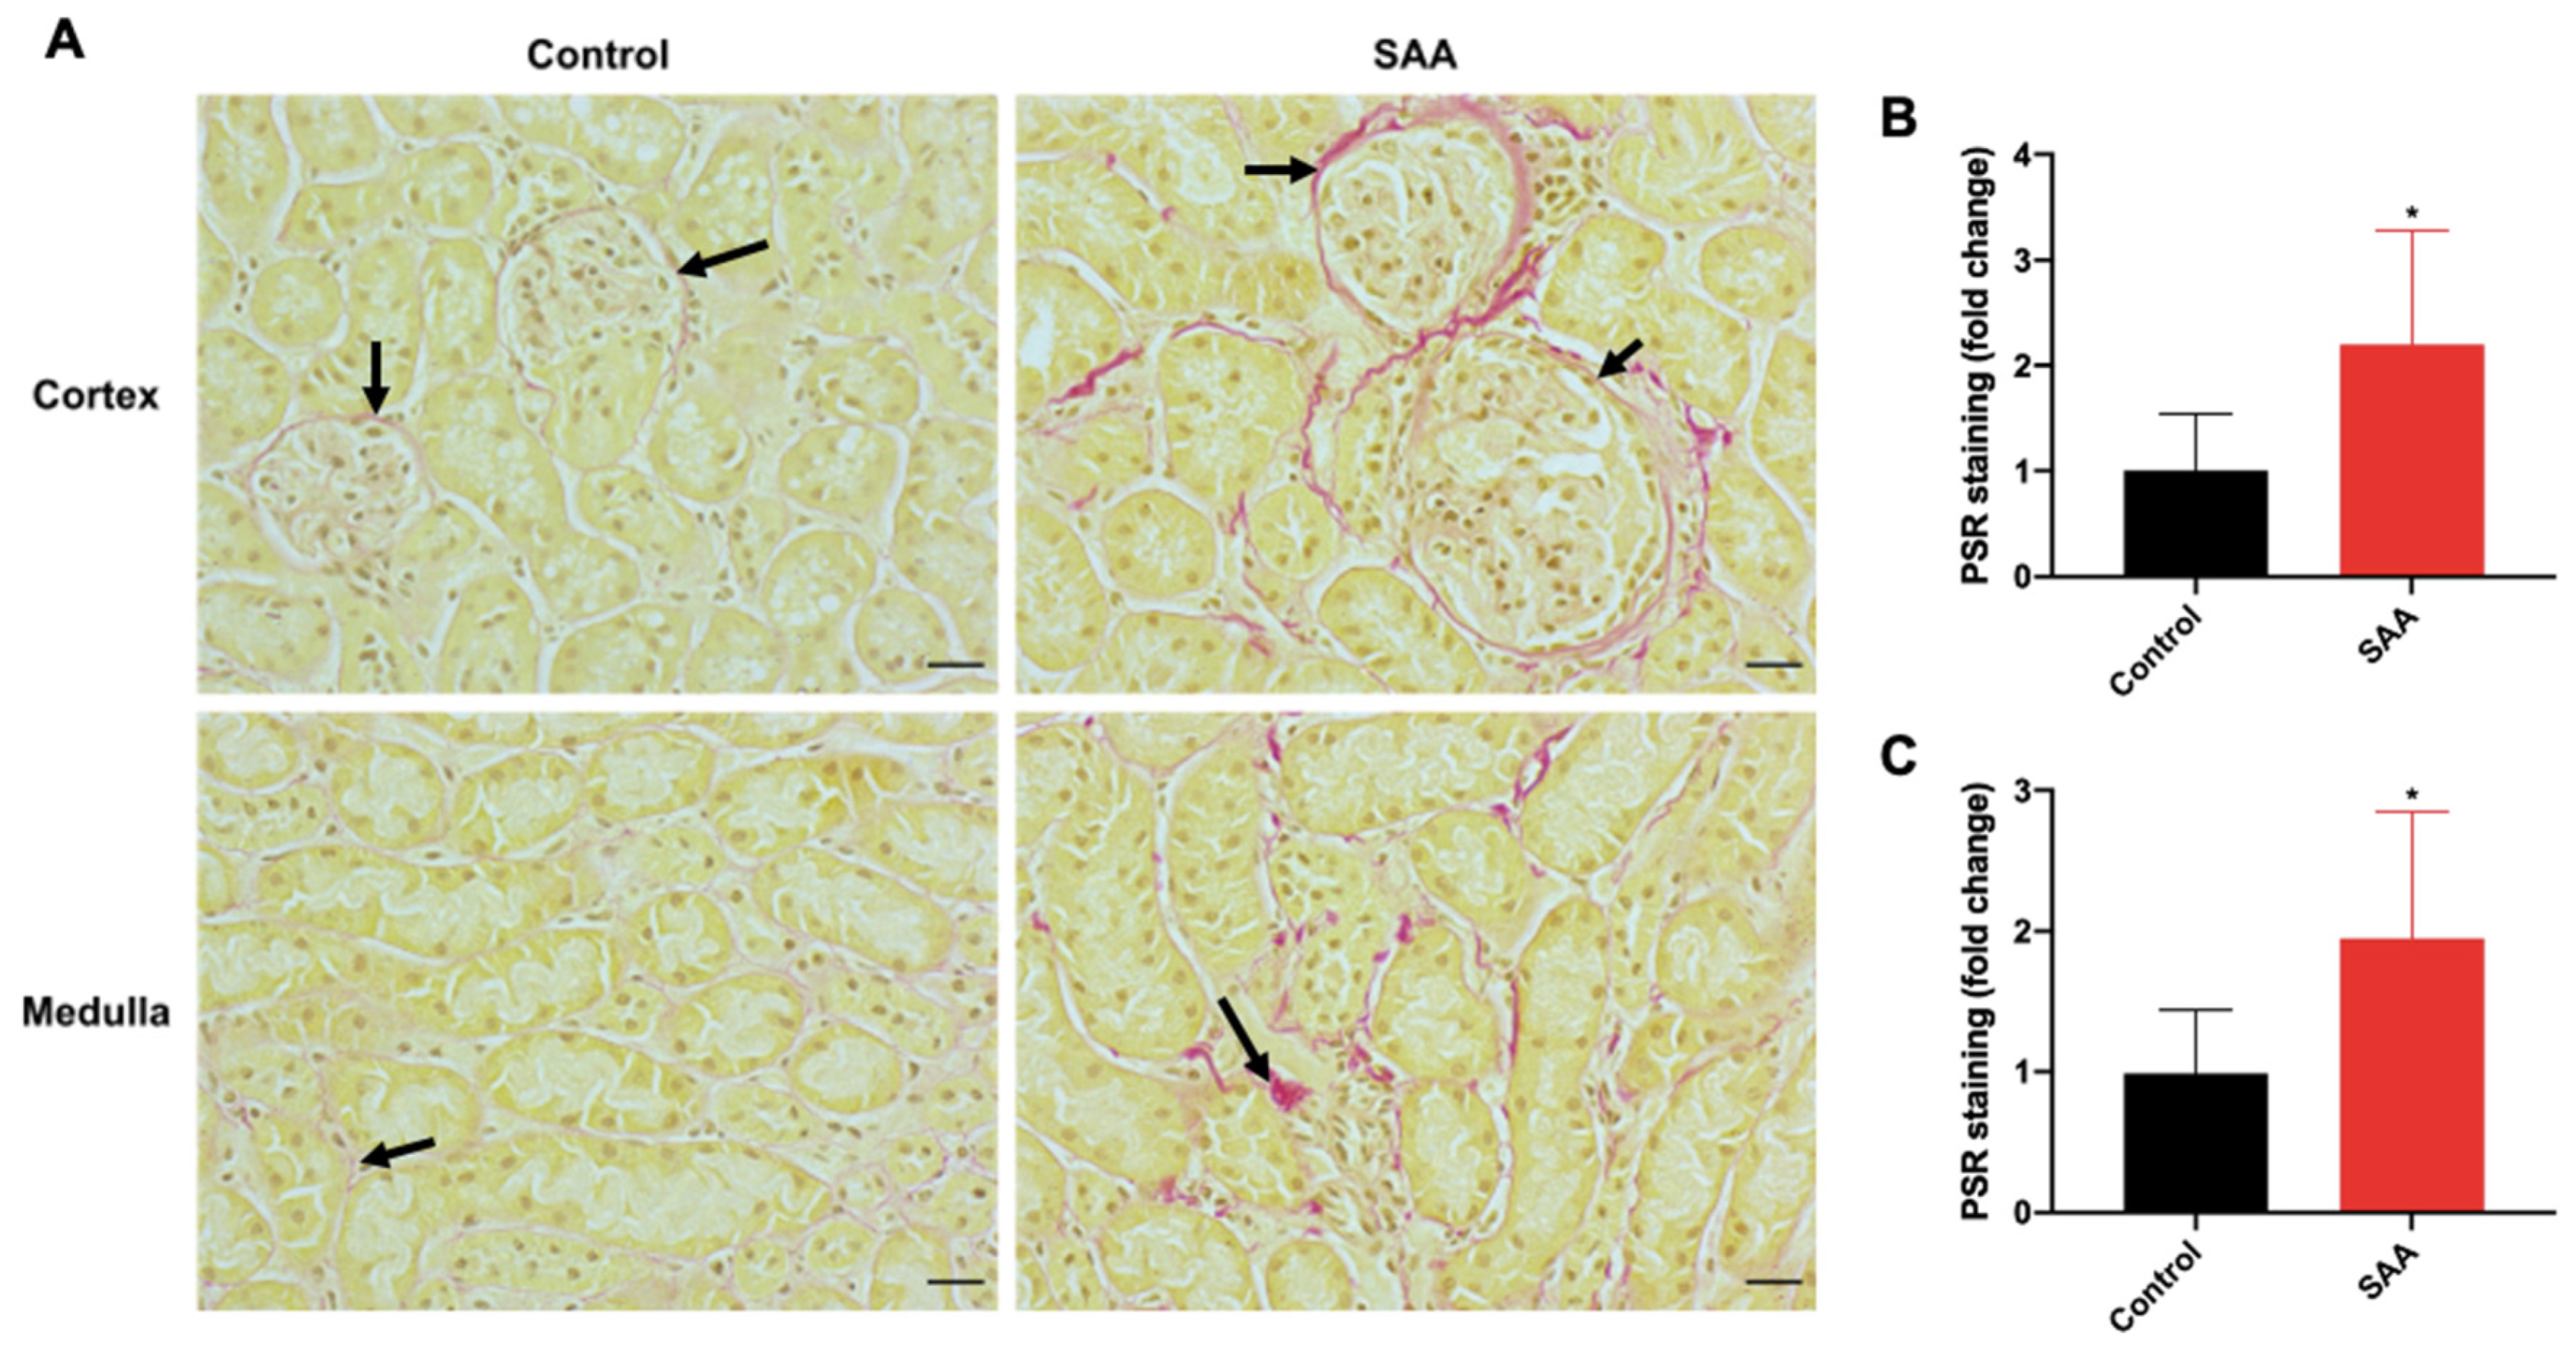
6.8. SAA Administration Leads to Fibrotic Changes in the Kidneys
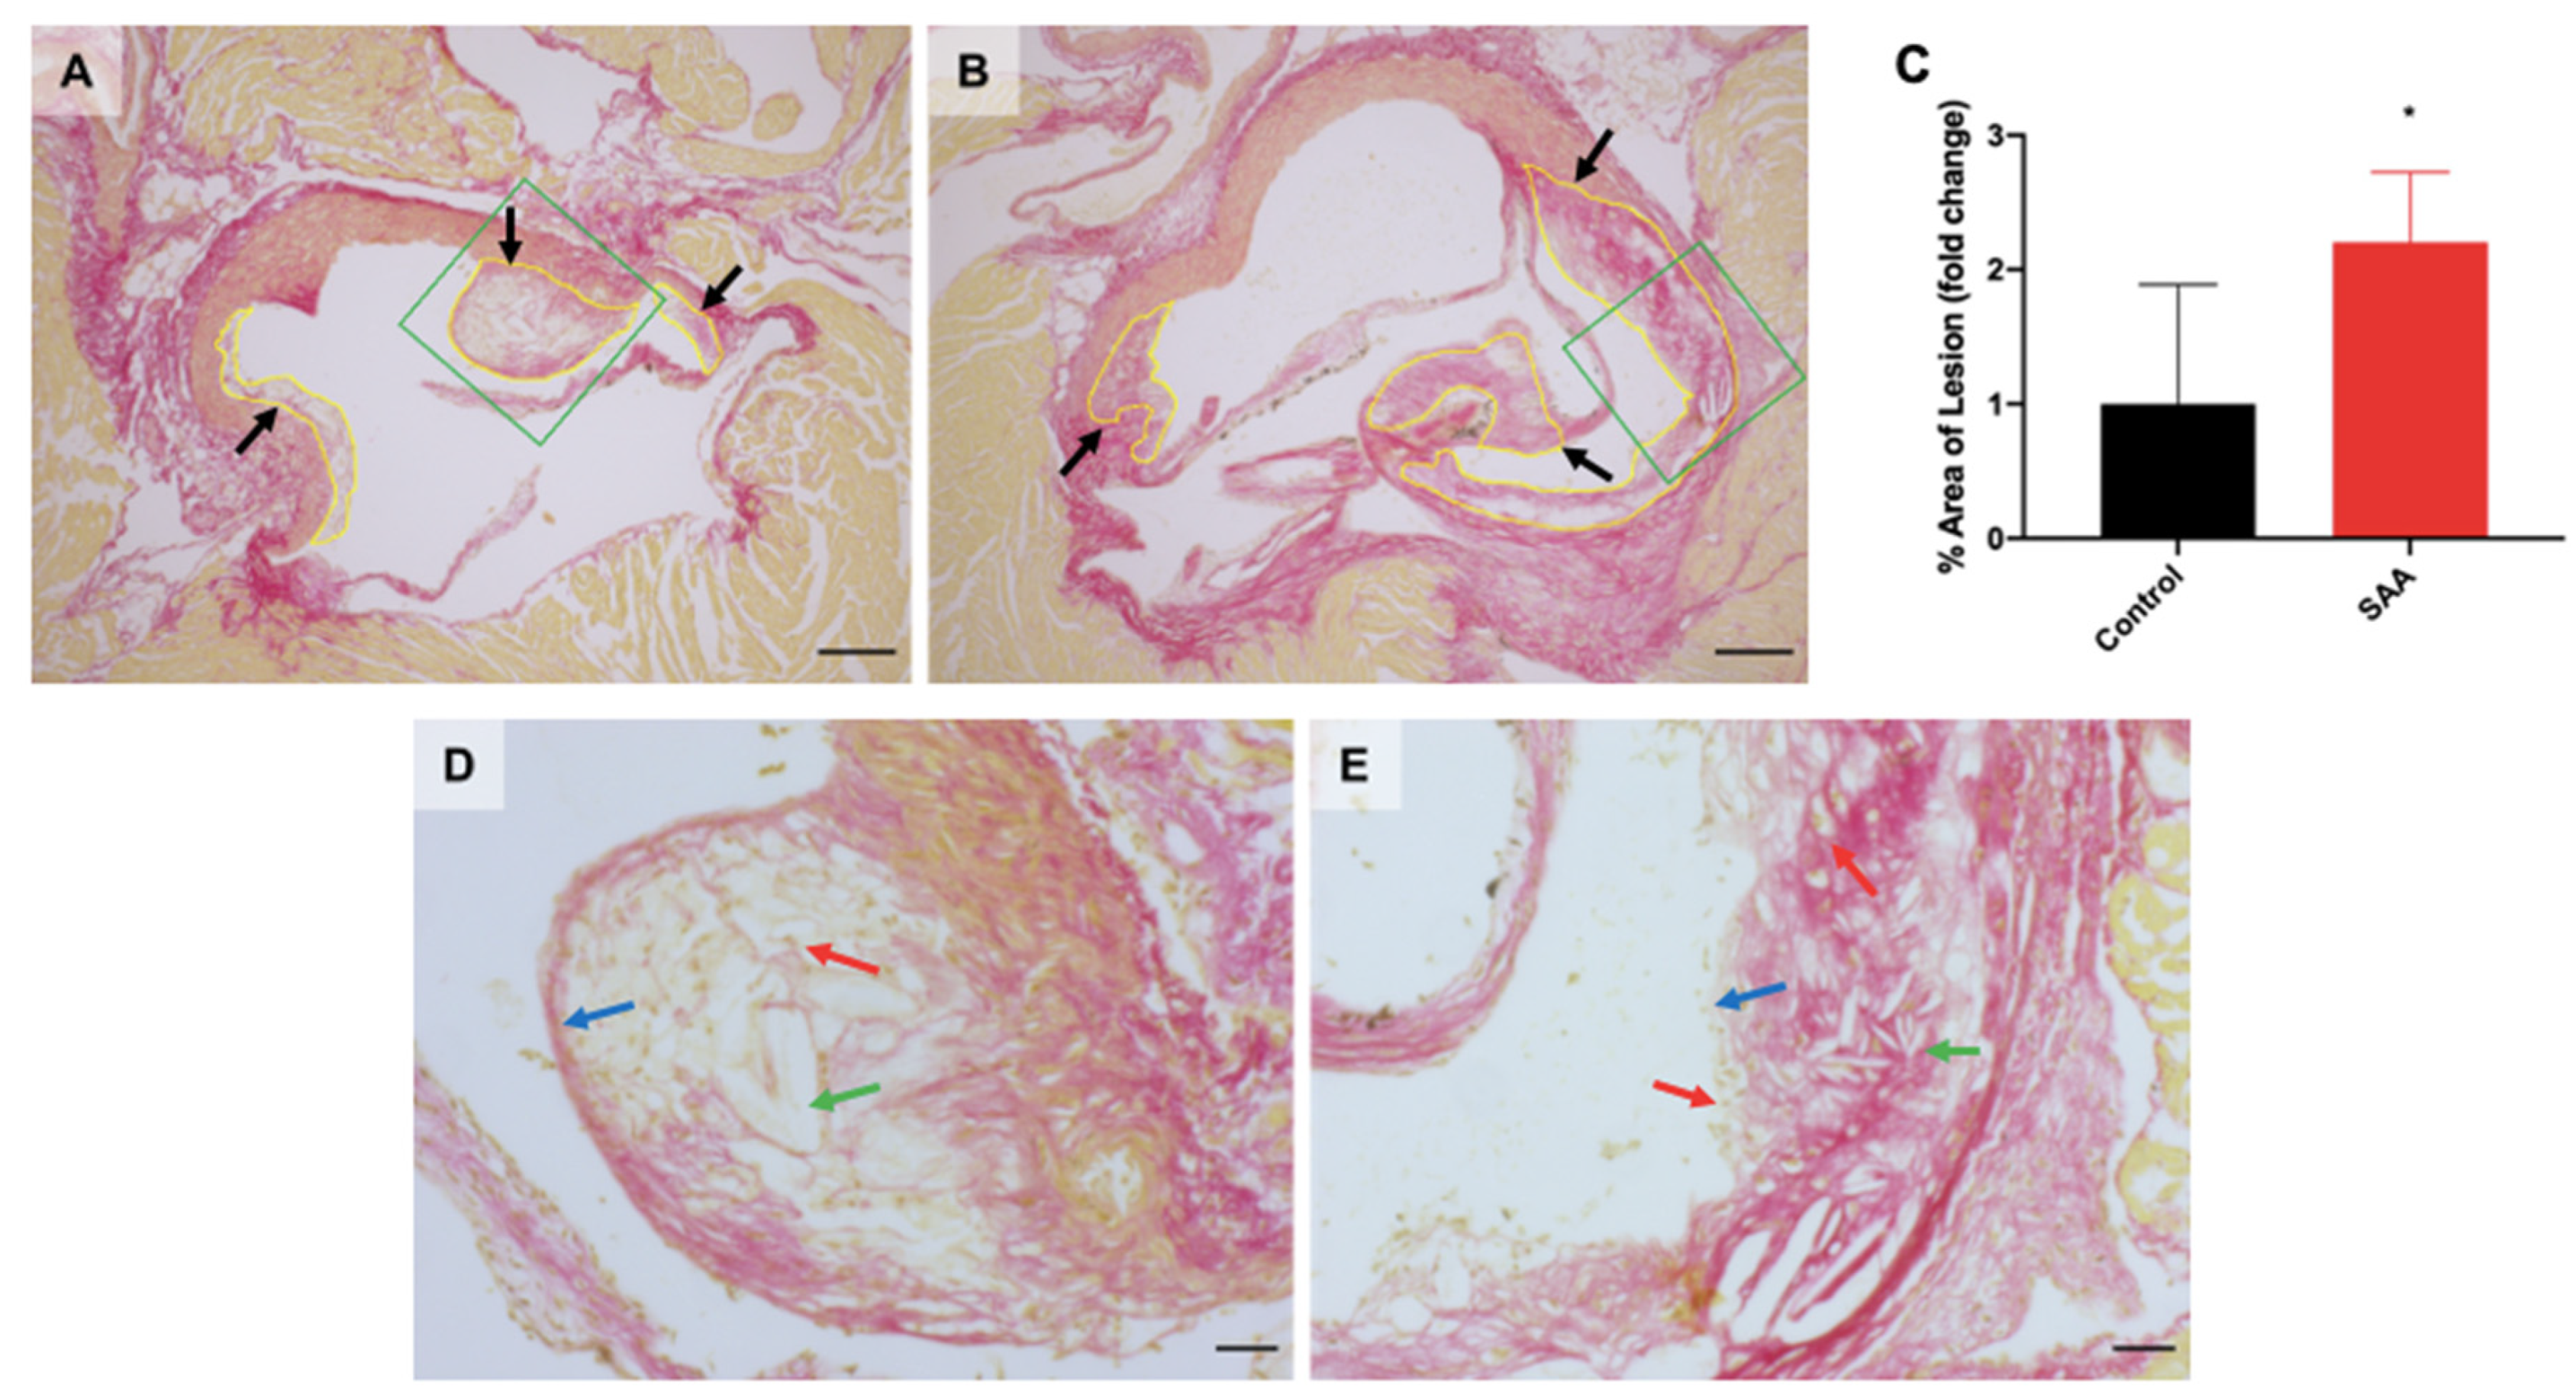
6.9. SAA Administration Causes Atherosclerotic Lesions Development in the Mouse Aortae
7. Discussion
7.1. SAA Induced Expression of Nrf2, NF-kB and Activated p38 MAPK in the Renal Tissue
7.2. SAA Induced Expression of IFN-γ in the Renal Tissue
7.3. SAA Induced Fibrotic Changes in the Renal Tissue
7.4. SAA Induced Atherosclerotic Changes in the Aorta Root of Mice
8. Conclusions
Supplementary Materials
Author Contributions
Funding
Institutional Review Board Statement
Informed Consent Statement
Data Availability Statement
Acknowledgments
Conflicts of Interest
References
- Thomas, S.R.; Witting, P.K.; Drummond, G.R. Redox control of endothelial function and dysfunction: Molecular mechanisms and therapeutic opportunities. Antioxid. Redox Signal 2008, 10, 1713–1765. [Google Scholar] [CrossRef]
- Jourde-Chiche, N.; Fakhouri, F.; Dou, L.; Bellien, J.; Burtey, S.; Frimat, M.; Jarrot, P.-A.; Kaplanski, G.; Quintrec, M.L.; Pernin, V.; et al. Endothelium structure and function in kidney health and disease. Nat. Rev. Nephrol. 2019, 15, 87–108. [Google Scholar] [CrossRef] [PubMed]
- Deanfield, J.E.; Halcox, J.P.; Rabelink, T.J. Endothelial function and dysfunction: Testing and clinical relevance. Circulation 2007, 115, 1285–1295. [Google Scholar] [CrossRef] [PubMed]
- Hashimoto, K.; Kataoka, N.; Nakamura, E.; Tsujioka, K.; Kajiya, F. Oxidized LDL specifically promotes the initiation of monocyte invasion during transendothelial migration with upregulated PECAM-1 and downregulated VE-cadherin on endothelial junctions. Atherosclerosis 2007, 194, e9–e17. [Google Scholar] [CrossRef] [PubMed]
- Maguire, E.M.; Pearce, S.W.A.; Xiao, Q. Foam cell formation: A new target for fighting atherosclerosis and cardiovascular disease. Vasc. Pharmacol. 2019, 112, 54–71. [Google Scholar] [CrossRef]
- Burke, A.P.; Kolodgie, F.D.; Farb, A.; Weber, D.; Virmani, R. Morphological predictors of arterial remodeling in coronary atherosclerosis. Circulation 2002, 105, 297–303. [Google Scholar] [CrossRef] [PubMed]
- Insull, W., Jr. The pathology of atherosclerosis: Plaque development and plaque responses to medical treatment. Am. J. Med. 2009, 122 (Suppl. S1), S3–S14. [Google Scholar] [CrossRef] [PubMed]
- Pi, X.; Xie, L.; Patterson, C. Emerging Roles of Vascular Endothelium in Metabolic Homeostasis. Circ. Res. 2018, 123, 477–494. [Google Scholar] [CrossRef]
- Yang, R.Z.; Lee, M.J.; Hu, H.; Pollin, T.I.; Ryan, A.S.; Nicklas, B.J.; Snitker, S.; Horenstein, R.B.; Hull, K.; Goldberg, N.H.; et al. Acute-phase serum amyloid A: An inflammatory adipokine and potential link between obesity and its metabolic complications. PLoS Med. 2006, 3, e287. [Google Scholar] [CrossRef]
- Vallejo, A.; Chami, B.; Dennis, J.M.; Simone, M.; Ahmad, G.; Abdo, A.I.; Sharma, A.; Shihata, W.A.; Martin, N.; Chin-Dusting, J.P.F.; et al. NFκB inhibition mitigates serum amyloid a-induced pro-atherogenic responses in endothelial cells and leukocyte adhesion and adverse changes to endothelium function in isolated aorta. Int. J. Mol. Sci. 2018, 20, 105. [Google Scholar] [CrossRef] [Green Version]
- Schefold, J.C.; Filippatos, G.; Hasenfuss, G.; Anker, S.D.; Von Haehling, S. Heart failure and kidney dysfunction: Epidemiology, mechanisms and management. Nat. Rev. Nephrol. 2016, 12, 610–623. [Google Scholar] [CrossRef]
- Zhang, Y.; Zhang, J.; Sheng, H.; Li, H.; Wang, R. Acute phase reactant serum amyloid A in inflammation and other diseases. Adv. Clin. Chem. 2019, 90, 25–80. [Google Scholar]
- Wilson, P.G.; Thompson, J.C.; Shridas, P.; McNamara, P.J.; de Beer, M.C.; de Beer, F.C.; Webb, N.R.; Tannock, L.R. Serum Amyloid A Is an Exchangeable Apolipoprotein. Arterioscler. Thromb. Vasc. Biol. 2018, 38, 1890–1900. [Google Scholar] [CrossRef] [PubMed] [Green Version]
- Jayaraman, S.; Gantz, D.L.; Haupt, C.; Gursky, O. Serum amyloid A forms stable oligomers that disrupt vesicles at lysosomal pH and contribute to the pathogenesis of reactive amyloidosis. Proc. Natl. Acad. Sci. USA 2017, 114, E6507–E6515. [Google Scholar] [CrossRef] [Green Version]
- Sack, G.H., Jr. Serum amyloid A—A review. Mol. Med. 2018, 24, 46. [Google Scholar] [CrossRef] [PubMed]
- Meek, R.L.; Urieli-Shoval, S.; Benditt, E.P. Expression of apolipoprotein serum amyloid A mRNA in human atherosclerotic lesions and cultured vascular cells: Implications for serum amyloid A function. Proc. Natl. Acad. Sci. USA 1994, 91, 3186–3190. [Google Scholar] [CrossRef] [Green Version]
- Chami, B.; Barrie, N.; Cai, X.; Wang, X.; Paul, M.; Morton-Chandra, R.; Sharland, A.; Dennis, J.M.; Freedman, S.B.; Witting, P.K. Serum amyloid A receptor blockade and incorporation into high-density lipoprotein modulates its pro-inflammatory and pro-thrombotic activities on vascular endothelial cells. Int. J. Mol. Sci. 2015, 16, 11101–11124. [Google Scholar] [CrossRef] [PubMed] [Green Version]
- Hatanaka, E.; Dermargos, A.; Armelin, H.A.; Curi, R.; Campa, A. Serum amyloid A induces reactive oxygen species (ROS) production and proliferation of fibroblast. Clin. Exp. Immunol. 2011, 163, 362–367. [Google Scholar] [CrossRef] [Green Version]
- Chami, B.; Hossain, F.; Hambly, T.W.; Cai, X.; Aran, R.; Fong, G.; Vellajo, A.; Martin, N.J.J.; Wang, X.; Dennis, J.M.; et al. Serum Amyloid a stimulates vascular and renal dysfunction in apolipoprotein e-deficient mice fed a normal chow diet. Front. Immunol. 2019, 10, 380. [Google Scholar] [CrossRef]
- Shen, C.; Sun, X.G.; Liu, N.; Mu, Y.; Hong, C.C.; Wei, W.; Zheng, F. Increased serum amyloid A and its association with autoantibodies, acute phase reactants and disease activity in patients with rheumatoid arthritis. Mol. Med. Rep. 2015, 11, 1528–1534. [Google Scholar] [CrossRef] [Green Version]
- Marzi, C.; Huth, C.; Herder, C.; Baumert, J.; Thorand, B.; Rathmann, W.; Meisinger, C.; Wichmann, H.E.; Roden, M.; Peters, A. Acute-phase serum amyloid A protein and its implication in the development of type 2 diabetes in the KORA S4/F4 study. Diabetes Care 2013, 36, 1321–1326. [Google Scholar] [CrossRef] [Green Version]
- Frikke-Schmidt, R. Genetic variation in the ABCA1 gene, HDL cholesterol, and risk of ischemic heart disease in the general population. Atherosclerosis 2010, 208, 305–316. [Google Scholar] [CrossRef] [PubMed]
- Schreck, R.; Albermann, K.; Baeuerle, P.A. Nuclear factor kappa B: An oxidative stress-responsive transcription factor of eukaryotic cells (a review). Free Radic. Res. Commun. 1992, 17, 221–237. [Google Scholar] [CrossRef] [PubMed]
- Sun, Y.; Oberley, L.W. Redox regulation of transcriptional activators. Free Radic. Biol. Med. 1996, 21, 335–348. [Google Scholar] [CrossRef]
- Xiao, C.; Ghosh, S. NF-kappaB, an evolutionarily conserved mediator of immune and inflammatory responses. Adv. Exp. Med. Biol. 2005, 560, 41–45. [Google Scholar]
- Taniguchi, K.; Karin, M. NF-kappaB, inflammation, immunity and cancer: Coming of age. Nat. Rev. Immunol. 2018, 18, 309–324. [Google Scholar] [CrossRef]
- Shapouri-Moghaddam, A.; Mohammadian, S.; Vazini, H.; Taghadosi, M.; Esmaeili, S.A.; Mardani, F.; Seifi, B.; Mohammadi, A.; Afshari, J.T.; Sahebkar, A. Macrophage plasticity, polarization, and function in health and disease. J. Cell Physiol. 2018, 233, 6425–6440. [Google Scholar] [CrossRef]
- Zhou, F. Molecular mechanisms of IFN-gamma to up-regulate MHC class I antigen processing and presentation. Int. Rev. Immunol. 2009, 28, 239–260. [Google Scholar] [CrossRef] [PubMed]
- Bae, Y.S.; Lee, J.H.; Choi, S.H.; Kim, S.; Almazan, F.; Witztum, J.L.; Miller, Y.I. Macrophages generate reactive oxygen species in response to minimally oxidized low-density lipoprotein: Toll-like receptor 4- and spleen tyrosine kinase-dependent activation of NADPH oxidase 2. Circ. Res. 2009, 104, 210–218. [Google Scholar] [CrossRef] [Green Version]
- Salim, T.; Sershen, C.L.; May, E.E. Investigating the role of TNF-alpha and IFN-gamma activation on the dynamics of iNOS gene expression in LPS stimulated macrophages. PLoS ONE 2016, 11, e0153289. [Google Scholar] [CrossRef] [PubMed] [Green Version]
- Amore, A.; Emancipator, S.N.; Cirina, P.; Conti, G.; Ricotti, E.; Bagheri, N.; Coppo, R. Nitric oxide mediates cyclosporine-induced apoptosis in cultured renal cells. Kidney Int. 2000, 57, 1549–1559. [Google Scholar] [CrossRef] [Green Version]
- Ahmad, A.; Dempsey, S.K.; Daneva, Z.; Azam, M.; Li, N.; Li, P.L.; Ritter, J.K. Role of nitric oxide in the cardiovascular and renal systems. Int. J. Mol. Sci. 2018, 19, 2605. [Google Scholar] [CrossRef] [Green Version]
- Radi, R. Oxygen radicals, nitric oxide, and peroxynitrite: Redox pathways in molecular medicine. Proc. Natl. Acad. Sci. USA 2018, 115, 5839–5848. [Google Scholar] [CrossRef] [PubMed] [Green Version]
- Kanamori, H.; atsubara, T.; Mima, A.; Sumi, E.; Nagai, K.; Takahashi, T.; Abe, H.; Iehara, N.; Fukatsu, A.; Okamoto, H. Inhibition of MCP-1/CCR2 pathway ameliorates the development of diabetic nephropathy. Biochem. Biophys. Res. Commun. 2007, 360, 772–777. [Google Scholar] [CrossRef] [Green Version]
- Hua, S.; Song, C.; Geczy, C.L.; Freedman, S.B.; Witting, P.K. A role for acute-phase serum amyloid A and high-density lipoprotein in oxidative stress, endothelial dysfunction and atherosclerosis. Redox. Rep. 2009, 14, 187–196. [Google Scholar] [CrossRef] [PubMed]
- Ahmad, G.; Chami, B.; Liu, Y.; Schroder, A.L.; San Gabriel, P.T.; Gao, A.; Fong, G.; Wang, X.; Witting, P.K. The synthetic myeloperoxidase inhibitor AZD3241 ameliorates dextran sodium sulfate stimulated experimental colitis. Front. Pharmacol. 2020, 11, 556020. [Google Scholar] [CrossRef] [PubMed]
- Witting, P.K.; Pettersson, K.; Letters, J.; Stocker, R. Anti-atherogenic effect of coenzyme Q10 in apolipoprotein E gene knockout mice. Free Radic. Biol. Med. 2000, 29, 295–305. [Google Scholar] [CrossRef]
- Cai, X.; Ahmad, G.; Hossain, F.; Liu, Y.; Wang, X.; Dennis, J.; Freedman, B.; Witting, P.K. High-Density Lipoprotein (HDL) inhibits Serum Amyloid A (SAA)-induced vascular and renal dysfunctions in apolipoprotein E-deficient mice. Int. J. Mol. Sci. 2020, 21, 1316. [Google Scholar] [CrossRef] [Green Version]
- Ichimura, T.; Bonventre, J.V.; Bailly, V.; Wei, H.; Hession, C.A.; Cate, R.L.; Sanicola, M. Kidney injury molecule-1 (KIM-1), a putative epithelial cell adhesion molecule containing a novel immunoglobulin domain, is up-regulated in renal cells after injury. J. Biol. Chem. 1998, 273, 4135–4142. [Google Scholar] [CrossRef] [Green Version]
- Zhao, H.; Dong, Y.; Tian, X.; Tan, T.K.; Liu, Z.; Zhao, Y.; Zhang, Y.; Harris, D.C.h.; Zheng, G. Matrix metalloproteinases contribute to kidney fibrosis in chronic kidney diseases. World J. Nephrol. 2013, 2, 84–89. [Google Scholar] [CrossRef] [Green Version]
- Han, W.K.; Bailly, V.; Abichandani, R.; Thadhani, R.; Bonventre, J.V. Kidney injury molecule-1 (KIM-1): A novel biomarker for human renal proximal tubule injury. Kidney Int. 2002, 62, 237–244. [Google Scholar] [CrossRef] [PubMed] [Green Version]
- Driver, T.H.; Katz, R.; Ix, J.H.; Magnani, J.W.; Peralta, C.A.; Parikh, C.R.; Fried, L.; Newman, A.B.; Kritchevsky, S.B.; Sarnak, M.J.; et al. Urinary kidney injury molecule 1 (KIM-1) and interleukin 18 (IL-18) as risk markers for heart failure in older adults: The Health, Aging, and Body Composition (Health ABC) Study. Am. J. Kidney Dis. 2014, 64, 49–56. [Google Scholar] [CrossRef] [PubMed] [Green Version]
- Ma, Q. Role of nrf2 in oxidative stress and toxicity. Annu. Rev. Pharmacol. Toxicol. 2013, 53, 401–426. [Google Scholar] [CrossRef] [Green Version]
- Wang, P.; Geng, J.; Gao, J.; Zhao, H.; Li, J.; Shi, Y.; Yang, B.; Xiao, C.; Linghu, Y.; Sun, X.; et al. Macrophage achieves self-protection against oxidative stress-induced ageing through the Mst-Nrf2 axis. Nat. Commun. 2019, 10, 755. [Google Scholar] [CrossRef] [PubMed]
- Jijon, H.B.; Madsen, K.L.; Walker, J.W.; Allard, B.; Jobin, C. Serum amyloid A activates NF-kappaB and proinflammatory gene expression in human and murine intestinal epithelial cells. Eur. J. Immunol. 2005, 35, 718–726. [Google Scholar] [CrossRef] [PubMed]
- Lee, J.; An, J.N.; Hwang, J.H.; Lee, H.; Lee, J.P.; Kim, S.G. p38 MAPK activity is associated with the histological degree of interstitial fibrosis in IgA nephropathy patients. PLoS ONE 2019, 14, e0213981. [Google Scholar] [CrossRef] [PubMed]
- Su, B.; Jacinto, E.; Hibi, M.; Kallunki, T.; Karin, M.; Ben-Neriah, Y. JNK is involved in signal integration during costimulation of T lymphocytes. Cell 1994, 77, 727–736. [Google Scholar] [CrossRef]
- Dong, C.; Davis, R.J.; Flavell, R.A. MAP kinases in the immune response. Annu. Rev. Immunol. 2002, 20, 55–72. [Google Scholar] [CrossRef]
- Zhao, Y.; Liu, X.; Qu, Y.; Wang, L.; Geng, D.; Chen, W.; Li, L.; Tian, Y.; Chang, S.; Zhao, C.; et al. The roles of p38 MAPK → COX2 and NF-kappaB → COX2 signal pathways in age-related testosterone reduction. Sci. Rep. 2019, 9, 10556. [Google Scholar] [CrossRef] [PubMed] [Green Version]
- Singer, C.A.; Baker, K.J.; McCaffrey, A.; AuCoin, D.P.; Dechert, M.A.; Gerthoffer, W.T. p38 MAPK and NF-kappaB mediate COX-2 expression in human airway myocytes. Am. J. Physiol. Lung Cell. Mol. Physiol. 2003, 285, L1087–L1098. [Google Scholar] [CrossRef] [Green Version]
- Wang, H.; Zhang, Y.; Wu, X.; Wang, Y.; Cui, H.; Li, X.; Zhang, J.; Tun, N.; Peng, Y.; Yu, J. Regulation of human natural killer cell IFN-gamma production by MicroRNA-146a via targeting the NF-kappaB signaling pathway. Front. Immunol. 2018, 9, 293. [Google Scholar] [CrossRef] [PubMed] [Green Version]
- Bhat, P.; Leggatt, G.; Waterhouse, N.; Frazer, I.H. Interferon-γ derived from cytotoxic lymphocytes directly enhances their motility and cytotoxicity. Cell Death Dis. 2017, 8, e2836. [Google Scholar] [CrossRef] [Green Version]
- Ramsauer, K.; Sadzak, I.; Porras, A.; Pilz, A.; Nebreda, A.R.; Decker, T.; Kovarik, P. p38 MAPK enhances STAT1-dependent transcription independently of Ser-727 phosphorylation. Proc. Natl. Acad. Sci. USA 2002, 99, 12859–12864. [Google Scholar] [CrossRef] [PubMed] [Green Version]
- Hu, X.; Ivashkiv, L.B. Cross-regulation of signaling pathways by interferon-gamma: Implications for immune responses and autoimmune diseases. Immunity 2009, 31, 539–550. [Google Scholar] [CrossRef] [Green Version]
- Wang, T. Role of iNOS and eNOS in modulating proximal tubule transport and acid-base balance. Am. J. Physiol.-Renal Physiol. 2002, 283, F658–F662. [Google Scholar] [CrossRef] [PubMed] [Green Version]
- Xue, Q.; Yan, Y.; Zhang, R.; Xiong, H. Regulation of iNOS on immune cells and its role in diseases. Int. J. Mol. Sci. 2018, 19, 3805. [Google Scholar] [CrossRef] [PubMed] [Green Version]
- Uffort, D.G.; Grimm, E.A.; Ellerhorst, J.A. NF-kappaB mediates mitogen-activated protein kinase pathway-dependent iNOS expression in human melanoma. J. Investig. Dermatol. 2009, 129, 148–154. [Google Scholar] [CrossRef] [PubMed] [Green Version]
- Zhao, K.; Huang, Z.; Lu, H.; Zhou, J.; Wei, T. Induction of inducible nitric oxide synthase increases the production of reactive oxygen species in RAW264.7 macrophages. Biosci. Rep. 2010, 30, 233–241. [Google Scholar] [CrossRef]
- Sugiyama, N.; Kohno, M.; Yokoyama, T. Inhibition of the p38 MAPK pathway ameliorates renal fibrosis in an NPHP2 mouse model. Nephrol. Dial. Transplant. 2012, 27, 1351–1358. [Google Scholar] [CrossRef] [Green Version]
- Fanton d’Andon, M.; Quellard, N.; Fernandez, B.; Ratet, G.; Lacroix-Lamandé, S.; Vandewalle, A.; Boneca, I.G.; Goujon, J.M.; Werts, C. Leptospira interrogans induces fibrosis in the mouse kidney through Inos-dependent, TLR- and NLR-independent signaling pathways. PLoS Negl. Trop. Dis. 2014, 8, e2664. [Google Scholar] [CrossRef]
- Kon, V.; Linton, M.F.; Fazio, S. Atherosclerosis in chronic kidney disease: The role of macrophages. Nat. Rev. Nephrol. 2011, 7, 45–54. [Google Scholar] [CrossRef] [Green Version]
- Kuusisto, J.; Räsänen, K.; Särkioja, T.; Alarakkola, E.; Kosma, V.M. Atherosclerosis-like lesions of the aortic valve are common in adults of all ages: A necropsy study. Heart 2005, 91, 576–582. [Google Scholar] [CrossRef] [Green Version]
- Harry, G.J.; Kraft, A.D. Neuroinflammation and microglia: Considerations and approaches for neurotoxicity assessment. Expert Opin. Drug Metab. Toxicol. 2008, 4, 1265–1277. [Google Scholar] [CrossRef]
- Keum, Y.S.; Choi, B.Y. Molecular and chemical regulation of the Keap1-Nrf2 signaling pathway. Molecules 2014, 19, 10074–10089. [Google Scholar] [CrossRef] [Green Version]
- Kim, J.E.; Bae, S.Y.; Ahn, S.Y.; Kwon, Y.J.; Ko, G.J. The role of nuclear factor erythroid-2-related factor 2 expression in radiocontrast-induced nephropathy. Sci. Rep. 2019, 9, 2608. [Google Scholar] [CrossRef] [PubMed] [Green Version]
- Bhargava, P.; Schnellmann, R.G. Mitochondrial energetics in the kidney. Nat. Rev. Nephrol. 2017, 13, 629–646. [Google Scholar] [CrossRef] [PubMed]
- Li, H.; Wang, F.; Zhang, L.; Cao, Y.; Liu, W.; Hao, J.; Liu, Q.; Duan, H. Modulation of Nrf2 expression alters high glucose-induced oxidative stress and antioxidant gene expression in mouse mesangial cells. Cell Signal 2011, 23, 1625–1632. [Google Scholar] [CrossRef] [PubMed]
- Liu, G.H.; Qu, J.; Shen, X. NF-kappaB/p65 antagonizes Nrf2-ARE pathway by depriving CBP from Nrf2 and facilitating recruitment of HDAC3 to MafK. Biochim. Biophys. Acta 2008, 1783, 713–727. [Google Scholar] [CrossRef] [PubMed] [Green Version]
- Wardyn, J.D.; Ponsford, A.H.; Sanderson, C.M. Dissecting molecular cross-talk between Nrf2 and NF-κB response pathways. Biochem. Soc. Trans. 2015, 43, 621–626. [Google Scholar] [CrossRef] [Green Version]
- Kim, J.E.; You, D.J.; Lee, C.; Ahn, C.; Seong, J.Y.; Hwang, J.I. Suppression of NF-kappaB signaling by KEAP1 regulation of IKKbeta activity through autophagic degradation and inhibition of phosphorylation. Cell Signal. 2010, 22, 1645–1654. [Google Scholar] [CrossRef]
- Cuadrado, A.; Martin-Moldes, Z.; Ye, J.; Lastres-Becker, I. Transcription factors NRF2 and NF-kappaB are coordinated effectors of the Rho family, GTP-binding protein RAC1 during inflammation. J. Biol. Chem. 2014, 289, 15244–15258. [Google Scholar] [CrossRef] [PubMed] [Green Version]
- Baranova, I.N.; Bocharov, A.V.; Vishnyakova, T.G.; Kurlander, R.; Chen, Z.; Fu, D.; Arias, I.M.; Csako, G.; Patterson, A.P.; Eggerman, T.L. CD36 is a novel serum amyloid A (SAA) receptor mediating SAA binding and SAA-induced signaling in human and rodent cells. J. Biol. Chem. 2010, 285, 8492–8506. [Google Scholar] [CrossRef] [PubMed] [Green Version]
- Sakai, N.; Wada, T.; Furuichi, K.; Iwata, Y.; Yoshimoto, K.; Kitagawa, K.; Kokubo, S.; Kobayashi, M.; Takeda, S.; Kida, H.; et al. p38 MAPK phosphorylation and NF-kappa B activation in human crescentic glomerulonephritis. Nephrol. Dial. Transplant. 2002, 17, 998–1004. [Google Scholar] [CrossRef]
- Sun, Z.; Huang, Z.; Zhang, D.D. Phosphorylation of Nrf2 at multiple sites by MAP kinases has a limited contribution in modulating the Nrf2-dependent antioxidant response. PLoS ONE 2009, 4, e6588. [Google Scholar] [CrossRef] [PubMed] [Green Version]
- Bader, T.; Weitzerbin, J. Nuclear accumulation of interferon gamma. Proc. Natl. Acad. Sci. USA 1994, 91, 11831–11835. [Google Scholar] [CrossRef] [Green Version]
- Subramaniam, P.S.; Larkin, J., 3rd; Mujtaba, M.G.; Walter, M.R.; Johnson, H.M. The COOH-terminal nuclear localization sequence of interferon gamma regulates STAT1 alpha nuclear translocation at an intracellular site. J. Cell Sci. 2000, 113 Pt 15, 2771–2781. [Google Scholar] [CrossRef] [PubMed]
- De Winther, M.P.; Kanters, E.; Kraal, G.; Hofker, M.H. Nuclear factor kappaB signaling in atherogenesis. Arterioscler. Thromb. Vasc. Biol. 2005, 25, 904–914. [Google Scholar] [CrossRef] [PubMed] [Green Version]
- Pfeffer, L.M. The role of nuclear factor kappaB in the interferon response. J. Interferon Cytokine Res. 2011, 31, 553–559. [Google Scholar] [CrossRef] [PubMed] [Green Version]
- Hubackova, S.; Kucerova, A.; Michlits, G.; Kyjacova, L.; Reinis, M.; Korolov, O.; Bartek, J.; Hodny, Z. IFNgamma induces oxidative stress, DNA damage and tumor cell senescence via TGFbeta/SMAD signaling-dependent induction of Nox4 and suppression of ANT2. Oncogene 2016, 35, 1236–1249. [Google Scholar] [CrossRef]
- Wu, C.; Xue, Y.; Wang, P.; Lin, L.; Liu, Q.; Li, N.; Xu, J.; Cao, X. IFN-gamma primes macrophage activation by increasing phosphatase and tensin homolog via downregulation of miR-3473b. J. Immunol. 2014, 193, 3036–3044. [Google Scholar] [CrossRef] [PubMed] [Green Version]
- Burke, J.D.; Young, H.A. IFN-γ: A cytokine at the right time, is in the right place. Semin. Immunol. 2019, 43, 101280. [Google Scholar] [CrossRef] [PubMed]
- Anguiano, L.; Kain, R.; Anders, H.J. The glomerular crescent: Triggers, evolution, resolution, and implications for therapy. Curr. Opin. Nephrol. Hypertens. 2020, 29, 302–309. [Google Scholar] [CrossRef] [PubMed]
- Qi, Z.; Li, Z.; Li, W.; Liu, Y.; Wang, C.; Lin, H.; Liu, J.; Li, P. Pseudoginsengenin DQ exhibits therapeutic effects in cisplatin-induced acute kidney injury via Sirt1/NF-κB and caspase signaling pathway without compromising its antitumor activity in mice. Molecules 2018, 23, 3038. [Google Scholar] [CrossRef] [PubMed] [Green Version]
- Kasuya, Y.; Kim, J.D.; Hatano, M.; Tatsumi, K.; Matsuda, S. Pathophysiological roles of stress-activated protein kinases in pulmonary fibrosis. Int. J. Mol. Sci. 2021, 22, 6041. [Google Scholar] [CrossRef]
- Michalik, M.; Wojcik-Pszczola, K.; Paw, M.; Wnuk, D.; Koczurkiewicz, P.; Sanak, M.; Pekala, E.; Madeja, Z. Fibroblast-to-myofibroblast transition in bronchial asthma. Cell. Mol. Life Sci. 2018, 75, 3943–3961. [Google Scholar] [CrossRef] [PubMed] [Green Version]
- Peerapen, P.; Thongboonkerd, V. p38 MAPK mediates calcium oxalate crystal-induced tight junction disruption in distal renal tubular epithelial cells. Sci. Rep. 2013, 3, 1041. [Google Scholar] [CrossRef] [PubMed] [Green Version]
- Said, S.; Hernandez, G.T. The link between chronic kidney disease and cardiovascular disease. J. Nephropathol. 2014, 3, 99–104. [Google Scholar]
- Roumeliotis, S.; Mallamaci, F.; Zoccali, C. Endothelial dysfunction in chronic kidney disease, from biology to clinical outcomes: A 2020 update. J. Clin. Med. 2020, 9, 2359. [Google Scholar] [CrossRef] [PubMed]
- Valdivielso, J.M.; Rodríguez-Puyol, D.; Pascual, J.; Barrios, C.; Bermúdez-López, M.; Sánchez-Niño, M.D.; Pérez-Fernández, M.; Ortiz, A. Atherosclerosis in Chronic Kidney Disease: More, Less, or Just Different? Arterioscler. Thromb. Vasc. Biol. 2019, 39, 1938–1966. [Google Scholar] [CrossRef]
- Lo Sasso, G.; Schlage, W.K.; Boué, S.; Veljkovic, E.; Peitsch, M.C.; Hoeng, J. The Apoe−/− mouse model: A suitable model to study cardiovascular and respiratory diseases in the context of cigarette smoke exposure and harm reduction. J. Transl. Med. 2016, 14, 146. [Google Scholar] [CrossRef] [PubMed] [Green Version]
- Badimon, L.; Vilahur, G. Thrombosis formation on atherosclerotic lesions and plaque rupture. J. Intern. Med. 2014, 276, 618–632. [Google Scholar] [CrossRef] [PubMed]
- Sugiyama, T.; Yamamoto, E.; Bryniarski, K.; Xing, L.; Fracassi, F.; Lee, H.; Jang, I.K. Coronary plaque characteristics in patients with diabetes mellitus who presented with acute coronary syndromes. J. Am. Heart Assoc. 2018, 7, e009245. [Google Scholar] [CrossRef] [PubMed] [Green Version]
- Abela, G.S.; Aziz, K. Cholesterol crystals cause mechanical damage to biological membranes: A proposed mechanism of plaque rupture and erosion leading to arterial thrombosis. Clin. Cardiol. 2005, 28, 413–420. [Google Scholar] [CrossRef] [PubMed]
- Stary, H.C.; Chandler, A.B.; Dinsmore, R.E.; Fuster, V.; Glagov, S.; Insull, W., Jr.; Rosenfeld, M.E.; Schwartz, C.J.; Wagner, W.D.; Wissler, R.W. A definition of advanced types of atherosclerotic lesions and a histological classification of atherosclerosis. A report from the Committee on Vascular Lesions of the Council on Arteriosclerosis, American Heart Association. Circulation 1995, 92, 1355–1374. [Google Scholar] [CrossRef] [PubMed]


Publisher’s Note: MDPI stays neutral with regard to jurisdictional claims in published maps and institutional affiliations. |
© 2021 by the authors. Licensee MDPI, Basel, Switzerland. This article is an open access article distributed under the terms and conditions of the Creative Commons Attribution (CC BY) license (https://creativecommons.org/licenses/by/4.0/).
Share and Cite
Gao, A.; Gupta, S.; Shi, H.; Liu, Y.; Schroder, A.L.; Witting, P.K.; Ahmad, G. Pro-Inflammatory Serum Amyloid a Stimulates Renal Dysfunction and Enhances Atherosclerosis in Apo E-Deficient Mice. Int. J. Mol. Sci. 2021, 22, 12582. https://doi.org/10.3390/ijms222212582
Gao A, Gupta S, Shi H, Liu Y, Schroder AL, Witting PK, Ahmad G. Pro-Inflammatory Serum Amyloid a Stimulates Renal Dysfunction and Enhances Atherosclerosis in Apo E-Deficient Mice. International Journal of Molecular Sciences. 2021; 22(22):12582. https://doi.org/10.3390/ijms222212582
Chicago/Turabian StyleGao, Antony, Sameesh Gupta, Han Shi, Yuyang Liu, Angie L. Schroder, Paul K. Witting, and Gulfam Ahmad. 2021. "Pro-Inflammatory Serum Amyloid a Stimulates Renal Dysfunction and Enhances Atherosclerosis in Apo E-Deficient Mice" International Journal of Molecular Sciences 22, no. 22: 12582. https://doi.org/10.3390/ijms222212582