
Effects of Training Status and Exercise Mode on Global Gene Expression in Skeletal Muscle

 ,
,  ,
, 
Abstract
:1. Introduction
2. Results
2.1. Participant Characteristics
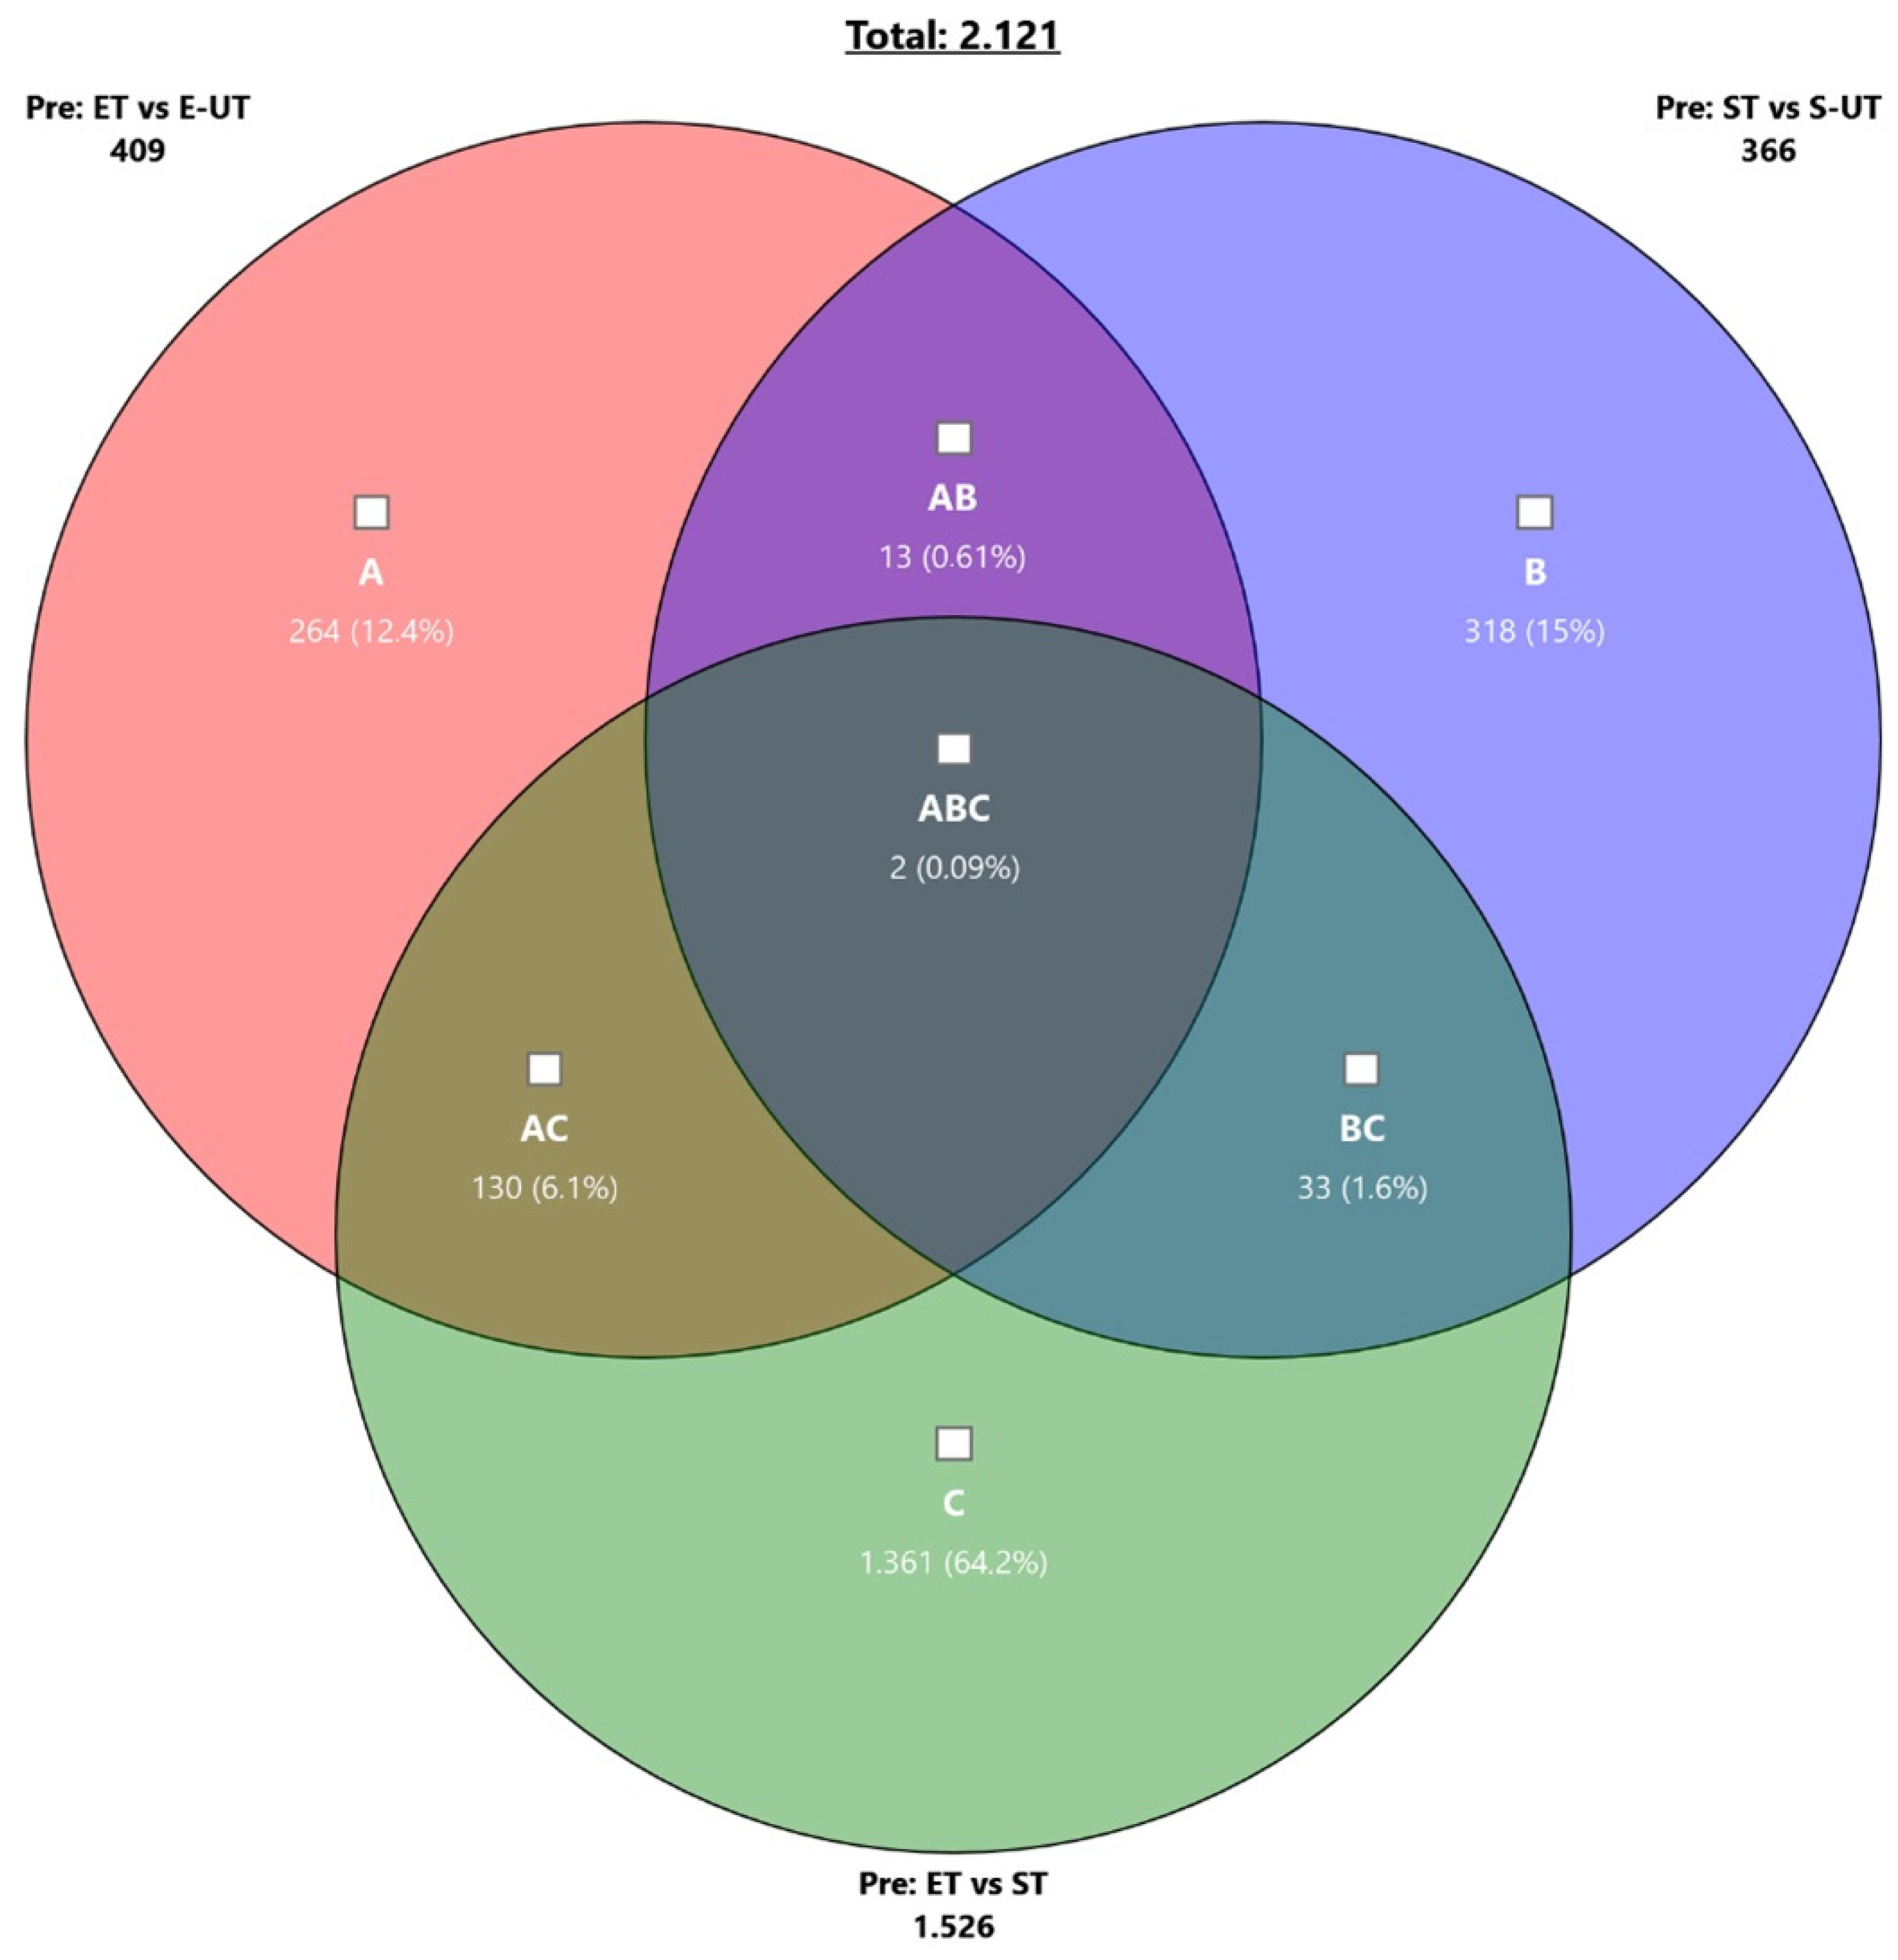
2.2. Effects of Training Status on Global Skeletal Muscle Gene Expression Levels at Rest
2.3. Effects of Training Status on Global Skeletal Muscle Gene Expression Levels at Pre, 30′ Post and 180′ Post
2.4. Effects of Acute, Mode-Specific Exercise on Expression Levels of Selected Genes Involved in Skeletal Muscle Transcription, Metabolism, Muscle Growth/Structure and Vascularization
Pathway Analysis
2.5. Exercise Related Gene Expression Regulation in NR4A Family, Metabolism and Vascularization, and Muscle Growth/Structure after Acute Exercise
3. Discussion
3.1. Exercise Mode Rather Than Training Status Is Associated with Differences in Global Skeletal Muscle Gene Expression at Rest between Trained and Untrained Participants
3.2. Response of Exercise-Related Genes to Acute Exercise in Trained and Untrained Individuals
3.3. Limitations and Future Aims
4. Materials and Methods
4.1. Participants
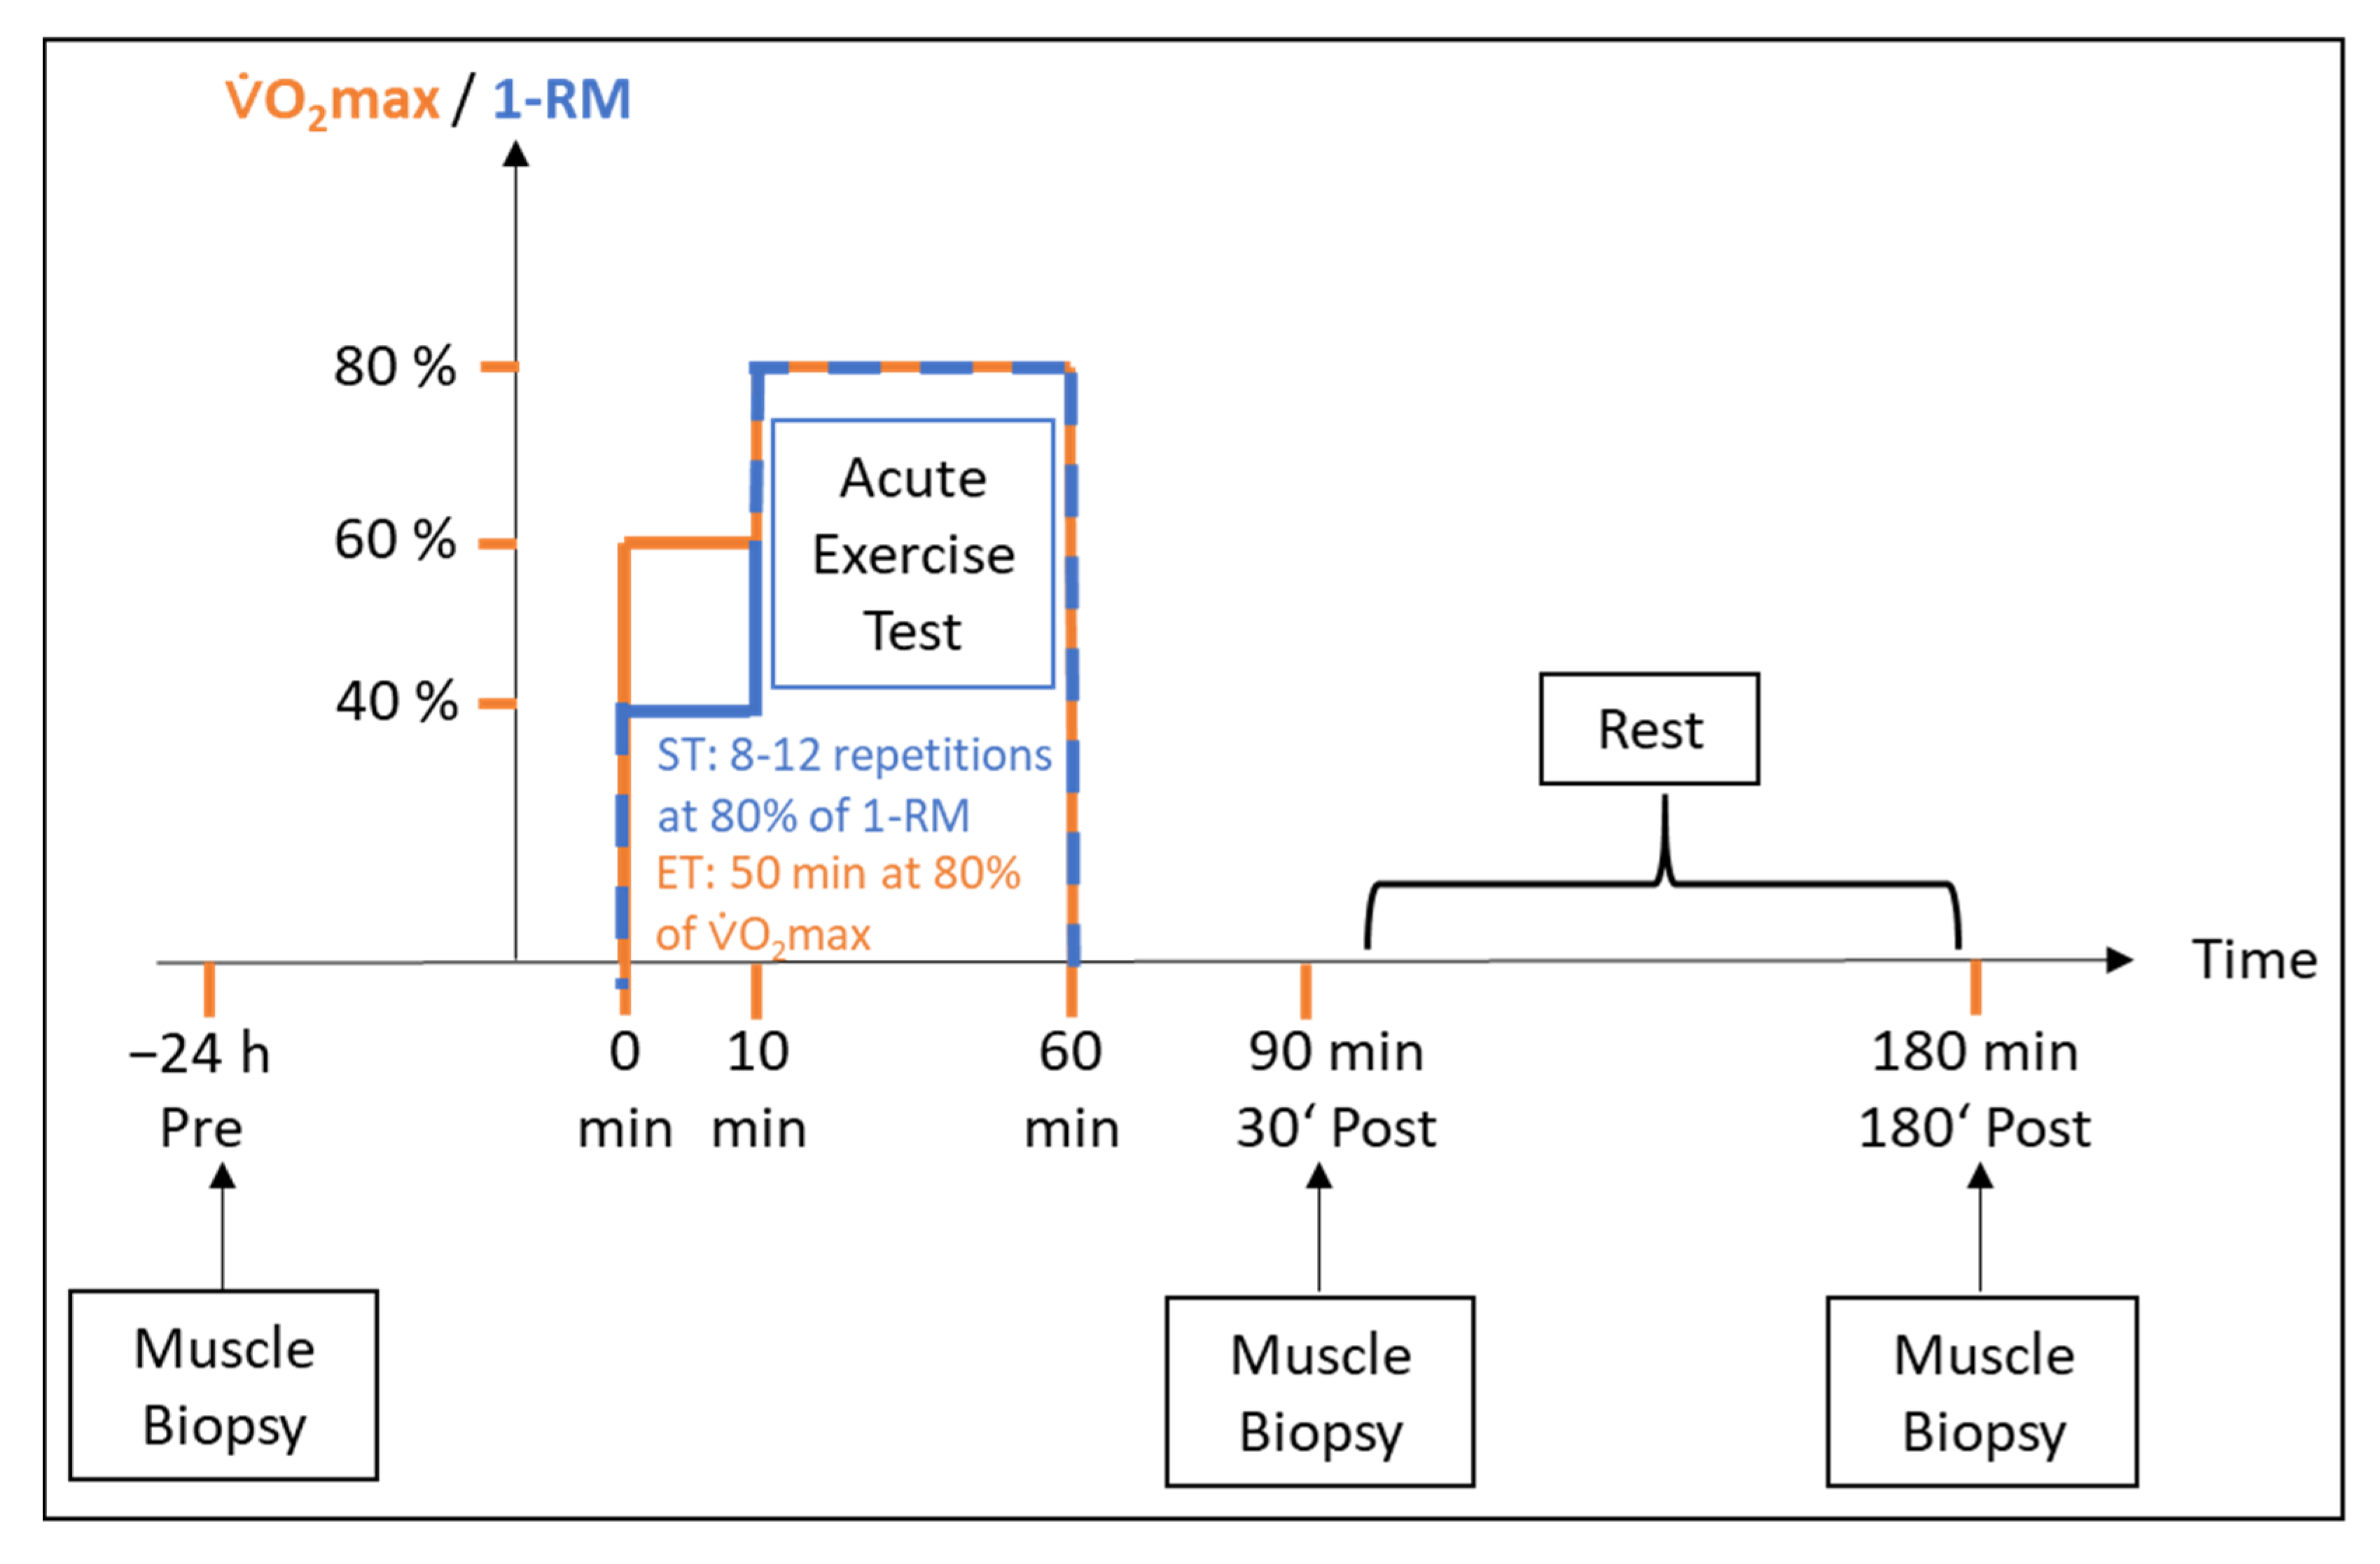
4.2. Study Design
4.3. Skeletal Muscle Biopsy and Blood Sampling
4.4. RNA Isolation and Microarray Analysis
4.5. Microarray Data Analysis
4.6. Pathway Analysis
5. Conclusions
Supplementary Materials
Author Contributions
Funding
Institutional Review Board Statement
Informed Consent Statement
Data Availability Statement
Acknowledgments
Conflicts of Interest
References
- Puthucheary, Z.; Skipworth, J.R.A.; Rawal, J.; Loosemore, M.; van Someren, K.; Montgomery, H.E. Genetic influences in sport and physical performance. Sports Med. 2011, 41, 845–859. [Google Scholar] [CrossRef] [PubMed]
- Klissouras, V. Heritability of adaptive variation. J. Appl. Physiol. 1971, 31, 338–344. [Google Scholar] [CrossRef] [PubMed]
- Bouchard, C.; Leon, A.S.; Rao, D.C.; Skinner, J.S.; Wilmore, J.H.; Gagnon, J. The HERITAGE family study. Aims, design, and measurement protocol. Med. Sci. Sports Exerc. 1995, 27, 721–729. [Google Scholar] [CrossRef] [PubMed]
- Lortie, G.; Simoneau, J.A.; Hamel, P.; Boulay, M.R.; Landry, F.; Bouchard, C. Responses of maximal aerobic power and capacity to aerobic training. Int. J. Sports Med. 1984, 5, 232–236. [Google Scholar] [CrossRef] [PubMed]
- Bouchard, C. Individual differences in the response to regular exercise. Int. J. Obes. Relat. Metab. Disord. 1995, 19 (Suppl. S4), S5–S8. [Google Scholar] [PubMed]
- Bouchard, C.; Rankinen, T. Individual differences in response to regular physical activity. Med. Sci. Sports Exerc. 2001, 33, S446–S451, discussion S452–S453. [Google Scholar] [CrossRef] [Green Version]
- Georgiades, E.; Klissouras, V.; Baulch, J.; Wang, G.; Pitsiladis, Y. Why nature prevails over nurture in the making of the elite athlete. BMC Genom. 2017, 18, 835. [Google Scholar] [CrossRef] [PubMed] [Green Version]
- Del Coso, J.; Lucia, A. Genetic Influence in Exercise Performance. Genes 2021, 12, 651. [Google Scholar] [CrossRef] [PubMed]
- Rea, I.M.; Dellet, M.; Mills, K.I. Living long and ageing well: Is epigenomics the missing link between nature and nurture? Biogerontology 2016, 17, 33–54. [Google Scholar] [CrossRef]
- Ehlert, T.; Simon, P.; Moser, D.A. Epigenetics in sports. Sports Med. 2013, 43, 93–110. [Google Scholar] [CrossRef]
- Timmons, J.A. Variability in training-induced skeletal muscle adaptation. J. Appl. Physiol. 2011, 110, 846–853. [Google Scholar] [CrossRef]
- Makhnovskii, P.A.; Bokov, R.O.; Kolpakov, F.A.; Popov, D.V. Transcriptomic Signatures and Upstream Regulation in Human Skeletal Muscle Adapted to Disuse and Aerobic Exercise. Int. J. Mol. Sci. 2021, 22, 1208. [Google Scholar] [CrossRef] [PubMed]
- Murton, A.J.; Billeter, R.; Stephens, F.B.; Des Etages, S.G.; Graber, F.; Hill, R.J.; Marimuthu, K.; Greenhaff, P.L. Transient transcriptional events in human skeletal muscle at the outset of concentric resistance exercise training. J. Appl. Physiol. 2014, 116, 113–125. [Google Scholar] [CrossRef] [PubMed] [Green Version]
- Popov, D.V.; Makhnovskii, P.A.; Shagimardanova, E.I.; Gazizova, G.R.; Lysenko, E.A.; Gusev, O.A.; Vinogradova, O.L. Contractile activity-specific transcriptome response to acute endurance exercise and training in human skeletal muscle. Am. J. Physiol. Endocrinol. Metab. 2019, 316, E605–E614. [Google Scholar] [CrossRef] [PubMed]
- Bouchard, C. Exercise genomics—A paradigm shift is needed: A commentary. Br. J. Sports Med. 2015, 49, 1492–1496. [Google Scholar] [CrossRef] [PubMed] [Green Version]
- Rankinen, T.; Fuku, N.; Wolfarth, B.; Wang, G.; Sarzynski, M.A.; Alexeev, D.G.; Ahmetov, I.I.; Boulay, M.R.; Cieszczyk, P.; Eynon, N.; et al. No Evidence of a Common DNA Variant Profile Specific to World Class Endurance Athletes. PLoS ONE 2016, 11, e0147330. [Google Scholar] [CrossRef]
- Neufer, P.D.; Bamman, M.M.; Muoio, D.M.; Bouchard, C.; Cooper, D.M.; Goodpaster, B.H.; Booth, F.W.; Kohrt, W.M.; Gerszten, R.E.; Mattson, M.P.; et al. Understanding the Cellular and Molecular Mechanisms of Physical Activity-Induced Health Benefits. Cell Metab. 2015, 22, 4–11. [Google Scholar] [CrossRef] [Green Version]
- Pitsiladis, Y.P.; Tanaka, M.; Eynon, N.; Bouchard, C.; North, K.N.; Williams, A.G.; Collins, M.; Moran, C.N.; Britton, S.L.; Fuku, N.; et al. Athlome Project Consortium: A concerted effort to discover genomic and other “omic” markers of athletic performance. Physiol. Genom. 2016, 48, 183–190. [Google Scholar] [CrossRef] [PubMed] [Green Version]
- Hoffman, N.J. Omics and Exercise: Global Approaches for Mapping Exercise Biological Networks. Cold Spring Harb. Perspect. Med. 2017, 7, a029884. [Google Scholar] [CrossRef]
- Timmons, J.A.; Sundberg, C.J. Oligonucleotide microarray expression profiling: Human skeletal muscle phenotype and aerobic exercise training. IUBMB Life 2006, 58, 15–24. [Google Scholar] [CrossRef]
- Virtanen, C.; Takahashi, M. Muscling in on microarrays. Appl. Physiol. Nutr. Metab. 2008, 33, 124–129. [Google Scholar] [CrossRef] [PubMed]
- Vissing, K.; Schjerling, P. Simplified data access on human skeletal muscle transcriptome responses to differentiated exercise. Sci. Data 2014, 1, 140041. [Google Scholar] [CrossRef] [PubMed]
- Liu, D.; Wang, R.; Grant, A.R.; Zhang, J.; Gordon, P.M.; Wei, Y.; Chen, P. Immune adaptation to chronic intense exercise training: New microarray evidence. BMC Genom. 2017, 18, 29. [Google Scholar] [CrossRef] [Green Version]
- Gordon, P.M.; Liu, D.; Sartor, M.A.; Iglayreger, H.B.; Pistilli, E.E.; Gutmann, L.; Nader, G.A.; Hoffman, E.P. Resistance exercise training influences skeletal muscle immune activation: A microarray analysis. J. Appl. Physiol. 2012, 112, 443–453. [Google Scholar] [CrossRef]
- Bonafiglia, J.T.; Menzies, K.J.; Gurd, B.J. Gene expression variability in human skeletal muscle transcriptome responses to acute resistance exercise. Exp. Physiol. 2019, 104, 625–629. [Google Scholar] [CrossRef]
- Pickering, C.; Kiely, J.; Grgic, J.; Lucia, A.; Del Coso, J. Can Genetic Testing Identify Talent for Sport? Genes 2019, 10, 972. [Google Scholar] [CrossRef] [Green Version]
- Treff, G.; Winkert, K.; Steinacker, J.M. Olympic Rowing—Maximum Capacity over 2000 Meters. Dtsch. Z. Sportmed. 2021, 72, 203–211. [Google Scholar] [CrossRef]
- Schild, M.; Ruhs, A.; Beiter, T.; Zügel, M.; Hudemann, J.; Reimer, A.; Krumholz-Wagner, I.; Wagner, C.; Keller, J.; Eder, K.; et al. Basal and exercise induced label-free quantitative protein profiling of m. vastus lateralis in trained and untrained individuals. J. Proteom. 2015, 122, 119–132. [Google Scholar] [CrossRef] [PubMed]
- Chapman, M.A.; Arif, M.; Emanuelsson, E.B.; Reitzner, S.M.; Lindholm, M.E.; Mardinoglu, A.; Sundberg, C.J. Skeletal Muscle Transcriptomic Comparison between Long-Term Trained and Untrained Men and Women. Cell Rep. 2020, 31, 107808. [Google Scholar] [CrossRef] [PubMed]
- Hawley, J.A.; Hargreaves, M.; Joyner, M.J.; Zierath, J.R. Integrative biology of exercise. Cell 2014, 159, 738–749. [Google Scholar] [CrossRef] [Green Version]
- Ranhotra, H.S. The NR4A orphan nuclear receptors: Mediators in metabolism and diseases. J. Recept. Signal Transduct. Res. 2015, 35, 184–188. [Google Scholar] [CrossRef] [PubMed]
- Mey, J.T.; Solomon, T.P.J.; Kirwan, J.P.; Haus, J.M. Skeletal muscle Nur77 and NOR1 insulin responsiveness is blunted in obesity and type 2 diabetes but improved after exercise training. Physiol. Rep. 2019, 7, e14042. [Google Scholar] [CrossRef] [PubMed]
- Pearen, M.A.; Muscat, G.E.O. Minireview: Nuclear hormone receptor 4A signaling: Implications for metabolic disease. Mol. Endocrinol. 2010, 24, 1891–1903. [Google Scholar] [CrossRef] [Green Version]
- Zhang, L.; Wang, Q.; Liu, W.; Liu, F.; Ji, A.; Li, Y. The Orphan Nuclear Receptor 4A1: A Potential New Therapeutic Target for Metabolic Diseases. J. Diabetes Res. 2018, 2018, 9363461. [Google Scholar] [CrossRef] [Green Version]
- Catoire, M.; Mensink, M.; Boekschoten, M.V.; Hangelbroek, R.; Müller, M.; Schrauwen, P.; Kersten, S. Pronounced effects of acute endurance exercise on gene expression in resting and exercising human skeletal muscle. PLoS ONE 2012, 7, e51066. [Google Scholar] [CrossRef] [Green Version]
- Rundqvist, H.C.; Montelius, A.; Osterlund, T.; Norman, B.; Esbjornsson, M.; Jansson, E. Acute sprint exercise transcriptome in human skeletal muscle. PLoS ONE 2019, 14, e0223024. [Google Scholar] [CrossRef] [PubMed] [Green Version]
- Kawasaki, E.; Hokari, F.; Sasaki, M.; Sakai, A.; Koshinaka, K.; Kawanaka, K. Role of local muscle contractile activity in the exercise-induced increase in NR4A receptor mRNA expression. J. Appl. Physiol. 2009, 106, 1826–1831. [Google Scholar] [CrossRef] [Green Version]
- Keller, P.; Vollaard, N.B.J.; Gustafsson, T.; Gallagher, I.J.; Sundberg, C.J.; Rankinen, T.; Britton, S.L.; Bouchard, C.; Koch, L.G.; Timmons, J.A. A transcriptional map of the impact of endurance exercise training on skeletal muscle phenotype. J. Appl. Physiol. 2011, 110, 46–59. [Google Scholar] [CrossRef] [Green Version]
- Gustafsson, T.; Kraus, W.E. Exercise-induced angiogenesis-related growth and transcription factors in skeletal muscle, and their modification in muscle pathology. Front. Biosci. 2001, 6, D75–D89. [Google Scholar] [CrossRef] [Green Version]
- Stepto, N.K.; Coffey, V.G.; Carey, A.L.; Ponnampalam, A.P.; Canny, B.J.; Powell, D.; Hawley, J.A. Global gene expression in skeletal muscle from well-trained strength and endurance athletes. Med. Sci. Sports Exerc. 2009, 41, 546–565. [Google Scholar] [CrossRef]
- Kubota, N.; Kubota, T.; Kajiwara, E.; Iwamura, T.; Kumagai, H.; Watanabe, T.; Inoue, M.; Takamoto, I.; Sasako, T.; Kumagai, K.; et al. Differential hepatic distribution of insulin receptor substrates causes selective insulin resistance in diabetes and obesity. Nat. Commun. 2016, 7, 12977. [Google Scholar] [CrossRef] [PubMed] [Green Version]
- Besse-Patin, A.; Jeromson, S.; Levesque-Damphousse, P.; Secco, B.; Laplante, M.; Estall, J.L. PGC1A regulates the IRS1:IRS2 ratio during fasting to influence hepatic metabolism downstream of insulin. Proc. Natl. Acad. Sci. USA 2019, 116, 4285–4290. [Google Scholar] [CrossRef] [PubMed] [Green Version]
- Ichida, M.; Nemoto, S.; Finkel, T. Identification of a specific molecular repressor of the peroxisome proliferator-activated receptor gamma Coactivator-1 alpha (PGC-1alpha). J. Biol. Chem. 2002, 277, 50991–50995. [Google Scholar] [CrossRef] [Green Version]
- Eckstein, S.S.; Weigert, C.; Lehmann, R. Divergent Roles of IRS (Insulin Receptor Substrate) 1 and 2 in Liver and Skeletal Muscle. Curr. Med. Chem. 2017, 24, 1827–1852. [Google Scholar] [CrossRef] [PubMed]
- Long, Y.C.; Cheng, Z.; Copps, K.D.; White, M.F. Insulin receptor substrates Irs1 and Irs2 coordinate skeletal muscle growth and metabolism via the Akt and AMPK pathways. Mol. Cell. Biol. 2011, 31, 430–441. [Google Scholar] [CrossRef] [Green Version]
- Grade, C.V.C.; Mantovani, C.S.; Alvares, L.E. Myostatin gene promoter: Structure, conservation and importance as a target for muscle modulation. J. Anim. Sci. Biotechnol. 2019, 10, 32. [Google Scholar] [CrossRef] [Green Version]
- McPherron, A.C.; Lawler, A.M.; Lee, S.J. Regulation of skeletal muscle mass in mice by a new TGF-beta superfamily member. Nature 1997, 387, 83–90. [Google Scholar] [CrossRef]
- Mosher, D.S.; Quignon, P.; Bustamante, C.D.; Sutter, N.B.; Mellersh, C.S.; Parker, H.G.; Ostrander, E.A. A mutation in the myostatin gene increases muscle mass and enhances racing performance in heterozygote dogs. PLoS Genet. 2007, 3, e79. [Google Scholar] [CrossRef] [PubMed]
- Santiago, C.; Ruiz, J.R.; Rodríguez-Romo, G.; Fiuza-Luces, C.; Yvert, T.; Gonzalez-Freire, M.; Gómez-Gallego, F.; Morán, M.; Lucia, A. The K153R polymorphism in the myostatin gene and muscle power phenotypes in young, non-athletic men. PLoS ONE 2011, 6, e16323. [Google Scholar] [CrossRef]
- Damas, F.; Ugrinowitsch, C.; Libardi, C.A.; Jannig, P.R.; Hector, A.J.; McGlory, C.; Lixandrão, M.E.; Vechin, F.C.; Montenegro, H.; Tricoli, V.; et al. Resistance training in young men induces muscle transcriptome-wide changes associated with muscle structure and metabolism refining the response to exercise-induced stress. Eur. J. Appl. Physiol. 2018, 118, 2607–2616. [Google Scholar] [CrossRef]
- Hughes, D.C.; Ellefsen, S.; Baar, K. Adaptations to Endurance and Strength Training. Cold Spring Harb. Perspect. Med. 2018, 8, a029769. [Google Scholar] [CrossRef] [PubMed]
- Liu, D.; Sartor, M.A.; Nader, G.A.; Gutmann, L.; Treutelaar, M.K.; Pistilli, E.E.; Iglayreger, H.B.; Burant, C.F.; Hoffman, E.P.; Gordon, P.M. Skeletal muscle gene expression in response to resistance exercise: Sex specific regulation. BMC Genom. 2010, 11, 659. [Google Scholar] [CrossRef] [PubMed] [Green Version]
- Kawasaki, E.; Hokari, F.; Sasaki, M.; Sakai, A.; Koshinaka, K.; Kawanaka, K. The effects of β-adrenergic stimulation and exercise on NR4A3 protein expression in rat skeletal muscle. J. Physiol. Sci. 2011, 61, 1–11. [Google Scholar] [CrossRef] [PubMed]


| Group | Age [Years] | Body Mass [kg] | Height [cm] | BMI [kg/m2] | VO2max [L/min] | VO2max [mL/kg/min] |
|---|---|---|---|---|---|---|
| ET | 25.4 ± 3.8 | 72.55 ± 5.98 | 181.1 ± 4.9 | 22.00 ± 1.11 | 4.9 ± 0.9 | 67.2 ± 8.9 |
| E-UT | 22.6 ± 2.8 | 70.48 ± 5.49 | 180.6 ± 8.1 | 21.59 ± 1.96 | 10.2 ± 14.1 | 32.9 ± 19.1 |
| ST | 24.6 ± 4.3 | 83.63 ± 10.51 | 177.0 ± 5.9 | 26.66 ± 3.66 | 3.6 ± 0.6 | 43.6 ± 8.1 |
| S-UT | 24.3 ± 3.0 | 75.95 ± 8.30 | 180.3 ± 6.5 | 23.06 ± 2.77 | 3.0 ± 0.3 | 41.5 ± 5.0 |
| Metabolic Variables | Training Group Effect | Regulation | |
|---|---|---|---|
| Nuclear Transcription Factors (NR4A Family) | |||
| NR4A1 | All | upregulated | |
| NR4A2 | All | upregulated | |
| NR4A3 | All | upregulated | |
| Metabolism and vascularization | |||
| PGC-1α | ET/E-UT | upregulated | |
| VEGF | ET/UT | upregulated | |
| Muscle growth/structure | |||
| Myostatin | All | downregulated | |
| IRS1 | 30′ Post: ET 180′ Post: ST/S-UT | downregulated | |
| IRS2 | All | upregulated | |
| HIF-1α | All | upregulated | |
| Comparison | Group 1 | Group 2 | Time Point | # Per Group | Total | Up | Down |
|---|---|---|---|---|---|---|---|
| ET vs. E-UT | ET | E-UT | Pre | 8 | 409 | 158 | 251 |
| ST vs. S-UT | ST | S-UT | Pre | 8 | 366 | 303 | 63 |
| ET vs. ST | ET | ST | Pre | 8 | 1526 | 558 | 968 |
| Endurance Trained (ET) | Endurance Untrained (E-UT) | Strength Trained (ST) | Strength Untrained (S-UT) | |
|---|---|---|---|---|
| Exercise anamnesis: | ||||
| Endurance training Strength training | >5 h/Week <1 h/Week | <2 h leisure activities/Week | <1 h/Week >2 × 1.5 h/Week | <2 h leisure activities/Week |
| VO2max: | >57 (mL/min/kg) | <47 (mL/min/kg) | <47 (mL/min/kg) | <47 (mL/min/kg) |
| One repetition maximum (1-RM): | ||||
| Bench pull | <1 × BW | <1 × BW | >1 × BW | <1 × BW |
| Leg press | <3.5 × BW | <2.5 × BW | >3.5 × BW | <2.5 × BW |
| Bench press | <1 × KG | <1.5 × KG | >1 × KG | <1.5 × KG |
| Included participants for microarray analysis | 8 | 8 | 8 | 8 |
Publisher’s Note: MDPI stays neutral with regard to jurisdictional claims in published maps and institutional affiliations. |
© 2021 by the authors. Licensee MDPI, Basel, Switzerland. This article is an open access article distributed under the terms and conditions of the Creative Commons Attribution (CC BY) license (https://creativecommons.org/licenses/by/4.0/).
Share and Cite
Bizjak, D.A.; Zügel, M.; Treff, G.; Winkert, K.; Jerg, A.; Hudemann, J.; Mooren, F.C.; Krüger, K.; Nieß, A.; Steinacker, J.M. Effects of Training Status and Exercise Mode on Global Gene Expression in Skeletal Muscle. Int. J. Mol. Sci. 2021, 22, 12578. https://doi.org/10.3390/ijms222212578
Bizjak DA, Zügel M, Treff G, Winkert K, Jerg A, Hudemann J, Mooren FC, Krüger K, Nieß A, Steinacker JM. Effects of Training Status and Exercise Mode on Global Gene Expression in Skeletal Muscle. International Journal of Molecular Sciences. 2021; 22(22):12578. https://doi.org/10.3390/ijms222212578
Chicago/Turabian StyleBizjak, Daniel A., Martina Zügel, Gunnar Treff, Kay Winkert, Achim Jerg, Jens Hudemann, Frank C. Mooren, Karsten Krüger, Andreas Nieß, and Jürgen M. Steinacker. 2021. "Effects of Training Status and Exercise Mode on Global Gene Expression in Skeletal Muscle" International Journal of Molecular Sciences 22, no. 22: 12578. https://doi.org/10.3390/ijms222212578
APA StyleBizjak, D. A., Zügel, M., Treff, G., Winkert, K., Jerg, A., Hudemann, J., Mooren, F. C., Krüger, K., Nieß, A., & Steinacker, J. M. (2021). Effects of Training Status and Exercise Mode on Global Gene Expression in Skeletal Muscle. International Journal of Molecular Sciences, 22(22), 12578. https://doi.org/10.3390/ijms222212578