
Measurement of Lateral Transmission of Force in the Extensor Digitorum Longus Muscle of Young and Old Mice

 , , ,
, , , 
Abstract
:1. Introduction
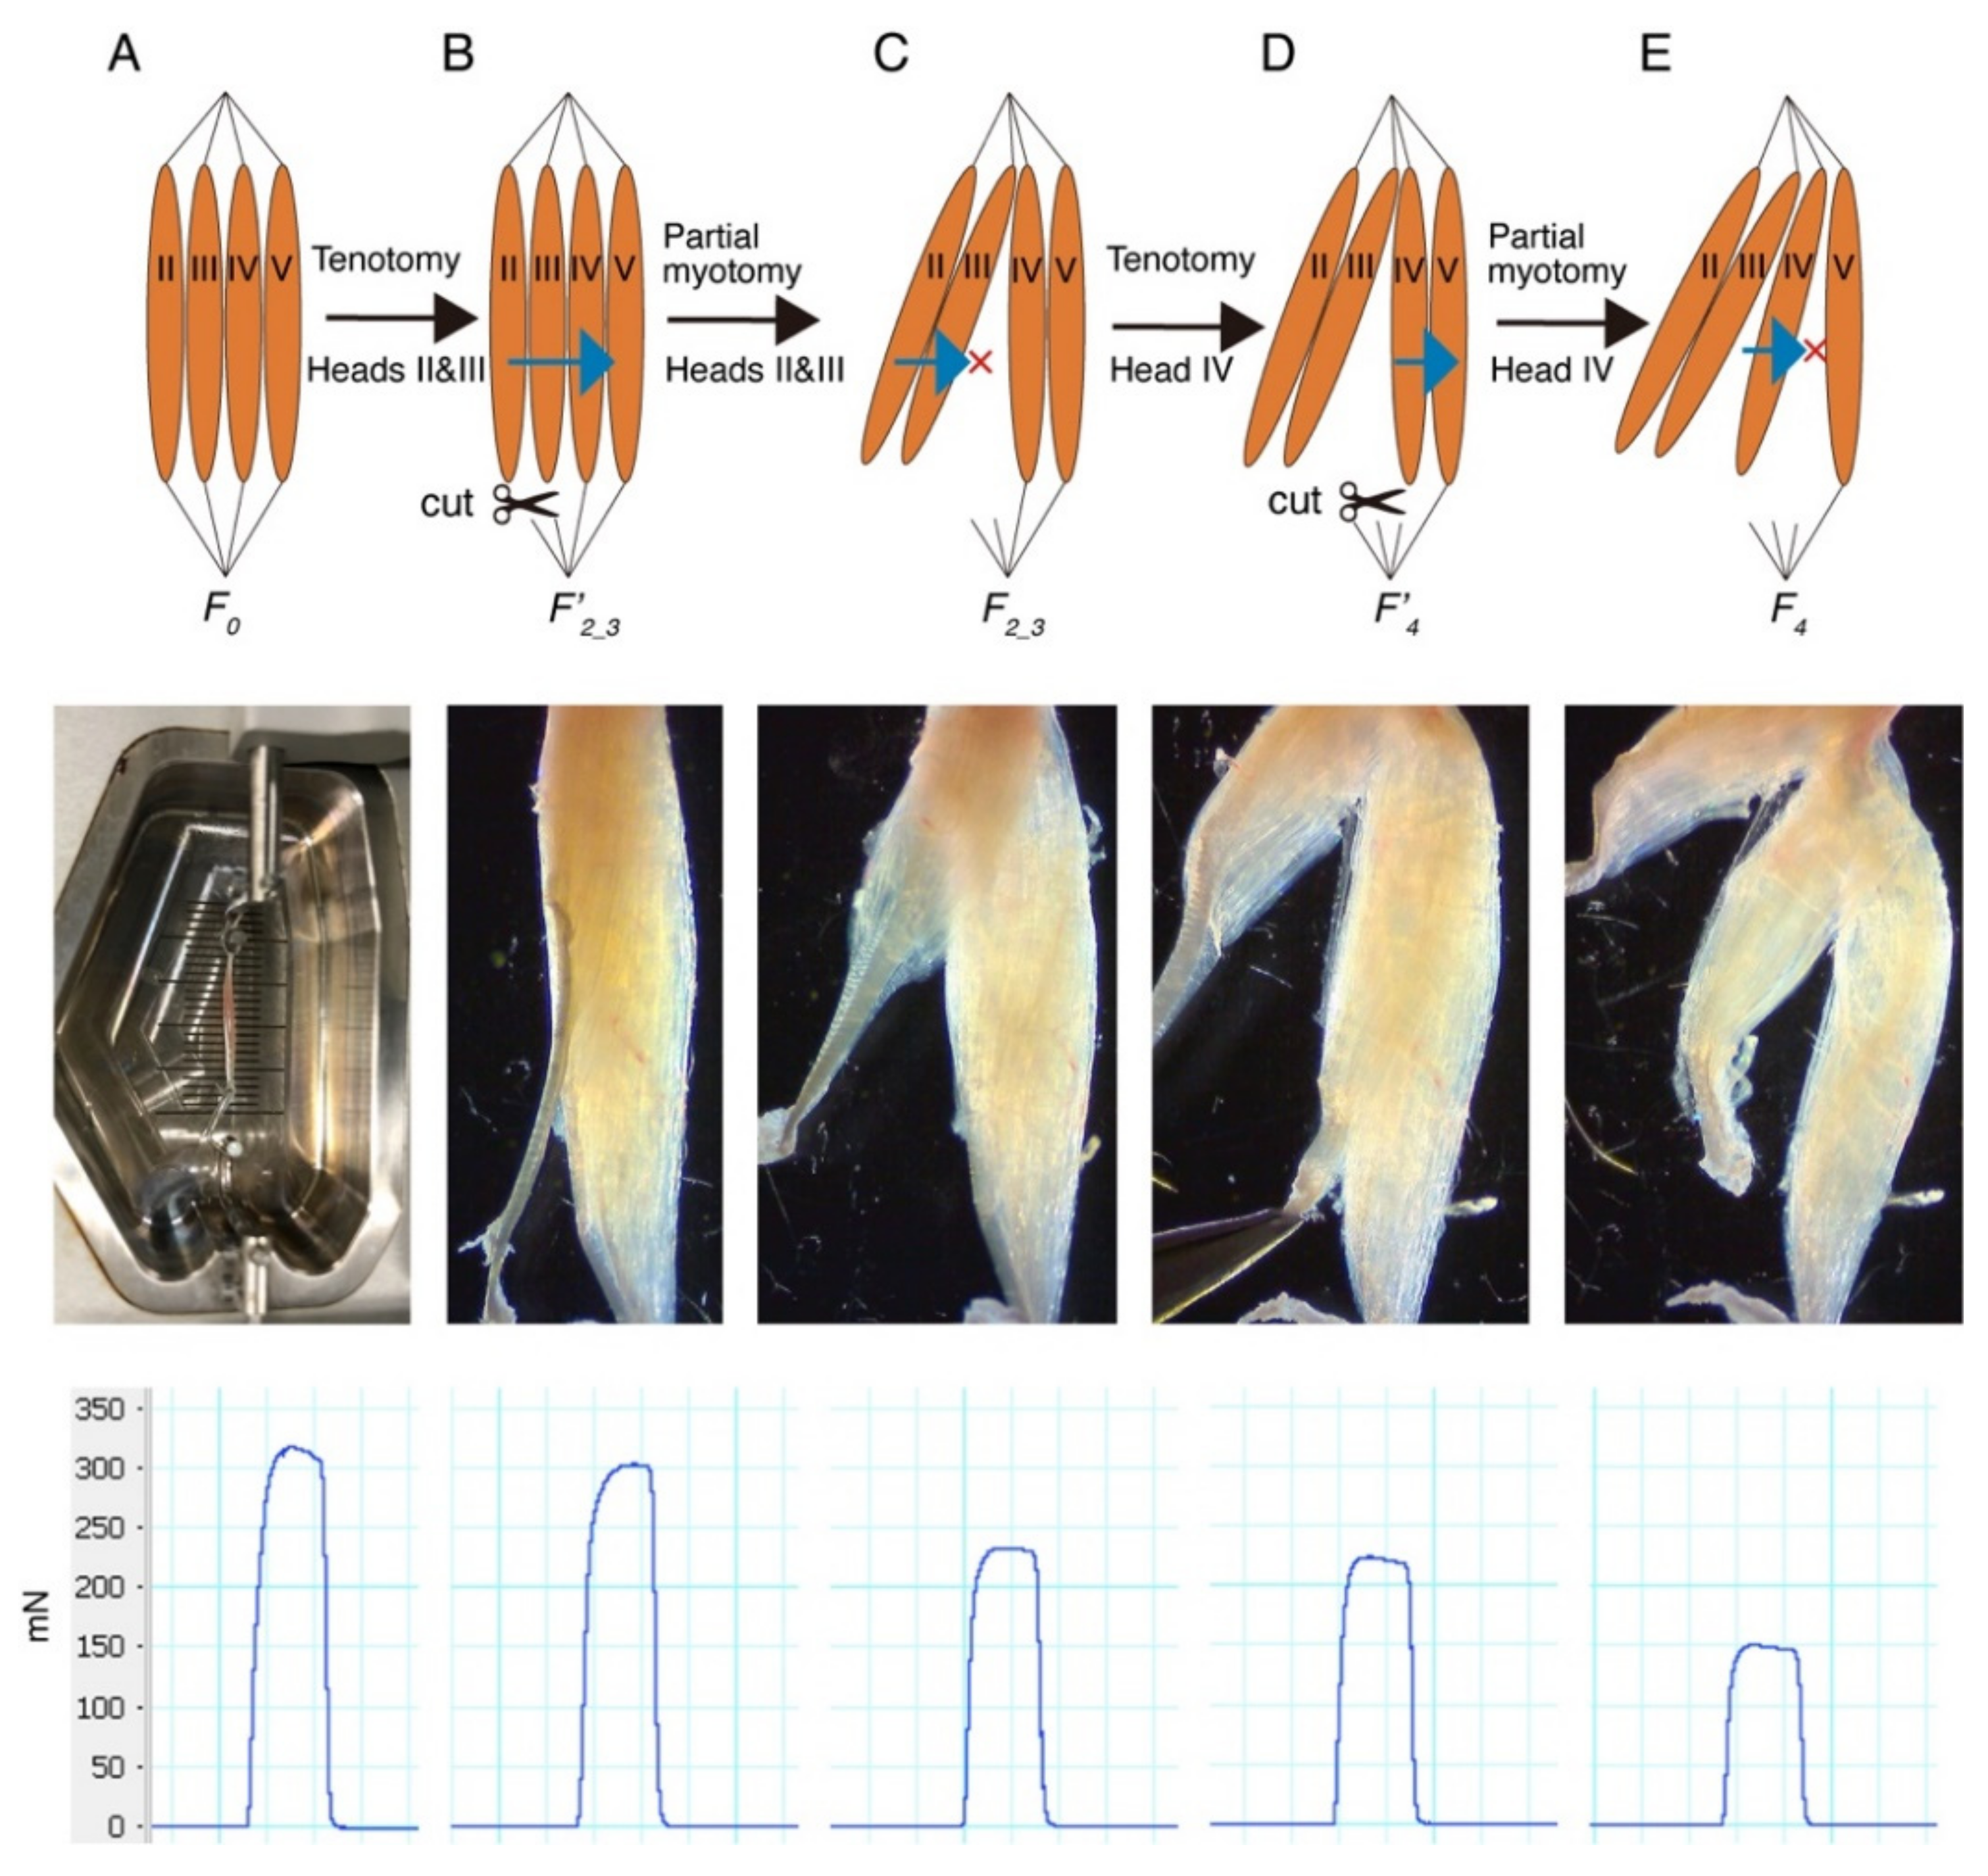
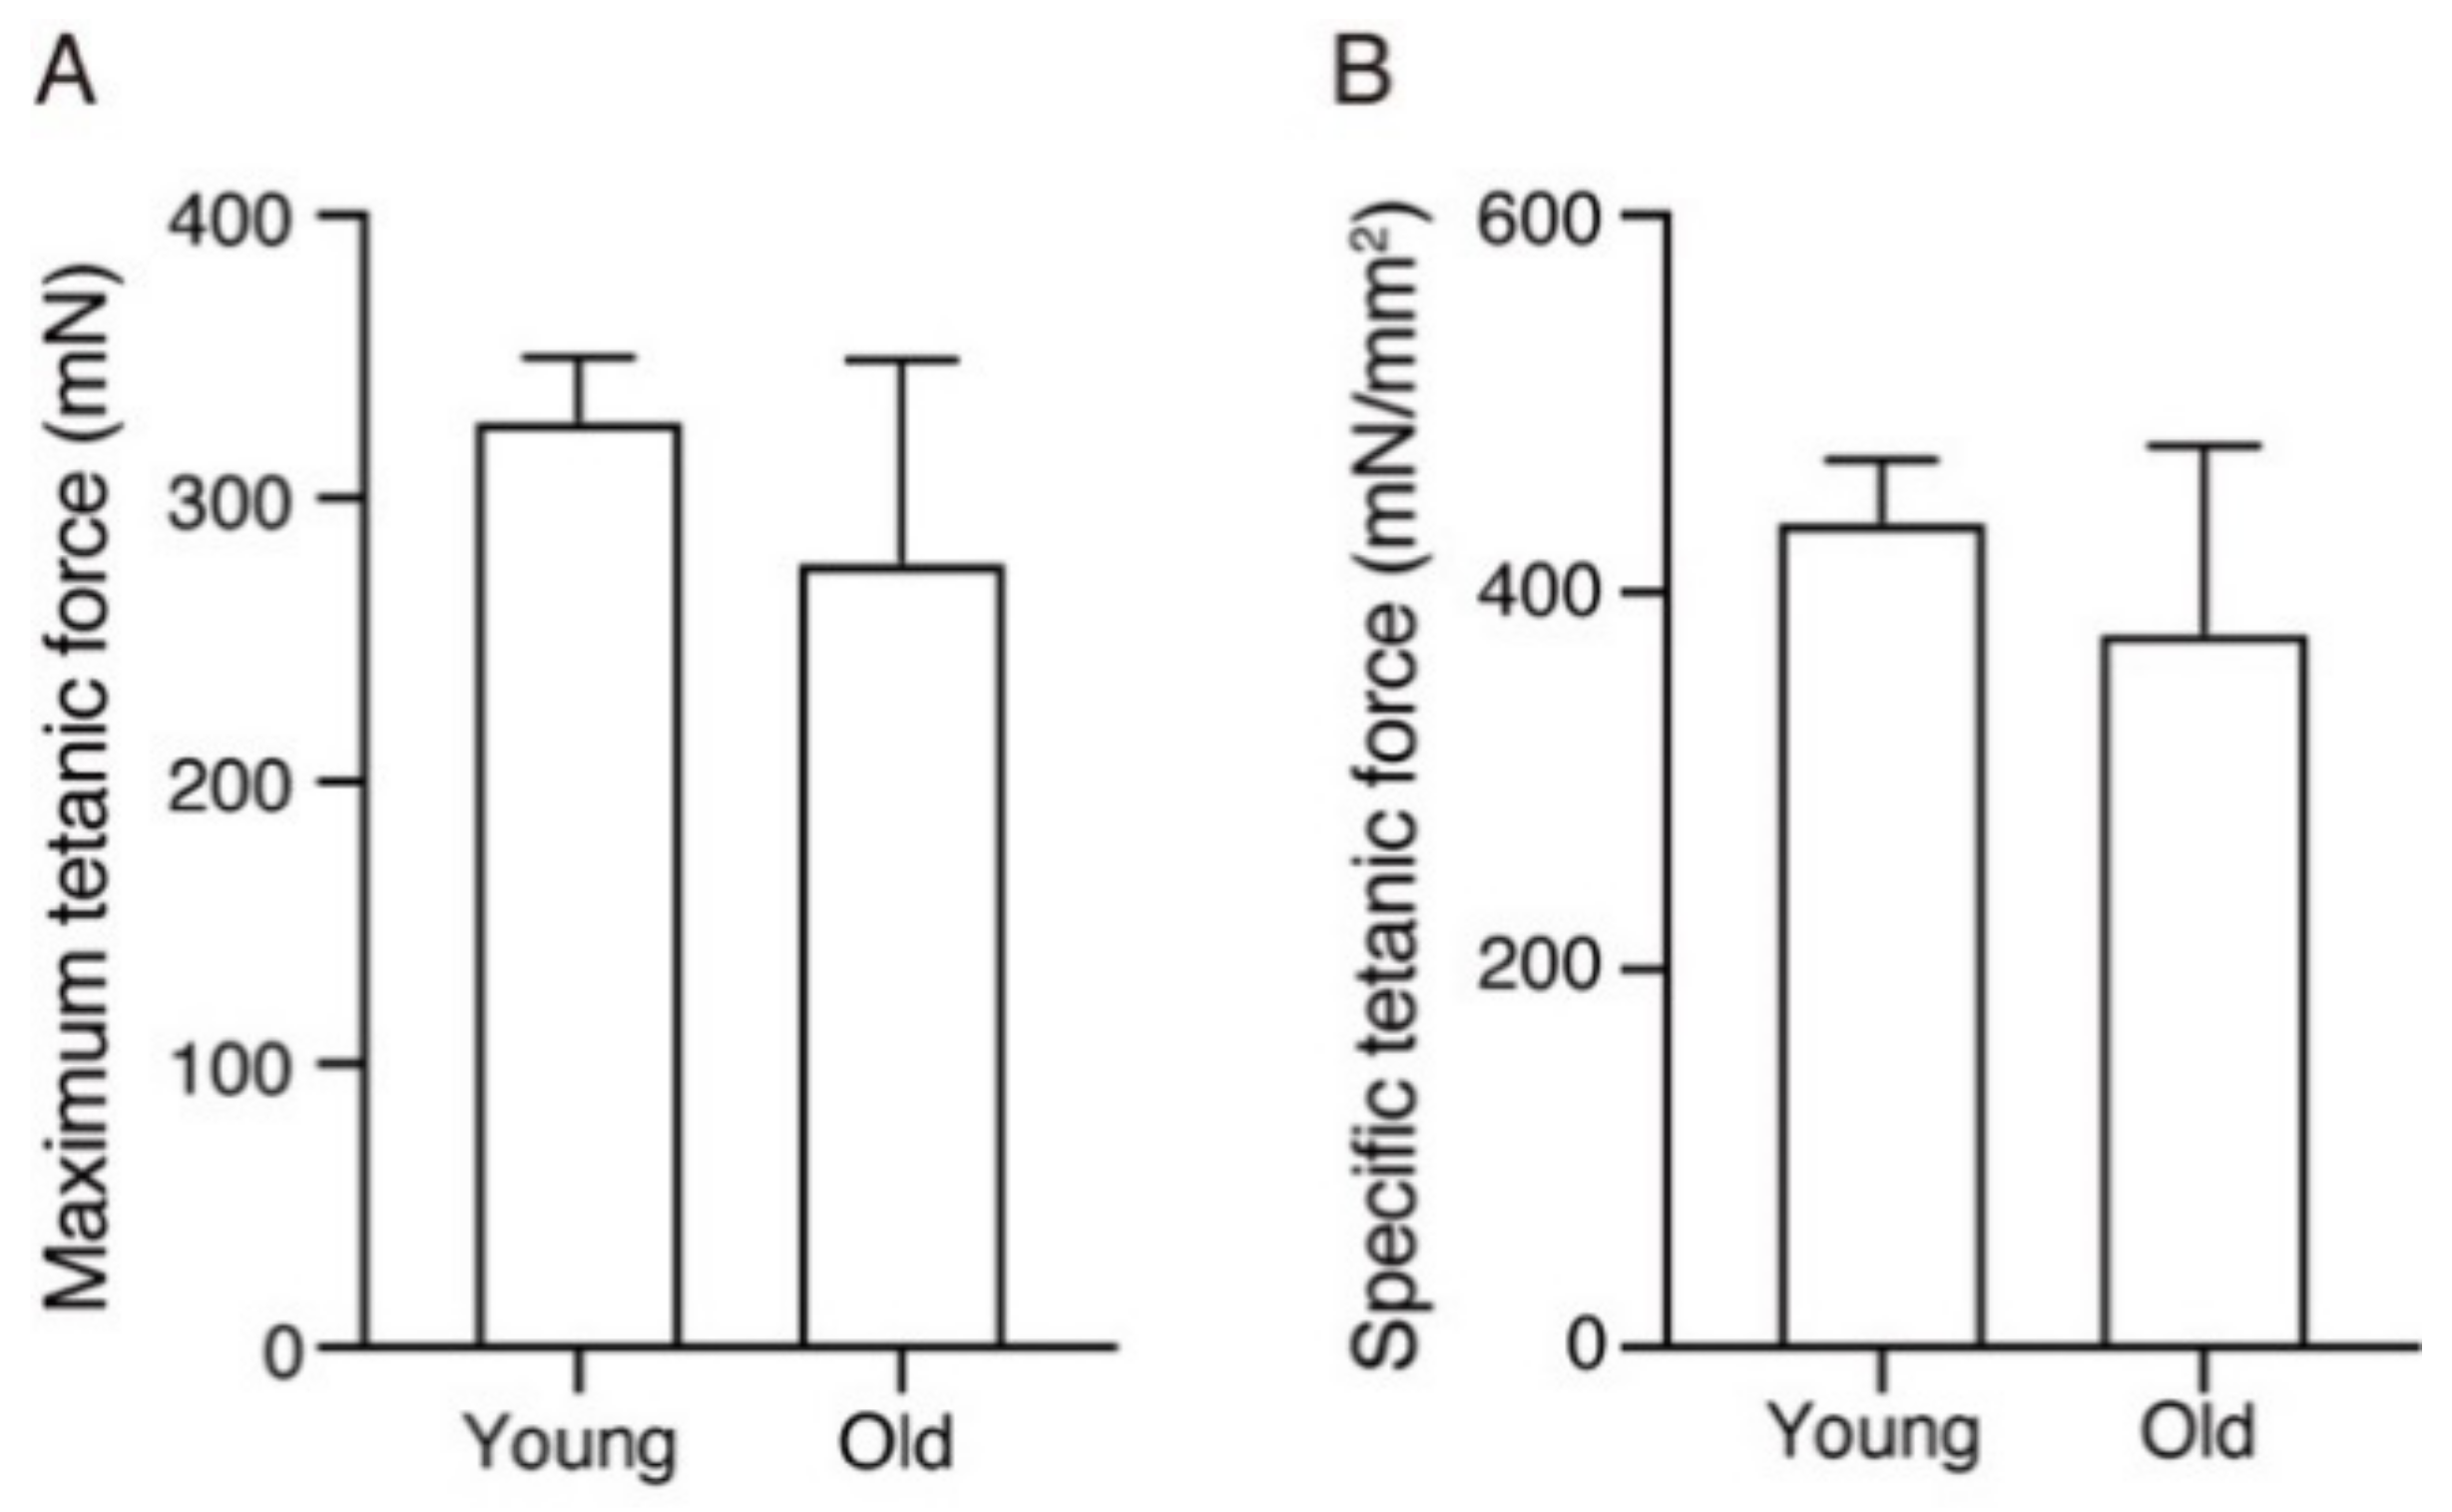
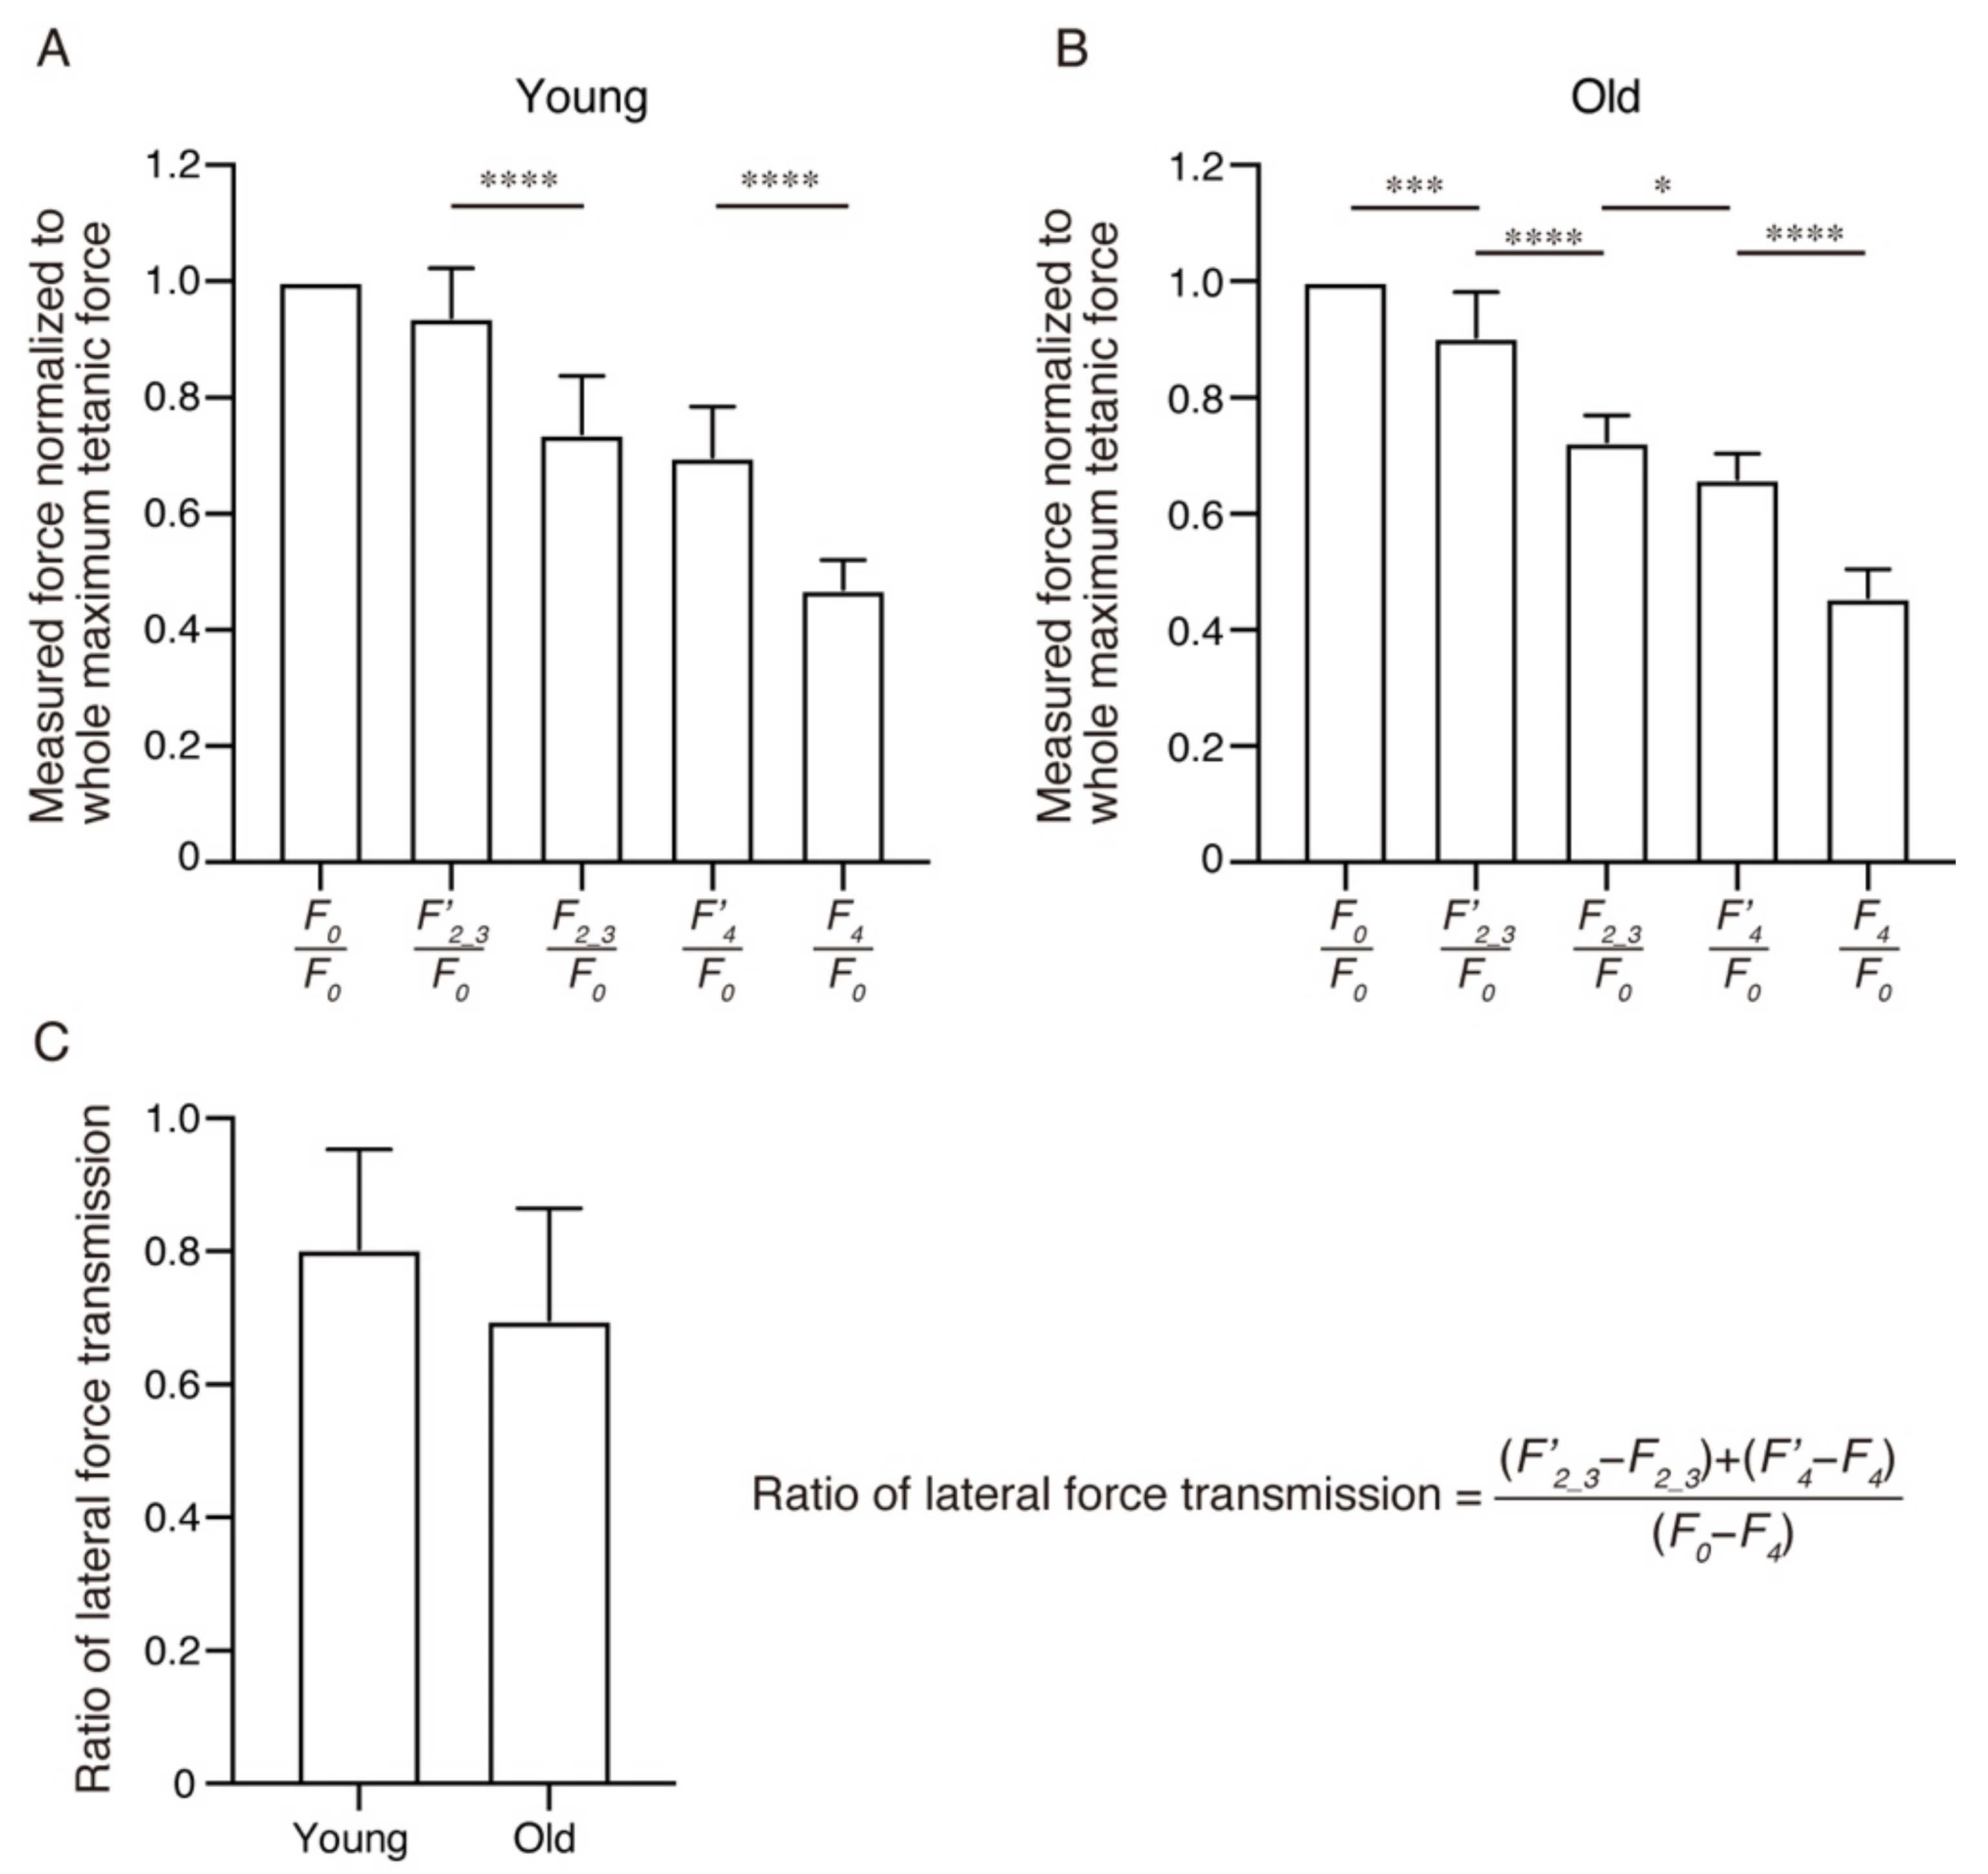
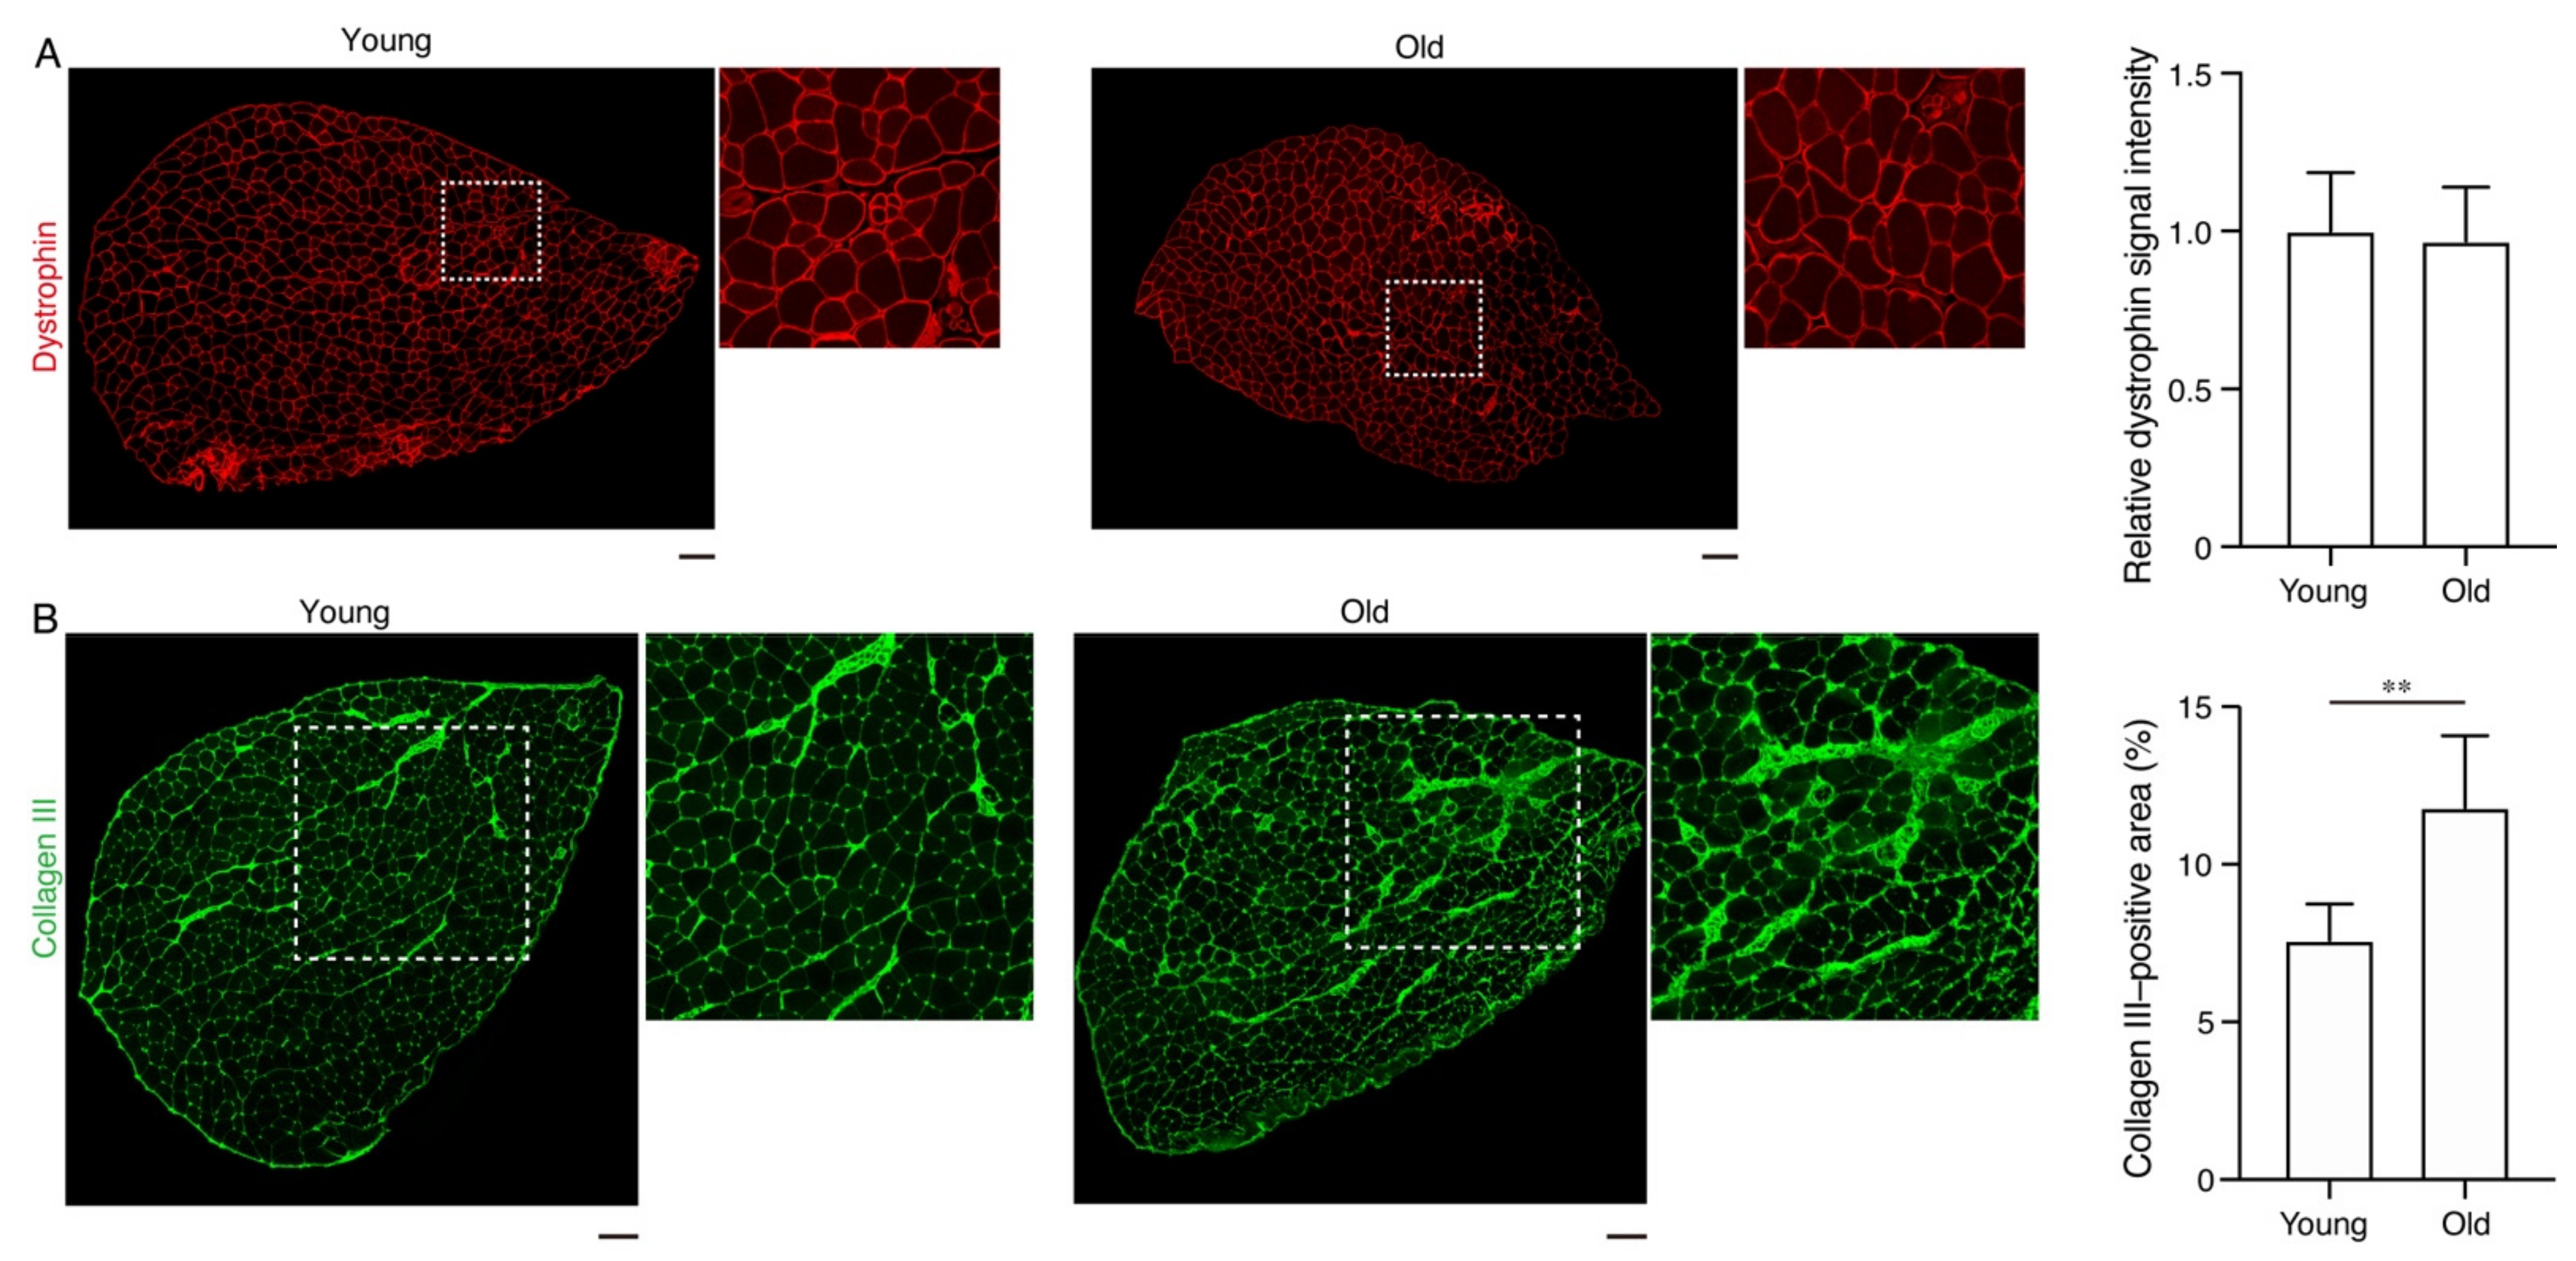
2. Results
3. Discussion
4. Materials and Methods
4.1. Mice
4.2. Measurement of In Vitro Contractile Force
4.3. Immunofluorescent Staining and Microscopy
4.4. Statistical Analysis
Author Contributions
Funding
Institutional Review Board Statement
Conflicts of Interest
References
- Huijing, P.A. Muscle as a collagen fiber reinforced composite: A review of force transmission in muscle and whole limb. J. Biomech. 1999, 32, 329–345. [Google Scholar] [CrossRef]
- Sharafi, B.; Blemker, S.S. A mathematical model of force transmission from intrafascicularly terminating muscle fibers. J. Biomech. 2011, 44, 2031–2039. [Google Scholar] [CrossRef] [PubMed] [Green Version]
- Ramaswamy, K.S.; Palmer, M.L.; van der Meulen, J.H.; Renoux, A.; Kostrominova, T.Y.; Michele, D.E.; Faulkner, J.A. Lateral transmission of force is impaired in skeletal muscles of dystrophic mice and very old rats. J. Physiol. 2011, 589, 1195–1208. [Google Scholar] [CrossRef] [PubMed]
- Zhang, C.; Gao, Y. Effects of aging on the lateral transmission of force in rat skeletal muscle. J. Biomech. 2014, 47, 944–948. [Google Scholar] [CrossRef] [PubMed] [Green Version]
- Delmonico, M.J.; Harris, T.B.; Visser, M.; Park, S.W.; Conroy, M.B.; Velasquez-Mieyer, P.; Boudreau, R.; Manini, T.M.; Nevitt, M.; Newman, A.B.; et al. Longitudinal study of muscle strength, quality, and adipose tissue infiltration. Am. J. Clin. Nutr. 2009, 90, 1579–1585. [Google Scholar] [CrossRef] [PubMed]
- Cruz-Jentoft, A.J.; Bahat, G.; Bauer, J.; Boirie, Y.; Bruyère, O.; Cederholm, T.; Cooper, C.; Landi, F.; Rolland, Y.; Sayer, A.A.; et al. Sarcopenia: Revised European consensus on definition and diagnosis. Age Ageing 2019, 48, 16–31. [Google Scholar] [CrossRef] [PubMed] [Green Version]
- Brooks, S.V.; Faulkner, J.A. Isometric, shortening, and lengthening contractions of muscle fiber segments from adult and old mice. Am. J. Physiol. 1994, 267, C507–C513. [Google Scholar] [CrossRef] [PubMed]
- Raue, U.; Slivka, D.; Minchev, K.; Trappe, S. Improvements in whole muscle and myocellular function are limited with high-intensity resistance training in octogenarian women. J. Appl. Physiol. 2009, 106, 1611–1617. [Google Scholar] [CrossRef] [PubMed]
- Venturelli, M.; Saggin, P.; Muti, E.; Naro, F.; Cancellara, L.; Toniolo, L.; Tarperi, C.; Calabria, E.; Richardson, R.S.; Reggiani, C.; et al. In vivo and in vitro evidence that intrinsic upper- and lower-limb skeletal muscle function is unaffected by ageing and disuse in oldest-old humans. Acta Physiol. 2015, 215, 58–71. [Google Scholar] [CrossRef] [PubMed] [Green Version]
- Kragstrup, T.W.; Kjaer, M.; Mackey, A.L. Structural, biochemical, cellular, and functional changes in skeletal muscle extracellular matrix with aging. Scand. J. Med. Sci. Sports 2011, 21, 749–757. [Google Scholar] [CrossRef] [PubMed] [Green Version]
- Csapo, R.; Gumpenberger, M.; Wessner, B. Skeletal Muscle Extracellular Matrix–What Do We Know About Its Composition, Regulation, and Physiological Roles? A Narrative Review. Front. Physiol. 2020, 11, 253. [Google Scholar] [CrossRef] [PubMed] [Green Version]
- Marcus, R.L.; Addison, O.; Kidde, J.P.; Dibble, L.E.; Lastayo, P.C. Skeletal muscle fat infiltration: Impact of age, inactivity, and exercise. J. Nutr. Health Aging 2010, 14, 362–366. [Google Scholar] [CrossRef] [PubMed] [Green Version]
- Monti, R.J.; Roy, R.R.; Hodgson, J.A.; Edgerton, V.R. Transmission of forces within mammalian skeletal muscles. J. Biomech. 1999, 32, 371–380. [Google Scholar] [CrossRef]
- Rice, K.M.; Preston, D.L.; Neff, D.; Norton, M.; Blough, E.R. Age-related dystrophin-glycoprotein complex structure and function in the rat extensor digitorum longus and soleus muscle. J. Gerontol. A Biol. Sci. Med. Sci. 2006, 61, 1119–1129. [Google Scholar] [CrossRef] [PubMed] [Green Version]
- Oishi, P.E.; Cholsiripunlert, S.; Gong, W.; Baker, A.J.; Bernstein, H.S. Myo-mechanical analysis of isolated skeletal muscle. J. Vis. Exp. 2011, 48, 2582. [Google Scholar] [CrossRef] [PubMed]
Publisher’s Note: MDPI stays neutral with regard to jurisdictional claims in published maps and institutional affiliations. |
© 2021 by the authors. Licensee MDPI, Basel, Switzerland. This article is an open access article distributed under the terms and conditions of the Creative Commons Attribution (CC BY) license (https://creativecommons.org/licenses/by/4.0/).
Share and Cite
Minato, K.; Yoshimoto, Y.; Kurosawa, T.; Watanabe, K.; Kawashima, H.; Ikemoto-Uezumi, M.; Uezumi, A. Measurement of Lateral Transmission of Force in the Extensor Digitorum Longus Muscle of Young and Old Mice. Int. J. Mol. Sci. 2021, 22, 12356. https://doi.org/10.3390/ijms222212356
Minato K, Yoshimoto Y, Kurosawa T, Watanabe K, Kawashima H, Ikemoto-Uezumi M, Uezumi A. Measurement of Lateral Transmission of Force in the Extensor Digitorum Longus Muscle of Young and Old Mice. International Journal of Molecular Sciences. 2021; 22(22):12356. https://doi.org/10.3390/ijms222212356
Chicago/Turabian StyleMinato, Keitaro, Yuki Yoshimoto, Tamaki Kurosawa, Kei Watanabe, Hiroyuki Kawashima, Madoka Ikemoto-Uezumi, and Akiyoshi Uezumi. 2021. "Measurement of Lateral Transmission of Force in the Extensor Digitorum Longus Muscle of Young and Old Mice" International Journal of Molecular Sciences 22, no. 22: 12356. https://doi.org/10.3390/ijms222212356
APA StyleMinato, K., Yoshimoto, Y., Kurosawa, T., Watanabe, K., Kawashima, H., Ikemoto-Uezumi, M., & Uezumi, A. (2021). Measurement of Lateral Transmission of Force in the Extensor Digitorum Longus Muscle of Young and Old Mice. International Journal of Molecular Sciences, 22(22), 12356. https://doi.org/10.3390/ijms222212356