
Investigating the Relationship of Genotype and Geographical Location on Volatile Composition and Sensory Profile of Celery (Apium graveolens)


Abstract
:1. Introduction
2. Materials and Methods
2.1. Celery Material and MIAPAE Standard
2.1.1. Sample Information
2.1.2. Timing, Location and Environment
2.1.3. Raw Material Collection, Processing Storage
2.2. Chemicals Reagents
2.3. Volatile Analysis Using SPME GCMS
2.4. Sensory Evaluation of Fresh Celery Samples
2.5. Statistical Analysis
3. Results and Discussion
3.1. Volatile Composition
Principal Component Analysis of Volatile Compounds in UK and Spanish Celery Samples
3.2. Sensory Evaluation of Fresh Celery Samples
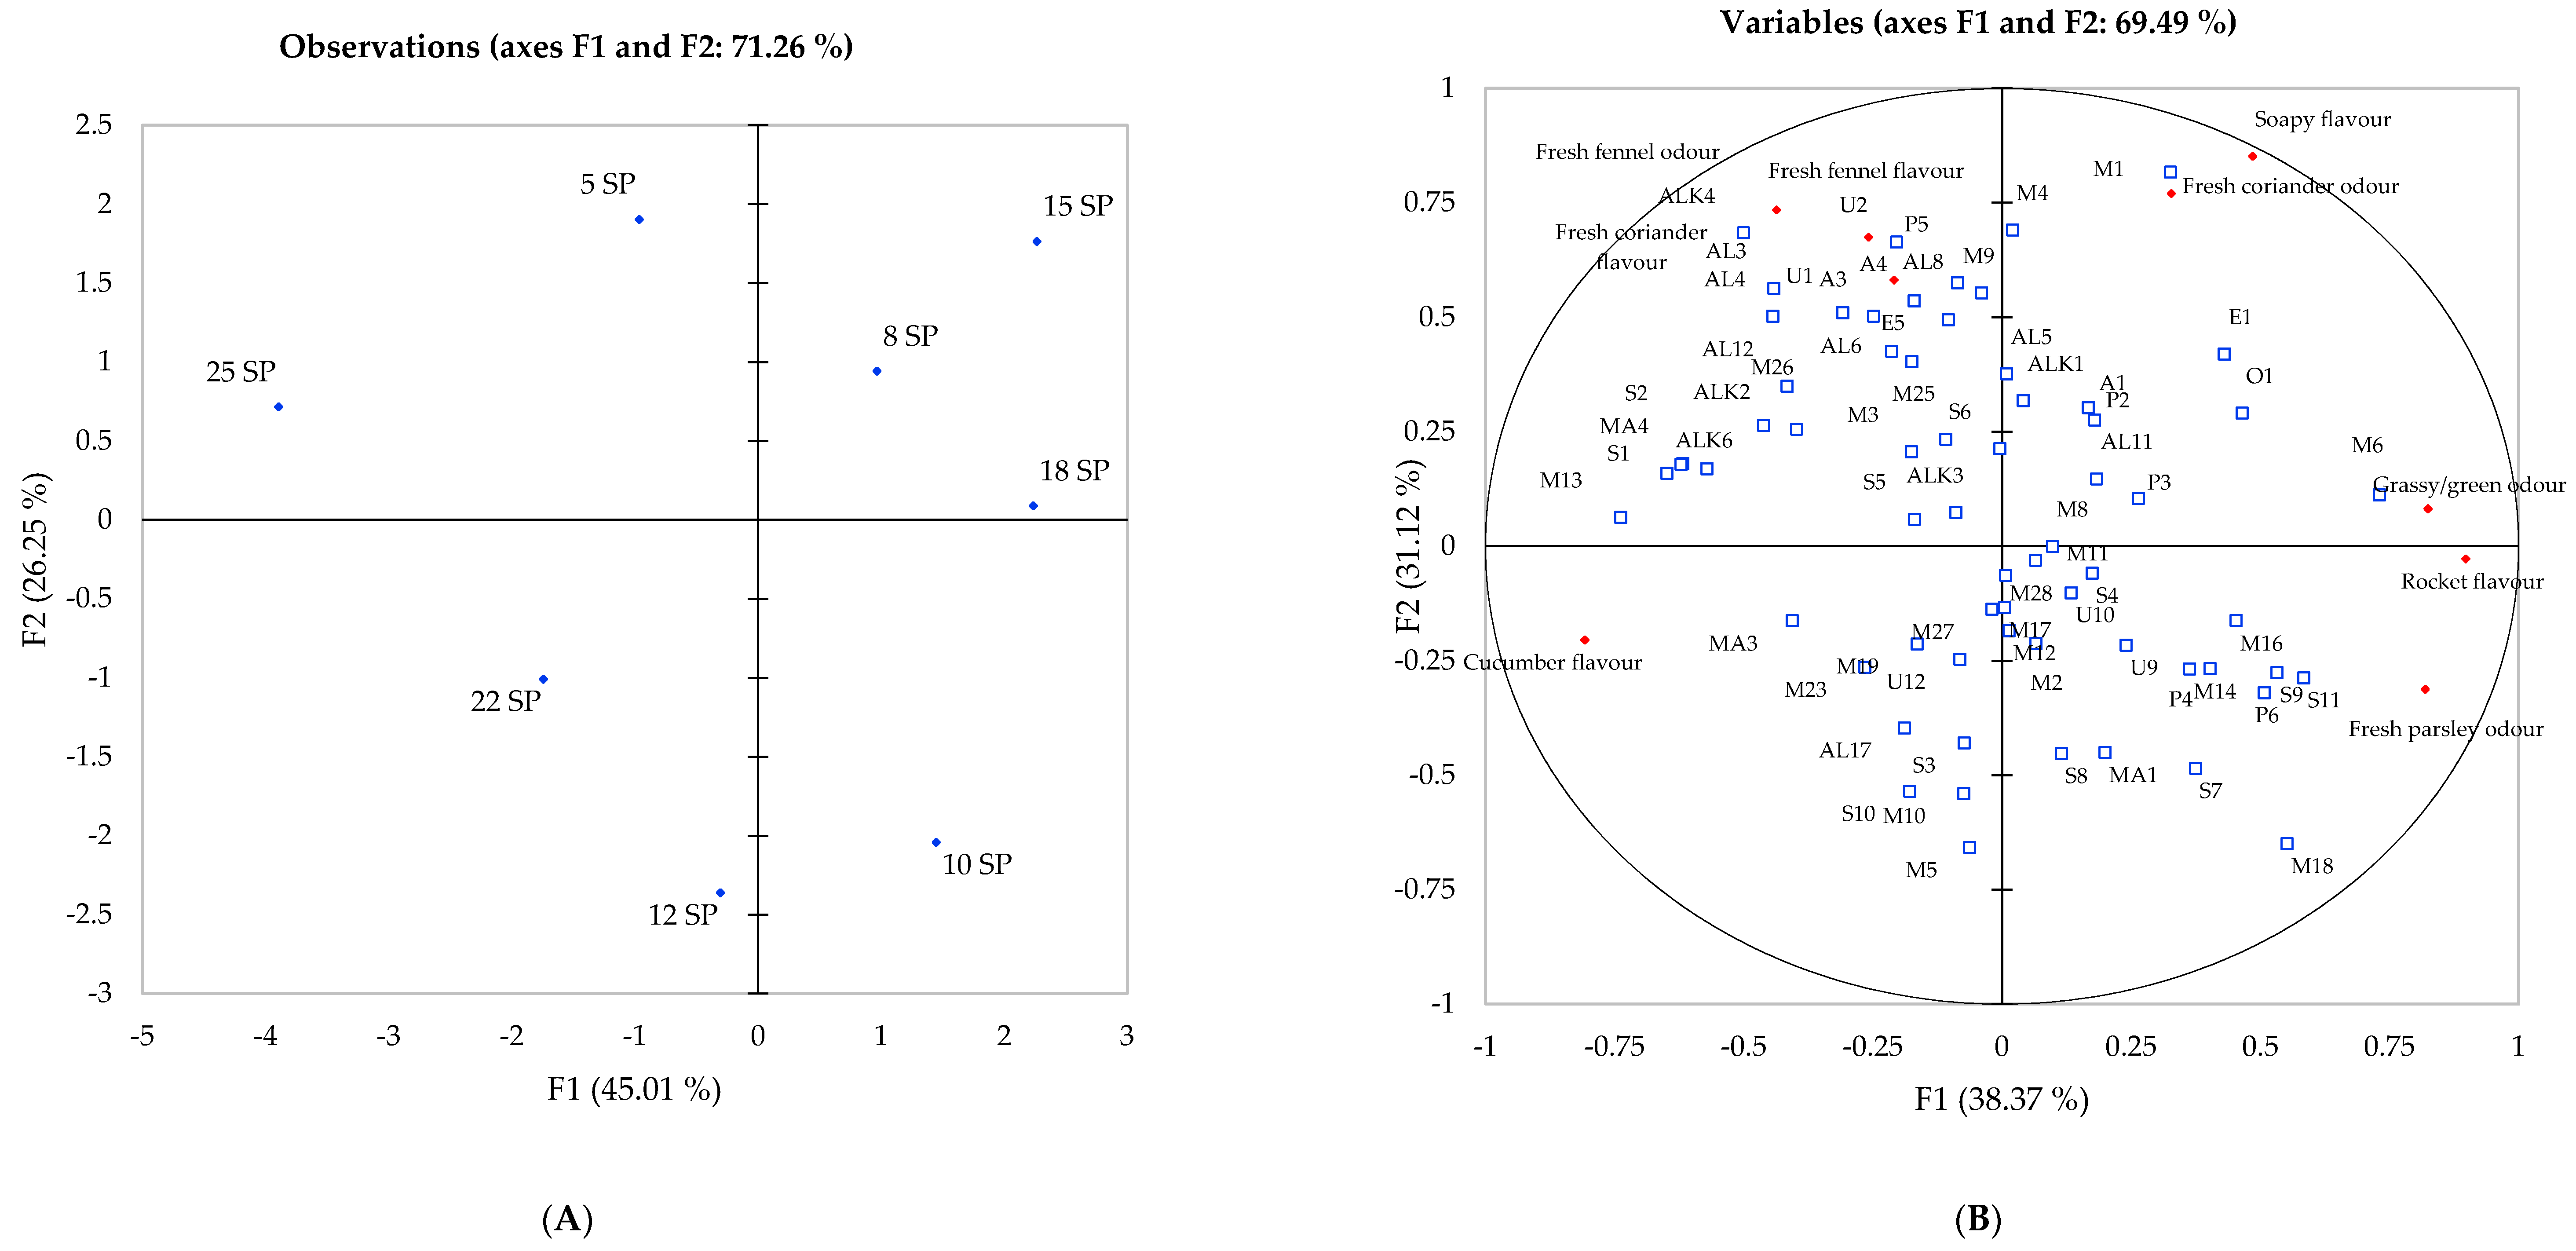
Principal Component Analysis of Flavour Attributes and Volatile Compounds
3.3. Environmental Differences between Geographical Location and Influence on the Aroma Profile
4. Conclusions
Supplementary Materials
Author Contributions
Funding
Institutional Review Board Statement
Informed Consent Statement
Data Availability Statement
Acknowledgments
Conflicts of Interest
References
- Rożek, E. Growth and yielding of leaf celery (Apium graveolens L.var. secalinum Alef.) cultivated for two-cut harvest. Herba Polonica 2007, 53, 17–21. [Google Scholar]
- Malhotra, S. Celery. In Handbook of Herbs and Spices, 2nd ed.; Peter, K., Ed.; Woodhead Publishing Ltd.: Cambridgshire, UK, 2012; Volume 2, pp. 249–267. [Google Scholar]
- Uhlig, J.W.; Chang, A.; Jen, J.J. Effect of Phthalides on Celery Flavor. J. Food Sci. 1987, 52, 658–660. [Google Scholar] [CrossRef]
- Jegorova, A.; Kailas, T.; Orav, A. Composition of the essential oil of dill, celery, and parsley from Estonia. Proc.-Est. Acad. Sci. Chem. 2003, 52, 147. [Google Scholar] [CrossRef]
- Sellami, I.; Bettaieb, I.; Bourgou, S.; Dahmani, R.; Limam, F.; Marzouk, B. Essential oil and aroma composition of leaves, stalks and roots of celery (Apium graveolens var. dulce) from Tunisia. J. Essent. Oil Res. 2012, 24, 513–521. [Google Scholar] [CrossRef]
- MacLeod, G.; Ames, J.M. Volatile components of celery and celeriac. Phytochemistry 1989, 28, 1817–1824. [Google Scholar] [CrossRef]
- Turner, L.; Lignou, S.; Gawthrop, F.; Wagstaff, C. Investigating the factors that influence the aroma profile of Apium graveolens: A review. Food Chem. 2020, 345, 128673. [Google Scholar] [CrossRef]
- Turner, L.; Dawda, D.; Wagstaff, C.; Gawthrop, F.; Lignou, S. Influence of harvest maturity on the aroma quality of two celery (Apium graveolens) genotypes. Food Chem. 2021, 365, 130515. [Google Scholar] [CrossRef]
- Gold, H.J.; Wilson, C.W. The Volatile Flavor Substances of Celery. J. Food Sci. 1963, 28, 484–488. [Google Scholar] [CrossRef]
- Turner, L.; Lignou, S.; Gawthrop, F.; Wagstaff, C. Investigating the Relationship of Genotype and Climate Conditions on the Volatile Composition and Sensory Profile of Celery (Apium graveolens). Foods 2021, 10, 1335. [Google Scholar] [CrossRef]
- Marongiu, B.; Piras, A.; Porcedda, S.; Falconieri, D.; Maxia, A.; Frau, M.; Gonçalves, M.; Cavaleiro, C.; Salgueiro, L. Isolation of the volatile fraction from Apium graveolens L. (Apiaceae) by supercritical carbon dioxide extraction and hydrodistillation: Chemical composition and antifungal activity. Nat. Prod. Res. 2012, 27, 1521–1527. [Google Scholar] [CrossRef]
- Rożek, E.; Nurzyńska-Wierdak, R.; Kosior, M. Efficiency of some agrotechnical treatments in quantity and quality yield modi-fication of leaf celery (Apium graveolens L. var. Secalinum Alef). Acta Sci. Pol. Hortorum Cultus 2013, 12, 227–239. [Google Scholar]
- Van Wassenhove, F.A.; Dirinck, P.J.; Schamp, N.M.; Vulsteke, G.A. Effect of nitrogen fertilizers on celery volatiles. J. Agric. Food Chem. 1990, 38, 220–226. [Google Scholar] [CrossRef]
- Lisiewska, Z.; Kmiecik, W. Dependence of dried chive (Allium schoenoprasum) quality upon the drying method and storage period. EJPAU 1998, 1, 6. [Google Scholar]
- Díaz-Maroto, M.C.; Palomo, E.S.; Castro, L.; Viñas, M.G.; Pérez-Coello, M.S. Changes produced in the aroma compounds and structural integrity of basil (Ocimum basilicum L.) during drying. J. Sci. Food Agric. 2004, 84, 2070–2076. [Google Scholar] [CrossRef]
- Rołson, W.; Osińska, E.; Wajs-Bonikowska, A. Effect of plantation establishment and raw material stabilization on the usefull traits of lovage leaves (Levisticum officinale Koch.). Acta Sci. Pol. Hortorum Cultus 2013, 12, 141–155. [Google Scholar]
- Hoffmann, M. Sensory quality of selected freeze-dried and dried seasoning vegetables in food. Nauka Technol. Jakość 2007, 2, 91–97. [Google Scholar]
- Radulović, N.; Blagojević, P.; Palić, R. Comparative Study of the Leaf Volatiles of Arctostaphylos uva-ursi (L.) Spreng. and Vaccinium vitis-idaea L. (Ericaceae). Molecules 2010, 15, 6168–6185. [Google Scholar] [CrossRef] [Green Version]
- Andriamaharavo, N.R. Retention Data. NIST Mass Spectrometry Data Center. 2014. Available online: https://webbook.nist.gov/cgi/cbook.cgi?Source=2014AND%2319410M&Units=SI&Mask=2000 (accessed on 8 July 2021).
- Stashenko, E.; Jaramillo, B.; Martínez, J. Comparación de la composición química y de la actividad antioxidante in vitro de los metabolitos secundarios volátiles de plantas de la familia verbenaceae. Rev. Acad. Colomb. Cienc. Exactas Fis. Nat. 2003, 27, 579–597. [Google Scholar]
- Lucero, M.; Fredrickson, E.; Estell, R.; Morrison, A.; Richman, D. Volatile Composition of Gutierrezia sarothrae (Broom Snake-weed) as Determined by Steam Distillation and Solid Phase Microextraction. J. Essent. Oil Res. 2006, 18, 121–125. [Google Scholar] [CrossRef]
- Beaulieu, J.C.; Grimm, C.C. Identification of Volatile Compounds in Cantaloupe at Various Developmental Stages Using Solid Phase Microextraction. J. Agric. Food Chem. 2001, 49, 1345–1352. [Google Scholar] [CrossRef]
- Lucero, M.E.; Estell, R.E.; Frederickson, E.L. The essential oil composition of Psorothamnus scoparius (A. Gray) Rydb. J. Essent. Oil Res. 2003, 15, 108–111. [Google Scholar] [CrossRef]
- Adams, R.P.; Morris, J.A.; Pandey, R.N.; Schwarzbach, A.E. Cryptic speciation between Juniperus deltoides and Juniperus oxycedrus (Cupressaceae) in the Mediterranean. Biochem. Syst. Ecol. 2005, 33, 771–787. [Google Scholar] [CrossRef]
- Sabulal, B.; Dan, M.; John, A.; Kurup, R.; Chandrika, S.; George, V. Phenylbutanoid-rich rhizome oil of Zingiber neesanum from Western Ghats, southern India. Flavour Fragr. J. 2007, 22, 521–524. [Google Scholar] [CrossRef]
- Havlik, J.; Kokoska, L.; Vasickova, S.; Valterova, I. Chemical composition of essential oil from the seeds of Nigella arvensis L. and assessment of its antimicrobial activity. Flavour Fragr. J. 2006, 21, 713–717. [Google Scholar] [CrossRef]
- Bylaite, E.; Meyer, A.S. Characterisation of volatile aroma compounds of orange juices by three dynamic and static headspace gas chromatography techniques. Eur. Food Res. Technol. 2005, 222, 176–184. [Google Scholar] [CrossRef]
- Block, S.; Flamini, G.; Brkic, D.; Morelli, I.; Quetin-Leclercq, J. Analysis of the essential oil from leaves of Croton zambesicus Muell. Arg. growing in Benin. Flavour Fragr. J. 2006, 21, 222–224. [Google Scholar] [CrossRef]
- Boulanger, R.; Chassagne, D.; Crouzet, J. Free and bound flavour components of amazonian fruits. 1: Bacuri. Flavour Fragr. J. 1999, 14, 303–311. [Google Scholar] [CrossRef]
- Cao, H.; Li, Z.; Chen, X. QSRR Study of GC Retention Indices of Volatile Compounds Emitted from Mosla chinensis Maxim by Multiple Linear Regression. Chin. J. Chem. 2011, 29, 2187–2196. [Google Scholar] [CrossRef]
- Yu, Y.; Huang, T.; Yang, B.; Liu, X.; Duan, G. Development of gas chromatography-mass spectrometry with microwave dis-tillation and simultaneous solid-phase microextraction for rapid determination of volatile constituents in ginger. J. Pharm. Biomed. Anal. 2007, 43, 24–31. [Google Scholar] [CrossRef]
- Zeng, Y.-X.; Zhao, C.-X.; Liang, Y.-Z.; Yang, H.; Fang, H.-Z.; Yi, L.-Z.; Zeng, Z.-D. Comparative analysis of volatile components from Clematis species growing in China. Anal. Chim. Acta 2007, 595, 328–339. [Google Scholar] [CrossRef]
- Javidnia, K.; Miri, R.; Kamalinejad, M.; Mehdipour, A.R. Composition of the essential oil of Diplotaenia cachrydifolia Boiss from Iran. J. Ess. Oil Res. 2006, 18, 86–87. [Google Scholar] [CrossRef]
- Pripdeevech, P.; Saansoomchai, J. Antibacterial activity and chemical composition of essential oil and various extracts of Fagraea fragrans Roxb. flowers. Chiang Mai J. Sci. 2013, 40, 214–223. [Google Scholar]
- Ansorena, D.; Gimeno, O.; Astiasarán, I.; Bello, J. Analysis of volatile compounds by GC–MS of a dry fermented sausage: Chorizo de Pamplona. Food Res. Int. 2001, 34, 67–75. [Google Scholar] [CrossRef]
- Philippe, J.; Suvarnalatha, G.; Sankar, R.; Suresh, S. Kessane in the Indian Celery Seed Oils. J. Essent. Oil Res. 2002, 14, 276–277. [Google Scholar] [CrossRef]
- Van Wassenhove, F.; Dirinck, P.; Vulsteke, G.; Schamp, N. Aromatic Volatile Composition of Celery and Celeriac Cultivars. HortScience 1990, 25, 556–559. [Google Scholar] [CrossRef]
- Kurobayashi, Y.; Kouno, E.; Fujita, A.; Morimitsu, Y.; Kubota, K. Potent Odorants Characterize the Aroma Quality of Leaves and Stalks in Raw and Boiled Celery. Biosci. Biotechnol. Biochem. 2006, 70, 958–965. [Google Scholar] [CrossRef] [Green Version]
- Pino, J.; Rosado, A.; Fuentes, V. Leaf oil of Celery (Apium graveolens L.) from Cuba. J. Essent. Oil. Res. 1997, 9, 719–720. [Google Scholar] [CrossRef]
- Shojaei, Z.A.; Ebrahimi, A.; Salimi, M. Chemical Composition of Three Ecotypes of Wild Celery (Kelussia odoratissima). J. Herbs Spices Med. Plants 2011, 17, 62–68. [Google Scholar] [CrossRef]
- Lund, E.; Wagner, C.; Bryan, W. Oils recovered from celery packinghouse waste. Florida State Hortic. Soc. 1973, 86, 255–259. [Google Scholar]
- Phan, D.H.T.; Kim, B.; Dong, V.M. Phthalides by Rhodium-Catalyzed Ketone Hydroacylation. J. Am. Chem. Soc. 2009, 131, 15608–15609. [Google Scholar] [CrossRef]
- Moya, C.; Oyanedel, E.; Verdugo, G.; Fernanda, F.M.; Urrestarazu, M.; Alvaro, J.E. Increased electrical conductivity in nu-trient solution management enhances dietary and organoleptic qualities in soilless culture tomato. HortScience 2017, 52, 868–872. [Google Scholar] [CrossRef] [Green Version]
- Marin, A.; Rubio, J.S.; Martinez, V.; Gil, M.I. Antioxidant compounds in green and red peppers as affected by irrigation fre-quency, salinity and nutrient solution composition. J. Sci. Food Agric. 2009, 89, 1352–1359. [Google Scholar] [CrossRef]
- Giuffrida, F.; Cassaniti, C.; Malvuccio, A.; Leonardi, C. Effects of salt stress imposed during two growth phases on cauliflower production and quality. J. Sci. Food Agric. 2016, 97, 1552–1560. [Google Scholar] [CrossRef] [PubMed]
- Lignou, S.; Parker, J.K.; Baxter, C.; Mottram, D.S. Sensory and instrumental analysis of medium and long shelf-life Charentais cantaloupe melons (Cucumis melo L.) harvested at different maturities. Food Chem. 2013, 148, 218–229. [Google Scholar] [CrossRef] [PubMed] [Green Version]
- Eriksson, N.; Wu, S.; Do, C.B.; Kiefer, A.K.; Tung, J.Y.; Mountain, J.L.; Hinds, D.A.; Francke, U. A genetic variant near olfactory receptor genes influences cilantro preference. Flavour 2012, 1, 22. [Google Scholar] [CrossRef] [Green Version]
- Plotto, A.; Margaría, C.A.; Goodner, K.L.; Goodrich, R.; Baldwin, E.A. Odour and flavour thresholds for key aroma components in an orange juice matrix: Terpenes and aldehydes. Flavour Fragr. J. 2004, 19, 491–498. [Google Scholar] [CrossRef]
- Ramakrishna, A.; Ravishankar, G. Influence of abiotic stress signals on secondary metabolites in plants. Plant. Signal. Behav. 2011, 6, 1720–1731. [Google Scholar]
- Miller, G.; Shulaev, V.; Mittler, R. Reactive oxygen signaling and abiotic stress. Physiol. Plant. 2008, 133, 481–489. [Google Scholar] [CrossRef]
- Arbona, V.; Manzi, M.; de Ollas, C.; Gómez-Cadenas, A. Metabolomics as a tool to investigate abiotic stress tolerance in plants. Int. J. Mol. Sci. 2013, 14, 4885–4911. [Google Scholar] [CrossRef]
- Park, D.-H.; Park, J.-W. Wireless sensory network-based greenhouse environment monitoring and automatic control system for dew condensation prevention. Sensors 2011, 11, 3640–3651. [Google Scholar] [CrossRef]
- Sampaio, B.; Edrada-Ebel, R.; Da Costa, F. Effect of the environment on the secondary metabolic profile of Tithonia diversifola: A model for environmental metabolomics of plants. Sci. Rep. 2016, 6, 29265. [Google Scholar] [CrossRef] [Green Version]
- Martinez-Alvarez, V.; Maestre-Valero, J.; González-Ortega, M.; Gallego, B.; Martin-Gorriz, B. Characterization of the agri-cultural supply of desalinated seawater in Southeastern Spain. Water 2019, 11, 1233. [Google Scholar] [CrossRef] [Green Version]
- FAO. Lecture notes on the major soils of the world. In World Soil Resources Reports, 94; Food and Agriculture Organization of the United Nations: Rome, Italy, 2001; p. 334. [Google Scholar]
- Waterman, P.G.; Mole, S. Extrinsic Factors Influencing Production of Secondary Metabolites in Plants. Insect Plant Ineractions 2019, 107–134. [Google Scholar] [CrossRef]
- Mousavi, S.; Galvai, M.; Razaei, M. The interaction of zinc with other elements in plants: A review. The interaction of zinc with other elements in plants: A review. Int. J. Agric. Crop Sci. 2021, 4, 1881–1884. [Google Scholar]
- Broadley, M.; Brown, P.; Cakmak, I.; Rengel, Z.; Zhao, F. Function of Nutrients: Micronutrients. In Marschner’s Mineral. Nutrition of Higher Plants, 3rd ed.; Academic Press: Cambridge, MA, USA, 2021; pp. 191–248. [Google Scholar]
- Rubatzky, V.E.; Quiros, C.F.; Simon, P.W. Carrots and Related Vegetable Umbelliferae; CABI Publishing: Wallingford, UK, 1999. [Google Scholar]
- D’Antuono, L.; Neri, R.; Moretti, A. By-products of vegetable celery (Apium graveolens L. var. dulce) as potential source of flavours. Acta Hortic. 2002, 327–331. [Google Scholar] [CrossRef] [Green Version]
- Cui, G.; Li, B.; He, W.; Yin, X.; Liu, S.; Lian, L.; Zhang, Y.; Liang, W.; Zhang, P. Physiological analysis of the effect of altitudinal gradients on Leymus secalinus on the Qinghai-Tibetan Plateau. PLoS ONE 2018, 13, e0202881. [Google Scholar] [CrossRef] [Green Version]
- Nissinen, K.; Virjamo, V.; Randriamanana, T.; Sobuj, N.; Sivadasan, U.; Mehtätalo, L.; Beuker, E.; Julkunen-Tiitto, R.; Nybakken, L. Responses of growth and leaf phenolics in European aspen (Populus tremula) to climate change during juvenile phase change. Can. J. For. Res. 2017, 47, 1350–1363. [Google Scholar] [CrossRef]


| Code | Compound | LRIexp A | ID B | Percentage Composition (%) C | p-Value D | |||||||||||||||||
|---|---|---|---|---|---|---|---|---|---|---|---|---|---|---|---|---|---|---|---|---|---|---|
| UK | Spain | |||||||||||||||||||||
| 5 | 8 | 10 | 12 | 15 | 18 | 22 | 25 | 5 | 8 | 10 | 12 | 15 | 18 | 22 | 25 | G E | E F | GxE G | ||||
| Alcohols | ||||||||||||||||||||||
| A1 | 3-methyl-3-buten-1-ol | 730 | A | 0.42 ± 0.08 abc | 0.31 ± 0.04 ab | 0.94 ± 0.27 c | 0.35 ± 0.14 abc | 0.22 ± 0.07 a | 0.23 ± 0.06 a | 0.30 ± 0.12 ab | 0.39 ± 0.06 abc | 0.60 ± 0.35 abc | 0.40 ± 0.06 ahc | 0.91 ± 0.27 bc | 0.59 ± 0.13 abc | 0.36 ± 0.05 abc | 0.57 ± 0.22 abc | 0.54 ± 0.02 abc | 0.49 ± 0.13 abc | ** | ** | ** |
| A2 | 2-methyl-1-butanol | 742 | A | nd a | nd a | nd a | nd a | nd a | nd a | nd a | nd a | 0.10 ± 0.01 ab | 0.10 ± 0.03 ab | 0.12 ± 0.02b | 0.11 ± 0.01 ab | nd a | 0.10 ± 0.04 ab | 0.10 ± 0.05 ab | 0.10 ± 0.02 ab | *** | *** | *** |
| A3 | (E)-2-penten-1-ol | 758 | A | 0.73 ± 0.28 ab | 0.42 ± 0.16 ab | 0.64 ± 0.04 ab | 0.23 ± 0.08 a | 0.32 ± 0.09 ab | 0.65 ± 0.23 ab | 1.2 ± 0.54 ab | 0.50 ± 0.22 ab | 0.72 ± 0.34 ab | 1.3 ± 0.25b | 1.1 ± 0.18 ab | 0.71 ± 0.09 ab | 0.60 ± 0.09 ab | 0.81 ± 0.31 ab | 0.87 ± 0.24 ab | 0.52 ± 0.06 ab | ** | * | * |
| A4 | 1-pentanol | 763 | A | 0.21 ± 0.06 a | 0.11 ± 0.04 a | 0.31 ± 0.20 a | 0.13 ± 0.10 a | 0.23 ± 0.15 a | 0.39 ± 0.14 ab | 0.63 ± 0.25 ab | 0.28 ± 0.08 a | 1.6 ± 0.27b | 0.50 ± 0.11 a | 0.76 ± 0.28 ab | 0.49 ± 0.06 a | 1.1 ± 0.13 ab | 0.87 ± 0.34 ab | 1.5 ± 0.51b | 0.88 ± 0.22 ab | *** | *** | *** |
| A5 | 1-hexanol | 862 | A | nd a | nd a | nd a | nd a | nd a | nd a | nd a | nd a | 0.53 ± 0.19 ab | 0.44 ± 0.27 ab | 0.79 ± 0.44 b | 0.40 ± 0.21 ab | 0.33 ± 0.08 ab | 0.40 ± 0.10 ab | 0.48 ± 0.14 ab | 0.47 ± 0.23 ab | *** | *** | *** |
| Total | 1.4 | 0.84 | 1.9 | 0.71 | 0.77 | 1.3 | 2.1 | 1.2 | 3.5 | 2.7 | 3.7 | 2.3 | 2.4 | 2.7 | 3.5 | 2.5 | ||||||
| Aldehydes | ||||||||||||||||||||||
| AH1 | 2-methyl-2-butenal | 739 | A | nd a | nd a | nd a | nd a | nd a | nd a | nd a | nd a | 0.16 ± 0.07 bc | 0.15 ± 0.08 bc | 0.14 ± 0.06 bc | 0.13 ± 0.02 abc | 0.23 ± 0.03 c | 0.19 ± 0.04b c | 0.19 ± 0.05 bc | 0.10 ± 0.03 ab | *** | *** | *** |
| AH2 | (E)-2-pentenal | 753 | A | nd a | nd a | nd a | nd a | nd a | nd a | nd a | nd a | 0.78 ± 0.04 c | 0.13 ± 0.08 a | 0.34 ± 0.14 ab | nd a | 0.78 ± 0.08 c | 0.80 ± 0.36 c | 0.77 ± 0.09 bc | 0.38 ± 0.11 abc | *** | *** | *** |
| AH3 | hexanal | 800 | A | 9.7 ± 0.8 a | 1.3 ± 0.46 a | 2.6 ± 0.32 a | 0.65 ± 0.29 a | 2.0 ± 0.39 a | 8.9 ± 2.7 a | 13 ± 5.5 a | 6.3 ± 1.2 a | 25 ± 7.8 a | 24 ± 6.2 a | 14 ± 5.2 a | 8.6 ± 3.6 a | 22 ± 7.5 a | 24 ± 4.9 a | 25 ± 7.0 a | 22 ± 6.3 a | ** | ** | ** |
| AH4 | (E)-2-hexenal | 849 | A | 0.18 ± 0.11 abc | tr ± 0.02 a | tr ± 0.02 a | 0.04 ± 0.01 ab | 0.03 ± 0.03 a | 0.15 ± 0.11 abc | 0.20 ± 0.08 abc | 0.11 ± 0.05 abc | 0.56 ± 0.13 c | 0.57 ± 0.24c | 0.30 ± 0.10 abc | 0.30 ± 0.07 abc | 0.55 ± 0.11 c | 0.54 ± 0.19 c | 0.57 ± 0.15 c | 0.51 ± 0.20 bc | *** | *** | *** |
| AH5 | heptanal | 901 | A | tr ± 0.03 ab | nd a | 0.28 ± 0.15 ab | 0.16 ± 0.13 ab | 0.25 ± 0.16 ab | 0.23 ± 0.14 ab | 0.29 ± 0.08 ab | 0.25 ± 0.15 ab | 0.68 ± 0.18 b | 0.58 ± 0.18 ab | 0.51 ± 0.13 ab | 0.48 ± 0.10 ab | 0.49 ± 0.35 ab | 0.57 ± 0.13 ab | 0.61 ± 0.20 ab | 0.72 ± 0.12b | ** | ** | ** |
| AH6 | (E)-2-heptenal | 954 | A | 0.19 ± 0.22 a | 1.6 ± 0.55 ab | 1.6 ± 0.23 ab | 0.52 ± 0.04 a | 1.5 ± 0.10 ab | 3.2 ± 1.5 abc | 4.2 ± 1.3 abc | 1.8 ± 0.97 ab | 6.4 ± 0.75 bcd | 8.1 ± 0.23 cd | 6.0 ± 0.36 bcd | 6.1 ± 0.64 bcd | 11 ± 0.55 d | 7.8 ± 0.33 cd | 7.3 ± 0.45 cd | 7.5 ± 0.40 cd | *** | *** | *** |
| AH7 | benzaldehyde | 969 | A | nd a | nd a | nd a | nd a | nd a | nd a | nd a | nd a | 3.3 ± 1.8 b | 1.7 ± 0.50 ab | 1.9 ± 0.14 b | 1.9 ± 0.26 b | 1.7 ± 0.10 ab | 1.6 ± 0.48 ab | 1.7 ± 0.22 ab | 1.9 ± 0.22 b | *** | *** | *** |
| AH8 | n-octanal | 1007 | A | 0.10 ± 0.10 ab | nd a | 0.49 ± 0.06 abcd | 0.27 ± 0.06 abc | 0.39 ± 0.19 abcd | 0.51 ± 0.26 abcd | 0.51 ± 0.17 abcd | 0.51 ± 0.23 abcd | 0.86 ± 0.19 cd | 0.95 ± 0.22 cde | 0.56 ± 0.10 abcd | 0.63 ± 0.13 abcd | 1.6 ± 0.35 e | 0.78 ± 0.21 bcd | 0.54 ± 0.04 abcd | 1.0 ± 0.22 de | *** | *** | *** |
| AH9 | phenacetaldehyde | 1049 | A | nd a | nd a | nd a | nd a | nd a | nd a | nd a | nd a | 0.31 ± 0.13 bc | 0.24 ± 0.04 bc | 0.26 ± 0.06 bc | 0.42 ± 0.06 c | 0.26 ± 0.02 bc | 0.24 ± 0.06 bc | 0.23 ± 0.98b | 0.29 ± 0.05 bc | *** | *** | *** |
| AH10 | (E)-2-octenal | 1057 | A | nd a | nd a | nd a | nd a | nd a | nd a | nd a | nd a | 3.3 ± 1.3 b | 2.2 ± 1.5 ab | 1.5 ± 0.39 ab | 1.4 ± 0.39 ab | 3.4 ± 0.89 b | 3.5 ± 1.2 b | 2.8 ± 0.96 b | 3.5 ± 1.0 b | *** | *** | *** |
| AH11 | m-tolualdehyde | 1086 | B [18] | 0.33 ± 0.07 a | 0.24 ± 0.02 a | 4.0 ± 0.28 c | 1.1 ± 0.28 ab | 0.95 ± 0.02 ab | 0.19 ± 0.02 a | 0.26 ± 0.05 a | 1.6 ± 0.29 b | 0.72 ± 0.57 ab | 0.66 ± 0.26 ab | 0.71 ± 0.17 ab | 0.91 ± 0.19 ab | 0.64 ± 0.06 ab | 0.68 ± 0.32 ab | 0.57 ± 0.10 a | 0.97 ± 0.08 ab | *** | *** | *** |
| AH12 | nonanal | 1105 | A | 0.33 ± 0.14 abc | 0.12 ± 0.02 ab | 0.20 ± 0.03 abc | 0.10 ± 0.01 a | 0.17 ± 0.03 abc | 0.16 ± 0.10 abc | 0.22 ± 0.17 abc | 0.19 ± 0.09 abc | 0.68 ± 0.11 c | 0.59 ± 0.18 abc | 0.39 ± 0.10 b | 0.35 ± 0.13 abc | 0.57 ± 0.16 abc | 0.64 ± 0.35 bc | 0.61 ± 0.08 abc | 0.59 ± 0.11 abc | *** | *** | *** |
| AH13 | (E,E)-2,4-octadienal | 1110 | A | nd a | nd a | nd a | nd a | nd a | nd a | nd a | nd a | 0.15 ± 0.05 b | 0.13 ± 0.04 b | 0.11 ± 0.01 b | 0.13 ± 0.03 b | 0.16 ± 0.02 b | 0.15 ± 0.03 b | 0.14 ± 0.05 b | 0.20 ± 0.02 b | *** | *** | *** |
| AH14 | (E,Z)-2,6-nonadienal | 1162 | A | nd a | nd a | nd a | nd a | nd a | nd a | nd a | nd a | 0.10 ± 0.06 ab | 0.15 ± 0.03 abc | 0.11 ± 0.02 abc | 0.12 ± 0.02 abc | 0.29 ± 0.10 c | 0.23 ± 0.02 bc | 0.23 ± 0.16 bc | 0.28 ± 0.05 c | *** | *** | *** |
| AH15 | (E)-2-nonenal | 1165 | A | nd a | nd a | nd a | nd a | nd a | nd a | nd a | nd a | 0.10 ± 0.03 ab | 0.10 ± 0.02 ab | tr ± 0.03 ab | 0.14 ± 0.02 b | 0.10 ± 0.01 ab | 0.10 ± 0.01 ab | tr ± 0.05 ab | 0.12 ± 0.10 b | *** | *** | *** |
| AH16 | myrtenal | 1207 | B [19] | nd a | nd a | nd a | nd a | nd a | nd a | nd a | nd a | 0.19 ± 0.02 ab | 0.14 ± 0.02 a | 0.10 ± 0.03 a | 0.11 ± 0.01 a | 0.16 ± 0.04 ab | 0.15 ± 0.04 ab | 0.10 ± 0.06 a | 0.37 ± 0.21 b | *** | *** | *** |
| AH17 | (E,E)-2,6-nonadienal | 1156 | A | 0.21 ± 0.04 ab | 0.30 ± 0.03 ab | 0.18 ± 0.02 ab | 0.18 ± 0.04 ab | 0.17 ± 0.03 ab | 0.16 ± 0.08 ab | tr ± 0.03 a | 0.22 ± 0.08 ab | 0.36 ± 0.11 ab | 0.48 ± 0.24 b | 0.20 ± 0.03 ab | 0.16 ± 0.05 ab | 0.41 ± 0.11 ab | 0.35 ± 0.11 ab | 0.46 ± 0.22 ab | 0.20 ± 0.17 ab | * | * | * |
| Total | 11 | 3.6 | 9.4 | 3.0 | 5.5 | 14 | 19 | 11 | 44 | 41 | 28 | 23 | 44 | 44 | 43 | 41 | ||||||
| Esters | ||||||||||||||||||||||
| E1 | methyl butanoate | 717 | A | tr ± 0.03 abc | tr ± 0.01 a | tr ± 0.02 abc | tr ± 0.01 ab | tr ± 0.02 ab | tr ± 0.04 ab | tr ± 0.05 ab | tr ± 0.01 ab | 0.22 ± 0.14 cd | 0.18 ± 0.01 abcd | 0.25 ± 0.04 d | 0.17 ± 0.01 abcd | 0.18 ± 0.04 abcd | 0.18 ± 0.04 abcd | 0.16 ± 0.02 abcd | 0.19 ± 0.03 bcd | *** | *** | *** |
| E2 | methyl pentanoate | 837 | A | nd a | nd a | nd a | nd a | nd a | nd a | nd a | nd a | 0.34 ± 0.23 b | 0.24 ± 0.02 ab | 0.37 ± 0.13 b | 0.40 ± 0.09 b | 0.23 ± 0.07 ab | 0.39 ± 0.18 b | 0.27 ± 0.05 ab | 0.30 ± 0.05 ab | *** | *** | *** |
| E3 | methyl hexanoate | 921 | A | nd a | nd a | nd a | nd a | nd a | nd a | nd a | nd a | 0.25 ± 0.12 ab | 0.29 ± 0.16 ab | 0.12 ± 0.01 ab | 0.10 ± 0.03 ab | 0.25 ± 0.09 ab | 0.38 ± 0.10 b | 0.28 ± 0.10 bc | 0.24 ± 0.11 ab | *** | *** | *** |
| E4 | carveol acetate | 1343 | B [20] | nd a | nd a | nd a | nd a | nd a | nd a | nd a | nd a | 0.21 ± 0.05 bc | 0.14 ± 0.02 ab | 0.22 ± 0.04 bc | 0.17 ± 0.04 bc | 0.20 ± 0.04 bc | 0.27 ± 0.08 bc | 0.20 ± 0.05 a | 0.29 ± 0.10 c | *** | *** | *** |
| E5 | hexyl isobutanoate | 1378 | B [21] | 0.10 ± 0.03 | 0.10 ± 0.04 | 0.14 ± 0.02 | tr ± 0.03 | 0.10 ± 0.05 | 0.16 ± 0.04 | 0.32 ± 0.06 | 0.12 ± 0.03 | 0.15 ± 0.12 | 0.15 ± 0.12 | 0.40 ± 0.04 | 0.22 ± 0.11 | 0.18 ± 0.13 | 0.11 ± 0.16 | 0.36 ± 0.23 | 0.13 ± 0.11 | ns | ns | ns |
| Total | 0.14 | 0.10 | 0.20 | 0.07 | 0.11 | 0.19 | 0.36 | 0.14 | 1.2 | 1.0 | 1.4 | 1.0 | 1.0 | 1.3 | 1.3 | 1.2 | ||||||
| Ketones | ||||||||||||||||||||||
| K1 | 2-methyl-3-pentanone | 746 | A | nd a | nd a | nd a | nd a | nd a | nd a | nd a | nd a | 0.10 ± 0.05 ab | 0.10 ± 0.02 ab | 0.19 ± 0.02 b | 0.10 ± 0.01 ab | 0.10 ± 0.01 a | 0.10 ± 0.02 ab | 0.10 ± 0.01 ab | 0.10 ± 0.02 ab | *** | *** | *** |
| K2 | 3-heptanone | 884 | A | nd a | nd a | nd a | nd a | nd a | nd a | nd a | nd a | 0.14 ± 0.05 a | 0.13 ± 0.08 a | 0.12 ± 0.08 a | tr ± 0.02 a | 0.10 ± 0.03 a | 0.13 ± 0.01 a | 0.13 ± 0.03 a | 0.13 ± 0.04 a | *** | *** | ** |
| K3 | 2-heptanone | 889 | A | nd a | nd a | nd a | nd a | nd a | nd a | nd a | nd a | 0.49 ± 0.14 b | 0.48 ± 0.15 b | 0.31 ± 0.08 ab | 0.17 ± 0.12 ab | 0.39 ± 0.08 ab | 0.49 ± 0.12 b | 0.44 ± 0.16 b | 0.56 ± 0.18 b | *** | *** | ** |
| K4 | 1-octen-3-one | 976 | A | nd a | nd a | nd a | nd a | nd a | nd a | nd a | nd a | 3.0 ± 0.55 b | 3.9 ± 1.7 b | 2.9 ± 0.17 b | 2.3 ± 0.35 ab | 4.4 ± 0.61 b | 3.3 ± 0.73 b | 3.5 ± 1.3 b | 3.9 ± 0.95 b | *** | *** | ** |
| K5 | (E,E)-3,5-octadien-2-one | 1070 | B [22] | nd a | nd a | nd a | nd a | nd a | nd a | nd a | nd a | 0.79 ± 0.14 b | 1.1 ± 0.29 b | 0.60 ± 0.14 ab | 0.81 ± 0.23 b | 1.3 ± 0.15 b | 0.82 ± 0.19 b | 1.3 ± 0.41 b | 0.63 ± 0.45 ab | *** | *** | *** |
| K6 | acetophenone | 1073 | A | nd a | nd a | nd a | nd a | nd a | nd a | nd a | nd a | 0.30 ± 0.16 b | 0.25 ± 0.16 b | 0.27 ± 0.05 b | 0.31 ± 0.04 b | 0.25 ± 0.01 b | 0.26 ± 0.07 b | 0.28 ± 0.07 b | 0.29 ± 0.02 b | *** | *** | *** |
| K7 | 3,5-octadien-2-one | 1092 | A | nd a | nd a | nd a | nd a | nd a | nd a | nd a | nd a | 2.2 ± 0.65 b | 2.4 ± 1.1 b | 0.92 ± 0.38 ab | 0.81 ± 0.32 ab | 2.1 ± 0.77 b | 2.2 ± 1.0 b | 2.2 ± 0.81 b | 2.1 ± 0.91 ab | *** | *** | *** |
| K8 | p-methyl-acetophenone | 1179 | B [23] | nd a | nd a | nd a | nd a | nd a | nd a | nd a | nd a | 0.11 ± 0.04 ab | 0.10 ± 0.01 a | tr ± 0.03 a | 0.10 ± 0.04 a | 0.10 ± 0.04 ab | nd a | 0.10 ± 0.05 | 0.22 ± 0.10 b | *** | *** | * |
| K9 | dihydrojasmone | 1378 | A | nd a | nd a | nd a | nd a | nd a | nd a | nd a | nd a | 0.62 ± 0.33 ab | 0.69 ± 0.38 b | 0.06 ± 0.04 ab | 0.17 ± 0.13 ab | 0.71 ± 0.36 b | 0.63 ± 0.26 ab | 0.30 ± 0.21 ab | 0.57 ± 0.15 ab | *** | *** | *** |
| Total | 0 | 0 | 0 | 0 | 0 | 0 | 0 | 0 | 7.8 | 9.1 | 5.4 | 4.8 | 9.4 | 7.9 | 8.3 | 8.5 | ||||||
| Alkanes | ||||||||||||||||||||||
| ALK1 | nonane | 900 | A | 0.41 ± 0.15 ab | 0.32 ± 0.11 ab | 0.43 ± 0.19 ab | 0.14 ± 0.18 a | 0.13 ± 0.10 a | 0.28 ± 0.11 ab | nd a | 0.17 ± 0.02 a | 0.84 ± 0.44 ab | 0.62 ± 0.36 ab | 0.69 ± 0.21 ab | 0.27 ± 0.14 a | 1.7 ± 0.34 b | 0.41 ± 0.06 ab | 0.36 ± 0.16 ab | 0.90 ± 0.35 ab | * | * | * |
| ALK2 | decane | 1000 | A | 0.80 ± 0.24 abcd | 0.49 ± 0.13 ab | nd a | 0.37 ± 0.11 ab | 0.60 ± 0.26 abc | 1.1 ± 0.21 bcde | 1.7 ± 0.29 ef | 0.83 ± 0.33 abcd | 1.6 ± 0.18 def | 1.7 ± 0.33 ef | 1.5 ± 0.36 cdef | 1.6 ± 0.05 def | 2.2 ± 0.21 f | 1.9 ± 0.05 ef | 1.9 ± 0.18 ef | 1.6 ± 0.19 def | *** | *** | *** |
| ALK3 | undecane | 1100 | A | 0.26 ± 0.15 abcd | 0.14 ± 0.09 | 0.19 ± 0.11 abcd | 0.04 ± 0.05 a | 0.24 ± 0.06 abc | 0.14 ± 0.10 abc | 0.07 ± 0.08 a | 0.11 ± 0.06 ab | 0.60 ± 0.31 cd | 0.27 ± 0.10 abcd | 0.57 ± 0.04 bcd | 0.63 ± 0.02 f | 0.55 ± 0.03 bcd | 0.33 ± 0.03 abcd | 0.43 ± 0.12 abcd | 0.52 ± 0.05 abcd | *** | *** | *** |
| ALK4 | dodecane | 1199 | A | 0.48 ± 0.08 | 0.37 ± 0.03 | 0.46 ± 0.05 | 0.31 ± 0.10 | 0.33 ± 0.10 | 0.44 ± 0.13 | 0.46 ± 0.10 | 0.44 ± 0.12 | 0.48 ± 0.23 | 0.20 ± 0.03 | 0.37 ± 0.10 | 0.31 ± 0.05 | 0.26 ± 0.03 | 0.29 ± 0.03 | 0.27 ± 0.04 | 0.34 ± 0.08 | ns | ns | ns |
| ALK5 | tridecane | 1299 | A | nd | nd | nd | nd | nd | nd | nd | nd | 0.16 ± 0.03 | nd | nd | nd | nd | nd | nd | nd | ns | ns | ns |
| ALK6 | tetradecane | 1399 | A | 0.11 ± 0.02 | tr ± 0.03 | tr ± 0.02 | tr ± 0.03 | 0.10 ± 0.06 | 0.10 ± 0.03 | tr ± 0.03 | 0.10 ± 0.02 | 0.16 ± 0.12 | tr ± 0.03 | tr ± 0.01 | tr ± 0.01 | tr ± 0.01 | tr ± 0.03 | tr ± 0.02 | 0.10 ± 0.06 | ns | ns | ns |
| ALK7 | pentadecane | 1499 | A | nd a | nd a | nd a | nd a | nd a | nd a | nd a | nd a | 0.15 ± 0.02 a | nd a | tr ± 0.05 a | nd a | 0.18 ± 0.02 a | 0.14 ± 0.01 a | 0.14 ± 0.02 a | nd a | ** | ** | ** |
| Total | 2.1 | 1.4 | 1.1 | 0.94 | 1.4 | 2.1 | 2.3 | 1.6 | 4.0 | 2.8 | 3.2 | 2.8 | 4.9 | 3.1 | 3.1 | 3.4 | ||||||
| Monoterpenes | ||||||||||||||||||||||
| M1 | α-thujene | 933 | B [24] | 0.27 ± 0.09 | 0.24 ± 0.08 | 0.29 ± 0.13 | 0.30 ± 0.11 | 0.22 ± 0.10 | 0.41 ± 0.19 | 0.32 ± 0.14 | 0.22 ± 0.13 | 0.64 ± 0.31 | 0.52 ± 0.19 | 1.1 ± 0.17 | 0.78 ± 0.20 | 0.42 ± 0.02 | 0.58 ± 0.14 | 0.64 ± 0.06 | 0.72 ± 0.22 | ns | ns | ns |
| M2 | α-pinene | 943 | A | 0.62 ± 0.05 | 0.85 ± 0.22 | 0.52 ± 0.19 | 0.62 ± 0.18 | 1.0 ± 0.42 | 0.89 ± 0.20 | 0.43 ± 0.20 | 0.62 ± 0.31 | 0.83 ± 0.14 | 0.49 ± 0.26 | 1.0 ± 0.30 | 0.81 ± 0.16 | 0.77 ± 0.33 | 0.69 ± 0.10 | 1.1 ± 0.58 | 0.75 ± 0.46 | ns | ns | ns |
| M3 | camphene | 960 | A | 2.5 ± 0.5 | 0.33 ± 0.07 | 0.29 ± 0.12 | 0.21 ± 0.08 | 0.35 ± 0.10 | 0.48 ± 0.05 | 0.66 ± 0.26 | 0.22 ± 0.08 | 0.73 ± 0.21 | 0.57 ± 0.05 | 0.93 ± 0.05 | 0.94 ± 0.13 | 0.73 ± 0.12 | 0.45 ± 0.32 | 0.96 ± 0.11 | 0.68 ± 0.14 | ns | ns | ns |
| M4 | sabinene | 981 | A | 0.44 ± 0.13 | 0.33 ± 0.04 | 0.66 ± 0.39 | 0.27 ± 0.04 | 0.28 ± 0.05 | 0.45 ± 0.03 | 0.53 ± 0.13 | 0.36 ± 0.06 | 0.37 ± 0.25 | 0.29 ± 0.08 | 0.34 ± 0.19 | 0.32 ± 0.09 | 0.31 ± 0.08 | 0.38 ± 0.15 | 0.30 ± 0.07 | 0.34 ± 0.07 | ns | ns | ns |
| M5 | β-pinene | 989 | A | 3.0 ± 0.64 | 5.2 ± 1.6 | 0.96 ± 0.36 | 5.4 ± 1.6 | 3.8 ± 1.6 | 2.7 ± 0.99 | 0.79 ± 0.24 | 4.5 ± 1.1 | 2.3 ± 0.63 | 2.1 ± 1.1 | 1.5 ± 0.38 | 2.6 ± 0.65 | 3.5 ± 1.4 | 1.1 ± 0.18 | 2.5 ± 1.3 | 2.9 ± 1.9 | ns | ns | ns |
| M6 | myrcene | 992 | A | 1.1 ± 0.26 abc | 1.9 ± 0.64 abc | 2.6 ± 0.74bc | 2.6 ± 0.22bc | 1.6 ± 0.37 abc | 2.1 ± 0.61 abc | 0.84± 0.34 ab | 1.1 ± 0.45 abc | 0.51 ± 0.03 a | 0.54± 0.19 ab | 1.8 ± 0.46 abc | 1.4 ± 0.06 abc | 0.48 ± 0.10 a | 1.1 ± 0.25 abc | 0.56 ± 0.18 ab | 0.51 ± 0.05 a | *** | *** | *** |
| M7 | α-phellandrene | 1013 | A | nd a | nd a | nd a | nd a | nd a | nd a | nd a | nd a | 0.37 ± 0.16 bc | 0.31 ± 0.03 b | 0.52 ± 0.06 c | 0.40 ± 0.06 bc | 0.33 ± 0.04 b | 0.39 ± 0.03 bc | 0.39 ± 0.07 bc | 0.37 ± 0.03 bc | *** | *** | *** |
| M8 | Δ -3-carene | 1019 | A | 0.24 ± 0.10 | 0.23 ± 0.18 | 0.25 ± 0.04 | 0.25 ± 0.12 | 0.22 ± 0.11 | 0.21 ± 0.10 | 0.32 ± 0.09 | 0.23 ± 0.05 | 0.72 ± 0.33 | 0.69 ± 0.39 | 0.94 ± 0.74 | 0.63 ± 0.44 | 0.54 ± 0.30 | 0.58 ± 0.30 | 0.77 ± 0.38 | 0.77 ± 0.46 | ns | ns | ns |
| M9 | m-cymene | 1032 | A | 4.3 ± 0.61 | 3.6 ± 0.41 | 3.5 ± 0.69 | 3.8 ± 0.43 | 3.4 ± 0.78 a | 5.0 ± 0.71 | 2.8 ± 0.61 | 3.7 ± 0.55 | 3.8 ± 0.94 | 3.7 ± 1.1 | 4.6 ± 1.3 | 3.4 ± 0.67 | 2.3 ± 0.94 | 3.9 ± 0.82 | 3.4 ± 1.5 | 3.3 ± 1.1 | ns | ns | ns |
| M10 | limonene | 1034 | A | 39 ± 8.2bc | 43 ± 0.56c | 33 ± 5.1 abc | 32 ± 2.3 abc | 39 ± 3.1bc | 32 ± 4.5 abc | 29 ± 3.9 abc | 33 ± 3.1 abc | 11 ± 4.9 a | 19 ± 1.9 abc | 24 ± 7.6 abc | 21 ± 2.1 abc | 11 ± 6.1 a | 12 ± 5.1 a | 15 ± 5.3 ab | 11 ± 5.3 a | *** | *** | *** |
| M11 | β-(E)-ocimene | 1049 | B [25] | 0.19 ± 0.01 a | 0.18 ± 0.07 a | 0.17 ± 0.02 a | 0.24 ± 0.03 a | 0.17 ± 0.02 a | 0.16 ± 0.02 a | 0.42 ± 0.08 a | 0.18 ± 0.02 a | 1.3 ± 0.91 ab | 0.71 ± 0.32 a | nd a | nd a | 1.7 ± 0.29 ab | 1.1 ± 0.28 a | nd a | 3.1 ± 0.43 b | *** | *** | *** |
| M12 | γ-terpinene | 1066 | A | 4.2 ± 1.2bcd | 4.3 ± 1.2 bcd | 3.6 ± 0.60 abcd | 5.9 ± 0.28 d | 5.6 ± 0.27 cd | 5.5 ± 1.4 cd | 2.1 ± 0.90 ab | 5.6 ± 1.4 d | 0.72 ± 0.12 a | 2.6 ± 1.4 abcd | 2.2 ± 0.36 abc | 2.0 ± 0.35 ab | 1.2 ± 0.24 ab | 1.1 ± 0.24 ab | 1.1 ± 0.20 ab | 1.1 ± 0.36 ab | *** | *** | *** |
| M13 | terpinolene | 1097 | A | 0.62 ± 0.19 abc | 0.89 ± 0.07 c | 0.53 ± 0.09 abc | 0.43 ± 0.01 abc | 0.36 ± 0.22 abc | 0.73 ± 0.20 bc | 0.57 ± 0.14 abc | 0.90 ± 0.31 c | 0.35 ± 0.08 abc | 0.25 ± 0.18 abc | 0.13 ± 0.08 ab | 0.20 ± 0.14 ab | 0.38 ± 0.14 abc | 0.34 ± 0.14 abc | nd a | 0.25 ± 0.18 abc | *** | *** | ** |
| M14 | allo-ocimene | 1132 | B [26] | 0.11 ± 0.06 ab | 0.10 ± 0.01 ab | 0.10 ± 0.05 ab | 0.31 ± 0.03 b | 0.24 ± <0.01 ab | 0.13 ± 0.04 ab | 0.31 ± 0.27 b | 0.13 ± 0.08 ab | nd a | nd a | nd a | nd a | nd a | nd a | nd a | nd a | *** | *** | ** |
| M15 | β-thujone | 1124 | B [23] | nd a | nd a | nd a | nd a | nd a | nd a | nd a | nd a | 0.10 ± 0.02 ab | tr ± 0.02 a | 0.10 ± 0.01 abc | 0.20 ± 0.04 c | tr ± 0.02 ab | 0.10 ± 0.02 ab | 0.17 ± 0.12bc | 0.10 ± 0.02 ab | *** | *** | *** |
| M16 | p-mentha-1,5,8-triene | 1135 | B [27] | 0.26 ± 0.05 ab | 0.10 ± 0.01 ab | 0.22 ± 0.02 ab | 0.56 ± 0.09 b | 0.26 ± 0.07 ab | 0.13 ± 0.09 ab | 0.49 ± 0.17 ab | 0.19 ± 0.08 ab | 0.10 ± 0.02 ab | tr ± 0.02 a | 0.16 ± 0.04 ab | 0.55 ± 0.15 ab | 0.10 ± 0.01 ab | 0.17 ± 0.05 ab | 0.50 ± 0.27 ab | 0.10 ± 0.06 ab | ** | ** | ** |
| M17 | (Z)-carveol | 1147 | B [19] | 0.48 ± 0.13 bcd | 0.57 ± 0.17 cd | 0.23 ± 0.08 abc | 0.18 ± 0.08 ab | 0.24 ± 0.02 ab | 0.31 ± 0.21 abc | tr ± 0.03 a | 0.13 ± 0.10 ab | 0.51 ± 0.07 cd | 0.45 ± 0.21 bcd | 0.65 ± 0.09d | 0.44 ± 0.02 bcd | 0.34 ± 0.07 abcd | 0.51 ± 0.14 cd | 0.26 ± 0.09 abcd | 0.60 ± 0.23 d | *** | *** | *** |
| M18 | pentylcyclohexa-1,3-diene | 1166 | B [19] | 0.20 ± 0.05 ab | 0.23 ± 0.08 ab | 0.25 ± 0.03 ab | 0.46 ± 0.11 abc | 0.31 ± 0.03 ab | 0.10 ± 0.04 a | 0.26 ± 0.16 ab | 0.20 ± 0.01 ab | 0.20 ± 0.06 ab | 0.13 ± 0.09 a | 0.19 ± 0.08 ab | 0.20 ± 0.02 ab | 0.16 ± 0.05 ab | 0.19 ± 0.02 ab | 0.12 ± 0.09 a | 0.30 ± 0.14 ab | * | * | * |
| M19 | (Z)-dihydrocarvone | 1208 | A | 0.39 ± 0.09 b | 0.36 ± 0.05 b | 0.35 ± 0.08 b | 0.19 ± 0.06 ab | 0.27 ± 0.05 ab | 0.18 ± 0.04 ab | 0.20 ± 0.08 ab | 0.26 ± 0.02 ab | 0.35 ± 0.03 b | 0.28 ± 0.02 ab | 0.30 ± 0.05 b | 0.25 ± 0.06 ab | 0.23 ± 0.12 ab | 0.20 ± 0.14 ab | nd a | 0.39 ± 0.06 b | ** | ** | ** |
| M20 | camphor | 1157 | A | nd a | nd a | nd a | nd a | nd a | nd a | nd a | nd a | 0.27 ± 0.15 bc | 0.17 ± 0.04 abc | 0.22 ± 0.06 abc | 0.17 ± 0.05 abc | 0.18 ± 0.08 abc | 0.23 ± 0.06 bc | 0.15 ± 0.03 ab | 0.38 ± 0.13 c | *** | *** | *** |
| M21 | isoborneol | 1173 | A | nd a | nd a | nd a | nd a | nd a | nd a | nd a | nd a | 0.25 ± 0.14 b | 0.17 ± 0.03 ab | 0.16 ± 0.06 ab | 0.17 ± 0.04 ab | 0.19 ± 0.04 ab | 0.25 ± 0.04 b | 0.18 ± 0.05 ab | 0.23 ± 0.12 b | *** | *** | *** |
| M22 | (E)-dihydrocarvone | 1240 | B [27] | 0.79 ± 0.12 f | 0.79 ± 0.14 f | 0.67 ± 0.10 ef | 0.41 ± 0.08 cde | 0.57 ± 0.09 ef | 0.43 ± 0.05 de | 0.38 ± 0.06 bcde | 0.59 ± 0.03 ef | 0.10 ± 0.03 ab | 0.10 ± 0.04 a | 0.10 ± 0.02 ab | 0.10 ± 0.01 ab | 0.10 ± 0.02 a | 0.11 ± 0.03 abc | tr ± 0.04 a | 0.14 ± 0.09 abcd | *** | *** | *** |
| M23 | β-cyclocitral | 1230 | A | nd a | nd a | nd a | nd a | nd a | nd a | nd a | nd a | 0.10 ± 0.04 b | 0.12 ± 0.02 b | 0.11 ± 0.03 b | 0.18 ± 0.02 b | 0.15 ± 0.01 b | 0.12 ± 0.02 b | 0.10 ± 0.01 b | 0.14 ± 0.06 b | *** | *** | *** |
| M24 | L-carvone | 1248 | A | 0.96 ± 0.19 bcd | 0.57 ± 0.11 abc | 1.5 ± 0.05 d | 0.71 ± 0.06 abc | 0.81 ± 0.13 abcd | 0.61 ± 0.14 abc | 0.75 ± 0.17 abcd | 1.1 ± 0.12 cd | 0.38 ± 0.22 abc | 0.26 ± 0.11 ab | 0.18 ± 0.06 ab | 0.14 ± 0.02 a | 0.23 ± 0.08 ab | 0.36 ± 0.03 abc | 0.17 ± 0.08 ab | 0.45 ± 0.23 abc | *** | *** | *** |
| M25 | D-carvone | 1262 | A | 0.43 ± 0.19 | 0.36 ± 0.10 | 0.24 ± 0.02 | 0.18 ± 0.03 | 0.23 ± 0.08 | 0.34 ± 0.15 | 0.44 ± 0.07 | 0.29 ± 0.06 | 0.33 ± 0.13 | 0.27 ± 0.06 | 0.60 ± 0.13 | 0.36 ± 0.17 | 0.30 ± 0.10 | 0.48 ± 0.11 | 0.52 ± 0.11 | 0.47 ± 0.18 | ns | ns | ns |
| M26 | thymol | 1290 | A | 0.17 ± 0.05 b | 0.11 ± 0.14 ab | 0.12 ± 0.04 ab | 0.15 ± 0.09 ab | 0.11 ± 0.08 ab | 0.10 ± 0.03 ab | nd a | 0.14 ± 0.11 ab | 0.15 ± 0.09 ab | 0.12 ± 0.07 ab | 0.15 ± 0.01 ab | 0.16 ± 0.01 ab | 0.12 ± 0.01 ab | 0.19 ± 0.08b | 0.10 ± 0.03 ab | 0.16 ± 0.05 ab | * | * | * |
| M27 | carvacrol | 1317 | A | 0.54 ± 0.08 | 0.42 ± 0.09 | 0.45 ± 0.03 | 0.60 ± 0.02 | 0.29 ± 0.03 | 0.39 ± 0.03 | 0.18 ± 0.04 | 0.52 ± 0.04 | 0.44 ± 0.21 | 0.36 ± 0.27 | 0.45 ± 0.05 a | 0.53 ± 0.08 | 0.31 ± 0.12 | 0.56 ± 0.23 | 0.19 ± 0.07 | 0.39 ± 0.14 | ns | ns | ns |
| Total | 61 | 64 | 50 | 56 | 59 | 53 | 42 | 54 | 27 | 34 | 42 | 38 | 26 | 27 | 29 | 30 | ||||||
| Monoterpenoid Alcohols | ||||||||||||||||||||||
| MA1 | (+)-(E)-p-mentha-2,8-dien-1-ol | 1122 | A | 0.10 ± 0.03 | 0.15 ± 0.01 | tr ± 0.03 | 0.28 ± 0.03 | 0.10 ± 0.02 | 0.10 ± 0.03 | tr ± 0.03 | 0.14 ± 0.01 | 0.15 ± 0.03 | 0.16 ± 0.01 | 0.15 ± 0.03 | 0.13 ± 0.02 | 0.12 ± 0.07 | 0.13 ± 0.02 | 0.12 ± 0.03 | 0.19 ± 0.13 | ns | ns | ns |
| MA2 | dihydrolinalool | 1142 | A | nd a | nd a | nd a | nd a | nd a | nd a | nd a | nd a | 0.75 ± 0.31 abc | 0.33 ± 0.26 abc | 0.93 ± 0.08bc | 1.2 ± 0.06c | 0.78 ± 0.18 abc | 0.64 ± 0.30 abc | 0.29 ± 0.11 ab | 0.48 ± 0.24 abc | *** | *** | *** |
| MA3 | (Z)-pinocarveol | 1147 | B [28] | 0.59 ± 0.13 a | 0.63 ± 0.17 a | 0.30 ± 0.08 a | 0.20 ± 0.08 a | 0.28 ± 0.02 a | 0.35 ± 0.21 a | tr ± 0.06 a | 0.45 ± 0.10 a | 0.29 ± 0.09 a | 0.21 ± 0.10 a | 0.11 ± 0.06 a | 0.10 ± 0.01 a | 0.20 ± 0.10 a | 0.47 ± 0.32 a | 0.15 ± 0.03 a | 0.57 ± 0.42 a | * | * | * |
| MA4 | terpinen-4-ol | 1184 | A | 0.10 ± 0.01 ab | nd a | tr ± 0.03 a | tr ± 0.03 ab | tr ± 0.03 a | 0.10 ± 0.07 ab | nd a | 0.13 ± 0.03 ab | 0.10 ± 0.09 ab | 0.15 ± 0.04 ab | 0.13 ± 0.03 ab | 0.18 ± 0.02 b | 0.10 ± 0.04 ab | 0.15 ± 0.06 ab | nd a | 0.20 ± 0.04 b | *** | *** | *** |
| MA5 | α-terpineol | 1211 | A | nd | nd | nd | nd | nd | nd | nd | nd | 0.10 ± 0.04 | nd | 0.10 ± 0.01 | 0.10 ± 0.01 | tr ± 0.03 | 0.10 ± 0.01 | tr ± 0.03 | 0.13 ± 0.09 | ns | ns | ns |
| MA6 | (E)-8-hydroxylinalool | 1349 | B [19] | nd a | nd a | nd a | nd a | nd a | nd a | nd a | nd a | 0.19 ± 0.05 b | 0.15 ± 0.06 b | 0.10 ± 0.04 ab | 0.10 ± 0.01 ab | 0.10 ± 0.02 ab | 0.18 ± 0.03 b | 0.10 ± 0.06 ab | 0.18 ± 0.05 b | *** | *** | *** |
| MA7 | caryophylladienol II | 1665 | B [19] | nd a | nd a | nd a | nd a | nd a | nd a | nd a | nd a | 0.1± 0.05 b | nd a | 0.10± 0.01 b | 0.10± 0.02 b | 0.10± 0.01 b | 0.11± 0.03 b | 0.10 ± 0.02 b | 0.10 ± 0.03 b | *** | *** | *** |
| Total | 0.79 | 0.78 | 0.38 | 0.53 | 0.39 | 0.48 | 0.06 | 0.72 | 1.6 | 1.0 | 1.6 | 1.9 | 1.4 | 1.8 | 0.77 | 1.7 | ||||||
| Sesquiterpenes | ||||||||||||||||||||||
| S1 | α-ylangene | 1384 | B [27] | 0.26 ± 0.11 c | 0.24 ± 0.07 c | 0.17 ± 0.11 c | tr ± 0.01 ab | 0.16 ± 0.05 bc | 0.19 ± 0.10 c | 0.20 ± 0.26 c | 0.20 ± 0.14 c | nd a | nd a | nd a | nd a | nd a | nd a | nd a | nd a | *** | *** | *** |
| S2 | α-copaene | 1390 | A | 1.1 ± 0.02e | 0.86 ± 0.01 de | 0.62 ± 0.03 cde | 0.10 ± 0.02 ab | 0.15 ± 0.05 ab | 0.49 ± 0.03 bcd | 0.78 ± 0.04 de | 0.77 ± 0.05 de | 0.14 ± 0.04 ab | 0.09 ± 0.06 ab | 0.06 ± 0.02 ab | nd a | nd a | 0.12 ± 0.05 ab | 0.24 ± 0.07 abc | 0.22 ± 0.18 abc | *** | *** | *** |
| S3 | (E)-β-caryophyllene | 1430 | B [29] | tr ± 0.03 | tr ± 0.02 | nd | nd | tr ± 0.04 | nd | nd | nd | nd | nd | nd | nd | nd | nd | nd | nd | ns | ns | ns |
| S4 | β-caryophyllene | 1445 | A | 4.4 ± 0.61 bc | 5.5 ± 0.32 c | 4.1 ± 0.43 bc | 2.5 ± 0.39 ab | 4.3 ± 1.3 bc | 4.1 ± 1.2 bc | 2.4 ± 0.29 ab | 2.2 ± 0.50 ab | 0.67 ± 0.52 a | 0.60 ± 0.40 a | 1.4 ± 0.73 a | 1.0 ± 0.15 a | 0.46 ± 0.17 a | 1.2 ± 0.13 a | 0.55 ± 0.28 a | 0.69 ± 0.28 a | *** | *** | *** |
| S5 | (+)-aromadendrene | 1452 | A | 0.17 ± 0.04 de | 0.21 ± 0.01 e | 0.15 ± 0.04 cde | tr ± 0.07 abc | 0.13 ± 0.03 cde | 0.15 ± 0.08 cde | 0.10 ± 0.06 abc | 0.10 ± 0.01bcd | tr ± 0.01 ab | nd a | nd a | nd a | nd a | nd a | nd a | nd a | *** | *** | *** |
| S6 | curcumene | 1472 | B [30] | 0.18 ± 0.09 abcd | 0.23 ± 0.11 b | 0.19 ± 0.06 b | 0.09 ± 0.05 a | 0.15 ± 0.22 b | 0.22 ± 0.19 b | tr ± 0.03 bcde | 0.12 ± 0.05 a | Nd a | Nd a | Nd a | Nd a | Nd a | Nd a | Nd a | Nd a | *** | ns | *** |
| S7 | α-humulene | 1479 | A | 0.42 ± 0.16 abcd | 0.70 ± 0.58 d | 0.38 ± 0.29 abcd | 0.49 ± 0.10 bcd | 0.51 ± 0.76 cd | 0.40 ± 0.65 abcd | 0.18 ± 0.01 abc | 0.26 ± 0.91 abcd | 0.11 ± 0.02 ab | 0.10 ± 0.06 a | 0.10 ± 0.05 a | 0.10 ± 0.02 a | 0.19 ± 0.04 abc | 0.10 ± 0.06 a | tr ± 0.03 a | 0.13 ± 0.05 abc | *** | *** | *** |
| S8 | β-selinene | 1508 | B [31] | 3.0 ± 0.05 cd | 2.7 ± 0.06 bcd | 1.5 ± 0.02 abc | 4.6 ± 0.15 d | 2.2 ± 0.19 abcd | 1.9 ± 0.12 abc | 3.3 ± 0.26 cd | 3.0 ± 0.14 bcd | 0.35 ± 0.25 ab | 0.31 ± 0.16 ab | 0.31 ± 0.17 ab | 1.3 ± 0.29 abc | 0.17 ± 0.06 a | 0.40 ± 0.26 ab | 0.36 ± 0.15 ab | 0.50 ± 0.12 ab | *** | *** | *** |
| S9 | valencene | 1514 | A | nd a | nd a | nd a | 2.9 ± 0.44 c | nd a | nd a | nd a | 0.20 ± 0.07 a | nd a | nd a | tr ± 0.02 a | 2.1 ± 0.16 b | tr ± 0.02 a | tr ± 0.01 a | tr ± 0.02 a | 0.36 ± 0.05 a | *** | *** | *** |
| S10 | α-selinene | 1515 | B [32] | 0.61 ± 0.02 c | 0.60 ± 0.02 c | 0.43 ± 0.05 abc | 0.63 ± 0.44 c | 0.54 ± 0.04 bc | 0.44 ± 0.03 abc | 0.71 ± 0.02 c | 0.59 ± 0.07 c | 0.10 ± 0.04 a | tr ± 0.03 a | tr ± 0.03 a | 0.14 ± 0.03 ab | tr ± 0.02 a | tr ± 0.05 a | tr ± 0.04 a | 0.10 ± 0.02 a | *** | *** | *** |
| S11 | kessane | 1557 | B [19] | nd a | 0.12 ± 0.02 a | nd a | 2.8 ± 0.05c | nd a | nd a | nd a | nd a | tr ± 0.03 a | tr ± 0.01 a | nd a | 2.0 ± 0.13b | nd a | tr ± 0.02 a | nd a | 0.36 ± 0.05 a | *** | *** | *** |
| S12 | cuparene $ | 1530 | B [33] | nd | nd | nd | nd | nd | nd | nd | nd | tr ± 0.02 | nd | nd | nd | tr ± 0.01 | tr ± 0.01 | nd | tr ± 0.04 | ns | ns | ns |
| S13 | (E)-nerolidol | 1540 | A | nd a | nd a | nd a | nd a | nd a | nd a | nd a | nd a | tr ± 0.02 a | tr ± 0.02 a | nd a | nd a | 0.10 ± 0.02 a | tr ± 0.04 a | tr ± 0.03 a | tr ± 0.03 a | ** | ** | ** |
| S14 | liguloxide $ | 1560 | B [34] | nd a | nd a | nd a | nd a | nd a | nd a | nd a | nd a | nd a | nd a | nd a | tr ± 0.01 a | nd a | tr ± 0.05 a | nd a | tr ± 0.01 a | ** | * | * |
| Total | 10 | 11 | 7.5 | 14 | 8.2 | 7.9 | 7.7 | 7.4 | 1.4 | 1.2 | 1.9 | 6.7 | 0.95 | 2.0 | 1.3 | 2.4 | ||||||
| Phthalides | ||||||||||||||||||||||
| P1 | 3-butylhexahydro phthalide | 1662 | B [19] | nd a | nd a | nd a | nd a | nd a | nd a | nd a | nd a | tr ± 0.04 abc | tr ± 0.02 ab | tr ± 0.01 abc | nd a | 0.10 ± 0.01bc | 0.10 ± 0.02c | tr ± 0.01 abc | 0.10 ± 0.01bc | *** | *** | *** |
| P2 | 3-n-butylphthalide | 1676 | B [8,10] | 5.0 ± 0.01 abc | 5.2 ± 0.03 abc | 9.4 ± 0.05 cd | 6.6 ± 0.01 abcd | 7.1 ± 0.03 abcd | 6.7 ± 0.01 abcd | 9.8 ± 0.06 d | 7.0 ± 0.03 abcd | 4.2 ± 1.1 ab | 3.6 ± 0.81 a | 5.6 ± 1.1 abcd | 8.5 ± 0.86 bcd | 4.9 ± 0.93 ab | 5.6 ± 1.4 abcd | 5.2 ± 1.3 abc | 4.6 ± 0.87 ab | *** | *** | *** |
| P3 | (Z)-3-butylidenephthalide | 1685 | B [19] | 0.15 ± 0.06 ab | 0.22 ± 0.05 abc | 0.36 ± 0.09b | 0.16 ± 0.02 ab | 0.25 ± 0.02 ab | 0.17 ± 0.07 ab | 0.25 ± 0.34 ab | 0.18 ± 0.25 ab | 0.22 ± 0.20 ab | 0.10 ± 0.04 a | 0.13 ± 0.01 ab | 0.13 ± 0.01 ab | 0.25 ± 0.06 ab | 0.17 ± 0.06 ab | 0.10 ± 0.01 a | 0.14 ± 0.04 ab | * | * | * |
| P4 | sedanenolide | 1748 | B [8,10] | 4.8 ± 0.30 abcd | 9.7 ± 2.3 bcde | 15 ± 1.9 e | 16 ± 1.6 e | 14 ± 3.0 e | 9.5 ± 2.9 abcde | 11 ± 3.0 cde | 13 ± 2.2 de | 1.1 ± 0.30 ab | 0.96 ± 0.03 a | 3.7 ± 1.1 abc | 9.2 ± 1.1 abcde | 1.5 ± 0.49 ab | 2.0 ± 0.89 ab | 0.92 ± 0.52 a | 1.3 ± 1.1 ab | *** | *** | *** |
| P5 | (Z)-neocnidilide | 1755 | B [19] | 0.26 ± 0.03 a | 0.13 ± 0.03 a | 1.8 ± 0.02 c | 0.16 ± 0.04 a | 0.30 ± 0.06 ab | 0.78 ± 0.06 abc | 0.99 ± 0.04 abc | 0.94 ± 0.04 abc | 1.4 ± 1.1 abc | 0.45 ± 0.24 abc | 1.2 ± 0.24 abc | 0.14 ± 0.01 a | 0.37 ± 0.15 ab | 1.7 ± 0.55 bc | 1.0 ± 0.23 abc | 1.1 ± 0.19 abc | *** | *** | *** |
| P6 | (E)-ligustilide | 1764 | B [8,10] | 0.12 ± 0.02 a | 0.15 ± 0.10 a | 0.24 ± 0.01 a | 0.23 ± 0.03 a | 0.25 ± 0.05 a | 0.14 ± 0.01 a | 0.18 ± 0.09 a | 0.18 ± 0.05 a | tr ± 0.02 a | tr ± 0.02 a | 0.10 ± 0.03 a | 0.11 ± 0.03 a | 0.25 ± 0.04 a | tr ± 0.02 a | tr ± 0.01 a | tr ± 0.02 a | * | * | * |
| Total | 10 | 16 | 27 | 23 | 22 | 17 | 22 | 21 | 7.0 | 5.1 | 11 | 18 | 7.3 | 9.6 | 7.3 | 7.2 | ||||||
| Aromatic Hydrocarbons | ||||||||||||||||||||||
| AHC1 | toluene | 769 | A | nd a | nd a | nd a | nd a | nd a | nd a | nd a | nd a | 0.24 ± 0.11 bc | 0.23 ± 0.11 bc | 0.38 ± 0.10 c | 0.25 ± 0.07 bc | 0.17 ± 0.01 ab | 0.19 ± 0.04 abc | 0.29 ± 0.06 bc | 0.27 ± 0.08 bc | *** | *** | *** |
| AHC2 | p-xylene | 876 | B [19] | nd a | nd a | nd a | nd a | nd a | nd a | nd a | nd a | 0.11 ± 0.08 ab | 0.12 ± 0.06 b | 0.14 ± 0.05 b | 0.09 ± 0.01 ab | 0.11 ± 0.01 ab | 0.17 ± 0.05 b | 0.15 ± 0.03 b | 0.15 ± 0.03 b | *** | *** | *** |
| Total | 0 | 0 | 0 | 0 | 0 | 0 | 0 | 0 | 0.35 | 0.35 | 0.52 | 0.34 | 0.28 | 0.36 | 0.44 | 0.42 | ||||||
| Oxides | ||||||||||||||||||||||
| O1 | caryophyllene oxide | 1610 | A | tr ± 0.01 abc | 0.13 ± 0.04 abcdef | 0.25 ± 0.05 cdef | tr ± 0.02 abcd | 0.10 ± 0.07 abcde | 0.10 ± 0.02 abcde | tr ± 0.01 ab | nd a | 0.25 ± 0.06 cdef | 0.27 ± 0.08 cdef | 0.28 ± 0.04 ef | 0.24 ± 0.09 bcdef | 0.26 ± 0.03 cdef | 0.33 ± 0.11 f | 0.22 ± 0.03 abcdef | 0.27 ± 0.11 def | *** | *** | *** |
| Lactone | ||||||||||||||||||||||
| L1 | γ-nonalactone | 1372 | A | nd a | nd a | nd a | nd a | nd a | nd a | nd a | nd a | 0.10 ± 0.01 bcd | 0.10 ± 0.02 bcd | tr ± 0.01 abc | tr ± 0.01 ab | 0.10 ± 0.01 bcde | 0.10 ± 0.01 cde | 0.10 ± 0.03 de | 0.10 ± 0.01e | *** | *** | *** |
| L2 | dihydroactinolide | 1557 | B [35] | nd a | nd a | nd a | nd a | nd a | nd a | nd a | nd a | tr ± 0.06 ab | 0.10 ± 0.05 abc | 0.10 ± 0.02 abc | n.d. a | 0.16 ± 0.01 c | 0.10 ± 0.06 abc | 0.10 ± 0.03 bc | tr ± 0.02 ab | *** | *** | *** |
| Total | 0 | 0 | 0 | 0 | 0 | 0 | 0 | 0 | 0.10 | 0.13 | 0.11 | 0.03 | 0.32 | 0.15 | 0.19 | 0.13 | ||||||
| Unknowns | ||||||||||||||||||||||
| U1 | unknown 1 | n/a | 0.57 ± 0.09 abc | 0.31 ± 0.03 ab | 0.43 ± 0.06 ab | 0.19 ± 0.02 ab | 0.27 ± 0.01 ab | 0.71 ± 0.20 bc | 1.2 ± 0.47c | 0.51 ± 0.29 abc | nd a | nd a | nd a | nd a | nd a | nd a | nd a | nd a | *** | *** | *** | |
| U2 | unknown 2 | n/a | 2.3 ± 0.63 bc | 1.7 ± 0.03 abc | 2.1 ± 0.06 abc | 0.84 ± 0.02 ab | 1.0 ± 0.01 ab | 2.7 ± 0.20 bc | 3.4 ± 0.47 c | 1.5 ± 0.29 abc | nd a | nd a | nd a | nd a | nd a | nd a | nd a | nd a | *** | *** | *** | |
| U3 | unknown 3 | 735 | nd a | nd a | nd a | nd a | nd a | nd a | nd a | nd a | 0.19 ± 0.08 b | 0.17 ± 0.05 b | 0.25 ± 0.01 b | 0.25 ± 0.05 b | 0.14 ± 0.01 b | 0.16 ± 0.04 b | 0.23 ± 0.02 b | 0.18 ± 0.03 b | *** | *** | *** | |
| U4 | unknown 4 | 766 | nd a | nd a | nd a | nd a | Nd a | Nd a | Nd a | Nd a | 0.17 ± 0.08 b | 0.15 ± 0.03 b | 0.23 ± 0.03 b | 0.17 ± 0.01 b | 0.12 ± 0.02 ab | 0.11 ± 0.09 ab | 0.15 ± 0.01 b | 0.19 ± 0.02 b | *** | *** | *** | |
| U5 | unknown 5 | 787 | nd a | nd a | nd a | nd a | nd a | nd a | nd a | nd a | 0.23 ± 0.11 b | 0.20 ± 0.07 b | 0.23 ± 0.09 b | 0.23 ± 0.05 b | 0.16 ± 0.02 ab | 0.18 ± 0.06 ab | 0.28 ± 0.06 b | 0.22 ± 0.05 b | *** | *** | *** | |
| U6 | unknown 6 | 896 | nd a | nd a | nd a | nd a | nd a | nd a | nd a | nd a | 0.22 ± 0.09 b | 0.16 ± 0.04 b | 0.25 ± 0.07 b | 0.22 ± 0.05 b | 0.17 ± 0.01 b | 0.22 ± 0.03 b | 0.22 ± 0.05 b | 0.16 ± 0.06 b | *** | *** | *** | |
| U7 | unknown 7 | 971 | nd a | nd a | nd a | nd a | nd a | nd a | nd a | nd a | 0.64 ± 0.04 bc | 0.52 ± 0.06 ab | 1.1 ± 0.01 c | 0.78 ± 0.17 bc | 0.42 ± 0.04 ab | 0.58 ± 0.02 bc | 0.64 ± 0.05 bc | 0.73 ± 0.03 b | *** | *** | *** | |
| U8 | unknown 8 | 1249 | nd a | nd a | nd a | nd a | nd a | nd a | nd a | nd a | 0.54 ± 0.18 b | 0.46 ± 0.06 b | 0.65 ± 0.06 b | 0.59 ± 0.02 b | 0.55 ± 0.03 b | 0.56 ± 0.13 b | 0.52± 0.05 b | 0.49± 0.02 b | *** | *** | *** | |
| U9 | unknown 9 | 1279 | 0.16 ± 0.06 ab | 0.08 ± 0.01 a | 0.10 ± 0.01 a | 0.13 ± 0.03 a | 0.24 ± 0.01 ab | 0.11 ± 0.01 a | 0.17 ± 0.03 ab | 0.10 ± 0.04 ab | 0.29 ± 0.12 ab | 0.18 ± 0.06 ab | 0.19 ± 0.07 ab | 0.18 ± 0.02 ab | 0.17 ± 0.05 ab | 0.22 ± 0.05 ab | 0.14 ± 0.04 ab | 0.50 ± 0.19 bc | * | * | * | |
| U10 | unknown 10 | 1362 | 0.10 ± 0.02 ab | 0.09 ± 0.03 ab | nd a | 0.16 ± 0.01 b | 0.03 ± 0.04 a | 0.10 ± 0.01 ab | 0.08 ± 0.01 ab | 0.07 ± 0.4 a | nd a | nd a | nd a | nd a | nd a | nd a | nd a | nd a | *** | ** | *** | |
| U11 | unknown 11 | 1506 | nd a | nd a | nd a | nd a | nd a | nd a | nd a | nd a | 0.10 ± 0.05 ab | 0.10 ± 0.01 ab | 0.13 ± 0.04b | 0.10 ± 0.05 ab | 0.10 ± 0.03 a | 0.13 ± 0.05 b | 0.13 ± 0.03 b | 0.13 ± 0.06 b | ** | *** | *** | |
| U12 | unknown 12 | 1539 | 0.25 ± 0.02 ab | 0.33 ± 0.04 b | 0.19 ± 0.02 ab | 0.13 ± 0.01 a | 0.10 ± 0.04 ab | 0.10 ± 0.01 a | 0.18 ± 0.01 ab | 0.12 ± 0.04 ab | 0.10 ± 0.04 a | 0.10 ± 0.07 a | 0.17 ± 0.04 ab | 0.20 ± 0.02 ab | 0.11 ± 0.02 a | 0.17 ± 0.07 ab | 0.10 ± 0.01 a | 0.13 ± 0.06 ab | ** | ** | ** | |
| U13 | unknown 13 | 1684 | nd a | nd a | nd a | nd a | nd a | nd a | nd a | nd a | tr ± 0.06 a | tr ± 0.02 a | tr ± 0.02 a | tr ± 0.03 a | tr ± 0.02 a | 0.10 ± 0.01 a | tr ± 0.02 a | tr ± 0.01 a | * | ** | * | |
| U14 | unknown 14 | 1706 | nd a | nd a | nd a | nd a | nd a | nd a | nd a | nd a | 0.10 ± 0.09 ab | tr ± 0.02 ab | 0.10 ± 0.02 ab | 0.11 ± 0.01 b | 0.10 ± 0.04 ab | 0.13 ± 0.02b | 0.10 ± 0.03 ab | 0.10 ± 0.05 ab | *** | *** | *** | |
| U15 | unknown 15 | 1799 | nd a | nd a | nd a | nd a | nd a | nd a | nd a | nd a | 0.13 ± 0.03 b | 0.13 ± 0.05 b | 0.18 ± 0.01 b | 0.13 ± 0.04 b | 0.10 ± 0.01 b | 0.18 ± 0.04 b | 0.12 ± 0.02 b | 0.13 ± 0.05 b | *** | *** | *** | |
| Total | 3.4 | 2.5 | 2.9 | 1.4 | 1.8 | 3.8 | 5.1 | 2.4 | 2.7 | 2.2 | 3.5 | 3.0 | 2.2 | 2.7 | 2.6 | 3.0 | ||||||
| Attribute | Score A | |||||||||||||||||
|---|---|---|---|---|---|---|---|---|---|---|---|---|---|---|---|---|---|---|
| UK | P B | Spain | P B | |||||||||||||||
| 5 | 8 | 10 | 12 | 15 | 18 | 22 | 25 | 5 | 8 | 10 | 12 | 15 | 18 | 22 | 25 | |||
| Appearance | ||||||||||||||||||
| Colour | 56.4 b | 63.6 ab | 62.6 ab | 72.9 a | 72.1 a | 65.6 ab | 70.5 a | 26.8 c | *** | 45.6 c | 51.2 c | 50.0 c | 69.9 ab | 71.8 a | 56.0 bc | 71.6 a | 26.7 d | *** |
| Stalk thickness | 49.8 ab | 49.5 ab | 55.8 a | 20.9 b | 58.7 a | 62.5 a | 61.3 a | 55.0 a | *** | 42.4 ab | 46.8 ab | 38.2 bc | 27.3 c | 55.5 a | 55.9 a | 58.4 a | 54.4 a | *** |
| Ribbed | 46.6 bc | 61.0 ab | 61.7 a | 65.9 a | 35.5 cd | 25.4 d | 34.2 cd | 37.4 cd | *** | 66.7 a | 64.0 ab | 67.9 a | 76.1 a | 48.4 c | 42.1 c | 49.6 bc | 49.5 bc | *** |
| Odour | ||||||||||||||||||
| Fresh fennel | 16.5 | 14.2 | 18.9 | 15.5 | 15.3 | 18.6 | 15.4 | 18.2 | ns | 19.5 | 18.4 | 16.8 | 15.4 | 24.8 | 19.9 | 15.8 | 13.7 | ns |
| Grassy/green | 32.6 a | 31.0 ab | 32.1 ab | 36.3 a | 30.7 ab | 28.3 ab | 35.3 a | 21.1 b | *** | 11.6 b | 19.4 ab | 24.3 a | 25.6 a | 23.5 a | 20.1 ab | 23.2 a | 19.2 ab | ** |
| Fresh parsley | 14.1 | 19.7 | 19.0 | 19.1 | 20.6 | 16.7 | 16.7 | 10.8 | ns | 11.5 | 15.5 | 16.8 | 16.1 | 18.5 | 16.6 | 14.1 | 11.4 | ns |
| Fresh coriander | 12.8 | 12.1 | 14.2 | 11.7 | 14.2 | 17.5 | 15.4 | 11.1 | ns | 17.9 | 18.9 | 21.5 | 15.1 | 22.8 | 22.7 | 17.7 | 14.3 | ns |
| Taste/flavour | ||||||||||||||||||
| Bitter | 23.1 abc | 24.0 abc | 24.7 abc | 35.9 a | 28.2 abc | 31.3 ab | 24.4 abc | 15.5 c | ns | 24.4 ab | 30.9 ab | 29.4 ab | 30.9 ab | 28.4 ab | 36.4 a | 26.1 ab | 18.1 b | ** |
| Salt | nd | nd | nd | nd | nd | nd | nd | nd | ** | 26.4 | 22.6 | 27.3 | 31.3 | 23.4 | 31.2 | 24.8 | 18.7 | ns |
| Sweet | 15.2 bcd | 20.3 ab | 21.6 ab | 10.6 d | 15.6 bcd | 12.2 cd | 20.0 ab | 24.6 a | *** | 18.3 | 19.8 | 21.4 | 18.2 | 20.0 | 14.5 | 16.1 | 22.8 | ns |
| Fresh fennel | 11.9 | 10.3 | 12.6 | 11.0 | 7.7 | 13.6 | 11.6 | 11.3 | ns | 15.0 | 15.7 | 10.4 | 13.2 | 17.4 | 13.6 | 8.0 | 10.8 | ns |
| Rocket | 11.3 bc | 13.4 bc | 12.4 bc | 23.8 a | 16.6 abc | 16.9 abc | 10.4 bc | 7.7 c | *** | 1.8 | 2.0 | 3.2 | 1.8 | 1.4 | 1.0 | 0.8 | 0.2 | ns |
| Fresh coriander | 17.5 | 16.3 | 16.0 | 9.6 | 15.0 | 18.1 | 18.9 | 14.1 | ns | 17.2 | 21.0 | 18.1 | 17.4 | 18.0 | 21.4 | 15.7 | 13.8 | ns |
| Soapy | 18.2 ab | 12.4 b | 16.4 ab | 18.4 ab | 15.4 ab | 23.7 a | 16.3 ab | 13.0 ab | * | 19.1 | 20.5 | 25.1 | 22.0 | 20.0 | 27.5 | 19.7 | 15.0 | ns |
| Cucumber | 25.7 ab | 33.2 ab | 30.4 ab | 9.1 c | 30.0 ab | 22.4 b | 27.9 ab | 37.7 a | *** | 12.8 | 14.1 | 9.9 | 5.8 | 15.3 | 11.8 | 11.8 | 14.8 | ns |
| Mouthfeel | ||||||||||||||||||
| Crunchy | 65.4 abc | 62.6 bc | 64.9 abc | 56.7 c | 70.2 ab | 66.4 abc | 73.7 a | 62.5 bc | *** | 64.0 | 67.4 | 67.8 | 61.9 | 70.5 | 66.2 | 70.3 | 65.5 | ns |
| Stringy | 40.8 b | 46.6 b | 40.1 b | 64.1 a | 33.2 b | 40.6 b | 35.1 b | 35.2 b | *** | 60.2 ab | 58.2 ab | 59.9 ab | 71.9 a | 47.2 bc | 57.3 abc | 38.5 c | 52.4 abc | *** |
| Moist | 50.6 a | 47.2 a | 50.0 a | 29.7 b | 53.1 a | 44.3 a | 51.4 a | 54.8 a | *** | 49.9 | 55.8 | 45.1 | 35.5 | 58.6 | 47.8 | 52.1 | 56.2 | ns |
| Firmness of first bite | 63.7 | 59.9 | 63.3 | 59.2 | 68.9 | 65.7 | 67.6 | 58.6 | ns | 64.8 | 66.1 | 65.6 | 63.5 | 67.2 | 63.2 | 69.9 | 63.2 | ns |
| Aftereffects | ||||||||||||||||||
| Numbness | 13.1 | 8.6 | 13.8 | 11.5 | 10.0 | 14.0 | 9.8 | 9.0 | 17.0 | 19.3 | 20.9 | 16.4 | 21.1 | 23.1 | 16.0 | 11.4 | ns | |
| Bitter | 17.4 bc | 18.4 bc | 18.3 bc | 29.0 a | 19.1 bc | 25.7 ab | 16.0 bc | 12.0 c | *** | 16.7 ab | 19.4 ab | 24.3 a | 21.8 ab | 19.2 ab | 25.0 a | 17.2 ab | 12.0 b | * |
| Soapy | 16.9 ab | 15.7 ab | 16.7 ab | 21.2 ab | 19.9 ab | 24.8 a | 18.6 ab | 12.9 b | * | 18.3 | 21.5 | 22.7 | 20.8 | 21.7 | 25.5 | 18.8 | 11.7 | ns |
| Grassy/green | 27.7 | 27.0 | 30.3 | 27.6 | 28.4 | 26.4 | 31.4 | 19.0 | ns | 12.3 | 13.3 | 15.8 | 19.9 | 15.8 | 14.3 | 15.7 | 13.6 | ns |
| Ely, Cambridgeshire (UK) | Aguilas, Mercia (Spain) | |||||||||
|---|---|---|---|---|---|---|---|---|---|---|
| Weeks after Transplant | Air Temp (°C) | Rainfall (mm) | Relative Humidity (%) | Wind Speed (m/s) | Dew Point (°C) | Air Temp (°C) | Rainfall (mm) | Relative Humidity (%) | Wind Speed (m/s) | Dew Point (°C) |
| 1 | 17.0 | 0.0 | 73.0 | 2.4 | 15.4 | 15.3 | 0.0 | 79.6 | 0.8 | 1.9 |
| 2 | 14.7 | 0.0 | 81.3 | 1.5 | 18.7 | 15.4 | 0.1 | 76.3 | 1.1 | 3.9 |
| 3 | 16.4 | 0.1 | 66.1 | 1.3 | 20.0 | 19.9 | 0.0 | 72.8 | 2.4 | 4.1 |
| 4 | 17.0 | 0.0 | 94.8 | 1.6 | 18.4 | 17.4 | 0.1 | 63.7 | 2.9 | 1.1 |
| 5 | 18.9 | 0.0 | 98.5 | 1.5 | 20.4 | 16.9 | 0.0 | 82.1 | 1.0 | 6.9 |
| 6 | 19.8 | 0.0 | 99.7 | 3.0 | 16.3 | 16.4 | 0.0 | 81.2 | 1.9 | 6.1 |
| 7 | 18.2 | 0.0 | 99.4 | 1.4 | 6.5 | 16.6 | 0.0 | 82.5 | 1.2 | 6.3 |
| 8 | 20.4 | 0.0 | 99.0 | 1.9 | 16.3 | 18.5 | 0.0 | 84.7 | 0.8 | 8.2 |
| 9 | 21.4 | 0.1 | 70.5 | 2.1 | 18.2 | 18.9 | 0.0 | 78.3 | 1.3 | 6.9 |
| 10 | 20.9 | 0.0 | 71.8 | 2.6 | 13.9 | 19.8 | 0.0 | 79.4 | 1.4 | 7.2 |
| 11 | 17.3 | 0.2 | 99.9 | 1.0 | 12.4 | 17.9 | 0.3 | 71.1 | 2.2 | 5.1 |
| 12 | 18.4 | 0.0 | 98.6 | 2.3 | 12.9 | 16.9 | 1.8 | 78.3 | 2.1 | 8.0 |
| 13 | 15.8 | 0.0 | 93.9 | 2.0 | 12.4 | 19.0 | 0.6 | 74.3 | 2.4 | 6.6 |
| Average | 18.2 | 0.0 | 88.1 | 1.9 | 15.5 | 17.6 | 0.4 | 77.3 | 1.7 | 6.0 |
Publisher’s Note: MDPI stays neutral with regard to jurisdictional claims in published maps and institutional affiliations. |
© 2021 by the authors. Licensee MDPI, Basel, Switzerland. This article is an open access article distributed under the terms and conditions of the Creative Commons Attribution (CC BY) license (https://creativecommons.org/licenses/by/4.0/).
Share and Cite
Turner, L.; Lignou, S.; Gawthrop, F.; Wagstaff, C. Investigating the Relationship of Genotype and Geographical Location on Volatile Composition and Sensory Profile of Celery (Apium graveolens). Int. J. Mol. Sci. 2021, 22, 12016. https://doi.org/10.3390/ijms222112016
Turner L, Lignou S, Gawthrop F, Wagstaff C. Investigating the Relationship of Genotype and Geographical Location on Volatile Composition and Sensory Profile of Celery (Apium graveolens). International Journal of Molecular Sciences. 2021; 22(21):12016. https://doi.org/10.3390/ijms222112016
Chicago/Turabian StyleTurner, Lucy, Stella Lignou, Frances Gawthrop, and Carol Wagstaff. 2021. "Investigating the Relationship of Genotype and Geographical Location on Volatile Composition and Sensory Profile of Celery (Apium graveolens)" International Journal of Molecular Sciences 22, no. 21: 12016. https://doi.org/10.3390/ijms222112016
APA StyleTurner, L., Lignou, S., Gawthrop, F., & Wagstaff, C. (2021). Investigating the Relationship of Genotype and Geographical Location on Volatile Composition and Sensory Profile of Celery (Apium graveolens). International Journal of Molecular Sciences, 22(21), 12016. https://doi.org/10.3390/ijms222112016