Abstract
Autotaxin (ATX) encoded by Ectonucleotide Pyrophosphatase/Phosphodiesterase 2 (ENPP2) is a key enzyme in Lysophosphatidic Acid (LPA) synthesis implicated in cancer. Although its aberrant expression has been reported, ENPP2 methylation profiles in health and malignancy are not described. We examined in silico the methylation of ENPP2 analyzing publicly available methylome datasets, to identify Differentially Methylated CpGs (DMCs) which were then correlated with expression at gene and isoform levels. Significance indication was set to be FDR corrected p-value < 0.05. Healthy tissues presented methylation in all gene body CGs and lower levels in Promoter Associated (PA) regions, whereas in the majority of the tumors examined (HCC, melanoma, CRC, LC and PC) the methylation pattern was reversed. DMCs identified in the promoter were located in sites recognized by multiple transcription factors, suggesting involvement in gene expression. Alterations in methylation were correlated to an aggressive phenotype in cancer cell lines. In prostate and lung adenocarcinomas, increased methylation of PA CGs was correlated to decreased ENPP2 mRNA expression and to poor prognosis parameters. Collectively, our results corroborate that methylation is an active level of ATX expression regulation in cancer. Our study provides an extended description of the methylation status of ENPP2 in health and cancer and points out specific DMCs of value as prognostic biomarkers.
1. Introduction
ATX encoded by ENPP2 is a secreted lysophospholipase D (lysoPLD) and belongs to the ENPP (1–7) protein family [1]. ATX is responsible for the synthesis of the majority of extracellular LPA in blood. LPA acts locally upon increased ATX levels through at least six G protein-coupled receptors [2]. Increased ATX activity and levels have been correlated with several inflammatory [3] and fibroproliferative conditions [4], as well as with cancer [5]. In particular, increased expression of ATX in blood and the subsequent increase of LPA have been correlated with cancer invasiveness [6]. In addition, it has been shown that ATX expression is upregulated in cancerous [7,8] and fibrotic tissues [9].
ENPP2 contains 26 introns and 27 exons and is located in the human chromosomal region 8q24 [10], a region with frequent genetic alterations in many cancers [11]. ENPP2 is characterized by alternative splicing of mRNA. The best-known splice variants of ENPP2 are isoforms alpha, beta and gamma; between them, differences in the stability and expression pattern have been documented among several tissues [12].
Epigenetic regulation of ENPP2 has been previously reported [13]. DNA methylation, a well-studied epigenetic mechanism, can regulate gene expression [14], and aberrant gene-specific methylation has been correlated with many pathologies, such as cancer [15,16,17,18,19,20]. However, data on the methylation profile of ENPP2 in health and pathology are fragmented. A study in Biliary Atresia (BA) showed hypomethylation at four CpGs of ENPP2 promoter in the blood and liver of BA patients in relation to normal tissue and was correlated to increased ATX expression [21]. ENPP2 promoter hypermethylation and gene under-expression was found in primary invasive breast carcinomas [13]. Similarly, in breast cancer cell lines, a promoter-associated CpG (cg02156680) of ENPP2 was found highly methylated [22].
In the present study, we studied in silico the methylation of ENPP2 in health and several malignancies and correlated it with gene and isoform expression, aggressiveness and prognosis. Cancer types included in our study were chosen based on their high world incidence, mortality and prevalence [23], as well as access to readily available suitable high-throughput datasets. We examined publicly available methylation datasets from readings by the Illumina methylation bead-chip arrays found in Gene Expression Omnibus (GEO), to identify Differentially Methylated CpGs (DMCs) of ENPP2 between health and disease. Lung, prostate and liver cancer presented a greater number of Promoter Associated (PA) DMCs for ENPP2 and were further pursued using large datasets retrieved from The Cancer Genome Atlas (TCGA), which allowed DMC correlation to clinicopathological parameters and gene expression. A workflow of our study is presented in Figure 1.
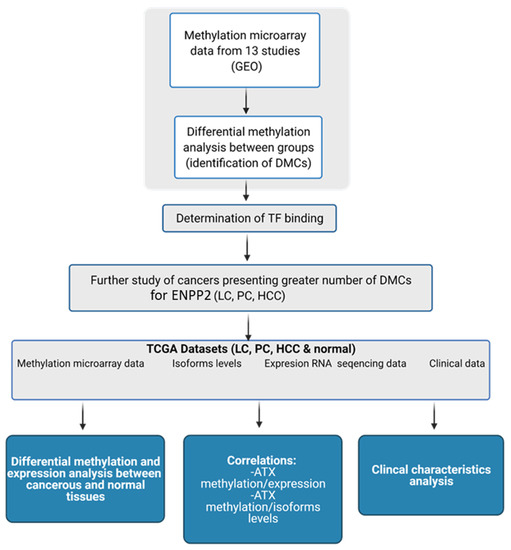
Figure 1.
Workflow of the study of ENPP2. Created with BioRender.com (Agreement number: UW22ZTY5U7) (accessed on 24 September 2021). Abbreviations: GEO: Gene Expression Omnibus, DMCs: Differential Methylated CpG sites, TF: Transcription Factor, TCGA: The Cancer Genome Atlas, LC: Lung Cancer, PC: Prostate Cancer, HCC: Hepatocellular Carcinoma, ATX: Autotaxin.
2. Materials and Methods
2.1. GEO Datasets for the In-Silico Methylation Analysis
DNA methylation data from cancer cell lines and patients with different malignancies and corresponding controls were obtained from the GEO (Gene Expression Omnibus) (https://www.ncbi.nlm.nih.gov/geo/, accessed on 25 December 2020) database [24]. Colorectal Cancer (CRC), Lung Cancer (LC), melanoma, Prostate Cancer (PC), Gastric Cancer (GC), Liver Cancer (HCC), cell lines and normal tissues were used as keywords in GEO query and ‘Methylation profiling by array’ as study type. A total of 73 studies were found; between them, only those using Infinium Human Methylation 27 K, 450 K and EPIC BeadChips (San Diego, CA, USA) and providing adequate data were selected for further analysis. In total, 13 studies, GSE27130 [25], GSE98534 [26], GSE63704, GSE46306 [27], GSE134772 [28], GSE120878 [29], GSE76938 [30], GSE97686 [31], GSE113017 [32], GSE113019 [32], GSE71627 [33], GSE50192 [34,35] and GSE51815 [36], were recruited for our analysis. Descriptions of study groups and correlations are presented in Table 1.

Table 1.
Methylome datasets retrieved from GEO for the in silico analysis of ENPP2 methylation.
2.2. Methylation and Statistical Analysis
Methylation analysis was carried out using normalized beta values ranging between 0 (no methylation) and 1 (full methylation) representing methylation levels of each CpG site (Level 3 data). The Kolmogorov–Smirnov test was applied to check for normality in distribution. Statistical analysis was performed using IBM SPSS 19.0 statistical software (IBM Corp. 2010. IBM SPSS Statistics for Windows, Version 19.0. Armonk, NY, USA). One-Way ANOVA tests followed by Bonferroni post-hoc or Kruskal–Wallis tests were used for comparisons of continuous variables among three or more different groups. In the case of binary variables, t-test or Mann–Whitney tests were also applied. Pearson or Spearman correlation was applied to compare two continuous variables. Differentially Methylated CpGs (DMCs) for ENPP2 were identified based on the False Discovery Rate (FDR—adjusted p-value < 5.00 × 10⁻²).
2.3. In Silico Determination of Transcription Factor (TF) Binding
In order to examine if the DMCs identified were correlated to ENPP2 expression, we further analyzed promoter regions to locate TF binding sites. Hence, PROMO (http://alggen.lsi.upc.es/, accessed on 18 March 2021) [37] tool was used in order to define possible TFs binding in identified DMCs inside ENPP2 promoter. Only human factors and human sites were considered for a TFs search.
2.4. Expression and Methylation Correlation Analysis Using TCGA Datasets
Normalized (gene and isoform level) RNA-seq (Illumina HiSeq), level 3 methylation legacy data (Infinium Human Methylation 450 K bead-chip) and corresponding available clinical data were retrieved from prostate adenocarcinoma, lung adenocarcinoma and liver hepatocellular carcinoma TCGA projects representing PC, LC and HCC cases, using the TCGAbiolinks R package [38]. In total, 212 LC, 235 PC and 241 HCC cancer cases along with adjacent healthy lung (15 cases), prostate (35 cases) and liver (42 cases) tissues were obtained. More specifically, cases were chosen to include both mRNA expression (gene and isoforms) and methylation data, from which all matched control and tumor cases were retrieved along with 200 additional tumor samples per cancer type. In the rare case of a case ID being represented by more than one methylation or expression file, the weighted average of the respective values was used for downstream analysis (all weights sum up to the unit). Spearman correlation was calculated per cancer type using the cor.test function. The cutoff level of significance was set to be FDR corrected p-value < 0.05. Last, p-values of linear models fitted between methylation and expression levels (lm R function) were used to test and establish the importance of small correlation coefficients. Analyses were performed using R version 4.0.4.
2.5. Expression, Methylation and Survival Analysis Using the UALCAN Database
In order to further verify our results, we used the UALCAN database (http://ualcan.path.uab.edu/, accessed on 10 September 2021) [39] that enables researchers to analyze cancer archived omics data. We performed expression, methylation and survival analysis of ENPP2 in the three types of cancer used in our analysis (PC, LC, HCC) along with the corresponding controls. According to UALCAN, different beta value cut-offs have been considered to indicate hyper-methylation [beta value: 0.7 − 0.5] or hypo-methylation [beta-value: 0.3 − 0.25]. For mRNA expression, methylation and survival, we used TCGA gene analysis, and the screening conditions were as follows: gene “ENPP2”, TCGA dataset “Prostate adenocarcinoma”, “Lung adenocarcinoma”, “Lung Squamous cell carcinoma”, “Liver hepatocellular carcinoma”. We then used “expression”, “methylation” and “survival” as links for analysis of each cancer. Protein expression data were available only for lung adenocarcinoma, and Clinical Proteomic Tumor Analysis Consortium (CPTAC) datasets were used for analysis. For protein analysis, Z-values represent standard deviations from the median across samples for the given cancer type. Log2 Spectral count ratio values from CPTAC were first normalized within each sample profile and then normalized across samples.
3. Results
3.1. Analysis of ENPP2 Methylation from GEO Datasets
In silico methylation analysis of ENPP2 was performed using methylome data retrieved using the GEO. The results are described below.
3.2. ENPP2 Methylation in Normal Tissues
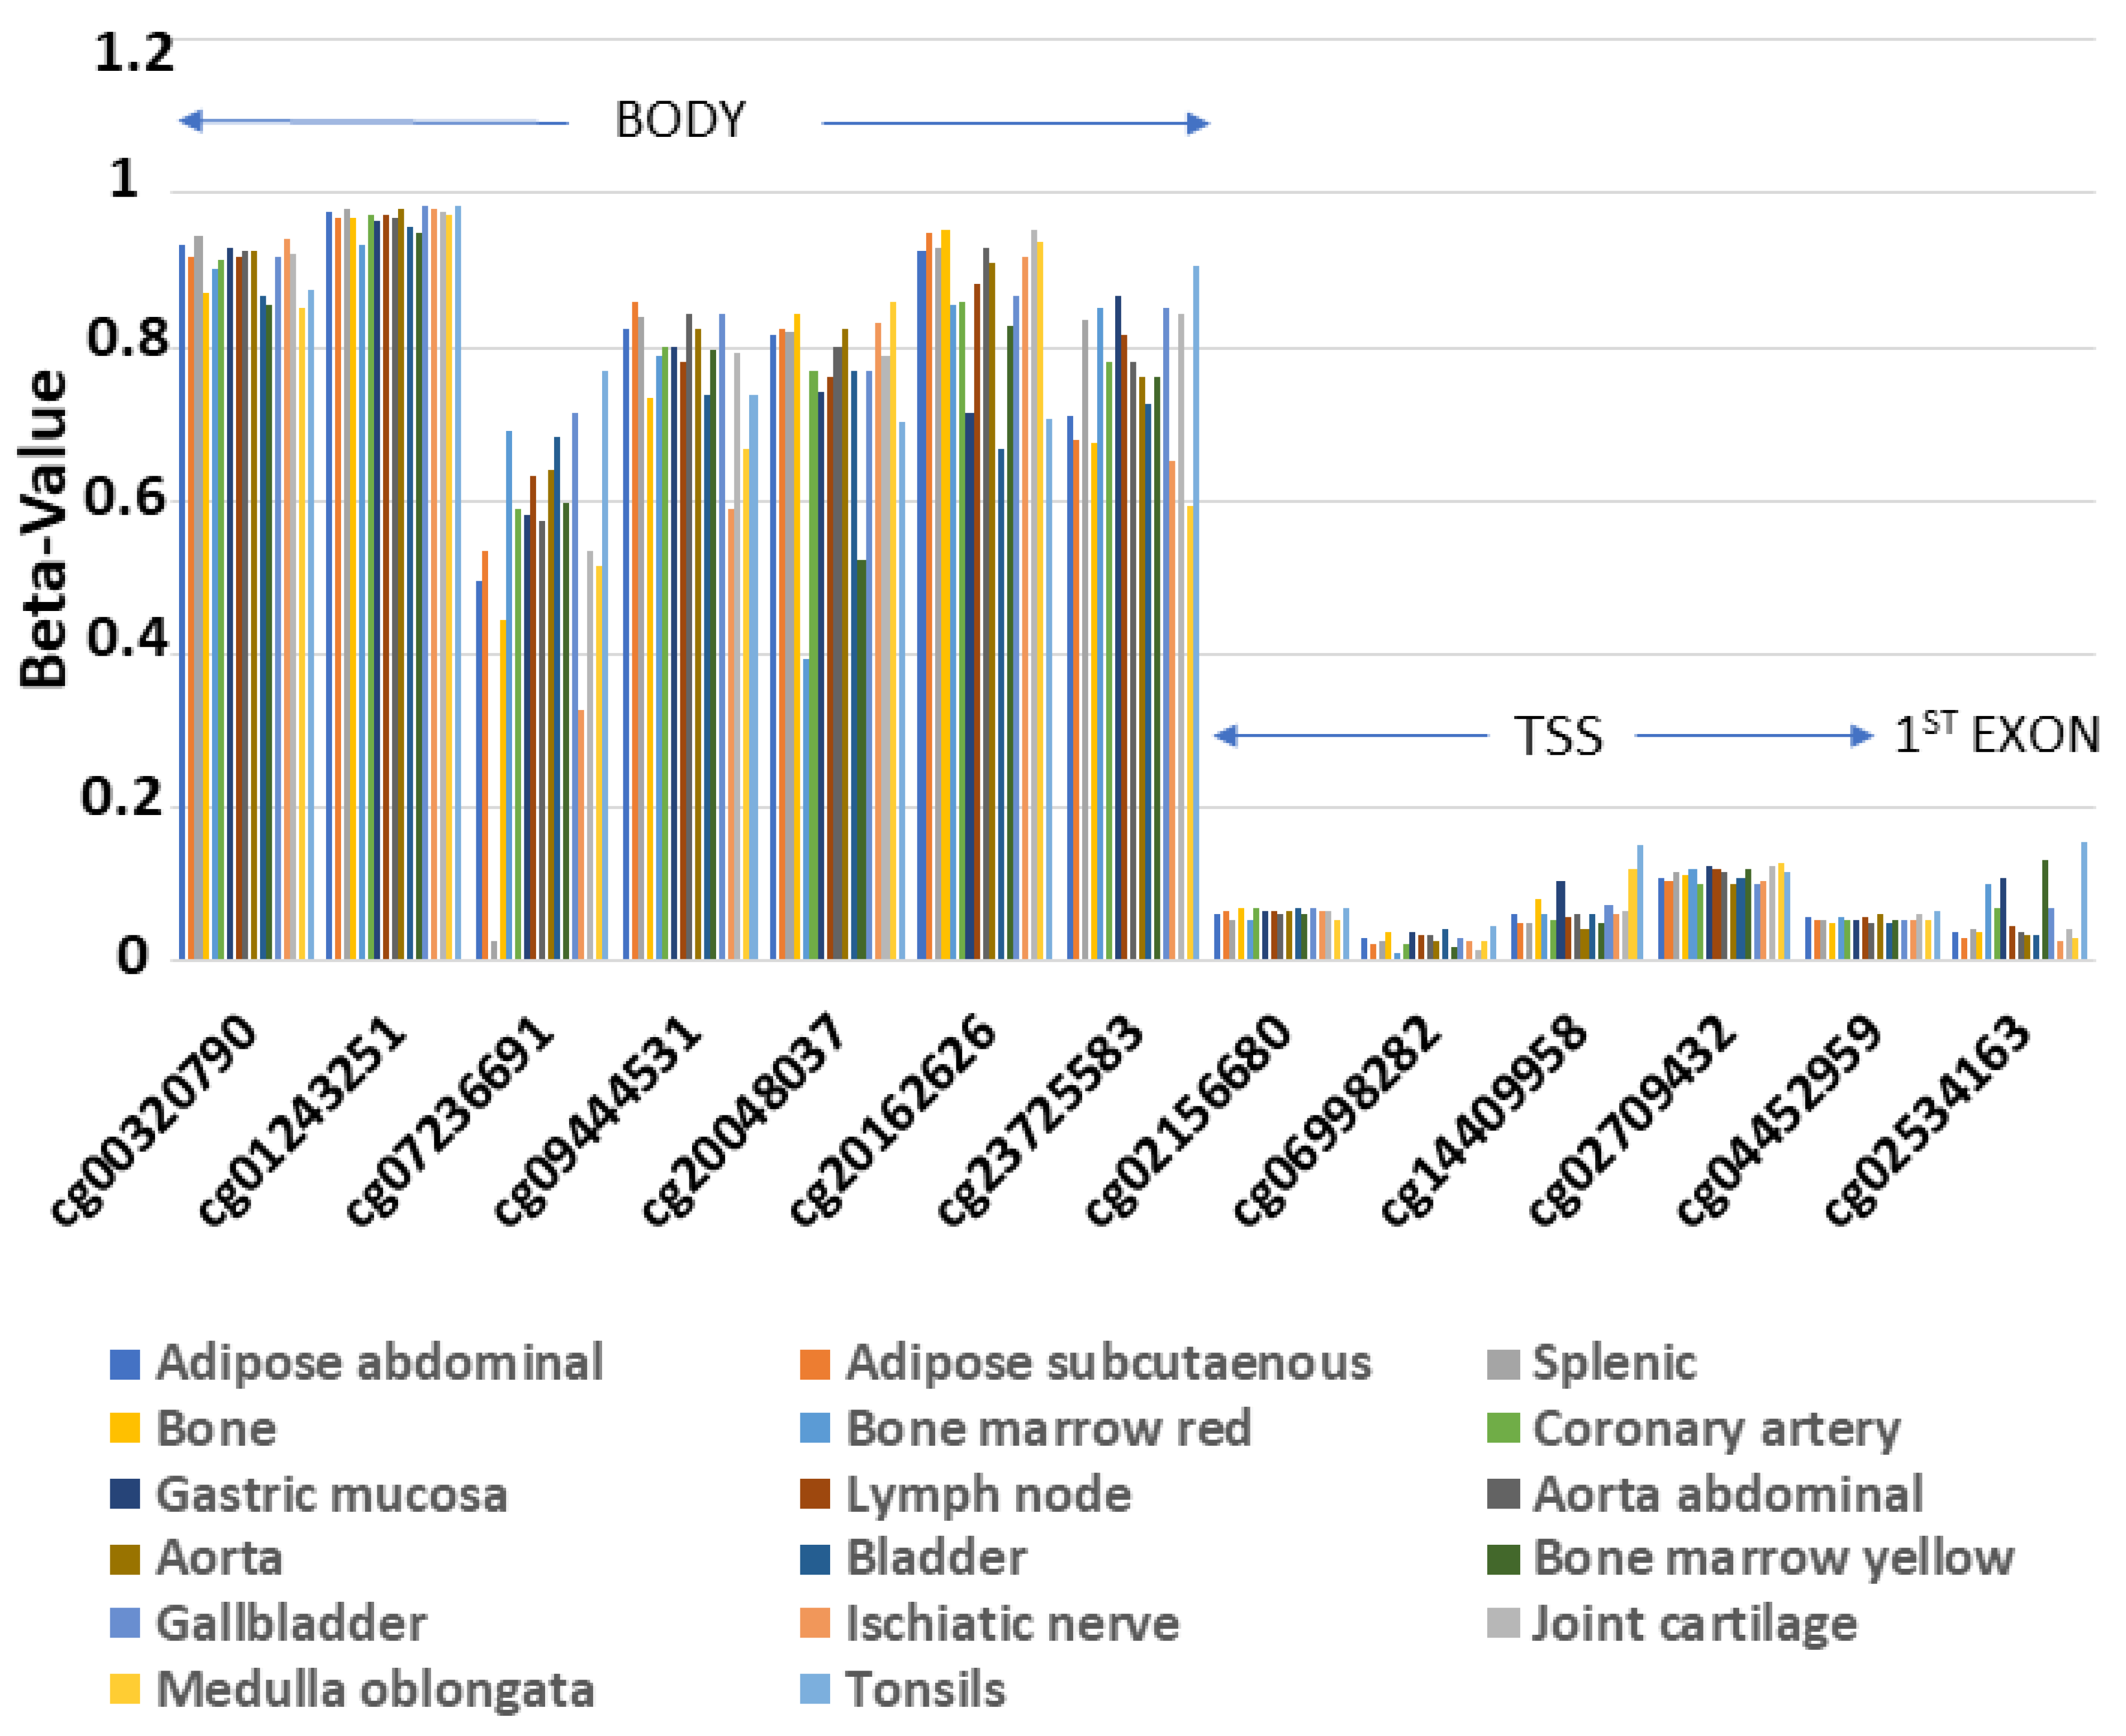
In order to examine the methylation profile of ENPP2 across different human healthy tissues, we analyzed methylome data from 17 healthy tissues included in the GSE50192 study. We observed a consistent methylation pattern across all studied tissues (Figure 2), with methylation being increased in all 7 CGs in the gene body region and decreased in 5 CGs in the Transcription Start Site (TSS) and 1 in the 1st exon.

Figure 2.
Similar methylation pattern of ENPP2 across 17 healthy tissues. Gene body region presents higher methylation levels in relation to TSS or 1st exon. Abbreviations: TSS = Transcription Start Site.
3.3. ENPP2 Methylation in Tissues from Cancer Patients
In order to unravel aberrant ENPP2 methylation in cancer, we compared methylomes of malignant vs. respective benign tissues from 7 different cancer types, using 10 GEO datasets (GSE113017, GSE113019, GSE120878, GSE27130, GSE63704, GSE76938, GSE98534, GSE46306, GSE134772, GSE97686) (Table 1). In total, 13 DMCs were identified in 5 cancers, i.e., HCC (12 DMCs), PC (10 DMCs), LC (9 DMCs), melanoma (7 DMCs), CRC (1 DMC) (Table 2), most of which were common between them (Table 3), whereas no DMCs were identified in Precancerous Interepithelial Cervical Neoplasia (CIN) and Cancer (CC) and in Gastric Cancer (GC). With two exceptions, all gene body DMCs showed decreased methylation in cancer in relation to their controls. Most importantly, all CGs located in the promoter-associated region and the 1st exon, regions known to hold an important role in transcriptional regulation [38,40] were DMCs across different cancer types, all presenting increased methylation. These results demonstrate aberrant methylation of ENPP2 in the majority of cancer types studied, following a specific pattern pointing to down-regulation of expression.
Table 2.
DMCs presenting higher or lower methylation in cancer in relation to corresponding control, identified via in silico analysis in ENPP2.
Table 3.
Common DMCs across different cancer types, located at TSS or 1st exon, all presenting upregulation of methylation in relation to respective benign controls.
3.4. ENPP2 Methylation Was Correlated to Aggressiveness in Cancer Cell Lines
In order to study any relation of ENPP2 methylation to cancer aggressiveness, we compared cell lines from hepatocellular and prostate cancer presenting a more (SKHEP1 and PC3 respectively) or less (HEPG2 and LNCAP respectively) invasive phenotype, using the GSE71627 study dataset [33]. In total, 12 DMCs were identified (Table 4), 6 of which were common in both cancer types. All 8 DMCs identified in HCC cell lines were also found in the liver tumor methylomes, whereas the common DMCs between prostate tissues and cell lines were 6/8. With two exceptions, all DMCs across the whole gene (1st exon, TSS, body) showed higher methylation in the more aggressive hepatocellular and prostate cell lines. These observations suggest an involvement of ENPP2 methylation in cancer aggressiveness.
Table 4.
DMCs of ENPP2 identified by comparing HCC and PC cell lines with a more (SKHEP1 and PC3 respectively) to less (HEPG2 and LNCAP respectively) invasive phenotype (GSE71627 dataset).
Interestingly, treatment of colon cancer cell lines with the DNA methylation inhibitor 5-aza-2′-deoxycytidine (GSE51815 study) caused a decrease of methylation in all 14 DMCs located throughout ENPP2 (Supplementary Table S1), implying that methylation could present a potential therapeutic target to reverse the aggressive phenotype.
3.5. In Silico Analysis of TF Binding on the ENPP2 Promoter
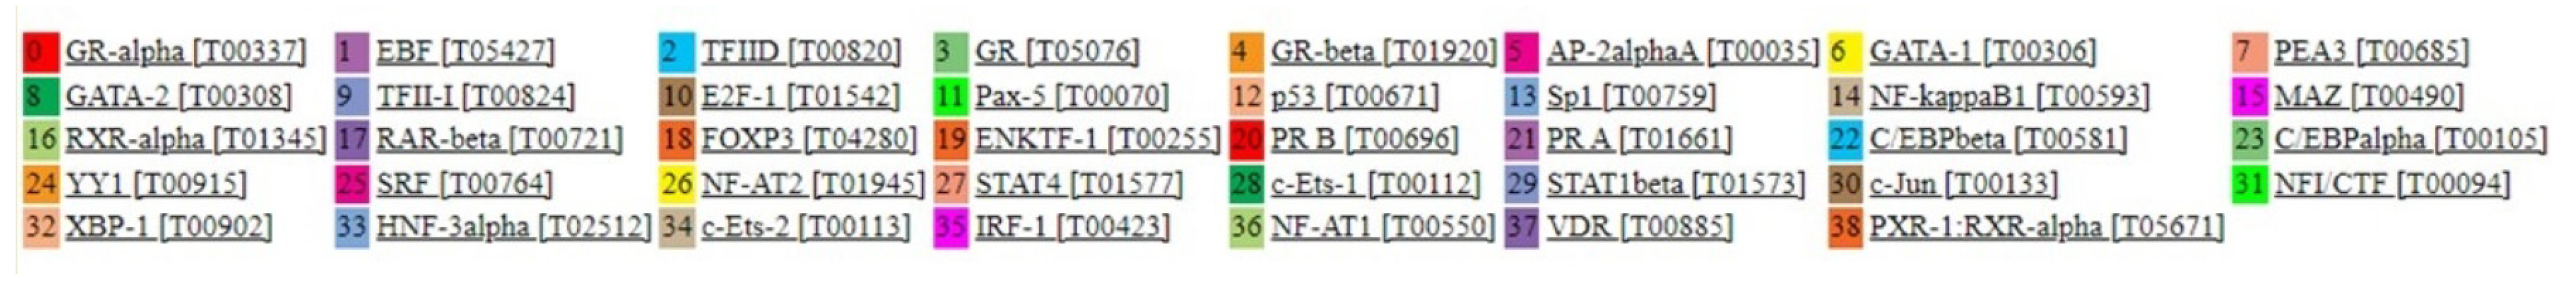
Regulation of gene expression via DNA methylation occurs mainly by disturbing TF and RNA polymerase binding to sites known to be necessary for initiation of transcription [41]. To support that the identified DMCs on ENPP2 may actually play a role in regulating ATX expression, we examined if they are located within TF binding promoter regions that could initiate transcription. Analysis using the PROMO tool predicted 39 putative TFs that could bind to the ENPP2 promoter (Figure 3), 4 of them (TFIID, GR, GR-beta, C/EBPbeta) on or in proximity to cg04452959, 7 TFs (TFII-I, GR-alpha, GATA-1, E2F-1, Pax-5, p53, Sp1) in cg02709432, 7 TFs (C/EBPbeta, C/EBPalpha, Pax-5, p53, ENKTF-1, YY1, GR-beta) in cg02156680 and 3 TFs (PEA3, GATA-1, XBP-1) in cg06998282. Interestingly, those 4 CGs located 200 nucleotides upstream of and up to the TSS (TSS200) (first 2), or 200 to 1500 nucleotides upstream of the TSS (TSS1500) (last 2) were identified as DMCs in most of the malignancies examined and between more and less aggressive cell lines. Collectively, these findings show that DMCs identified in the ENPP2 promoter in cancer are found in sites significant for TF binding, and therefore, altered methylation is likely to affect transcription and expression of ATX.

Figure 3.
39 Transcription factors that can bind to the ENPP2 promoter in sites containing DMSs identified in cancer, with a dissimilarity margin ≤ 15%.
3.6. ENPP2 Methylation and Expression Analysis from TCGA Datasets
An important objective of our study was to address if and how aberrant methylation of ENPP2 is related to alterations in gene expression. Based on our findings, three cancer entities presenting the highest number of DMCs were selected for further study, in order to confirm altered ENPP2 methylation in larger cohorts and correlate them with expression at gene and isoform levels. For this purpose, several available datasets including PC, LC and HCC readings of mRNA expression (gene and isoforms) and methylation along with the available clinical and demographic data were downloaded from TCGA.
3.7. ENPP2 Methylation and Expression Analysis in Prostate Cancer
Comparisons were performed between 235 prostate adenocarcinoma tumors and 35 healthy prostate tissues (Table 5). In general, results confirmed those from the GEO datasets. In total, 12 DMCs were identified between cancer and control tissues (5 in TSS, 1 in 1st exon and 6 in the gene body), 10 of which were common to those found in the GSE76938 dataset. All DMCs in TSS and the 1st exon presented increased methylation in PC in relation to controls, whereas decreased methylation was noticed in 3 out of 6 DMCs in the gene body area. Following this, we examined correlation of DMCs to clinicopathological patient characteristics, to reveal associations with prognosis. Methylation analysis in relation to available patient data (age, race, nodal status, relapse, tumor size and treatment response) showed a significant correlation with tumor size, as increased methylation of 3 CGs, namely, cg02534163 (1st exon), cg02709432 (TSS200) and cg23725583 (gene body), was found in larger tumors in relation to smaller tumors (p = 0.032). Furthermore, non-response to pharmacotherapy was correlated with increased methylation of cg01243251 in the gene body region (p = 0.023). No other correlations were found in relation to age, race, nodal status and the event of relapse.
Table 5.
Differential methylation and expression analysis of ENPP2 between normal prostate and PC tumors from TCGA cases.
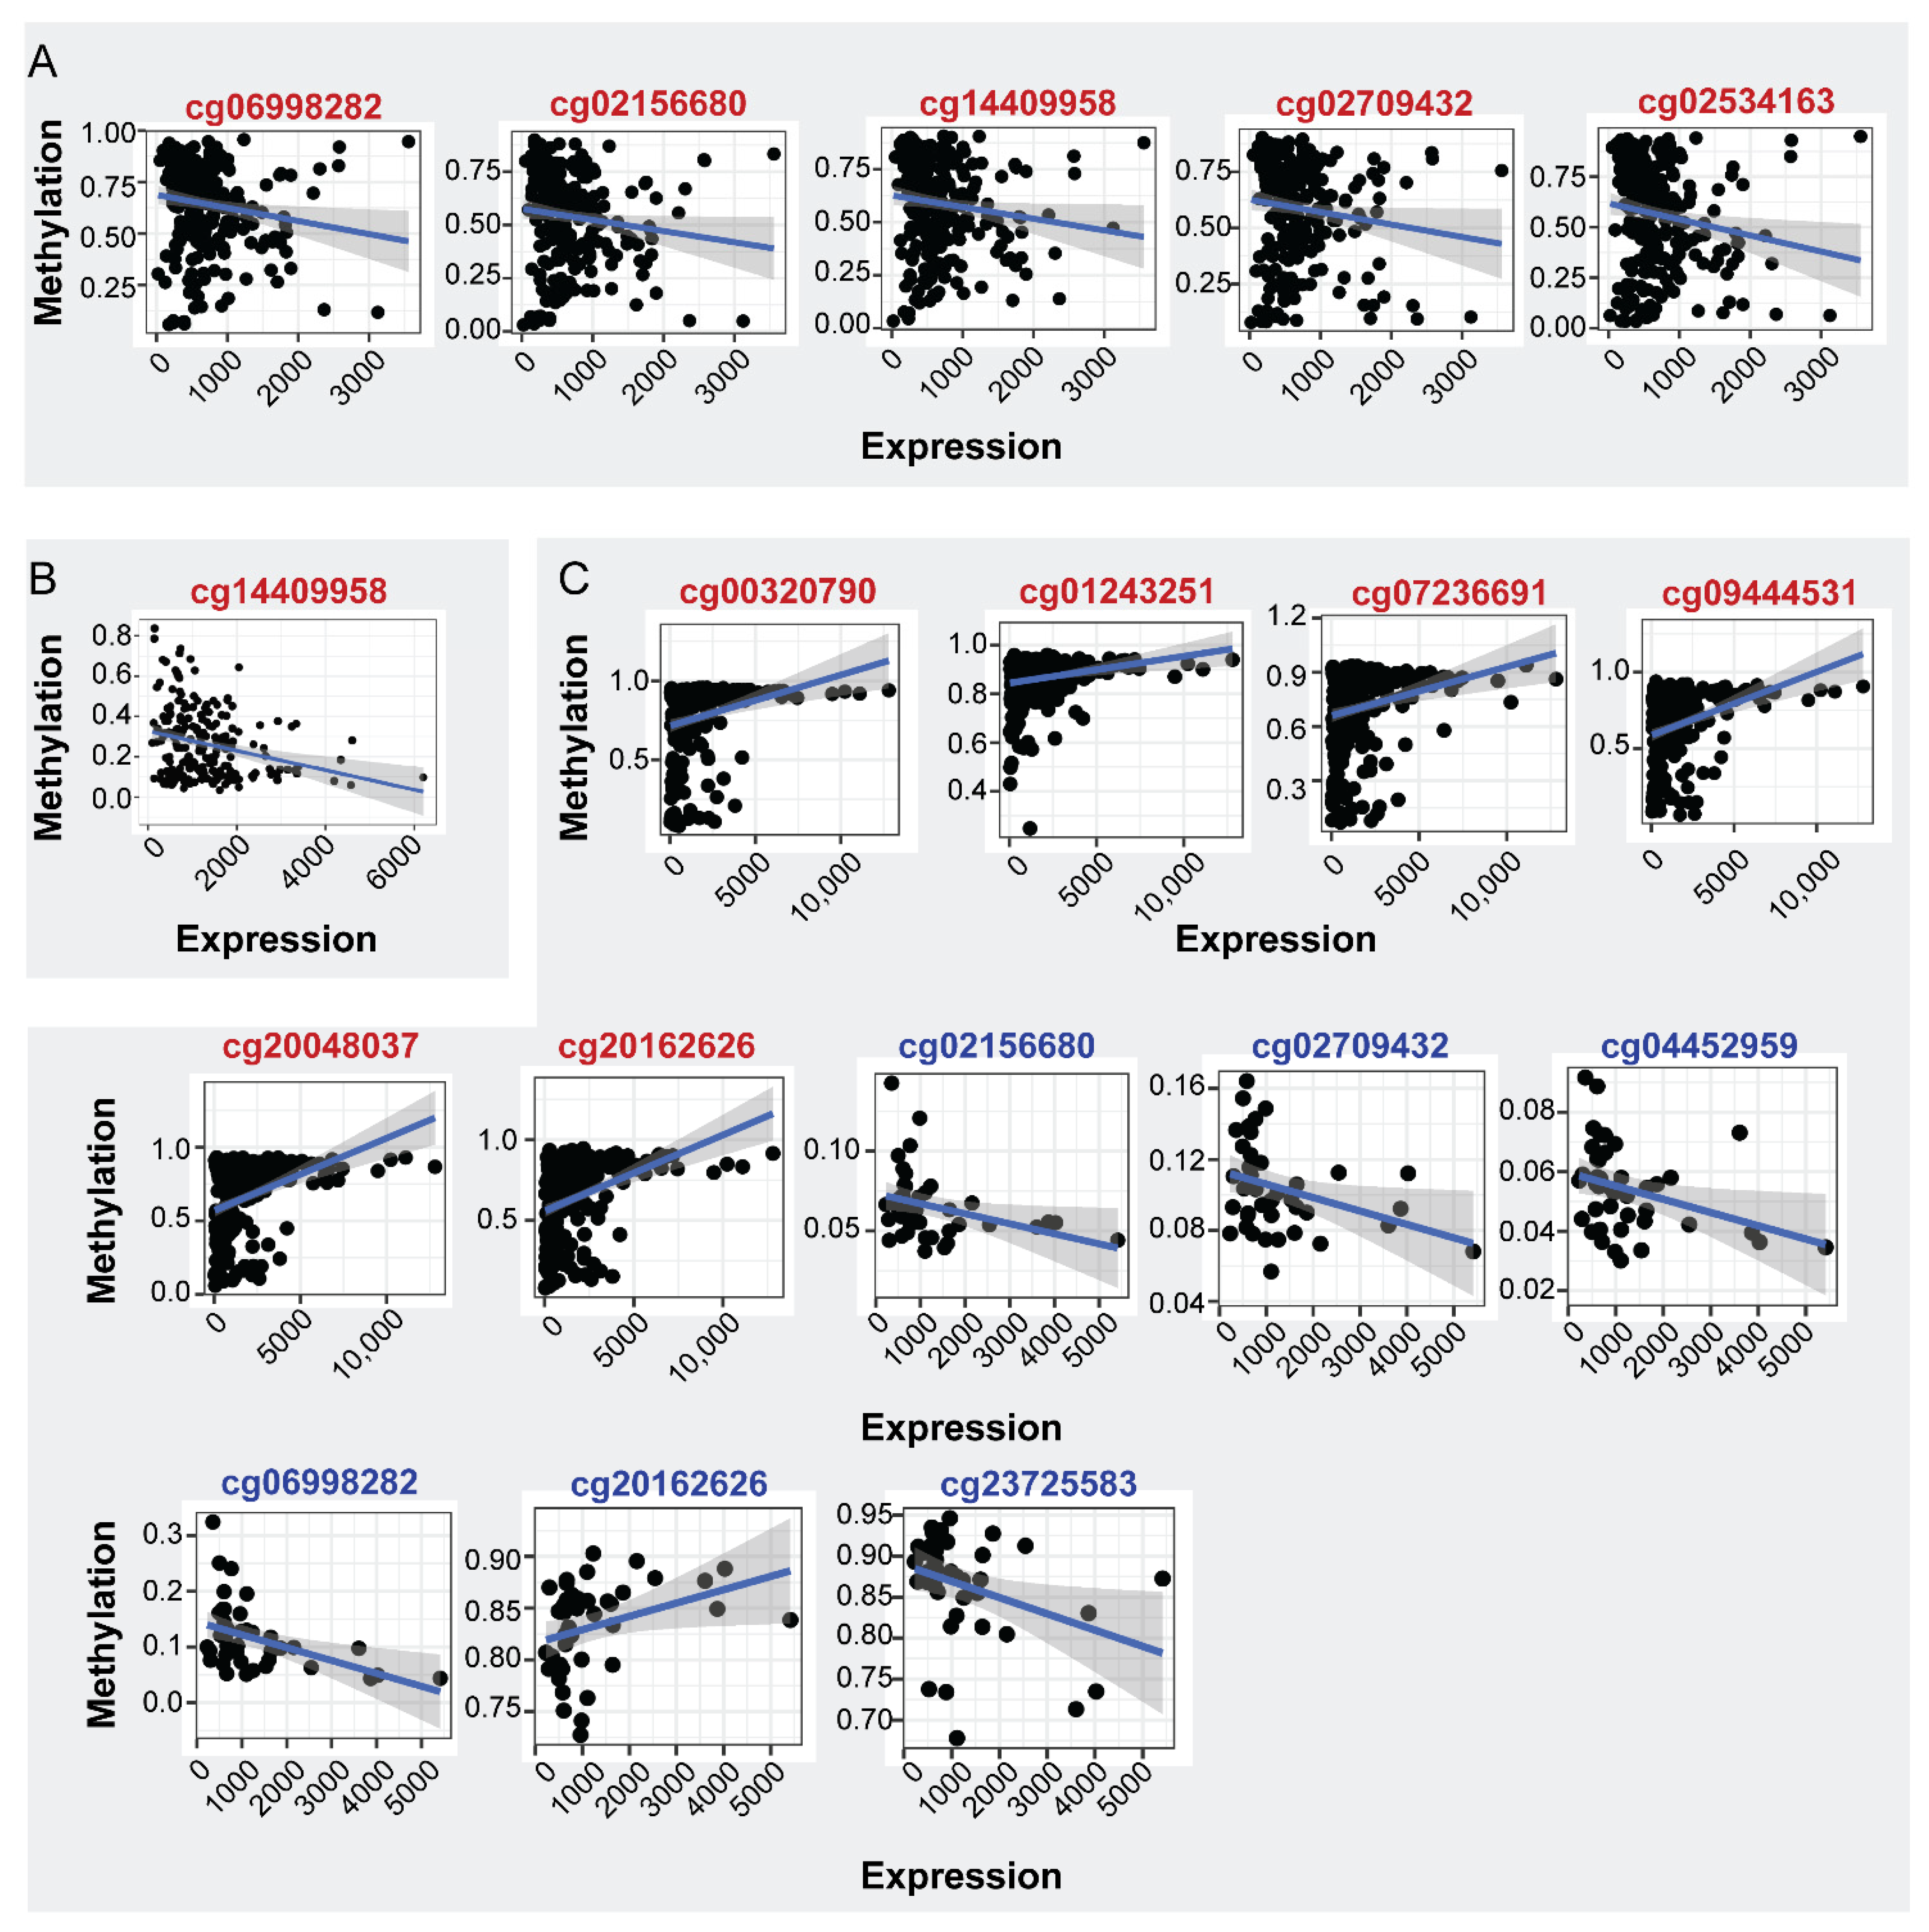
mRNA expression analysis in the same samples showed decreased levels in PC in relation to normal tissues (LogFC: −0.379, FDR: 3.70 × 10⁻²), indicating that the increased methylation of ENPP2 in PA regions is correlated with the decreased expression of ENPP2 in PC. Spearman correlation of mRNA ENPP2 expression (at gene and isoform level) per CG site revealed statistically significant correlations shown in Figure 4A and Table 6. Between gene body CGs, a tendency towards positive correlation of mRNA expression to cg01243251 and cg20162626 methylation was observed and a negative to cg07236691. TSS CG sites cg02156680, cg02709432, cg06998282, cg14409958 and 1st exon cg02534163 methylation showed a negative correlation with expression, showing that the increased methylation at these regions is associated with decreased expression. Interestingly, although Spearman’s coefficient is relatively small for TSS and 1st exon CGs, successful fit of a linear model further supports the existence of an expression-methylation relationship (Table 6, coefficient p-value column). No significant correlations emerged between ENPP2 expression and methylation in control prostate tissue.

Figure 4.
Correlation of ENPP2 CGs methylation and mRNA expression. CGs showing significant correlations are depicted (p < 0.05). (A) Expression-methylation scatter plots of CG sites of PC and normal samples, (B) expression-methylation scatter plots of CG sites of LC and normal samples, (C) expression-methylation scatter plots of CG sites of HCC and normal samples. Correlations from cancer and healthy samples are marked in red and blue CG color font, respectively.
Table 6.
Spearman correlation coefficient between ENPP2 CG methylation and mRNA expression (p < 0.05) for PC, LC and HCC samples, showing mainly a negative correlation with PA CG methylation and in most cases a positive correlation with gene body methylation.
In order to unfold the impact of CG methylation on ENPP2 isoform expression [12,42], we downloaded mRNA expression data from ENPP2 isoforms, i.e., isoform alpha (uc003yos.1), isoform beta (uc003yor.1 and uc003yot.1) and isoform gamma (uc010mdd.1). Uc003yot.1, uc003yos.1 and uc003yor.1 isoform expression showed statistically significant correlation with the methylation of several CGs. In specific, although they were all characterized by small effect sizes, uc003yor.1 expression is linearly related to the methylation levels of TSS and 1st exon CGs cg02156680, cg06998282, cg14409958 and cg02534163, respectively, further strengthening the observed correlation (Supplementary Figure S1 and Table S2). Finally, no relation emerged between expression of any of the ENPP2 isoforms and methylation of CGs in healthy prostate samples, consistent with the observations at the gene level.
3.8. ENPP2 Methylation and Expression Analysis in Lung Cancer
Analysis was performed between 212 LC adenocarcinoma tumors and 15 healthy lung tissues, and results presenting statistically significant correlations are shown in Table 7. Findings confirmed those from the GEO datasets. Eight DMCs were identified between cancer and control tissues (3 in the TSS, 1 in the 1st exon, 4 in the gene body) and 6 of them were common to those found in the GSE76938 dataset. DMCs of ENPP2 showed upregulation of methylation in TSS (cg04452959, cg06998282, cg14409958) and the 1st exon (cg02534163) and downregulation in the gene body (cg07236691, cg09444531, cg20048037, cg20162626). Methylation was also correlated to the available clinicopathological characteristics of LC and normal lung tissue samples (gender, age, nodal status, distance metastasis, relapse, tumor size and treatment response and stage). In LC samples, increased methylation of cg14409958 (TSS) was significantly correlated with advanced cancer stage (p = 0.035).
Table 7.
Differential methylation and expression analysis of ENPP2 between normal lung and LC tumors from TCGA cases.
Differential mRNA expression analysis in the same samples showed decreased levels in LC in relation to normal tissues (LogFC: 1.285, FDR: < 1.00 × 10⁻²) similarly to PC, indicating that in cancer the increased methylation of PA CGs is correlated to decreased autotaxin expression. The impact of ENPP2 methylation on its expression was examined in LC and healthy lung tissue samples. Spearman correlation of mRNA expression per CG resulted in a single statistically significant correlation (Figure 4B and Table 6). A reverse correlation was noticed between methylation of cg14409958 (TSS) and mRNA expression, suggesting again the DNA methylation role in repressing expression. Fit of a linear model once again reinforced the observed correlation. On the other hand, control samples did not show any statistically significant correlation after p-value correction, and only the methylation of body site cg7236691 showed a significant correlation coefficient along with a linear relationship to ENPP2 expression levels. Last, no significant correlations were witnessed between methylation and expression levels of all isoforms examined, yet large rho values and significant linear model fit propose the existence of such a relationship.
3.9. ENPP2 Methylation and Expression Analysis in Hepatocellular Carcinoma
Analysis was performed between 241 HCC tumors and 42 control liver tissues. Statistically significant correlations are presented in Table 8. In total, 13 DMCs were identified between cancer and control (5 in the TSS, 1 in the 1st exon, 7 in the gene body) and 12 were common to those found in GSE113017 and GSE113019. Again, downregulation of methylation was noticed in all gene body CGs (cg00320790, cg23725583 and cg01243251) and upregulation of methylation in all TSS and 1st exon related CGs (cg02156680, cg02534163, cg02709432, cg04452959, cg06998282 and cg14409958) in HCC.
Table 8.
Differential methylation and expression analysis of ENPP2 between normal liver and HCC tumors from TCGA cases.
Methylation of ENPP2 was also correlated to available clinical and demographic characteristics of the HCC cohort. Interestingly, in the tumor samples, increased methylation of the majority of the ENPP2 CGs (cg00320790, cg01243251, cg02156680, cg02709432, cg07236691, cg09444531, cg14409958, cg20048037, cg20162626, cg23725583) (all p < 0.05) was noticed in women in relation to men. In addition, a negative correlation was found between age and methylation of cg00320790, cg01243251, cg07236691, cg09444531, cg20048037, cg20162626 and cg23725583 (all p < 0.001), i.e., younger people presented increased methylation in relation to older. Finally, increased methylation of cg04452959 was correlated to tumors with macro invasion in relation to those with no or micro invasion (p = 0.044). No correlation was noticed between methylation and BMI, hepatic inflammation, Ishak fibrosis, relapse, family history, grade, stage or tumor size. Analysis in normal samples showed a gender correlation only for one CG (cg20048037) which presented increased methylation in females (p = 0.033) in relation to males. Negative correlation was also noticed between cg01243251 methylation and age (p = 0.037). Finally, no relationship was found between BMI and ENPP2 methylation in normal samples.
mRNA expression analysis in the same samples showed increased levels in HCC in relation to normal tissues (LogFC: 0.710, FDR: 1.00 × 10⁻²), i.e., the opposite of LC and PC observations, suggesting a methylation-independent and a cancer type-specific regulation of ENPP2 in HCC. Spearman correlation of mRNA expression (at gene and isoform levels) per CG site revealed the most numerous statistically significant correlations, compared to PC and LC samples, shown in Figure 4C and Table 6. Between gene body CGs, a positive correlation of mRNA expression to cg00320790, cg01243251, cg07236691, cg09444531, cg20048037 and cg20162626 methylation was observed. Apart from the significant correlations established, methylation of the aforementioned CGs was characterized by a linear relationship to ENPP2 expression, further supporting dependence of the latter on the former. Control samples also showed positive correlation between ENPP2 mRNA expression and methylation of 2 gene body CGs (cg20048037, g20162626). Finally, cg23725583 of body and cg02709432, cg04452959, cg06998282 and cg02156680 of TSS regions showed negative correlation of methylation in relation to ENPP2 mRNA expression. Isoform analysis for the control tissues showed similar correlation patterns (Supplementary Figure S2 and Table S2).
3.10. ENPP2 Methylation, Expression and Survival Analysis via UALCAN
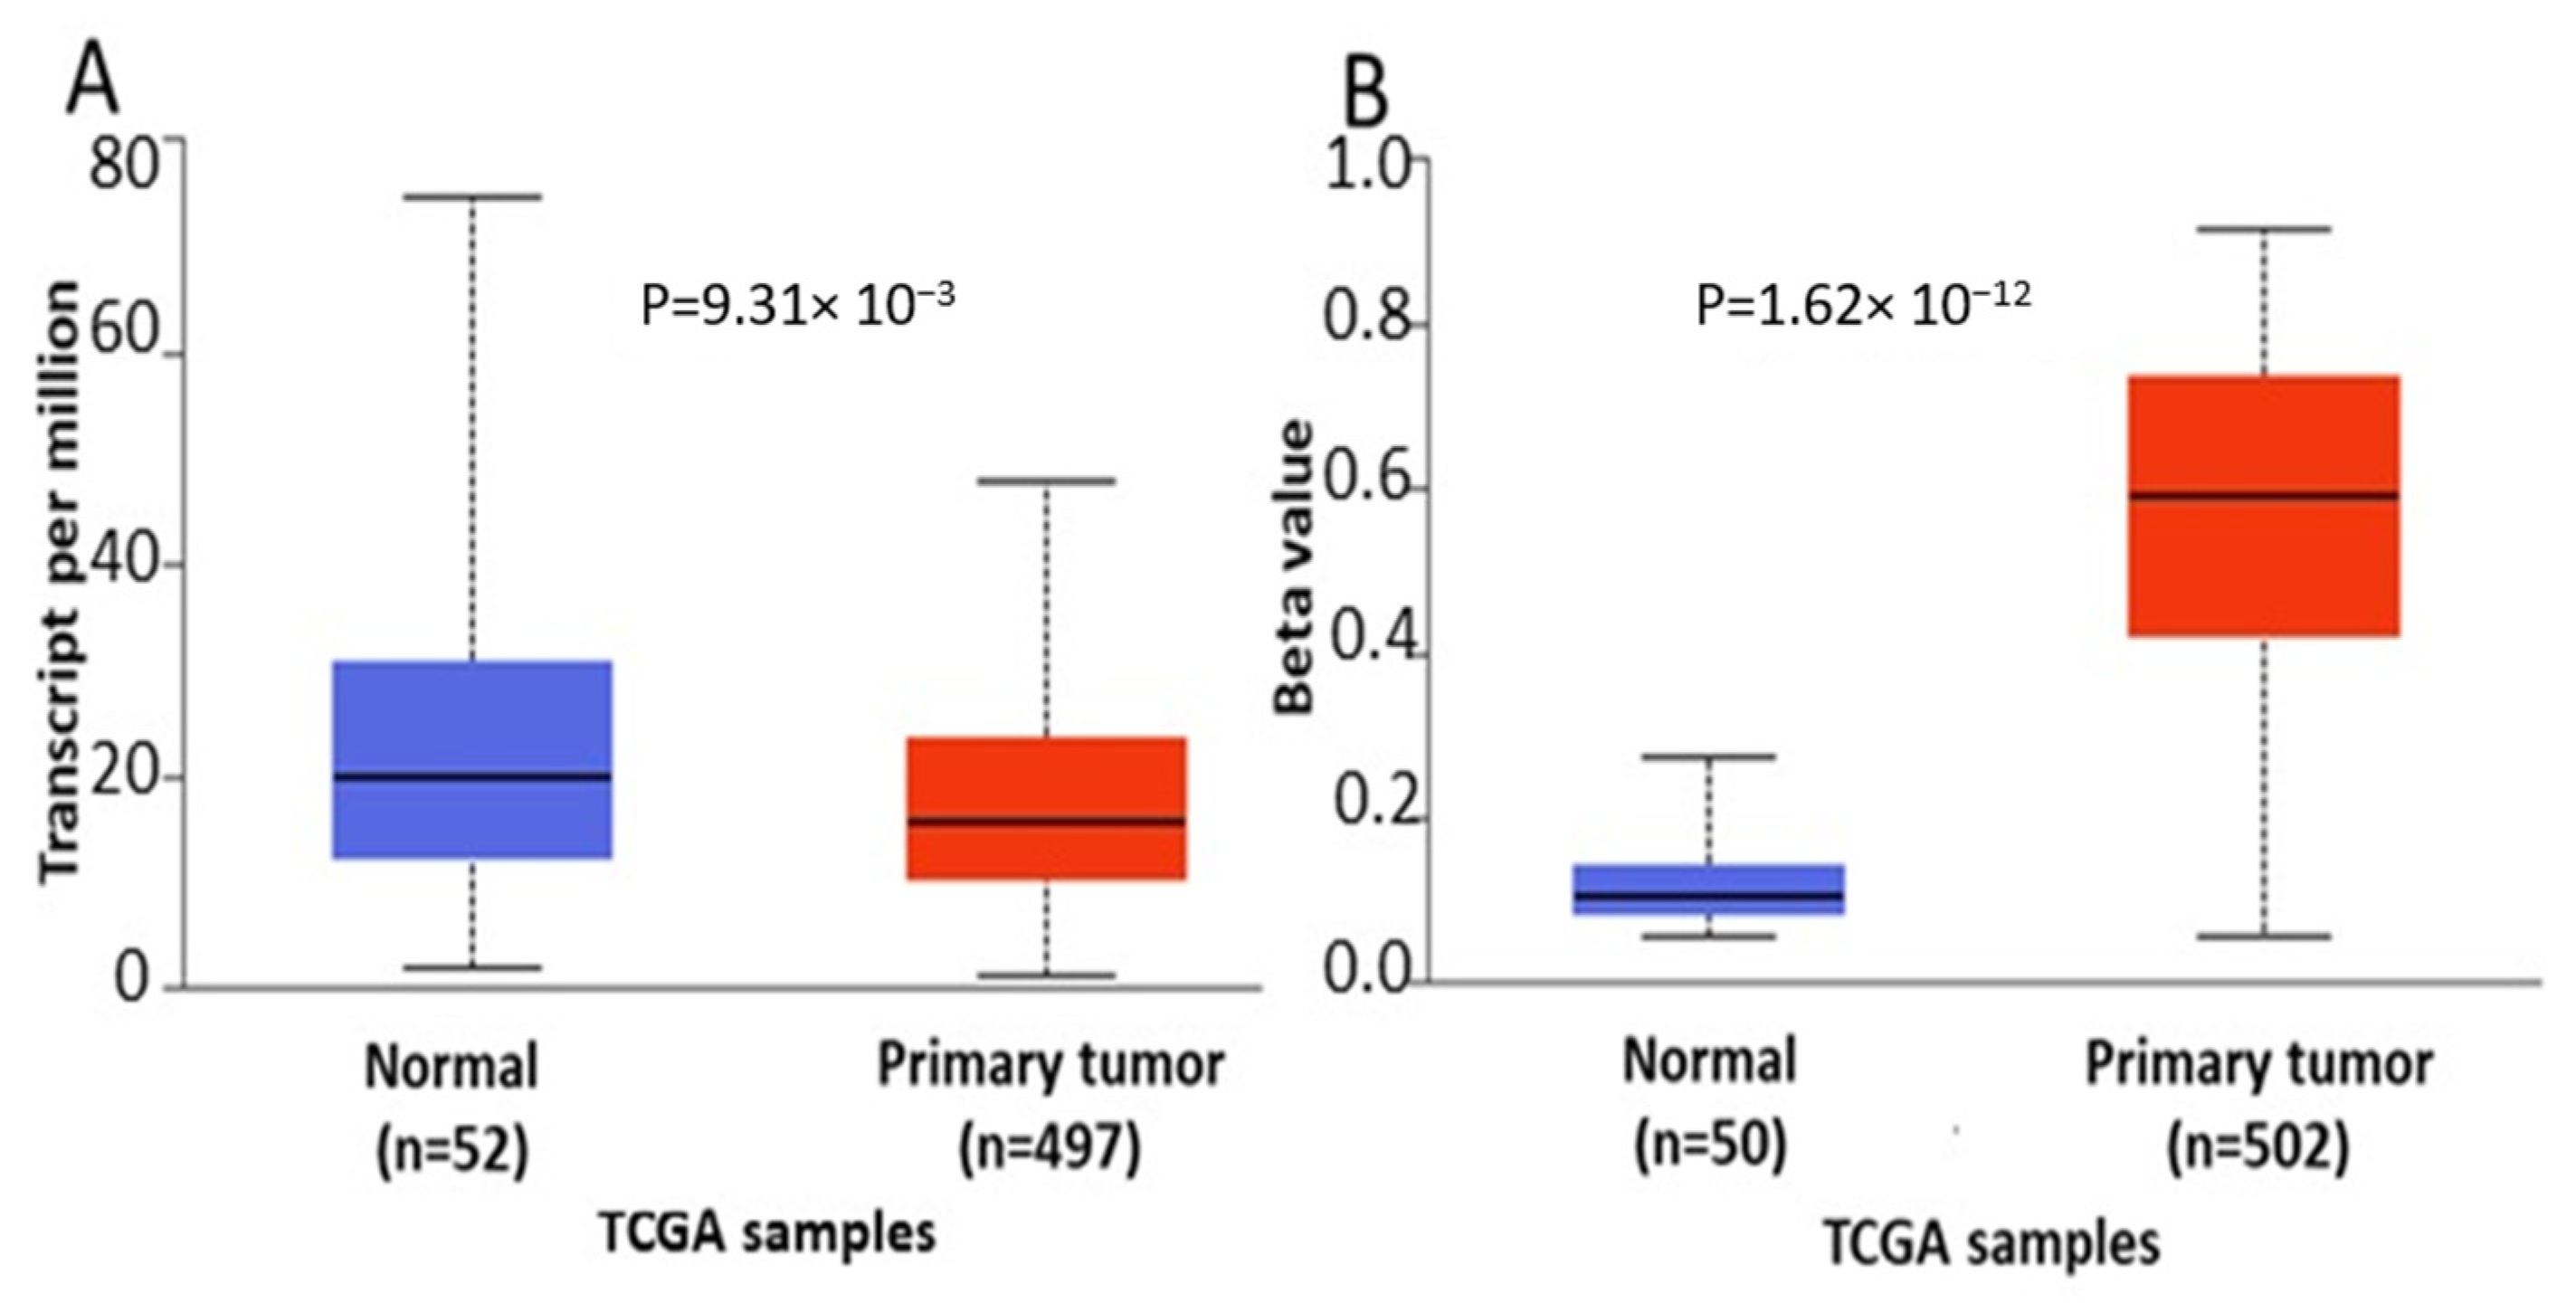
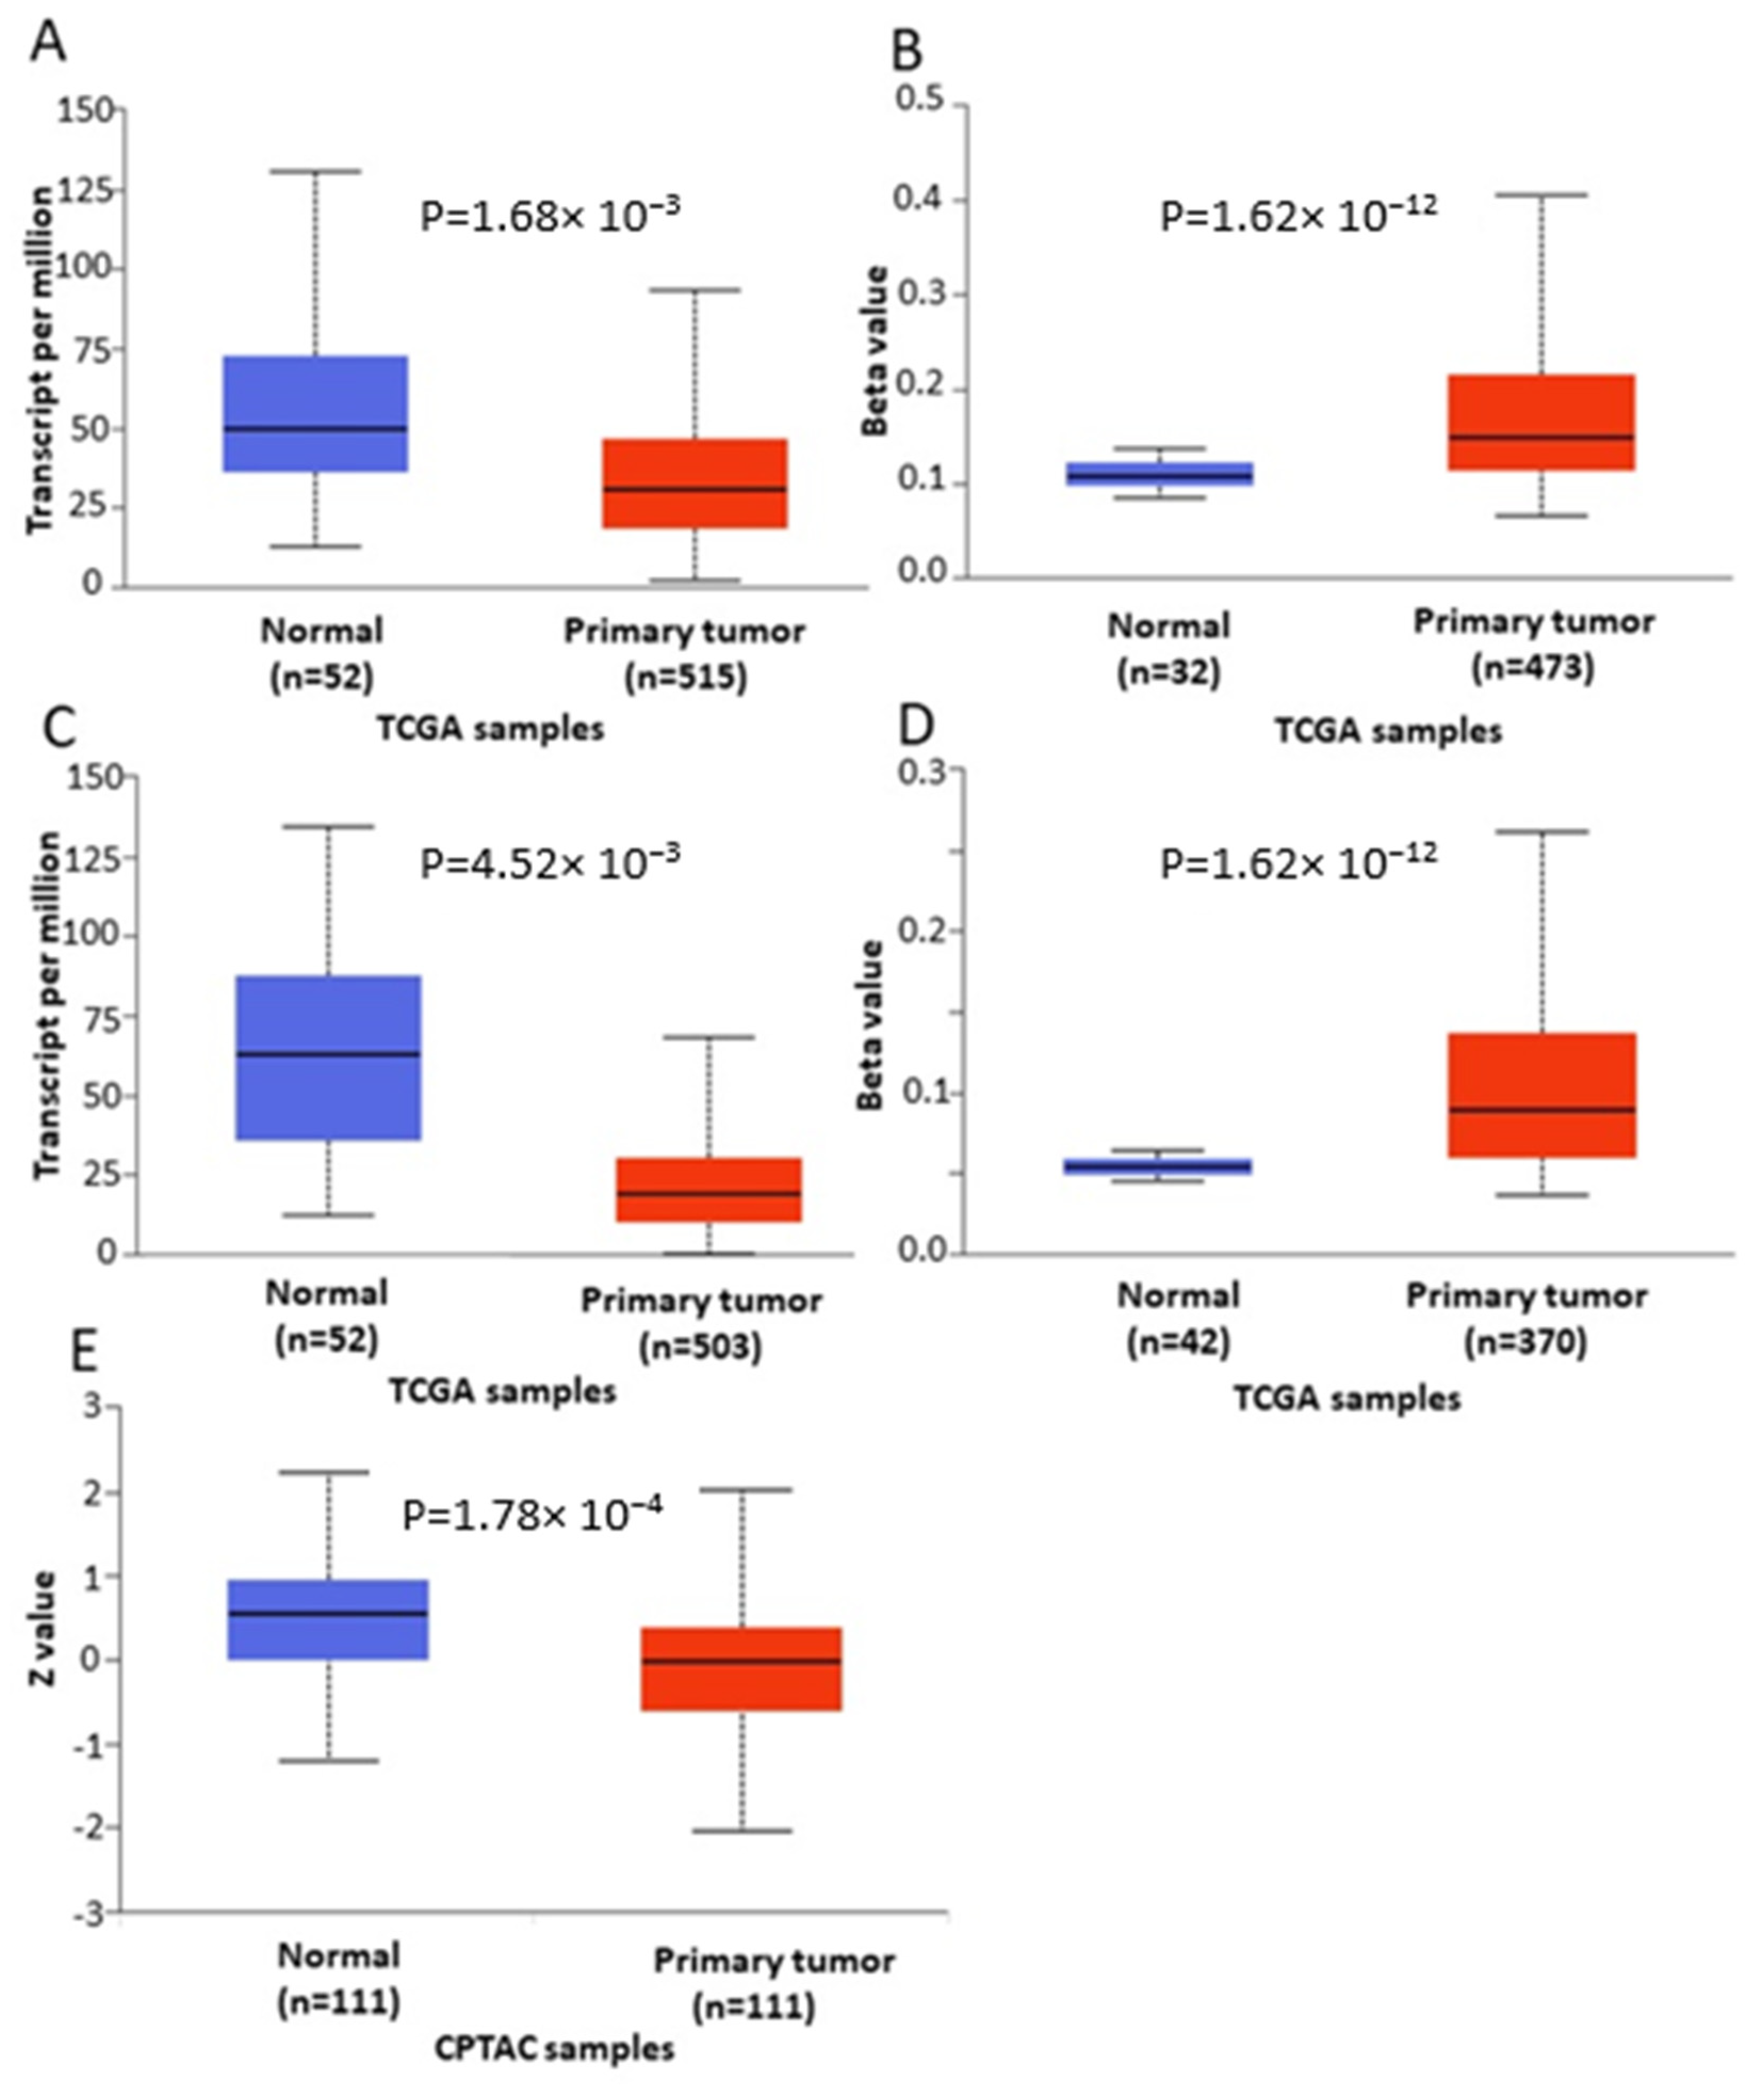
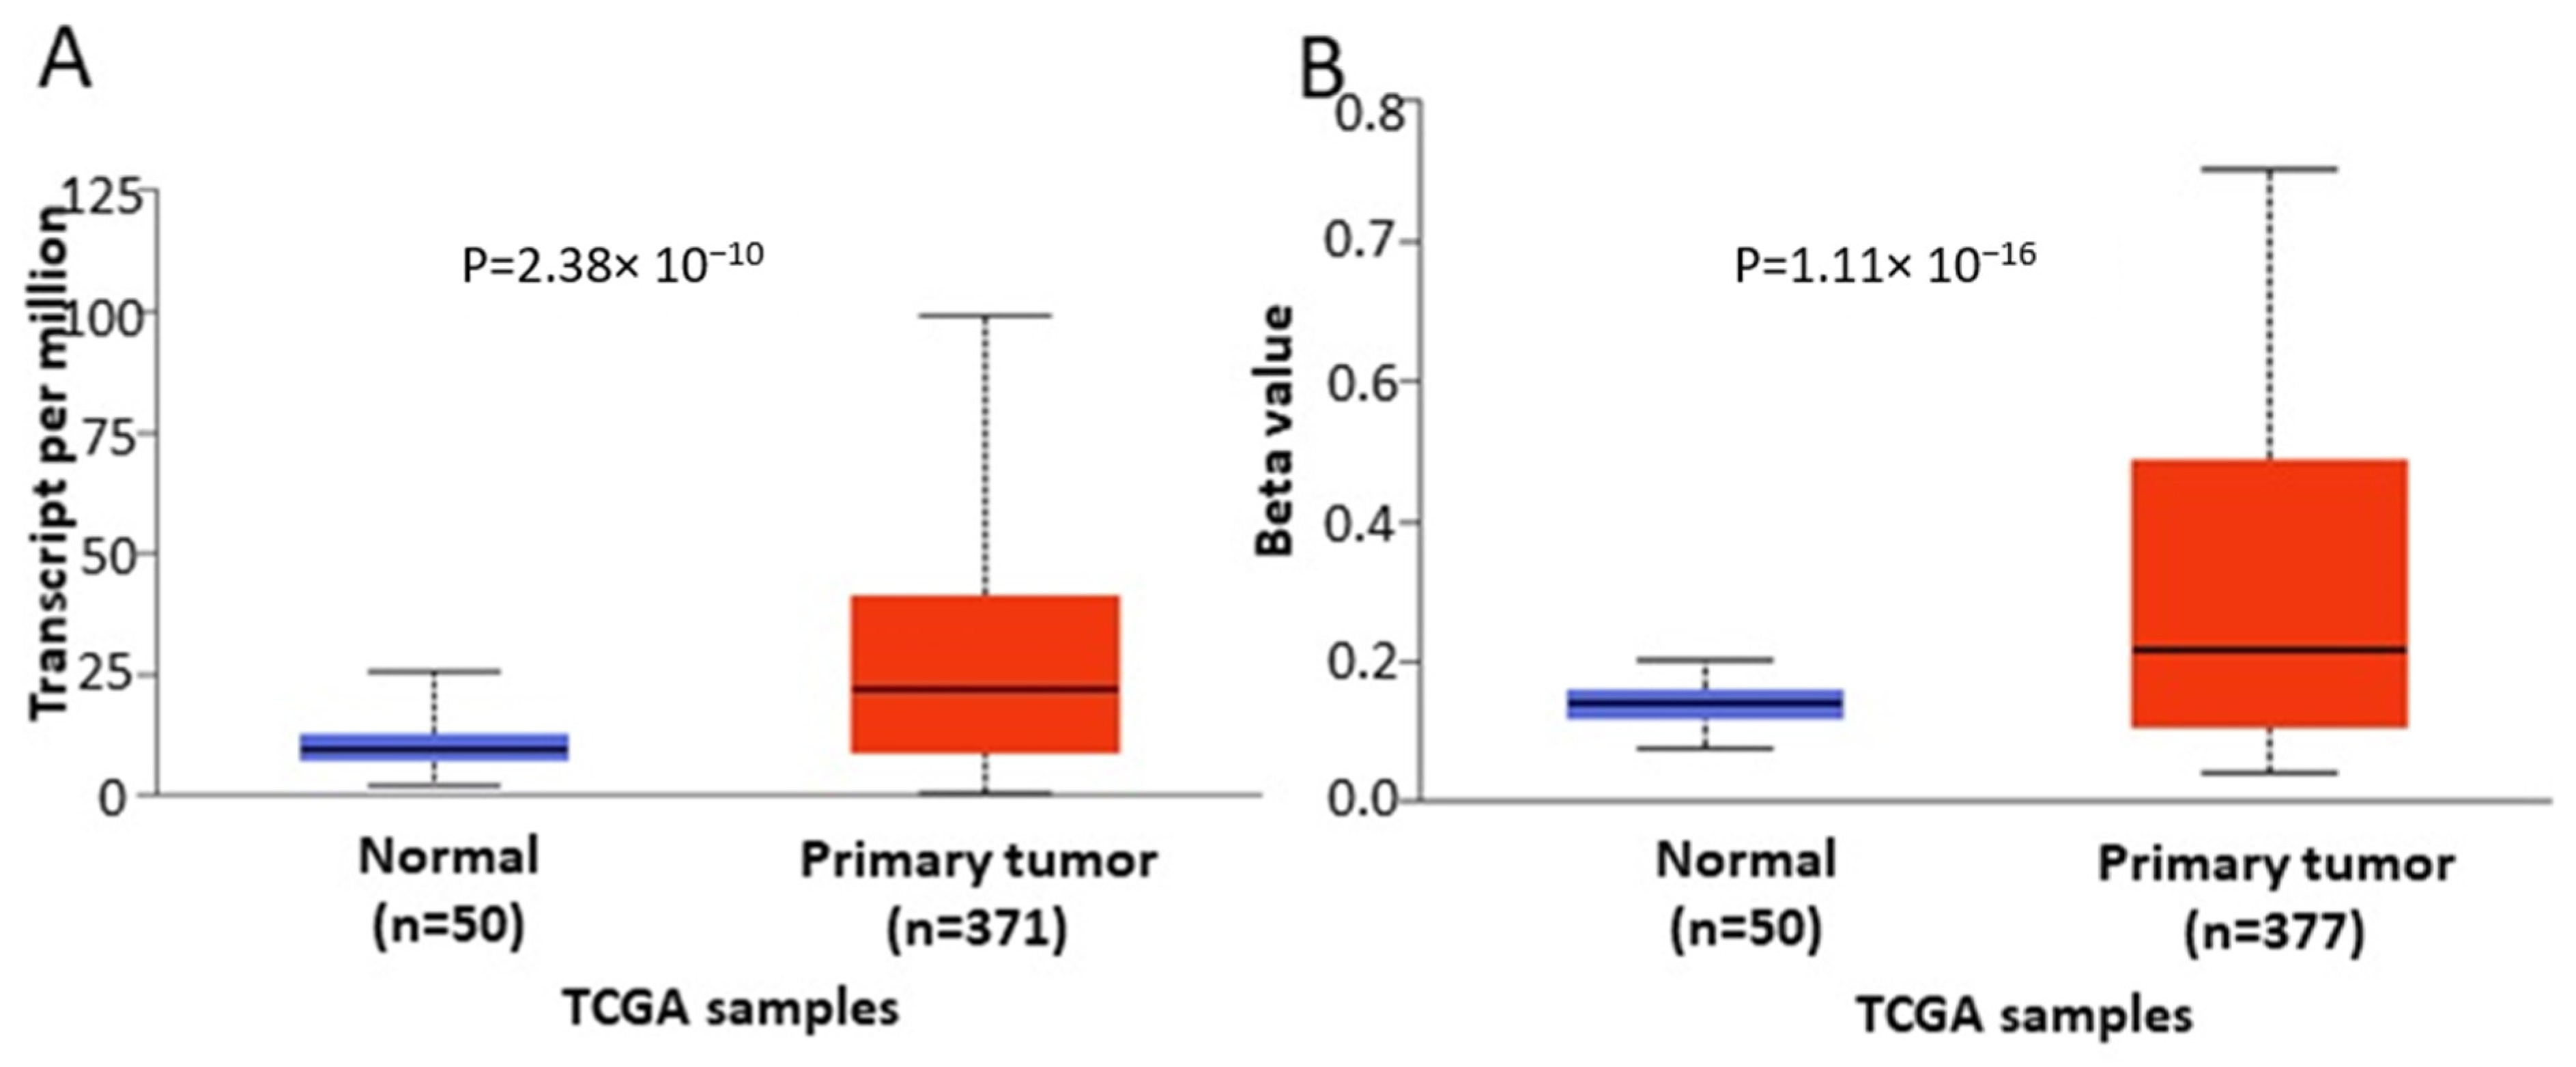
In order to further verify our findings, we conducted expression, methylation and survival analysis of ENPP2 in PC (all adenocarcinoma cases), LC (adenocarcinoma and squamous cell carcinoma cases) and HCC using the UALCAN database. Analysis confirmed the above results as ENPP2 mRNA was under-expressed in PC (p = 9.31 × 10⁻³, Figure 5A) and LC (adenocarcinoma, p = 1.68 × 10⁻³ and squamous cell carcinoma, p = 4.52 × 10⁻³, Figure 6A,C) and upregulated in HCC (p = 2.38 × 10⁻¹⁰, Figure 7A). Protein expression analysis was available only for LC adenocarcinoma cases, showing downregulation in primary tumor tissues in relation to normal tissues (Figure 6E, p = 1.78 × 10⁻⁴). Next, methylation analysis revealed upregulation in all cancer types in relation to normal tissues (PC, p = 1.62 × 10⁻¹², HCC, p = 1.11 × 10⁻¹⁶ and LC, p = 1.62 × 10⁻¹² for both types) as depicted in Figure 5, Figure 6 and Figure 7, in accordance with our previous observations. Methylation and expression results via UALCAN strengthen our findings, showing that the ENPP2 gene is methylated in LC, HCC and PC and this is related to under-expression in LC and PC, suggesting a causative relationship in these two cancer types and a cancer-specific regulatory mechanism in HCC. Finally, survival analysis did not reveal any statistical significance for any of the studied cancers, as depicted in Supplementary Figure S4A–D.

Figure 5.
Analysis of ENPP2 between primary PC tumors and normal tissues using the UALCAN database, concerning (A) mRNA expression and (B) DNA methylation. Abbreviations: TCGA: The Cancer Genome Atlas, PC: Prostate Cancer.

Figure 6.
Analysis of ENPP2 between primary LC tumors and normal tissues using the UALCAN database, concerning (A) mRNA expression and (B) DNA methylation of adenocarcinoma cases, (C) mRNA expression and (D) DNA methylation of squamous cell carcinoma and (E) protein expression of adenocarcinoma cases. Abbreviations: TCGA: The Cancer Genome Atlas, CPTAC: Clinical Proteomic Tumor Analysis Consortium, LC: Lung Cancer.

Figure 7.
Analysis of ENPP2 between primary HCC tumors and normal tissues using the UALCAN database, concerning (A) mRNA expression and (B) DNA methylation. Abbreviations: TCGA: The Cancer Genome Atlas, HCC: Hepatocellular Carcinoma.
4. Discussion
ATX encoded by ENPP2 is a secreted glycoprotein that forms LPA [42]. The ATX-LPA axis is related to many physiological processes, including embryonic development and wound healing. Dysregulation of ATX expression is connected with various pathological conditions such as cancer, inflammatory diseases and fibrosis [3,4,5]. The exact mechanism by which ENPP2 expression is regulated is still not fully understood, whereas recently, it has been proved that ENPP2 is prone to epigenetic alterations [13]. Still, very little information is available about its DNA methylation pattern and the consequent impact in gene expression in health and human pathology.
In the present study we adopted a bioinformatic in silico approach using publicly available datasets from healthy tissues and different cancer tissues and cell lines to analyze methylation patterns of ENPP2. Our analysis showed a consistent methylation pattern throughout the gene’s regions across human tissues, i.e., increased methylation in the gene body and decreased methylation in TSS and the 1st exon. Given the fact that ENPP2 is expressed in almost all tissues and biological fluids [12,43,44], we can postulate that the decreased methylation in the TSS and 1st exon is associated with the active transcription of the gene in most human tissues.
Analysis of cancer datasets revealed aberrant ENPP2 methylation, showing a malignant-specific profile throughout different cancer types. In general, methylation was increased in the TSS and 1st exon, regions known to hold an important role in gene expression, and decreased in the gene body region. A large number of DMCs were identified between malignant and respective benign tissues. Most importantly, all six DMCs of ENPP2 located at TSS in the promoter or at the 1st exon showed increased methylation across different cancer types, including HCC, melanoma, CRC, LC and PC. These results corroborate and expand recent observations showing a hypermethylated ENPP2 promoter in primary tumors of LC and squamous cell carcinoma patients [45] and in breast cancer [13,22,46].
Based on these interesting observations, we next performed in silico analysis of ENPP2 methylation in datasets retrieved from the TCGA, focusing on those cancer types presenting the greatest number of DMCs, i.e., LC, PC and HCC. TCGA datasets are generally larger compared to those of other research efforts, allowing comparisons of stronger statistical relevance, and most significantly, they contain several clinical and demographic parameters of each patient. In addition, the datasets selected included also mRNA expression data and were therefore suitable for addressing an important objective of this study, i.e., if aberrant methylation is correlated to gene expression. Methylation, clinical and expression data were recovered for the three cancer types. Differential methylation analysis of ENPP2 revealed that all emerged DMCs identified in transcription-related (TSS and 1st exon) regions were hypermethylated in all three cancers compared to healthy controls, confirming the analysis of the GEO datasets. In addition, the majority of DMCs located at the gene body were hypomethylated in the studied cancers in relation to controls. mRNA levels were decreased in PC and LC in relation to normal tissues. Collectively, our results indicate that the increased methylation of PA and 1st exon CGs is correlated with decreased expression in lung and prostate cancer. This is in line with previous studies in LC and BC showing that ENPP2 is hypermethylated in tumor tissues in relation to normal, causing down regulation in gene expression [13,45]. In PC, ATX protein was not or was weakly expressed in non-neoplastic epithelial cells and in high-grade intra-epithelial neoplasia, while in cancer cells ATX was only expressed in half of the tumors and was correlated with adverse tumor parameters [47]. A relevant study in LC showed that ATX protein expression and activity was increased in LC tissues and sera [48]. As far as HCC is concerned, our analysis showed upregulation of expression in HCC in relation to normal liver, showing a TSS and 1st exon methylation-independent and a cancer type-specific role of ENPP2 expression regulation. In a previous study, ATX overexpression in HCC tissues was correlated with inflammation and liver cirrhosis. In addition, liver cancer cell lines presented stronger ATX expression in relation to normal hepatocytes [49]. It should be noted that many authors have demonstrated that the relationship between mRNA expression and protein differs in many cancers. It has been reported in lung cancer and glioblastoma that, for many genes, mRNA expression is lower but protein levels are higher compared with the control [50,51,52,53].
In agreement with the above findings, analysis using the UALCAN database showed that ENPP2 is hypermethylated and under-expressed in LC and PC, suggesting that DNA methylation regulates expression in LC and PC. However, no regulatory relation was observed between methylation and expression in HCC, as both were upregulated, pointing again to a cancer-specific methylation-independent ENPP2 regulation. Different mechanisms between cancer types are common. Here, our presented results from the cancer types studied indicate a cancer type-specific profile of ENPP2 methylation rather than a similar pan-cancer dysregulation. Without availability of suitable methylome datasets or targeted methylation studies of ENPP2 in each different cancer type, we cannot extrapolate conclusions between cancers.
The same correlation pattern was noticed for ENPP2 isoforms in all cancer types studied. Interestingly, there was a significant negative correlation between mRNA expression (gene and isoform alpha and beta) and promoter methylation in four CGs (cg02156680, cg02709432, cg04452959 and cg06998282) in PRAD. In LC samples, the methylation of cg06998282 and cg02709432 was negatively correlated with the expression of ENPP2 and also with isoform beta and gamma. Finally, in the case of HCC, only the methylation of cg06998282 was negatively correlated with the expression of ENPP2 and isoform beta. The above findings indicate that the promoter methylation of specific CGs is negatively correlated with ENPP2 and isoform expression differs between cancers, with cg02709432 being a common site in PC and LC but not in the case of HCC. This CG is located at a site that can bind E2F-1 TF, which has been shown to be inhibited by CG methylation [54], and Sp1 TF, which has been found to regulate ENPP2 transcription [55]. Thus, we hypothesized that as the level of methylation increases, methylation of cg02709432 hinders the binding of the TFs to the promoter, thus leading to reduction in ENPP2 gene and isoforms expression.
The expression pattern of isoforms differs between tissues as high expression levels of isoform beta were found in peripheral tissues and plasma, while isoform gamma was mostly found in the brain, and isoform alpha is considered to be the most under-expressed in brain and peripheral tissue in comparison to the other two [56]. According to a relevant study, isoform alpha has a deletion of exon 12, isoform beta a deletion of exons 12 and 21 and isoform gamma a deletion of exon 21 [12], leading to different splice variants. None of the identified DMCs were located at these regions, explaining similar patterns of ENPP2 mRNA and isoform expression.
DNA methylation within promoters is known to modulate the binding of TFs to regulatory elements, thus resulting in transcriptional repression [57]. In our study, we predicted 39 TFs which can regulate transcription through binding to ENPP2 promoter’s DMCs. Therefore, any aberrant methylation events in these DMCs during pathological transformation may block TF binding and related transcription. This is further supported by reports involving the identified TFs in ENPP2 and ATX expression. Indeed, among the predicted TFs, NF kappaB, AP-2 and E2F have been previously shown to be sensitive to CG methylation with consequent inhibition of their DNA binding activities [54]. Another TF predicted to bind DMCs of ENPP2, NFAT1, has been shown to mediate ATX overexpression in MDA-MB-435 cells [58]. It has also been shown that blocking the expression of NFAT1 results in downregulation of ATX expression, leading to inhibition of melanoma and metastasis [35]. High C-Jun levels seem to enhance ENPP2 expression [59]. Interestingly, SP was found to regulate ENPP2 transcription in neuroblastoma cells by activating a CRE/AP-1-like element at position −142 to −149 and a GAbox at position −227 to −235 near the TSS of ENPP2 [55]. This is in accordance with our finding that Sp1 can bind near the cg02709432 located at TSS200.
In order to assess any correlation of ENPP2 methylation to tumor prognosis, clinical characteristics analysis was performed and showed that increased methylation of some CGs was correlated with poor tumor parameters. Indeed, in PC it was associated with larger tumors and non-response to pharmacotherapy, in LC it was connected to the advanced cancer stage and in HCC it was associated with macro-invasion. Hence, ENPP2 methylation in the identified CGs could be pursued further and be evaluated in clinical cancer samples as biomarkers of cancer progression and poor outcome. In addition, these results corroborate previous data showing that low mRNA expression was associated with worse prognosis in LC [45].
The involvement of ENPP2 methylation in tumor progression and prognosis was also addressed by analyzing methylomes from cell lines presenting a more or less aggressively invasive phenotype, revealing several DMCs. Higher methylation was observed in the more aggressive in relation to less aggressive HCC and PC cell lines, indicating a connection of ENPP2 methylation with worse prognostic behavior, in accordance with our findings in the clinical samples.
Finally, analysis of colon cell lines treated with DNA methyltransferase inhibitors showed that 5-AZA caused a decrease of methylation in all CGs in relation to untreated controls in the three studied cell lines, showing a clear demethylation effect in the ENPP2 gene. Given the contribution of ENPP2 in a variety of pathologies, further studies could assess a methylation-based reprogramming of ENPP2 via a variety of methylation inhibitors. Similarly, previous studies have demonstrated that targeting the ATX-LPA-LPP axis is an attractive strategy for introducing new therapeutic choices [60,61].
In conclusion, healthy tissues presented increased methylation of ENPP2 in the gene body and decreased in the promoter and 1st exon connected to the active transcription of the gene in most human tissues. A different pattern was described in HCC, melanoma, CRC, LC and PC, showing a malignant-specific profile of ENPP2 methylation. Further analysis of independent TCGA datasets confirmed these results as increased methylation of promoter and 1st exon CGs and decreased ENPP2 mRNA expression in PC and LC in relation to healthy tissues were found. Furthermore, increased methylation of ENPP2 was connected to poor prognostic parameters in the same cancers, which was also supported by analysis of cell line datasets. We also found a negative correlation between mRNA expression at gene and isoform levels and methylation of PA CGs that present TF binding sites. In specific, we postulate that the methylation of promoter CGs may hinder the binding of TFs, and thus, the expression of ENPP2 and isoforms may be reduced.
Our findings contribute to the understanding of methylation events and regulatory mechanism of ENPP2 in cancer and provide a full description of DMCs to be further validated in functional and clinical studies.
Supplementary Materials
The following are available online at https://www.mdpi.com/article/10.3390/ijms222111958/s1.
Author Contributions
Conceptualization M.P., V.A. and E.C., methodology, M.P. and D.F.; software, M.P. and D.F.; validation, M.P. and E.C.; formal analysis, M.P. and D.F.; investigation, M.P., D.F., E.C. and V.A.; data curation M.P., D.F., V.A. and E.C.; writing—original draft preparation, M.P.; writing—review and editing, M.P., D.F., V.A. and E.C.; visualization, M.P. and D.F.; supervision, V.A. and E.C. All authors have read and agreed to the published version of the manuscript.
Funding
This research has been co-financed by the European Regional Development Fund of the European Union and Greek national funds through the Operational Program Competitiveness, Entrepreneurship and Innovation, under the call RESEARCH—CREATE—INNOVATE (project code: T1EDK-00940).
Institutional Review Board Statement
Not applicable.
Informed Consent Statement
Not applicable.
Data Availability Statement
Data are available upon request.
Conflicts of Interest
The authors declare no conflict of interest.
References
- Stefan, C.; Jansen, S.; Bollen, M. NPP-type ectophosphodiesterases: Unity in diversity. Trends Biochem. Sci. 2005, 30, 542–550. [Google Scholar] [CrossRef] [PubMed]
- Tanaka, M.; Okudaira, S.; Kishi, Y.; Ohkawa, R.; Iseki, S.; Ota, M.; Noji, S.; Yatomi, Y.; Aoki, J.; Arai, H. Autotaxin stabilizes blood vessels and is required for embryonic vasculature by producing lysophosphatidic acid. J. Biol. Chem. 2006, 281, 25822–25830. [Google Scholar] [CrossRef] [Green Version]
- Ninou, I.; Magkrioti, C.; Aidinis, V. Autotaxin in Pathophysiology and Pulmonary Fibrosis. Front. Med. 2018, 5, 180. [Google Scholar] [CrossRef] [PubMed]
- Magkrioti, C.; Galaris, A.; Kanellopoulou, P.; Stylianaki, E.A.; Kaffe, E.; Aidinis, V. Autotaxin and chronic inflammatory diseases. J. Autoimmun. 2019, 104, 102327. [Google Scholar] [CrossRef] [PubMed]
- Peyruchaud, O.; Saier, L.; Leblanc, R. Autotaxin Implication in Cancer Metastasis and Autoimunne Disorders: Functional Implication of Binding Autotaxin to the Cell Surface. Cancers 2019, 12, 105. [Google Scholar] [CrossRef] [PubMed] [Green Version]
- Benesch, M.G.; Tang, X.; Maeda, T.; Ohhata, A.; Zhao, Y.Y.; Kok, B.P.; Dewald, J.; Hitt, M.; Curtis, J.M.; McMullen, T.P.; et al. Inhibition of autotaxin delays breast tumor growth and lung metastasis in mice. FASEB J. 2014, 28, 2655–2666. [Google Scholar] [CrossRef] [PubMed]
- Memet, I.; Tsalkidou, E.; Tsaroucha, A.K.; Lambropoulou, M.; Chatzaki, E.; Trypsianis, G.; Schizas, D.; Pitiakoudis, M.; Simopoulos, C. Autotaxin Expression in Hepatocellular Carcinoma. J. Investig. Surg. 2018, 31, 359–365. [Google Scholar] [CrossRef] [PubMed]
- Yang, S.Y.; Lee, J.; Park, C.G.; Kim, S.; Hong, S.; Chung, H.C.; Min, S.K.; Han, J.W.; Lee, H.W.; Lee, H.Y. Expression of autotaxin (NPP-2) is closely linked to invasiveness of breast cancer cells. Clin. Exp. Metastasis 2002, 19, 603–608. [Google Scholar] [CrossRef]
- Oikonomou, N.; Mouratis, M.A.; Tzouvelekis, A.; Kaffe, E.; Valavanis, C.; Vilaras, G.; Karameris, A.; Prestwich, G.D.; Bouros, D.; Aidinis, V. Pulmonary autotaxin expression contributes to the pathogenesis of pulmonary fibrosis. Am. J. Respir. Cell Mol. Biol. 2012, 47, 566–574. [Google Scholar] [CrossRef]
- Lee, H.Y.; Murata, J.; Clair, T.; Polymeropoulos, M.H.; Torres, R.; Manrow, R.E.; Liotta, L.A.; Stracke, M.L. Cloning, chromosomal localization, and tissue expression of autotaxin from human teratocarcinoma cells. Biochem. Biophys. Res. Commun. 1996, 218, 714–719. [Google Scholar] [CrossRef] [Green Version]
- Brisbin, A.G.; Asmann, Y.W.; Song, H.; Tsai, Y.Y.; Aakre, J.A.; Yang, P.; Jenkins, R.B.; Pharoah, P.; Schumacher, F.; Conti, D.V.; et al. Meta-analysis of 8q24 for seven cancers reveals a locus between NOV and ENPP2 associated with cancer development. BMC Med. Genet. 2011, 12, 156. [Google Scholar] [CrossRef] [Green Version]
- Giganti, A.; Rodriguez, M.; Fould, B.; Moulharat, N.; Cogé, F.; Chomarat, P.; Galizzi, J.-P.; Valet, P.; Saulnier-Blache, J.-S.; Boutin, J.A.; et al. Murine and Human Autotaxin α, β, and γ Isoforms: Gene organization, tissue distribution, and biochemical characterization. J. Biol. Chem. 2008, 283, 7776–7789. [Google Scholar] [CrossRef] [Green Version]
- Parris, T.Z.; Kovács, A.; Hajizadeh, S.; Nemes, S.; Semaan, M.; Levin, M.; Karlsson, P.; Helou, K. Frequent MYC coamplification and DNA hypomethylation of multiple genes on 8q in 8p11-p12-amplified breast carcinomas. Oncogenesis 2014, 3, e95. [Google Scholar] [CrossRef] [Green Version]
- Razin, A.; Cedar, H. DNA methylation and gene expression. Microbiol. Rev. 1991, 55, 451–458. [Google Scholar] [CrossRef]
- Nikolaidis, C.; Nena, E.; Panagopoulou, M.; Balgkouranidou, I.; Karaglani, M.; Chatzaki, E.; Agorastos, T.; Constantinidis, T.C. PAX1 methylation as an auxiliary biomarker for cervical cancer screening: A meta-analysis. Cancer Epidemiol. 2015, 39, 682–686. [Google Scholar] [CrossRef] [PubMed]
- Panagopoulou, M.; Esteller, M.; Chatzaki, E. Circulating Cell-Free DNA in Breast Cancer: Searching for Hidden Information towards Precision Medicine. Cancers 2021, 13, 728. [Google Scholar] [CrossRef]
- Panagopoulou, M.; Karaglani, M.; Manolopoulos, V.G.; Iliopoulos, I.; Tsamardinos, I.; Chatzaki, E. Deciphering the Methylation Landscape in Breast Cancer: Diagnostic and Prognostic Biosignatures through Automated Machine Learning. Cancers 2021, 13, 1677. [Google Scholar] [CrossRef]
- Panagopoulou, M.; Cheretaki, A.; Karaglani, M.; Balgkouranidou, I.; Biziota, E.; Amarantidis, K.; Xenidis, N.; Kakolyris, S.; Baritaki, S.; Chatzaki, E. Methylation Status of Corticotropin-Releasing Factor (CRF) Receptor Genes in Colorectal Cancer. J. Clin. Med. 2021, 10, 2680. [Google Scholar] [CrossRef] [PubMed]
- Panagopoulou, M.; Karaglani, M.; Balgkouranidou, I.; Biziota, E.; Koukaki, T.; Karamitrousis, E.; Nena, E.; Tsamardinos, I.; Kolios, G.; Lianidou, E.; et al. Circulating cell-free DNA in breast cancer: Size profiling, levels, and methylation patterns lead to prognostic and predictive classifiers. Oncogene 2019, 38, 3387–3401. [Google Scholar] [CrossRef]
- Panagopoulou, M.; Lambropoulou, M.; Balgkouranidou, I.; Nena, E.; Karaglani, M.; Nicolaidou, C.; Asimaki, A.; Konstantinidis, T.; Constantinidis, T.C.; Kolios, G.; et al. Gene promoter methylation and protein expression of BRMS1 in uterine cervix in relation to high-risk human papilloma virus infection and cancer. Tumour Biol. J. Int. Soc. Oncodev. Biol. Med. 2017, 39, 1010428317697557. [Google Scholar] [CrossRef] [Green Version]
- Udomsinprasert, W.; Kitkumthorn, N.; Mutirangura, A.; Chongsrisawat, V.; Poovorawan, Y.; Honsawek, S. Association between Promoter Hypomethylation and Overexpression of Autotaxin with Outcome Parameters in Biliary Atresia. PLoS ONE 2017, 12, e0169306. [Google Scholar] [CrossRef]
- Liu, X.; Peng, Y.; Wang, J. Integrative analysis of DNA methylation and gene expression profiles identified potential breast cancer-specific diagnostic markers. Biosci. Rep. 2020, 40. [Google Scholar] [CrossRef]
- Sung, H.; Ferlay, J.; Siegel, R.L.; Laversanne, M.; Soerjomataram, I.; Jemal, A.; Bray, F. Global Cancer Statistics 2020: GLOBOCAN Estimates of Incidence and Mortality Worldwide for 36 Cancers in 185 Countries. CA Cancer J. Clin. 2021, 71, 209–249. [Google Scholar] [CrossRef]
- Edgar, R.; Domrachev, M.; Lash, A.E. Gene Expression Omnibus: NCBI gene expression and hybridization array data repository. Nucleic Acids Res. 2002, 30, 207–210. [Google Scholar] [CrossRef] [Green Version]
- Kim, Y.H.; Lee, H.C.; Kim, S.Y.; Yeom, Y.I.; Ryu, K.J.; Min, B.H.; Kim, D.H.; Son, H.J.; Rhee, P.L.; Kim, J.J.; et al. Epigenomic analysis of aberrantly methylated genes in colorectal cancer identifies genes commonly affected by epigenetic alterations. Ann. Surg. Oncol. 2011, 18, 2338–2347. [Google Scholar] [CrossRef]
- Noreen, F.; Küng, T.; Tornillo, L.; Parker, H.; Silva, M.; Weis, S.; Marra, G.; Rad, R.; Truninger, K.; Schär, P. DNA methylation instability by BRAF-mediated TET silencing and lifestyle-exposure divides colon cancer pathways. Clin. Epigenet. 2019, 11, 196. [Google Scholar] [CrossRef]
- Farkas, S.A.; Milutin-Gašperov, N.; Grce, M.; Nilsson, T.K. Genome-wide DNA methylation assay reveals novel candidate biomarker genes in cervical cancer. Epigenetics 2013, 8, 1213–1225. [Google Scholar] [CrossRef] [Green Version]
- Wang, R.; Li, Y.; Du, P.; Zhang, X.; Li, X.; Cheng, G. Hypomethylation of the lncRNA SOX21-AS1 has clinical prognostic value in cervical cancer. Life Sci. 2019, 233, 116708. [Google Scholar] [CrossRef]
- Conway, K.; Edmiston, S.N.; Parker, J.S.; Kuan, P.F.; Tsai, Y.H.; Groben, P.A.; Zedek, D.C.; Scott, G.A.; Parrish, E.A.; Hao, H.; et al. Identification of a Robust Methylation Classifier for Cutaneous Melanoma Diagnosis. J. Investig. Dermatol. 2019, 139, 1349–1361. [Google Scholar] [CrossRef]
- Kirby, M.K.; Ramaker, R.C.; Roberts, B.S.; Lasseigne, B.N.; Gunther, D.S.; Burwell, T.C.; Davis, N.S.; Gulzar, Z.G.; Absher, D.M.; Cooper, S.J.; et al. Genome-wide DNA methylation measurements in prostate tissues uncovers novel prostate cancer diagnostic biomarkers and transcription factor binding patterns. BMC Cancer 2017, 17, 273. [Google Scholar] [CrossRef] [Green Version]
- Najgebauer, H.; Liloglou, T.; Jithesh, P.V.; Giger, O.T.; Varro, A.; Sanderson, C.M. Integrated omics profiling reveals novel patterns of epigenetic programming in cancer-associated myofibroblasts. Carcinogenesis 2019, 40, 500–512. [Google Scholar] [CrossRef]
- Shimada, S.; Mogushi, K.; Akiyama, Y.; Furuyama, T.; Watanabe, S.; Ogura, T.; Ogawa, K.; Ono, H.; Mitsunori, Y.; Ban, D.; et al. Comprehensive molecular and immunological characterization of hepatocellular carcinoma. EBioMedicine 2019, 40, 457–470. [Google Scholar] [CrossRef] [PubMed] [Green Version]
- Cheishvili, D.; Stefanska, B.; Yi, C.; Li, C.C.; Yu, P.; Arakelian, A.; Tanvir, I.; Khan, H.A.; Rabbani, S.; Szyf, M. A common promoter hypomethylation signature in invasive breast, liver and prostate cancer cell lines reveals novel targets involved in cancer invasiveness. Oncotarget 2015, 6, 33253–33268. [Google Scholar] [CrossRef] [PubMed] [Green Version]
- Lokk, K.; Modhukur, V.; Rajashekar, B.; Märtens, K.; Mägi, R.; Kolde, R.; Koltšina, M.; Nilsson, T.K.; Vilo, J.; Salumets, A.; et al. DNA methylome profiling of human tissues identifies global and tissue-specific methylation patterns. Genome Biol. 2014, 15, r54. [Google Scholar] [CrossRef] [PubMed] [Green Version]
- Braeuer, R.R.; Zigler, M.; Kamiya, T.; Dobroff, A.S.; Huang, L.; Choi, W.; McConkey, D.J.; Shoshan, E.; Mobley, A.K.; Song, R.; et al. Galectin-3 contributes to melanoma growth and metastasis via regulation of NFAT1 and autotaxin. Cancer Res. 2012, 72, 5757–5766. [Google Scholar] [CrossRef] [PubMed] [Green Version]
- Yang, X.; Han, H.; De Carvalho, D.D.; Lay, F.D.; Jones, P.A.; Liang, G. Gene body methylation can alter gene expression and is a therapeutic target in cancer. Cancer Cell 2014, 26, 577–590. [Google Scholar] [CrossRef] [Green Version]
- Colaprico, A.; Silva, T.C.; Olsen, C.; Garofano, L.; Cava, C.; Garolini, D.; Sabedot, T.S.; Malta, T.M.; Pagnotta, S.M.; Castiglioni, I.; et al. TCGAbiolinks: An R/Bioconductor package for integrative analysis of TCGA data. Nucleic Acids Res. 2016, 44, e71. [Google Scholar] [CrossRef]
- Brenet, F.; Moh, M.; Funk, P.; Feierstein, E.; Viale, A.J.; Socci, N.D.; Scandura, J.M. DNA methylation of the first exon is tightly linked to transcriptional silencing. PLoS ONE 2011, 6, e14524. [Google Scholar] [CrossRef]
- Chandrashekar, D.S.; Bashel, B.; Balasubramanya, S.A.H.; Creighton, C.J.; Ponce-Rodriguez, I.; Chakravarthi, B.; Varambally, S. UALCAN: A Portal for Facilitating Tumor Subgroup Gene Expression and Survival Analyses. Neoplasia 2017, 19, 649–658. [Google Scholar] [CrossRef]
- Ando, M.; Saito, Y.; Xu, G.; Bui, N.Q.; Medetgul-Ernar, K.; Pu, M.; Fisch, K.; Ren, S.; Sakai, A.; Fukusumi, T.; et al. Chromatin dysregulation and DNA methylation at transcription start sites associated with transcriptional repression in cancers. Nat. Commun. 2019, 10, 2188. [Google Scholar] [CrossRef] [Green Version]
- Deaton, A.M.; Bird, A. CpG islands and the regulation of transcription. Genes Dev. 2011, 25, 1010–1022. [Google Scholar] [CrossRef] [Green Version]
- Perrakis, A.; Moolenaar, W.H. Autotaxin: Structure-function and signaling. J. Lipid Res. 2014, 55, 1010–1018. [Google Scholar] [CrossRef] [Green Version]
- Fuss, B.; Baba, H.; Phan, T.; Tuohy, V.K.; Macklin, W.B. Phosphodiesterase I, a novel adhesion molecule and/or cytokine involved in oligodendrocyte function. J. Neurosci. 1997, 17, 9095–9103. [Google Scholar] [CrossRef] [Green Version]
- Kanda, H.; Newton, R.; Klein, R.; Morita, Y.; Gunn, M.D.; Rosen, S.D. Autotaxin, an ectoenzyme that produces lysophosphatidic acid, promotes the entry of lymphocytes into secondary lymphoid organs. Nat. Immunol. 2008, 9, 415–423. [Google Scholar] [CrossRef] [Green Version]
- Nema, R.; Shrivastava, A.; Kumar, A. Prognostic role of lipid phosphate phosphatases in non-smoker, lung adenocarcinoma patients. Comput. Biol. Med. 2021, 129, 104141. [Google Scholar] [CrossRef]
- Wang, S.C.; Liao, L.M.; Ansar, M.; Lin, S.Y.; Hsu, W.W.; Su, C.M.; Chung, Y.M.; Liu, C.C.; Hung, C.S.; Lin, R.K. Automatic Detection of the Circulating Cell-Free Methylated DNA Pattern of GCM2, ITPRIPL1 and CCDC181 for Detection of Early Breast Cancer and Surgical Treatment Response. Cancers 2021, 13, 1375. [Google Scholar] [CrossRef]
- Nouh, M.A.; Wu, X.X.; Okazoe, H.; Tsunemori, H.; Haba, R.; Abou-Zeid, A.M.; Saleem, M.D.; Inui, M.; Sugimoto, M.; Aoki, J.; et al. Expression of autotaxin and acylglycerol kinase in prostate cancer: Association with cancer development and progression. Cancer Sci. 2009, 100, 1631–1638. [Google Scholar] [CrossRef]
- Magkrioti, C.; Oikonomou, N.; Kaffe, E.; Mouratis, M.A.; Xylourgidis, N.; Barbayianni, I.; Megadoukas, P.; Harokopos, V.; Valavanis, C.; Chun, J.; et al. The Autotaxin-Lysophosphatidic Acid Axis Promotes Lung Carcinogenesis. Cancer Res. 2018, 78, 3634–3644. [Google Scholar] [CrossRef] [Green Version]
- Wu, J.M.; Xu, Y.; Skill, N.J.; Sheng, H.; Zhao, Z.; Yu, M.; Saxena, R.; Maluccio, M.A. Autotaxin expression and its connection with the TNF-alpha-NF-kappaB axis in human hepatocellular carcinoma. Mol. Cancer 2010, 9, 71. [Google Scholar] [CrossRef] [Green Version]
- Maier, T.; Güell, M.; Serrano, L. Correlation of mRNA and protein in complex biological samples. FEBS Lett. 2009, 583, 3966–3973. [Google Scholar] [CrossRef] [Green Version]
- Chen, G.; Gharib, T.G.; Huang, C.C.; Taylor, J.M.; Misek, D.E.; Kardia, S.L.; Giordano, T.J.; Iannettoni, M.D.; Orringer, M.B.; Hanash, S.M.; et al. Discordant protein and mRNA expression in lung adenocarcinomas. Mol. Cell. Proteom. MCP 2002, 1, 304–313. [Google Scholar] [CrossRef] [PubMed] [Green Version]
- Lemée, J.M.; Clavreul, A.; Aubry, M.; Com, E.; de Tayrac, M.; Mosser, J.; Menei, P. Integration of transcriptome and proteome profiles in glioblastoma: Looking for the missing link. BMC Mol. Biol. 2018, 19, 13. [Google Scholar] [CrossRef]
- Arcos-Montoya, D.; Wegman-Ostrosky, T.; Mejía-Pérez, S.; De la Fuente-Granada, M.; Camacho-Arroyo, I.; García-Carrancá, A.; Velasco-Velázquez, M.A.; Manjarrez-Marmolejo, J.; González-Arenas, A. Progesterone Receptor Together with PKCα Expression as Prognostic Factors for Astrocytomas Malignancy. OncoTargets Ther. 2021, 14, 3757–3768. [Google Scholar] [CrossRef] [PubMed]
- Tate, P.H.; Bird, A.P. Effects of DNA methylation on DNA-binding proteins and gene expression. Curr. Opin. Genet. Dev. 1993, 3, 226–231. [Google Scholar] [CrossRef]
- Farina, A.R.; Cappabianca, L.; Ruggeri, P.; Di Ianni, N.; Ragone, M.; Merolle, S.; Sano, K.; Stracke, M.L.; Horowitz, J.M.; Gulino, A.; et al. Constitutive autotaxin transcription by Nmyc-amplified and non-amplified neuroblastoma cells is regulated by a novel AP-1 and SP-mediated mechanism and abrogated by curcumin. FEBS Lett. 2012, 586, 3681–3691. [Google Scholar] [CrossRef] [PubMed] [Green Version]
- Zhang, X.; Li, M.; Yin, N.; Zhang, J. The Expression Regulation and Biological Function of Autotaxin. Cells 2021, 10, 939. [Google Scholar] [CrossRef]
- Héberlé, É.; Bardet, A.F. Sensitivity of transcription factors to DNA methylation. Essays Biochem. 2019, 63, 727–741. [Google Scholar] [CrossRef] [PubMed] [Green Version]
- Chen, M.; O’Connor, K.L. Integrin alpha6beta4 promotes expression of autotaxin/ENPP2 autocrine motility factor in breast carcinoma cells. Oncogene 2005, 24, 5125–5130. [Google Scholar] [CrossRef] [PubMed] [Green Version]
- Sioletic, S.; Czaplinski, J.; Hu, L.; Fletcher, J.A.; Fletcher, C.D.; Wagner, A.J.; Loda, M.; Demetri, G.D.; Sicinska, E.T.; Snyder, E.L. c-Jun promotes cell migration and drives expression of the motility factor ENPP2 in soft tissue sarcomas. J. Pathol. 2014, 234, 190–202. [Google Scholar] [CrossRef] [Green Version]
- Benesch, M.G.; Tang, X.; Venkatraman, G.; Bekele, R.T.; Brindley, D.N. Recent advances in targeting the autotaxin-lysophosphatidate-lipid phosphate phosphatase axis in vivo. J. Biomed. Res. 2016, 30, 272–284. [Google Scholar] [CrossRef]
- Barbayianni, E.; Kaffe, E.; Aidinis, V.; Kokotos, G. Autotaxin, a secreted lysophospholipase D, as a promising therapeutic target in chronic inflammation and cancer. Prog. Lipid Res. 2015, 58, 76–96. [Google Scholar] [CrossRef] [PubMed]

Publisher’s Note: MDPI stays neutral with regard to jurisdictional claims in published maps and institutional affiliations. |
© 2021 by the authors. Licensee MDPI, Basel, Switzerland. This article is an open access article distributed under the terms and conditions of the Creative Commons Attribution (CC BY) license (https://creativecommons.org/licenses/by/4.0/).