
Human Serum Extracellular Vesicle Proteomic Profile Depends on the Enrichment Method Employed

 ,
,
Abstract
:1. Introduction
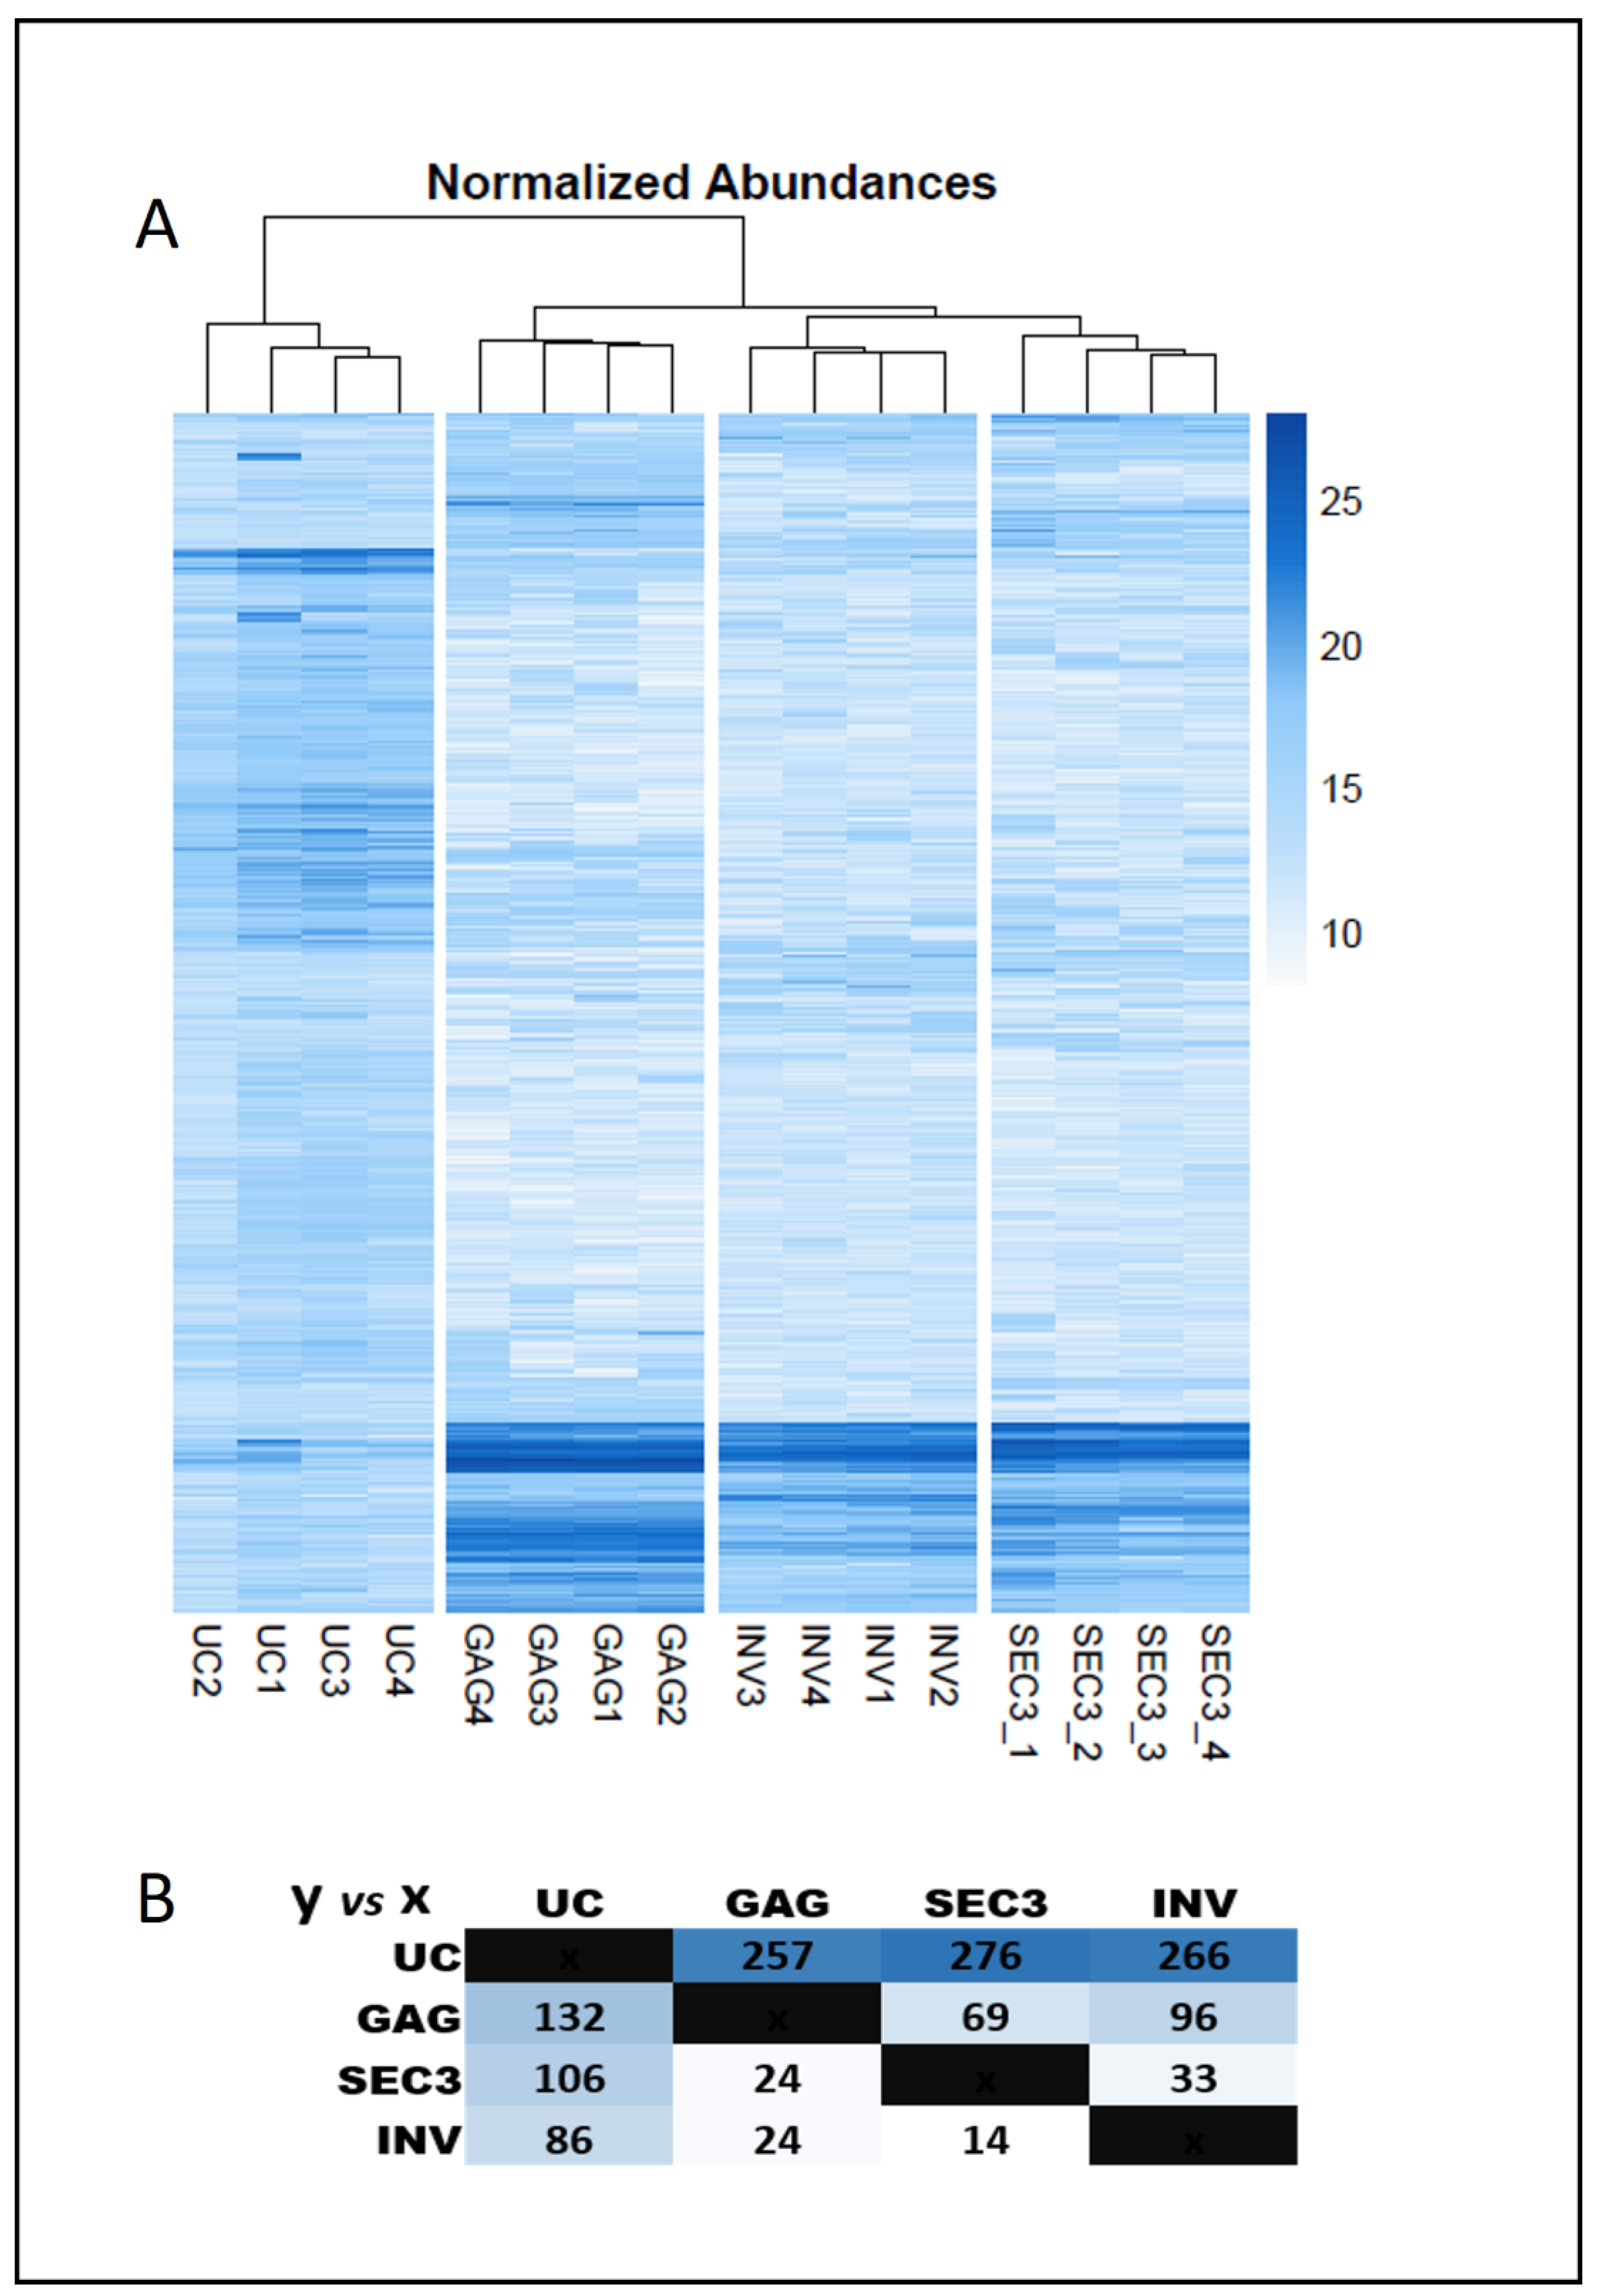
2. Results
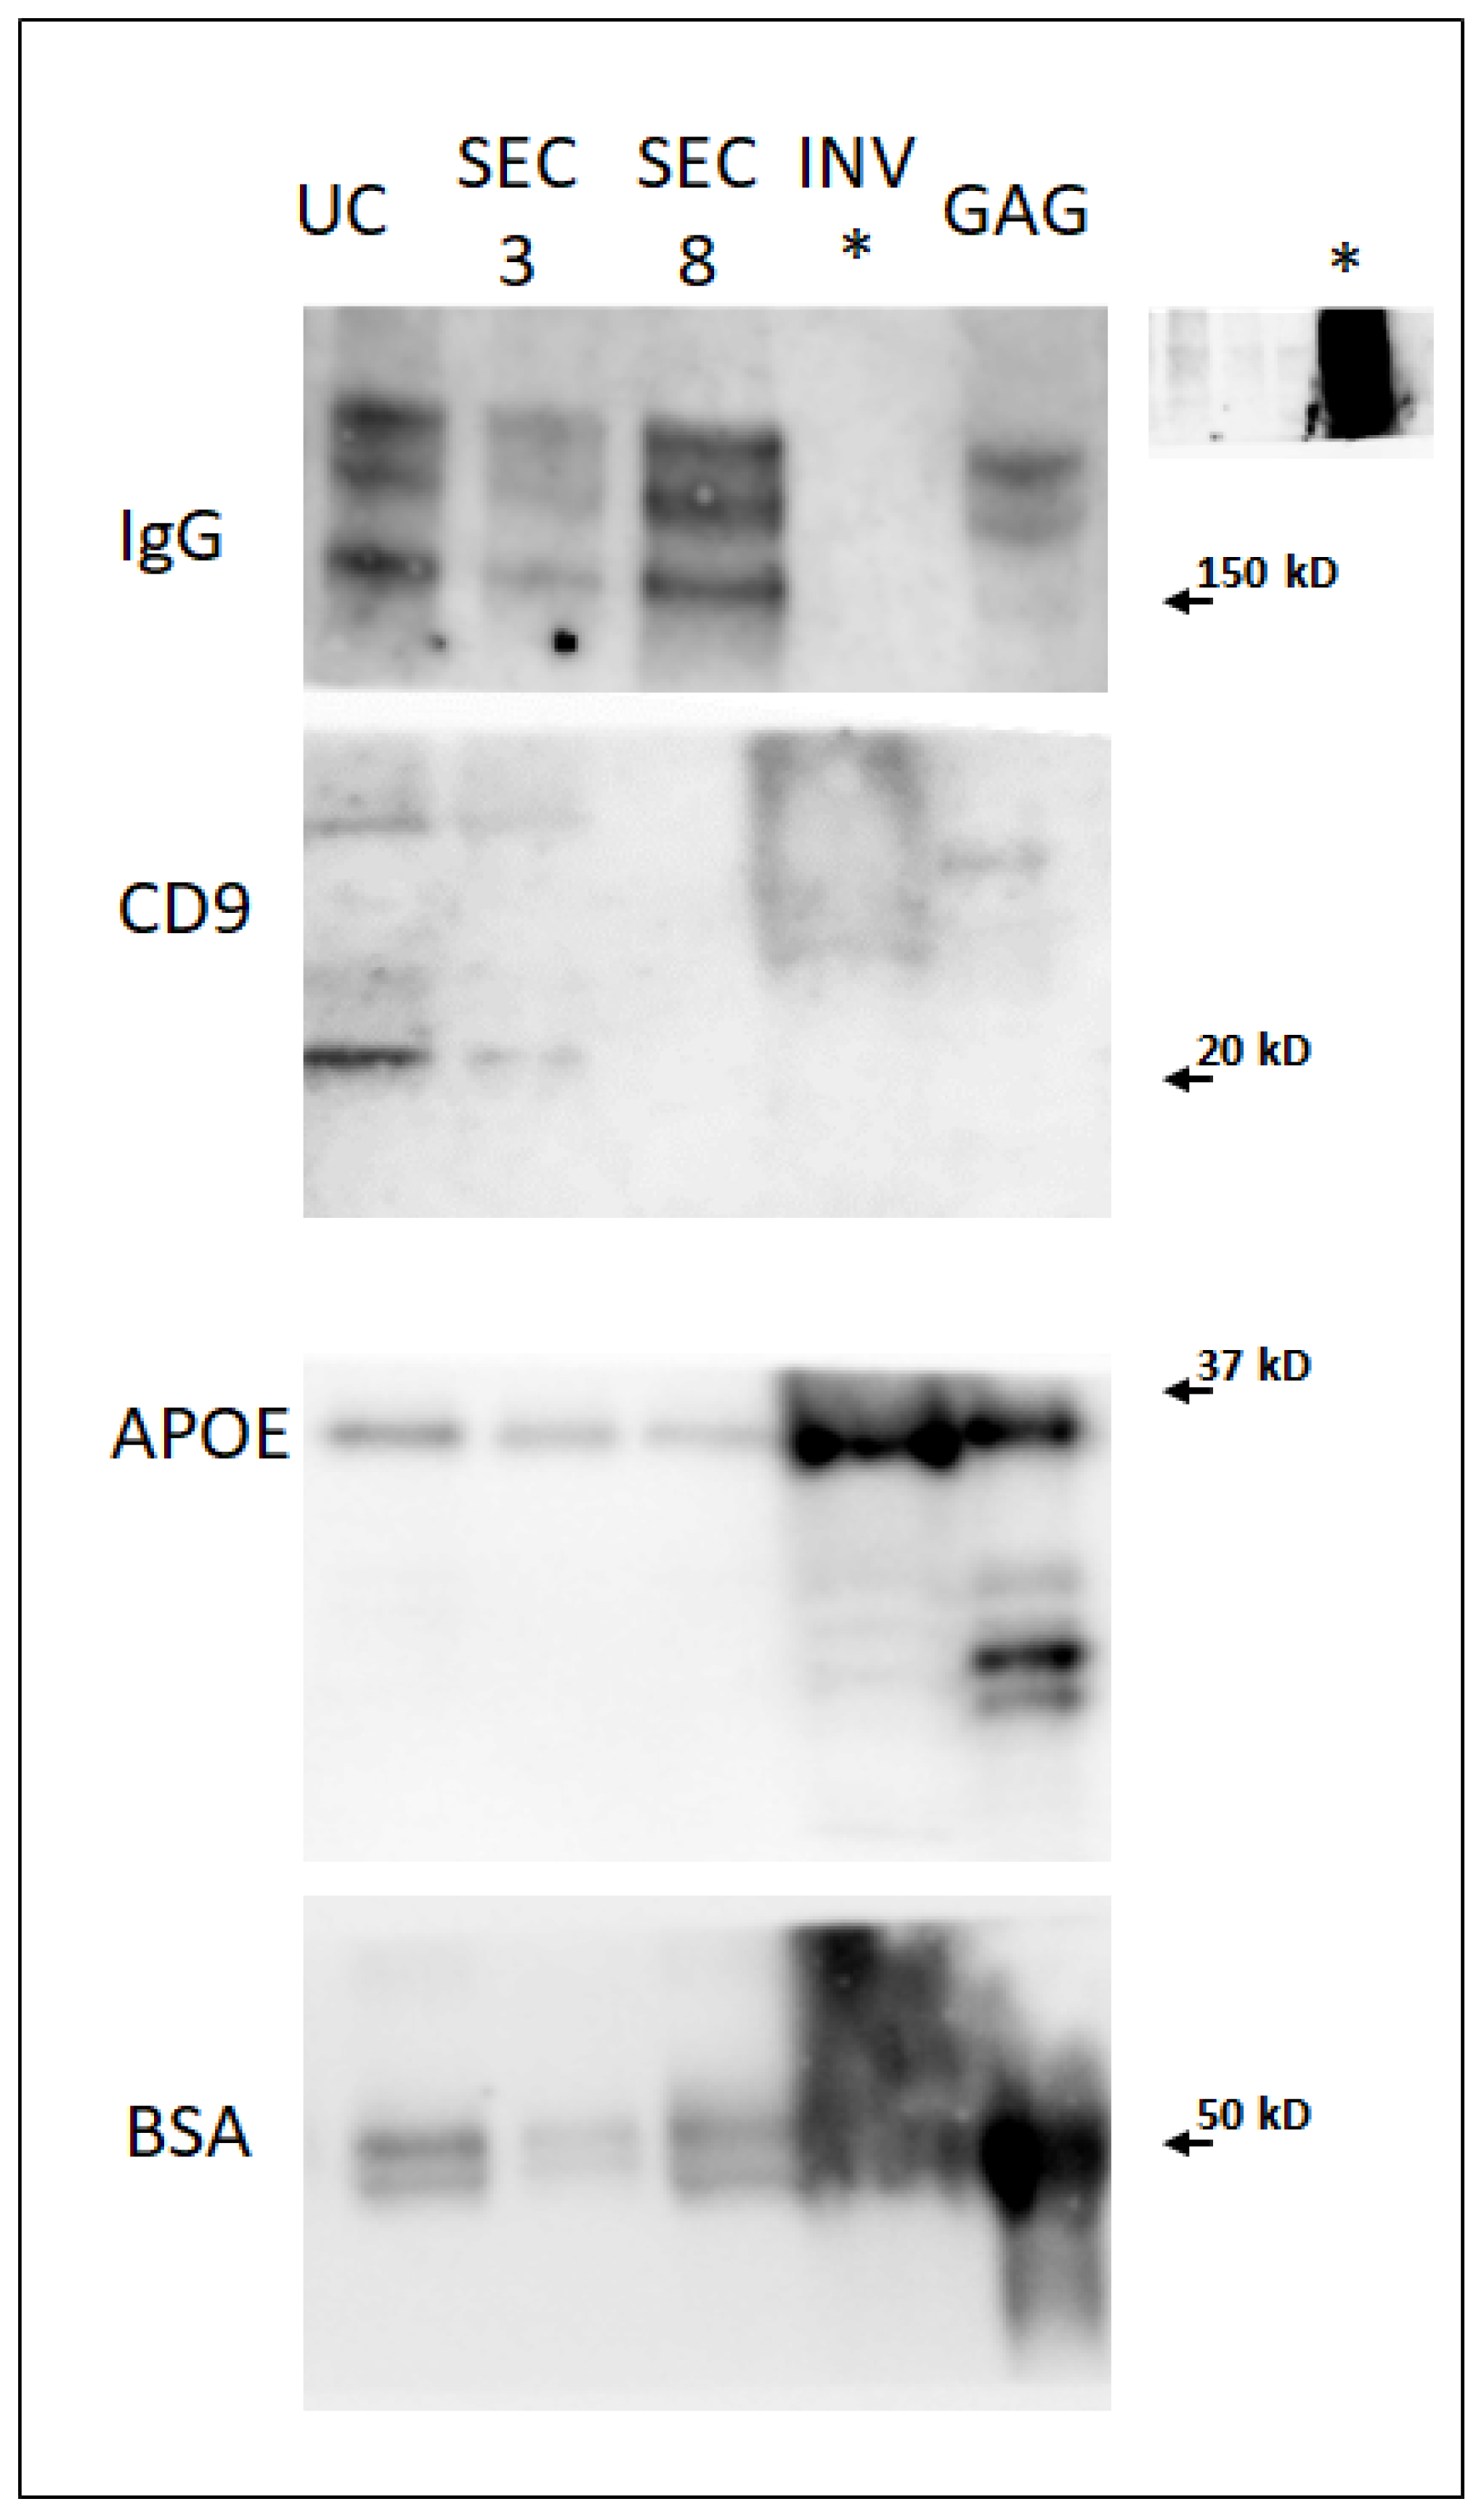
2.1. Characterization of Vesicles Separated by Different Techniques
2.2. Proteomic Profile of EVs Enriched by Ultracentrifugation
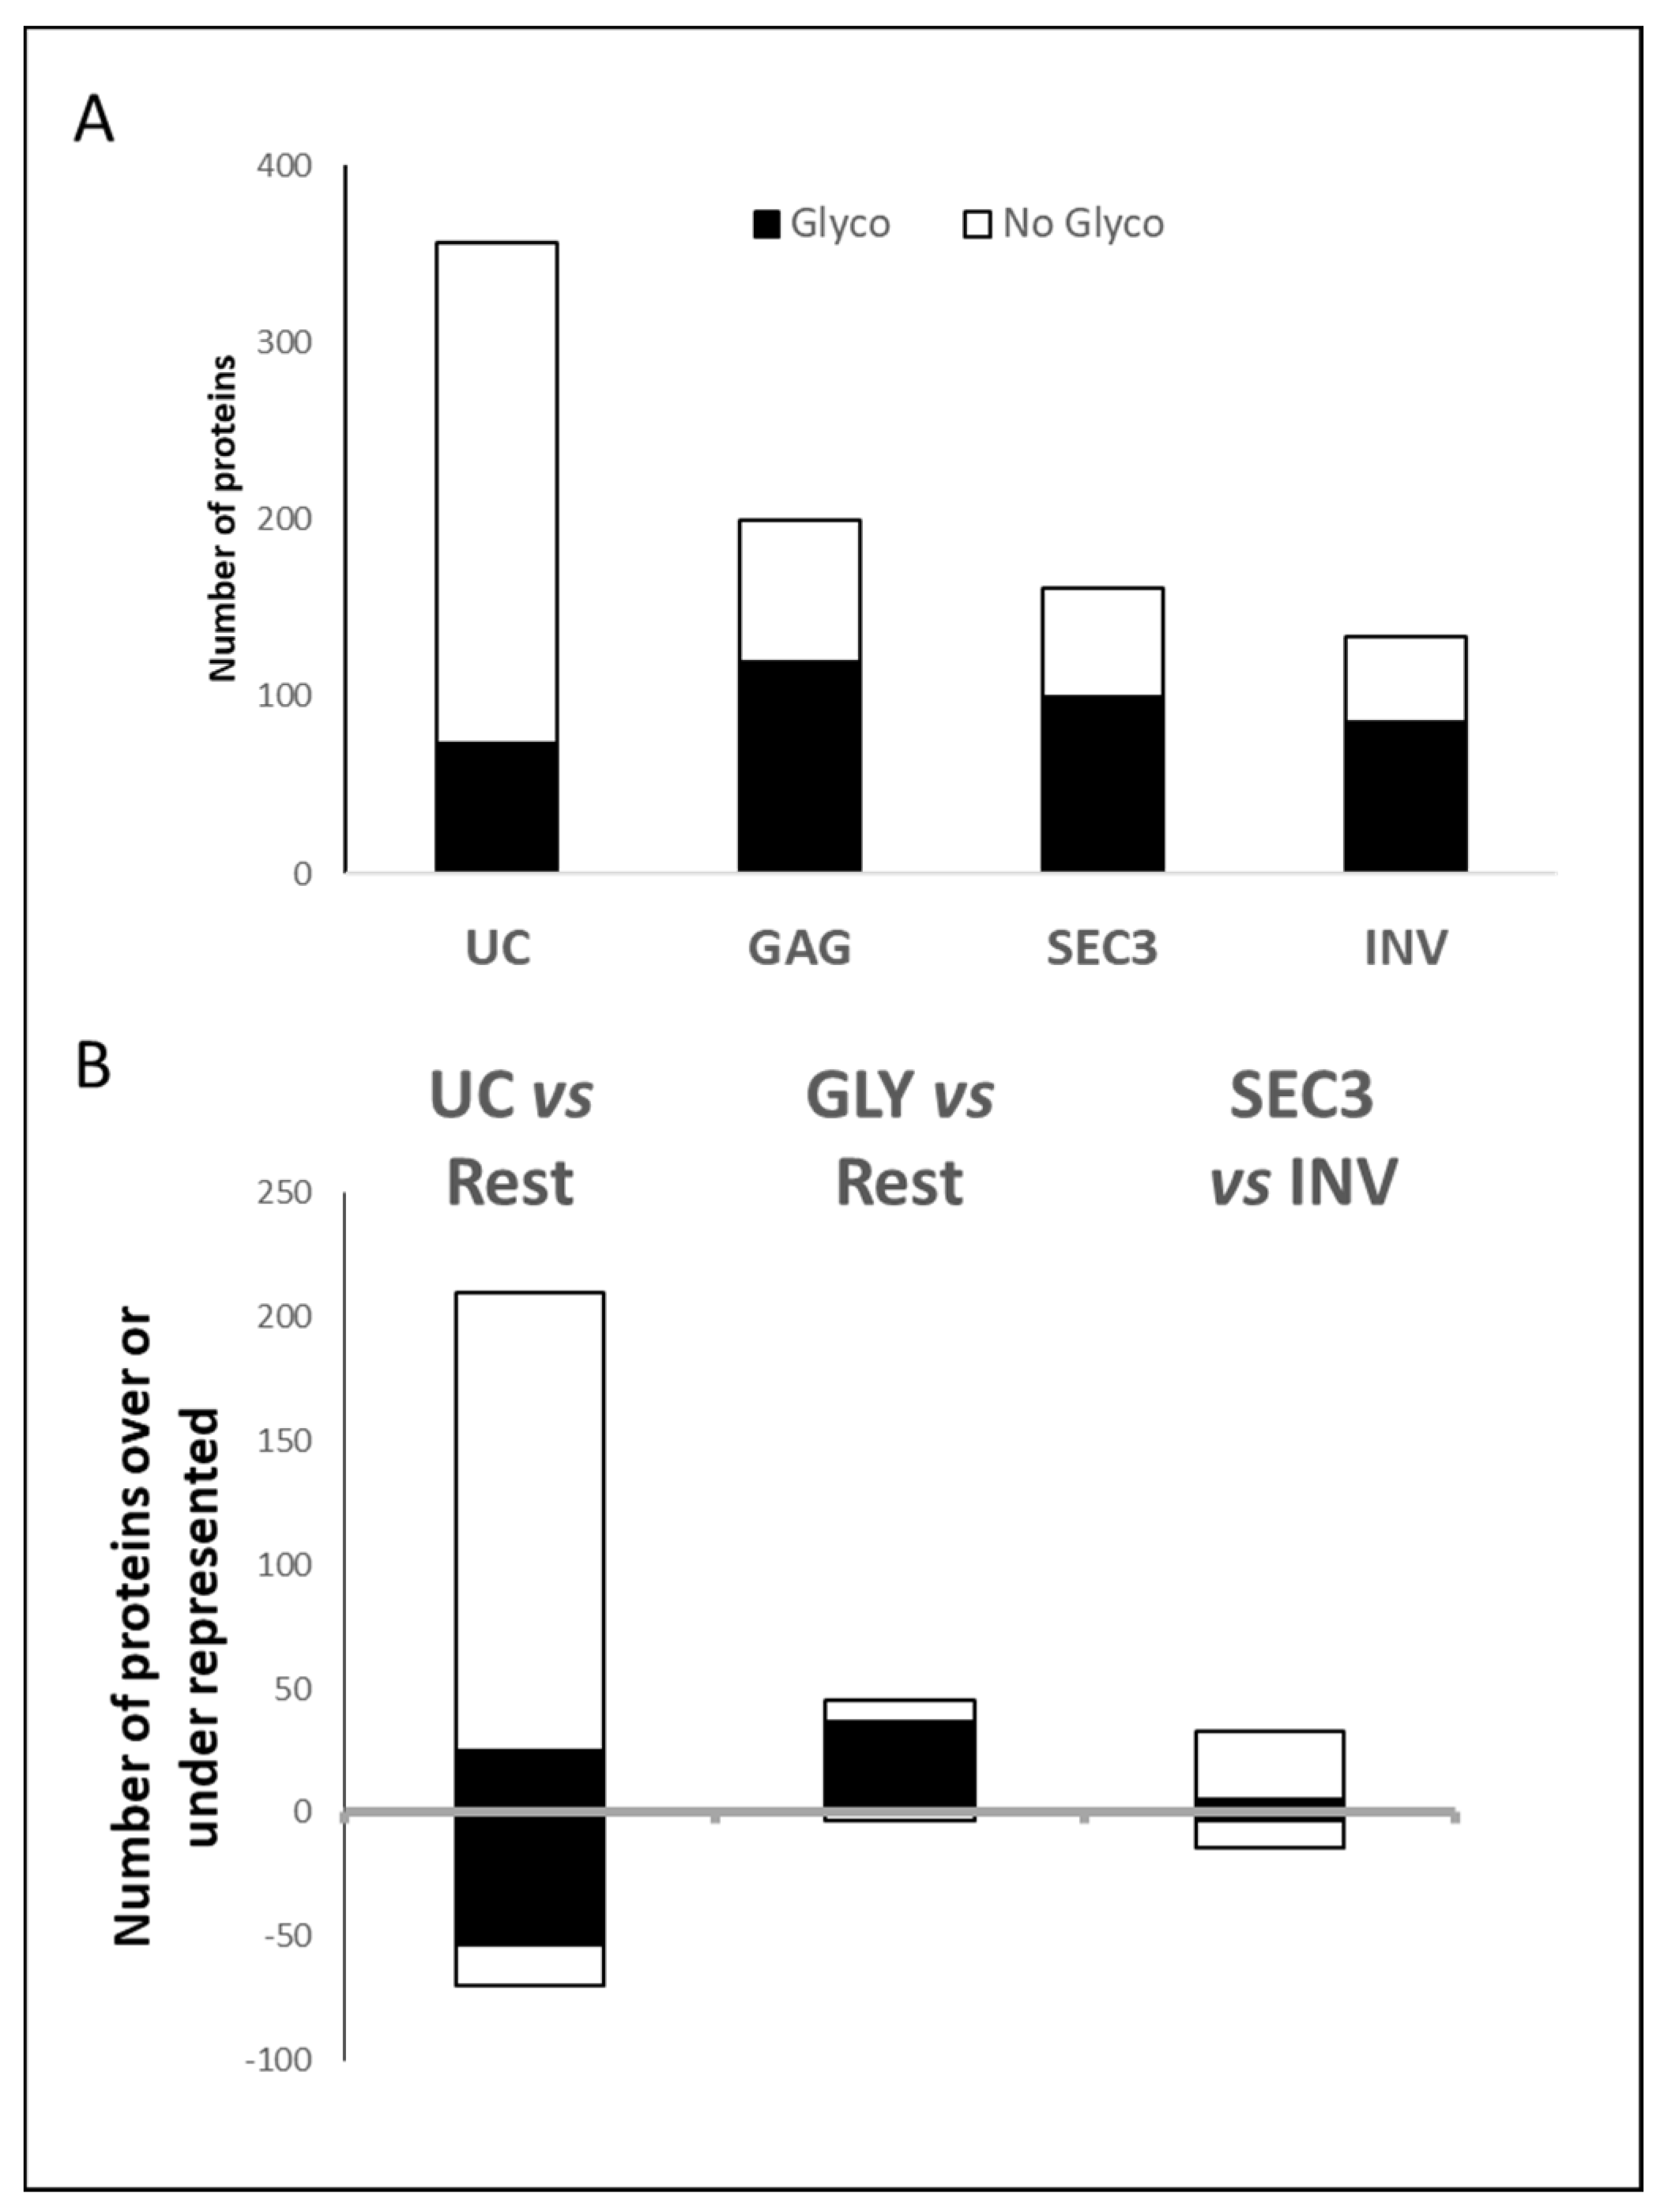
2.3. Profile of Proteins Captured with a Precipitation Kit with Affinity for Glycosylated Groups
2.4. Differences between the Preparations Performed with Size-Exclusion-Based Method with Respect to the Polymer-Based Precipitation Method
3. Discussion
4. Materials and Methods
4.1. Obtention of Human Serum Samples
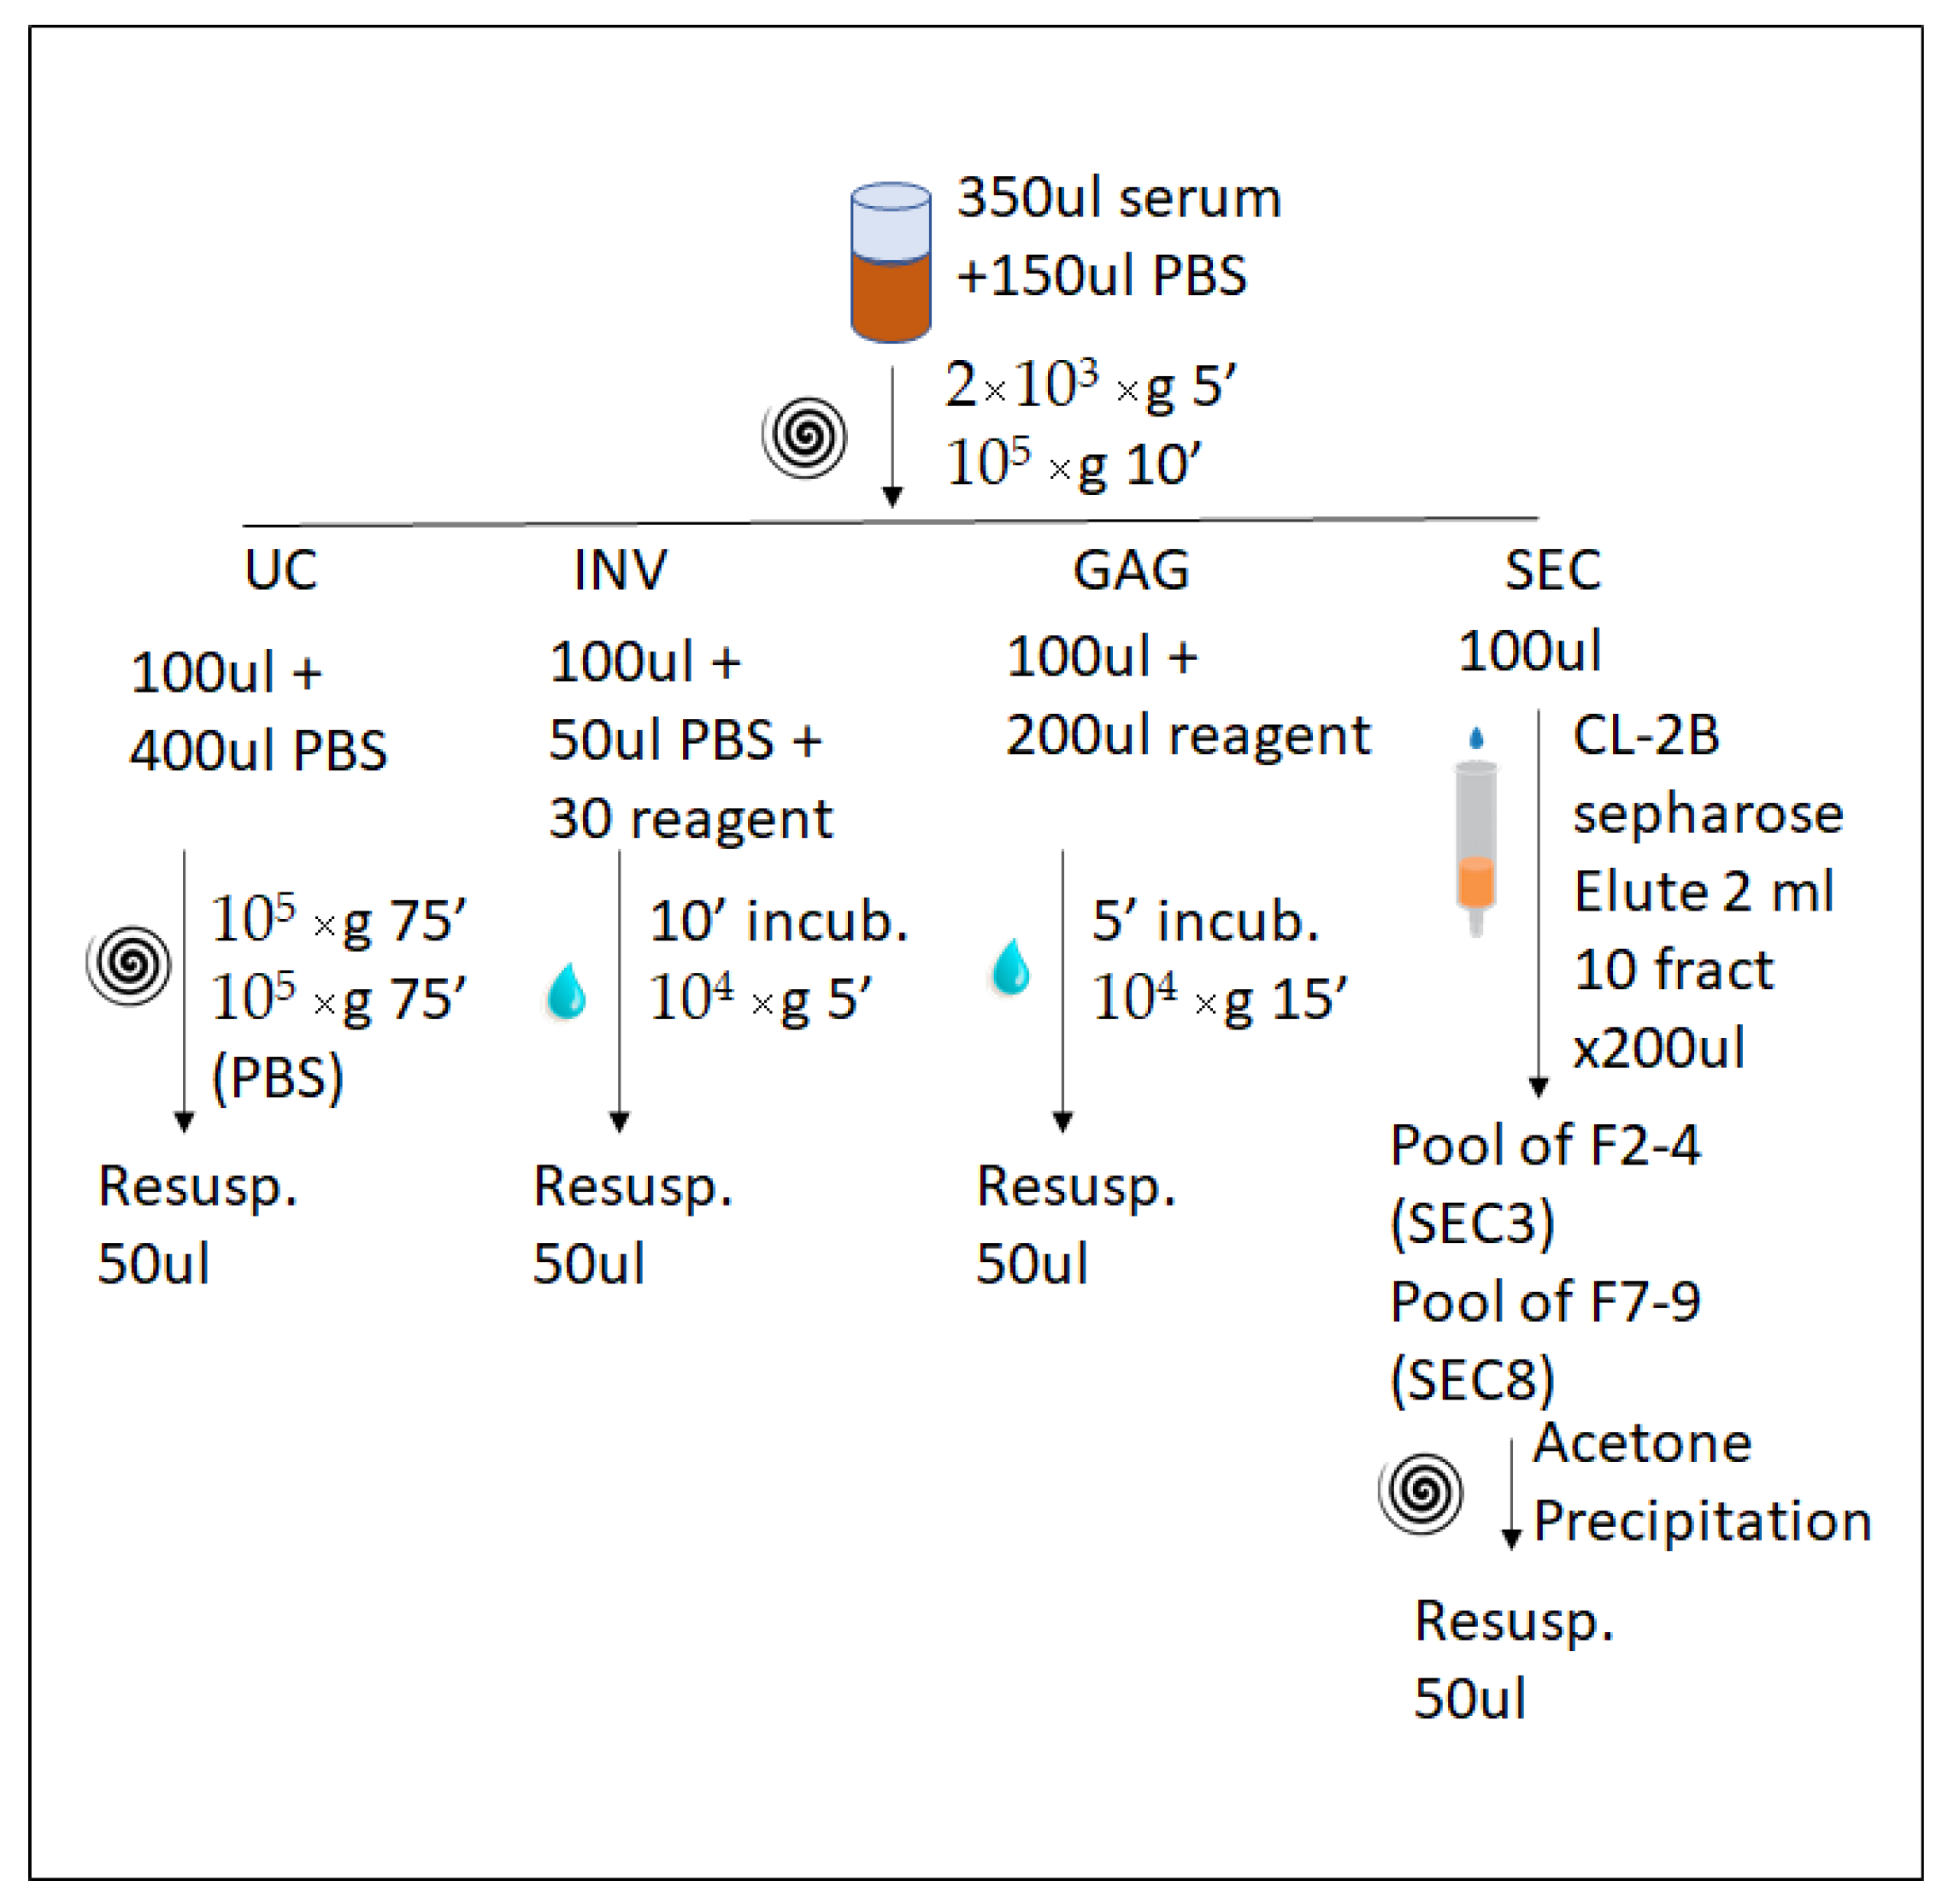
4.2. Enrichment of Extracellular Vesicles
4.3. EVs Characterization by Electron Microscopy and Nanoparticle-Tracking Analysis
4.4. Western Blot Analysis
4.5. Proteomics Analysis
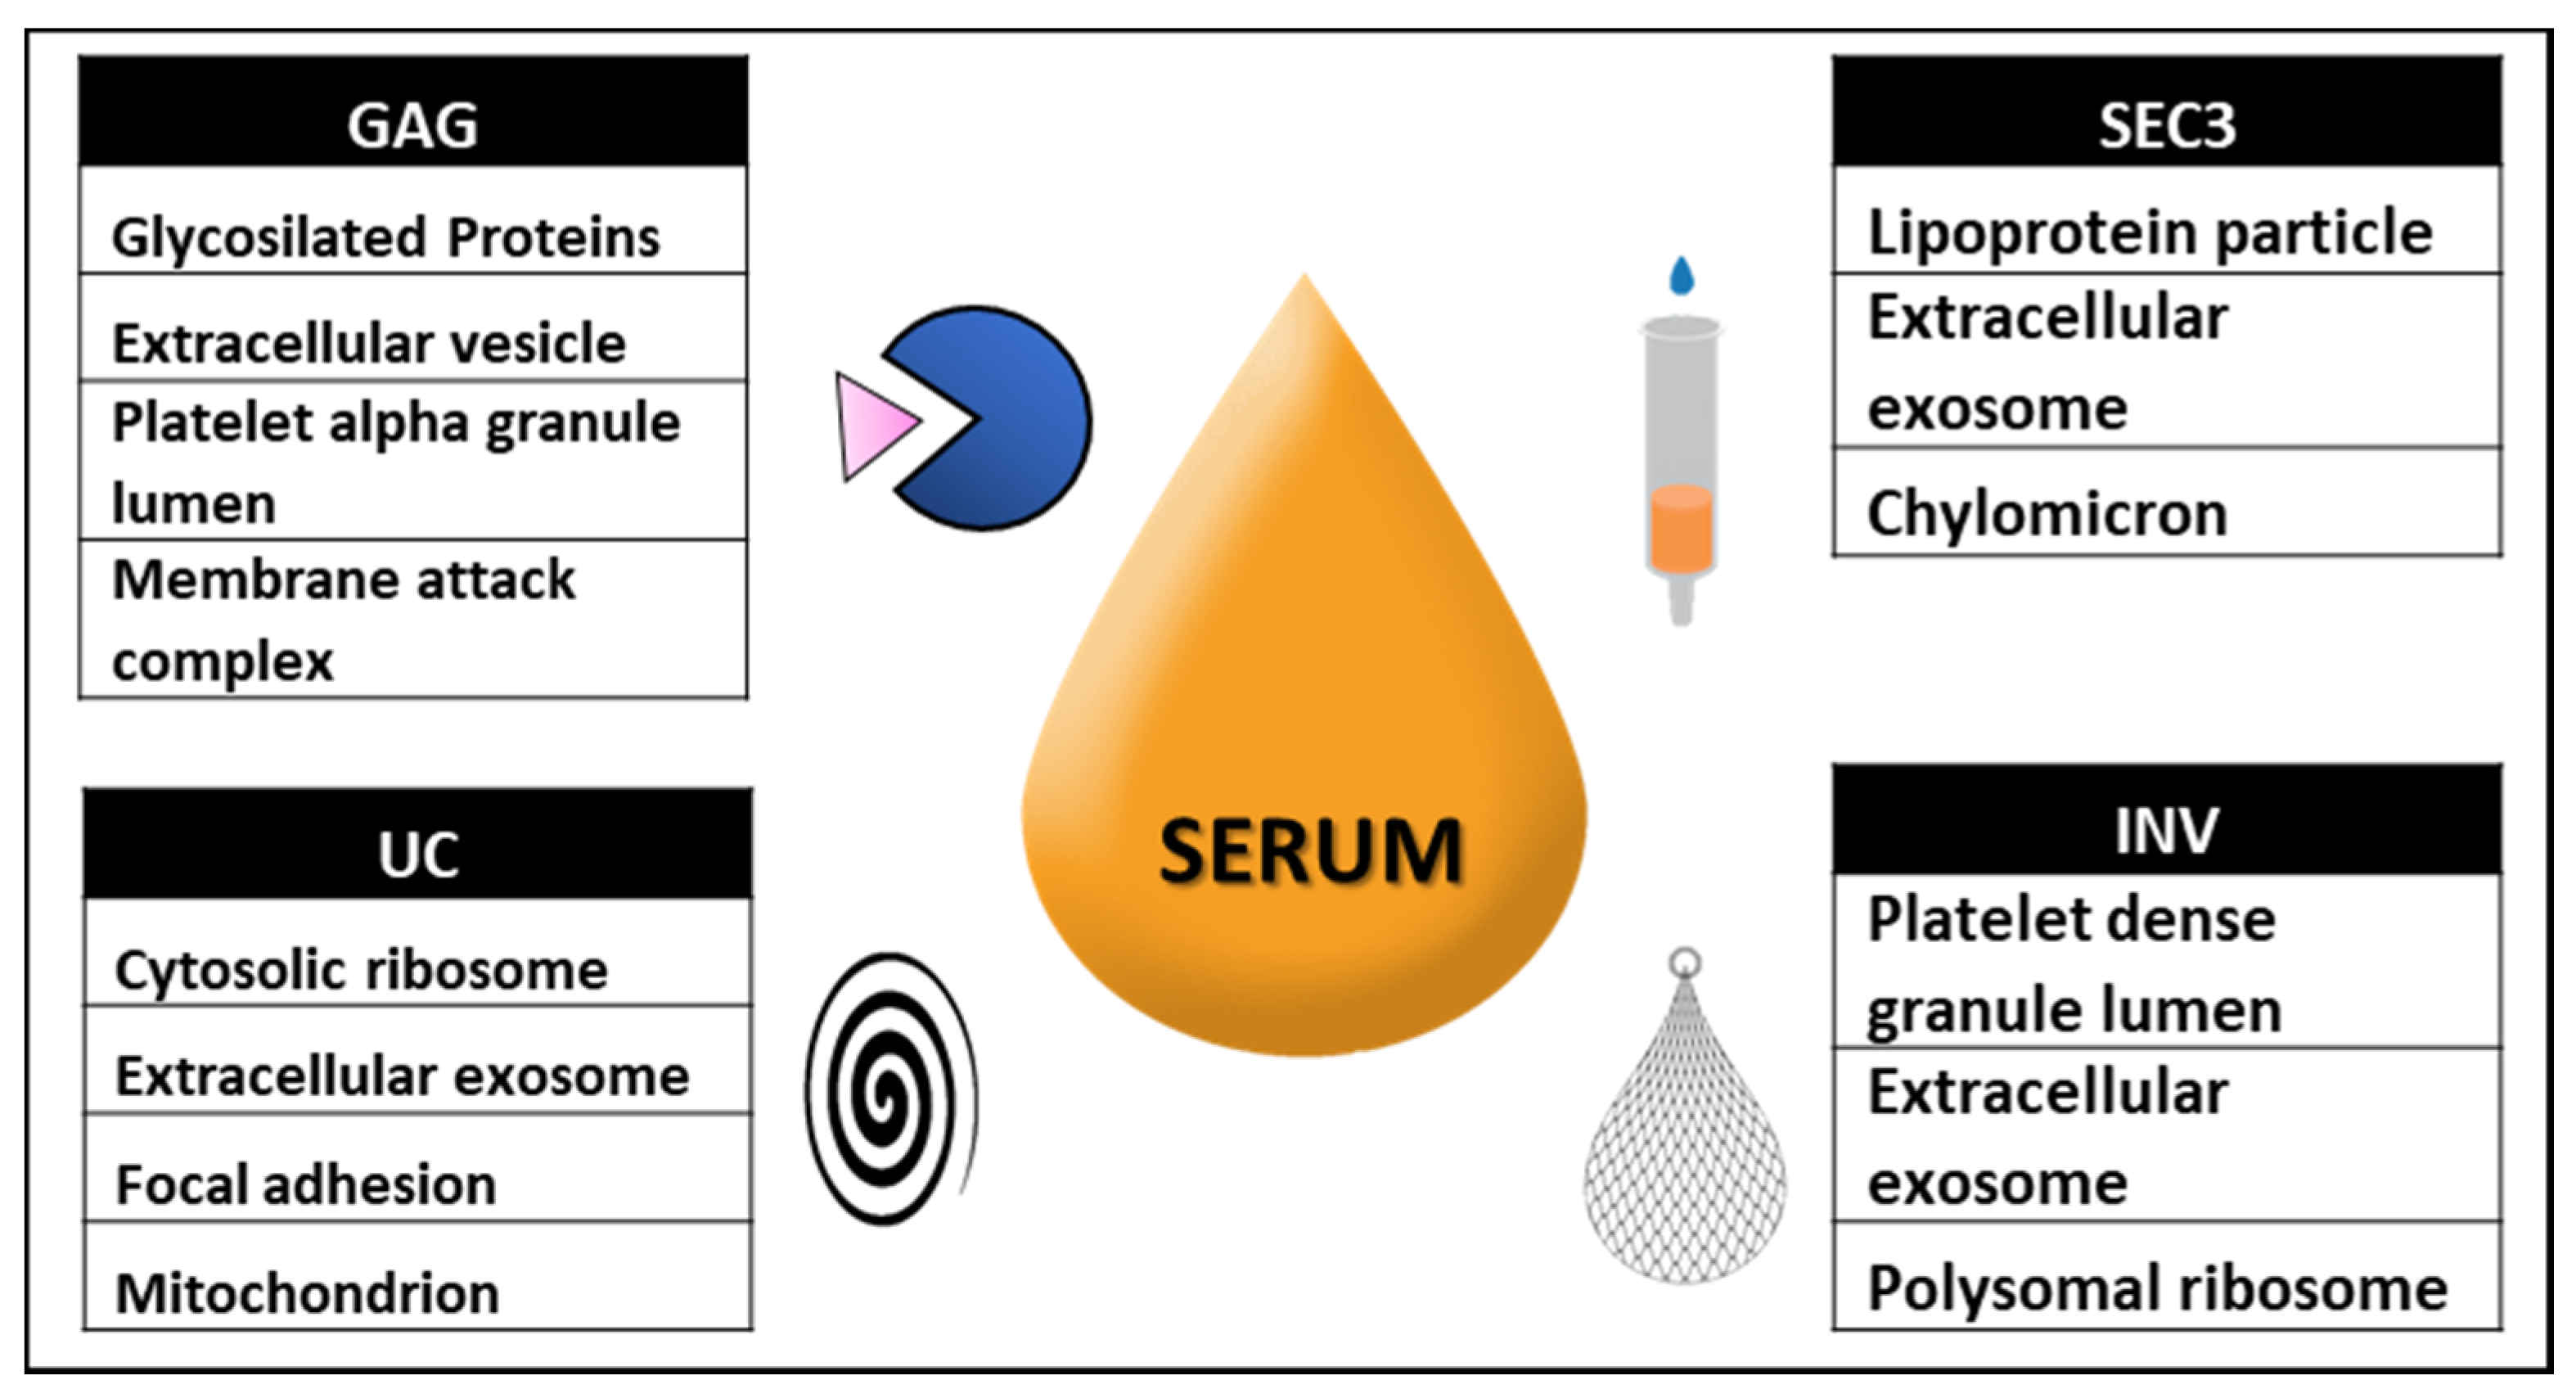
4.6. Cell Component Enrichment Analysis and Information on Glycosylation Sites
Supplementary Materials
Author Contributions
Funding
Institutional Review Board Statement
Informed Consent Statement
Data Availability Statement
Acknowledgments
Conflicts of Interest
References
- Huang, S.K.; Hoon, D.S. Liquid biopsy utility for the surveillance of cutaneous malignant melanoma patients. Mol. Oncol. 2016, 10, 450–463. [Google Scholar] [CrossRef]
- Lambrecht, J.; Tacke, F. Controversies and Opportunities in the Use of Inflammatory Markers for Diagnosis or Risk Prediction in Fatty Liver Disease. Front. Immunol. 2020, 11, 634409. [Google Scholar] [CrossRef]
- Ahmed, F.E. Sample preparation and fractionation for proteome analysis and cancer biomarker discovery by mass spectrometry. J. Sep. Sci. 2009, 32, 771–798. [Google Scholar] [CrossRef] [PubMed]
- Yu, W.; Hurley, J.; Roberts, D.; Chakrabortty, S.K.; Enderle, D.; Noerholm, M.; Breakefield, X.O.; Skog, J.K. Exosome-based liquid biopsies in cancer: Opportunities and challenges. Ann. Oncol. 2021, 32, 466–477. [Google Scholar] [CrossRef] [PubMed]
- Meldolesi, J. News about the Role of Fluid and Imaging Biomarkers in Neurodegenerative Diseases. Biomedicines 2021, 9, 252. [Google Scholar] [CrossRef] [PubMed]
- Badhwar, A.; Haqqani, A.S. Biomarker potential of brain-secreted extracellular vesicles in blood in Alzheimer’s disease. Alzheimers Dement. 2020, 12, e12001. [Google Scholar] [CrossRef] [PubMed]
- Khalife, J.; Sanchez, J.F.; Pichiorri, F. Extracellular Vesicles in Hematological Malignancies: From Biomarkers to Therapeutic Tools. Diagnostics 2020, 10, 1065. [Google Scholar] [CrossRef]
- Thangaraju, K.; Neerukonda, S.N.; Katneni, U.; Buehler, P.W. Extracellular Vesicles from Red Blood Cells and Their Evolving Roles in Health, Coagulopathy and Therapy. Int. J. Mol. Sci. 2021, 22, 153. [Google Scholar] [CrossRef] [PubMed]
- Shabangu, C.S.; Huang, J.F.; Hsiao, H.H.; Yu, M.L.; Chuang, W.L.; Wang, S.C. Liquid Biopsy for the Diagnosis of Viral Hepatitis, Fatty Liver Steatosis, and Alcoholic Liver Diseases. Int. J. Mol. Sci. 2020, 21, 3732. [Google Scholar] [CrossRef] [PubMed]
- Tsamesidis, I.; Reybier, K.; Marchetti, G.; Pau, M.C.; Virdis, P.; Fozza, C.; Nepveu, F.; Low, P.S.; Turrini, F.M.; Pantaleo, A. Syk Kinase Inhibitors Synergize with Artemisinins by Enhancing Oxidative Stress in Plasmodium falciparum-Parasitized Erythrocytes. Antioxidants 2020, 9, 753. [Google Scholar] [CrossRef]
- Tsamesidis, I.; Egwu, C.O.; Perio, P.; Augereau, J.M.; Benoit-Vical, F.; Reybier, K. An LC-MS Assay to Measure Superoxide Radicals and Hydrogen Peroxide in the Blood System. Metabolites 2020, 10, 175. [Google Scholar] [CrossRef] [PubMed]
- Ofori, K.; Bhagat, G.; Rai, A.J. Exosomes and extracellular vesicles as liquid biopsy biomarkers in diffuse large B-cell lymphoma: Current state of the art and unmet clinical needs. Br. J. Clin. Pharm. 2021, 87, 284–294. [Google Scholar] [CrossRef]
- He, X.; Park, S.; Chen, Y.; Lee, H. Extracellular Vesicle-Associated miRNAs as a Biomarker for Lung Cancer in Liquid Biopsy. Front. Mol. Biosci. 2021, 8, 630718. [Google Scholar] [CrossRef] [PubMed]
- Clayton, A.; Boilard, E.; Buzas, E.I.; Cheng, L.; Falcon-Perez, J.M.; Gardiner, C.; Gustafson, D.; Gualerzi, A.; Hendrix, A.; Hoffman, A.; et al. Considerations towards a roadmap for collection, handling and storage of blood extracellular vesicles. J. Extracell Vesicles 2019, 8, 1647027. [Google Scholar] [CrossRef] [Green Version]
- Karimi, N.; Cvjetkovic, A.; Jang, S.C.; Crescitelli, R.; Hosseinpour Feizi, M.A.; Nieuwland, R.; Lotvall, J.; Lasser, C. Detailed analysis of the plasma extracellular vesicle proteome after separation from lipoproteins. Cell Mol. Life Sci. 2018, 75, 2873–2886. [Google Scholar] [CrossRef] [Green Version]
- An, M.; Wu, J.; Zhu, J.; Lubman, D.M. Comparison of an Optimized Ultracentrifugation Method versus Size-Exclusion Chromatography for Isolation of Exosomes from Human Serum. J. Proteome Res. 2018, 17, 3599–3605. [Google Scholar] [CrossRef]
- Nguyen, H.Q.; Lee, D.; Kim, Y.; Bang, G.; Cho, K.; Lee, Y.S.; Yeon, J.E.; Lubman, D.M.; Kim, J. Label-free quantitative proteomic analysis of serum extracellular vesicles differentiating patients of alcoholic and nonalcoholic fatty liver diseases. J. Proteom. 2021, 245, 104278. [Google Scholar] [CrossRef]
- Royo, F.; Thery, C.; Falcon-Perez, J.M.; Nieuwland, R.; Witwer, K.W. Methods for Separation and Characterization of Extracellular Vesicles: Results of a Worldwide Survey Performed by the ISEV Rigor and Standardization Subcommittee. Cells 2020, 9, 1955. [Google Scholar] [CrossRef]
- Witwer, K.W.; Soekmadji, C.; Hill, A.F.; Wauben, M.H.; Buzas, E.I.; Di Vizio, D.; Falcon-Perez, J.M.; Gardiner, C.; Hochberg, F.; Kurochkin, I.V.; et al. Updating the MISEV minimal requirements for extracellular vesicle studies: Building bridges to reproducibility. J. Extracell Vesicles 2017, 6, 1396823. [Google Scholar] [CrossRef] [PubMed] [Green Version]
- Smolarz, M.; Pietrowska, M.; Matysiak, N.; Mielanczyk, L.; Widlak, P. Proteome Profiling of Exosomes Purified from a Small Amount of Human Serum: The Problem of Co-Purified Serum Components. Proteomes 2019, 7, 18. [Google Scholar] [CrossRef] [PubMed] [Green Version]
- de Menezes-Neto, A.; Saez, M.J.; Lozano-Ramos, I.; Segui-Barber, J.; Martin-Jaular, L.; Ullate, J.M.; Fernandez-Becerra, C.; Borras, F.E.; Del Portillo, H.A. Size-exclusion chromatography as a stand-alone methodology identifies novel markers in mass spectrometry analyses of plasma-derived vesicles from healthy individuals. J. Extracell Vesicles 2015, 4, 27378. [Google Scholar] [CrossRef] [Green Version]
- Arbelaiz, A.; Azkargorta, M.; Krawczyk, M.; Santos-Laso, A.; Lapitz, A.; Perugorria, M.J.; Erice, O.; Gonzalez, E.; Jimenez-Aguero, R.; Lacasta, A.; et al. Serum extracellular vesicles contain protein biomarkers for primary sclerosing cholangitis and cholangiocarcinoma. Hepatology 2017, 66, 1125–1143. [Google Scholar] [CrossRef]
- Zhang, H.; Freitas, D.; Kim, H.S.; Fabijanic, K.; Li, Z.; Chen, H.; Mark, M.T.; Molina, H.; Martin, A.B.; Bojmar, L.; et al. Identification of distinct nanoparticles and subsets of extracellular vesicles by asymmetric flow field-flow fractionation. Nat. Cell Biol. 2018, 20, 332–343. [Google Scholar] [CrossRef]
- Wu, B.; Chen, X.; Wang, J.; Qing, X.; Wang, Z.; Ding, X.; Xie, Z.; Niu, L.; Guo, X.; Cai, T.; et al. Separation and characterization of extracellular vesicles from human plasma by asymmetrical flow field-flow fractionation. Anal. Chim. Acta 2020, 1127, 234–245. [Google Scholar] [CrossRef] [PubMed]
- Pieragostino, D.; Lanuti, P.; Cicalini, I.; Cufaro, M.C.; Ciccocioppo, F.; Ronci, M.; Simeone, P.; Onofrj, M.; van der Pol, E.; Fontana, A.; et al. Proteomics characterization of extracellular vesicles sorted by flow cytometry reveals a disease-specific molecular cross-talk from cerebrospinal fluid and tears in multiple sclerosis. J. Proteom. 2019, 204, 103403. [Google Scholar] [CrossRef] [PubMed]
- Boing, A.N.; van der Pol, E.; Grootemaat, A.E.; Coumans, F.A.; Sturk, A.; Nieuwland, R. Single-step isolation of extracellular vesicles by size-exclusion chromatography. J. Extracell Vesicles 2014, 3, 23430. [Google Scholar] [CrossRef] [PubMed]
- Wisniewski, J.R.; Zougman, A.; Nagaraj, N.; Mann, M. Universal sample preparation method for proteome analysis. Nat. Methods 2009, 6, 359–362. [Google Scholar] [CrossRef] [PubMed]
- Raudvere, U.; Kolberg, L.; Kuzmin, I.; Arak, T.; Adler, P.; Peterson, H.; Vilo, J. g:Profiler: A web server for functional enrichment analysis and conversions of gene lists (2019 update). Nucleic Acids Res. 2019, 47, W191–W198. [Google Scholar] [CrossRef] [Green Version]


| #Term ID | Term Description | Term Size | Intersected | p Adjusted |
|---|---|---|---|---|
| GO:0022626 | cytosolic ribosome | 104 | 46 | 3.05 × 10−59 |
| GO:0070062 | extracellular exosome | 2177 | 100 | 5.52 × 10⁻³⁴ |
| GO:0005925 | focal adhesion | 384 | 38 | 1.48 × 10⁻²¹ |
| GO:0005739 | mitochondrion | 1380 | 66 | 5.04 × 10⁻²¹ |
| GO:0015934 | large ribosomal subunit | 113 | 24 | 5.84 × 10⁻²¹ |
| GO:0031966 | mitochondrial membrane | 573 | 44 | 7.98 × 10⁻²¹ |
| GO:0072562 | blood microparticle | 138 | 44 | 2.97 × 10−79 |
| GO:0070062 | extracellular exosome | 2177 | 51 | 4.92 × 10⁻³⁴ |
| GO:0062023 | collagen-containing extracellular matrix | 381 | 23 | 1.84 × 10⁻²⁰ |
| GO:0034358 | plasma lipoprotein particle | 23 | 7 | 2.93 × 10⁻¹⁰ |
| GO:0031093 | platelet alpha granule lumen | 66 | 9 | 3.79 × 10⁻¹⁰ |
| GO:0005579 | membrane attack complex | 6 | 5 | 7.24 × 10⁻¹⁰ |
| GO:0042571 | immunoglobulin complex, circulating | 75 | 9 | 1.26 × 10⁻⁹ |
| GO:0034361 | very-low-density lipoprotein particle | 15 | 6 | 1.91 × 10⁻⁹ |
| GO:0034385 | triglyceride-rich plasma lipoprotein particle | 15 | 6 | 1.91 × 10⁻⁹ |
| #Term ID | Term Description | Term Size | Intersected | p Adjusted |
|---|---|---|---|---|
| GO:0072562 | blood microparticle | 138 | 21 | 3.78 × 10⁻³¹ |
| GO:1903561 | extracellular vesicle | 2262 | 32 | 1.37 × 10⁻¹⁷ |
| GO:0031093 | platelet alpha granule lumen | 66 | 9 | 1.15 × 10⁻¹¹ |
| GO:0005579 | membrane attack complex | 6 | 4 | 1.15 × 10⁻⁷ |
| #Term ID | Term Description | Term Size | Intersected | p Adjusted |
|---|---|---|---|---|
| GO:0072562 | blood microparticle | 138 | 20 | 1.13 × 10⁻³² |
| GO:1990777 | lipoprotein particle | 23 | 8 | 5.31 × 10⁻¹⁵ |
| GO:0070062 | extracellular exosome | 2177 | 25 | 8.04 × 10⁻¹⁵ |
| GO:0042627 | chylomicron | 10 | 5 | 8.13 × 10⁻¹⁰ |
| GO:0031089 | platelet dense granule lumen | 14 | 2 | 0.00270 |
| GO:0070062 | extracellular exosome | 2177 | 7 | 0.00418 |
| GO:0042788 | polysomal ribosome | 31 | 2 | 0.013765 |
| #Term ID | Term Description | Term Size | Intersected | p Adjusted |
|---|---|---|---|---|
| GO:0072562 | blood microparticle | 138 | 22 | 1.47 × 10−38 |
| GO:0070062 | extracellular exosome | 2177 | 21 | 1.16 × 10⁻¹⁰ |
| GO:0071746 | IgA immunoglobulin complex, circulating | 5 | 3 | 1.03 × 10⁻⁵ |
| GO:1990777 | lipoprotein particle | 23 | 4 | 1.39 × 10⁻⁵ |
| GO:0031093 | platelet alpha granule lumen | 66 | 5 | 2.01 × 10⁻⁵ |
| Identified 3 Replicates | Top 100 Vesiclepedia | Ref [16] | Ref [11,16] | |
|---|---|---|---|---|
| UC | 342 | 28 | 105 | 49 |
| GAG | 194 | 16 | 114 | 85 |
| SEC3 | 157 | 8 | 115 | 86 |
| INV | 131 | 6 | 108 | 76 |
Publisher’s Note: MDPI stays neutral with regard to jurisdictional claims in published maps and institutional affiliations. |
© 2021 by the authors. Licensee MDPI, Basel, Switzerland. This article is an open access article distributed under the terms and conditions of the Creative Commons Attribution (CC BY) license (https://creativecommons.org/licenses/by/4.0/).
Share and Cite
Azkargorta, M.; Iloro, I.; Escobes, I.; Cabrera, D.; Falcon-Perez, J.M.; Elortza, F.; Royo, F. Human Serum Extracellular Vesicle Proteomic Profile Depends on the Enrichment Method Employed. Int. J. Mol. Sci. 2021, 22, 11144. https://doi.org/10.3390/ijms222011144
Azkargorta M, Iloro I, Escobes I, Cabrera D, Falcon-Perez JM, Elortza F, Royo F. Human Serum Extracellular Vesicle Proteomic Profile Depends on the Enrichment Method Employed. International Journal of Molecular Sciences. 2021; 22(20):11144. https://doi.org/10.3390/ijms222011144
Chicago/Turabian StyleAzkargorta, Mikel, Ibon Iloro, Iraide Escobes, Diana Cabrera, Juan M. Falcon-Perez, Felix Elortza, and Felix Royo. 2021. "Human Serum Extracellular Vesicle Proteomic Profile Depends on the Enrichment Method Employed" International Journal of Molecular Sciences 22, no. 20: 11144. https://doi.org/10.3390/ijms222011144
APA StyleAzkargorta, M., Iloro, I., Escobes, I., Cabrera, D., Falcon-Perez, J. M., Elortza, F., & Royo, F. (2021). Human Serum Extracellular Vesicle Proteomic Profile Depends on the Enrichment Method Employed. International Journal of Molecular Sciences, 22(20), 11144. https://doi.org/10.3390/ijms222011144