
Optimization of Advanced Live-Cell Imaging through Red/Near-Infrared Dye Labeling and Fluorescence Lifetime-Based Strategies

 , , ,
, , , 
Abstract
:1. Introduction
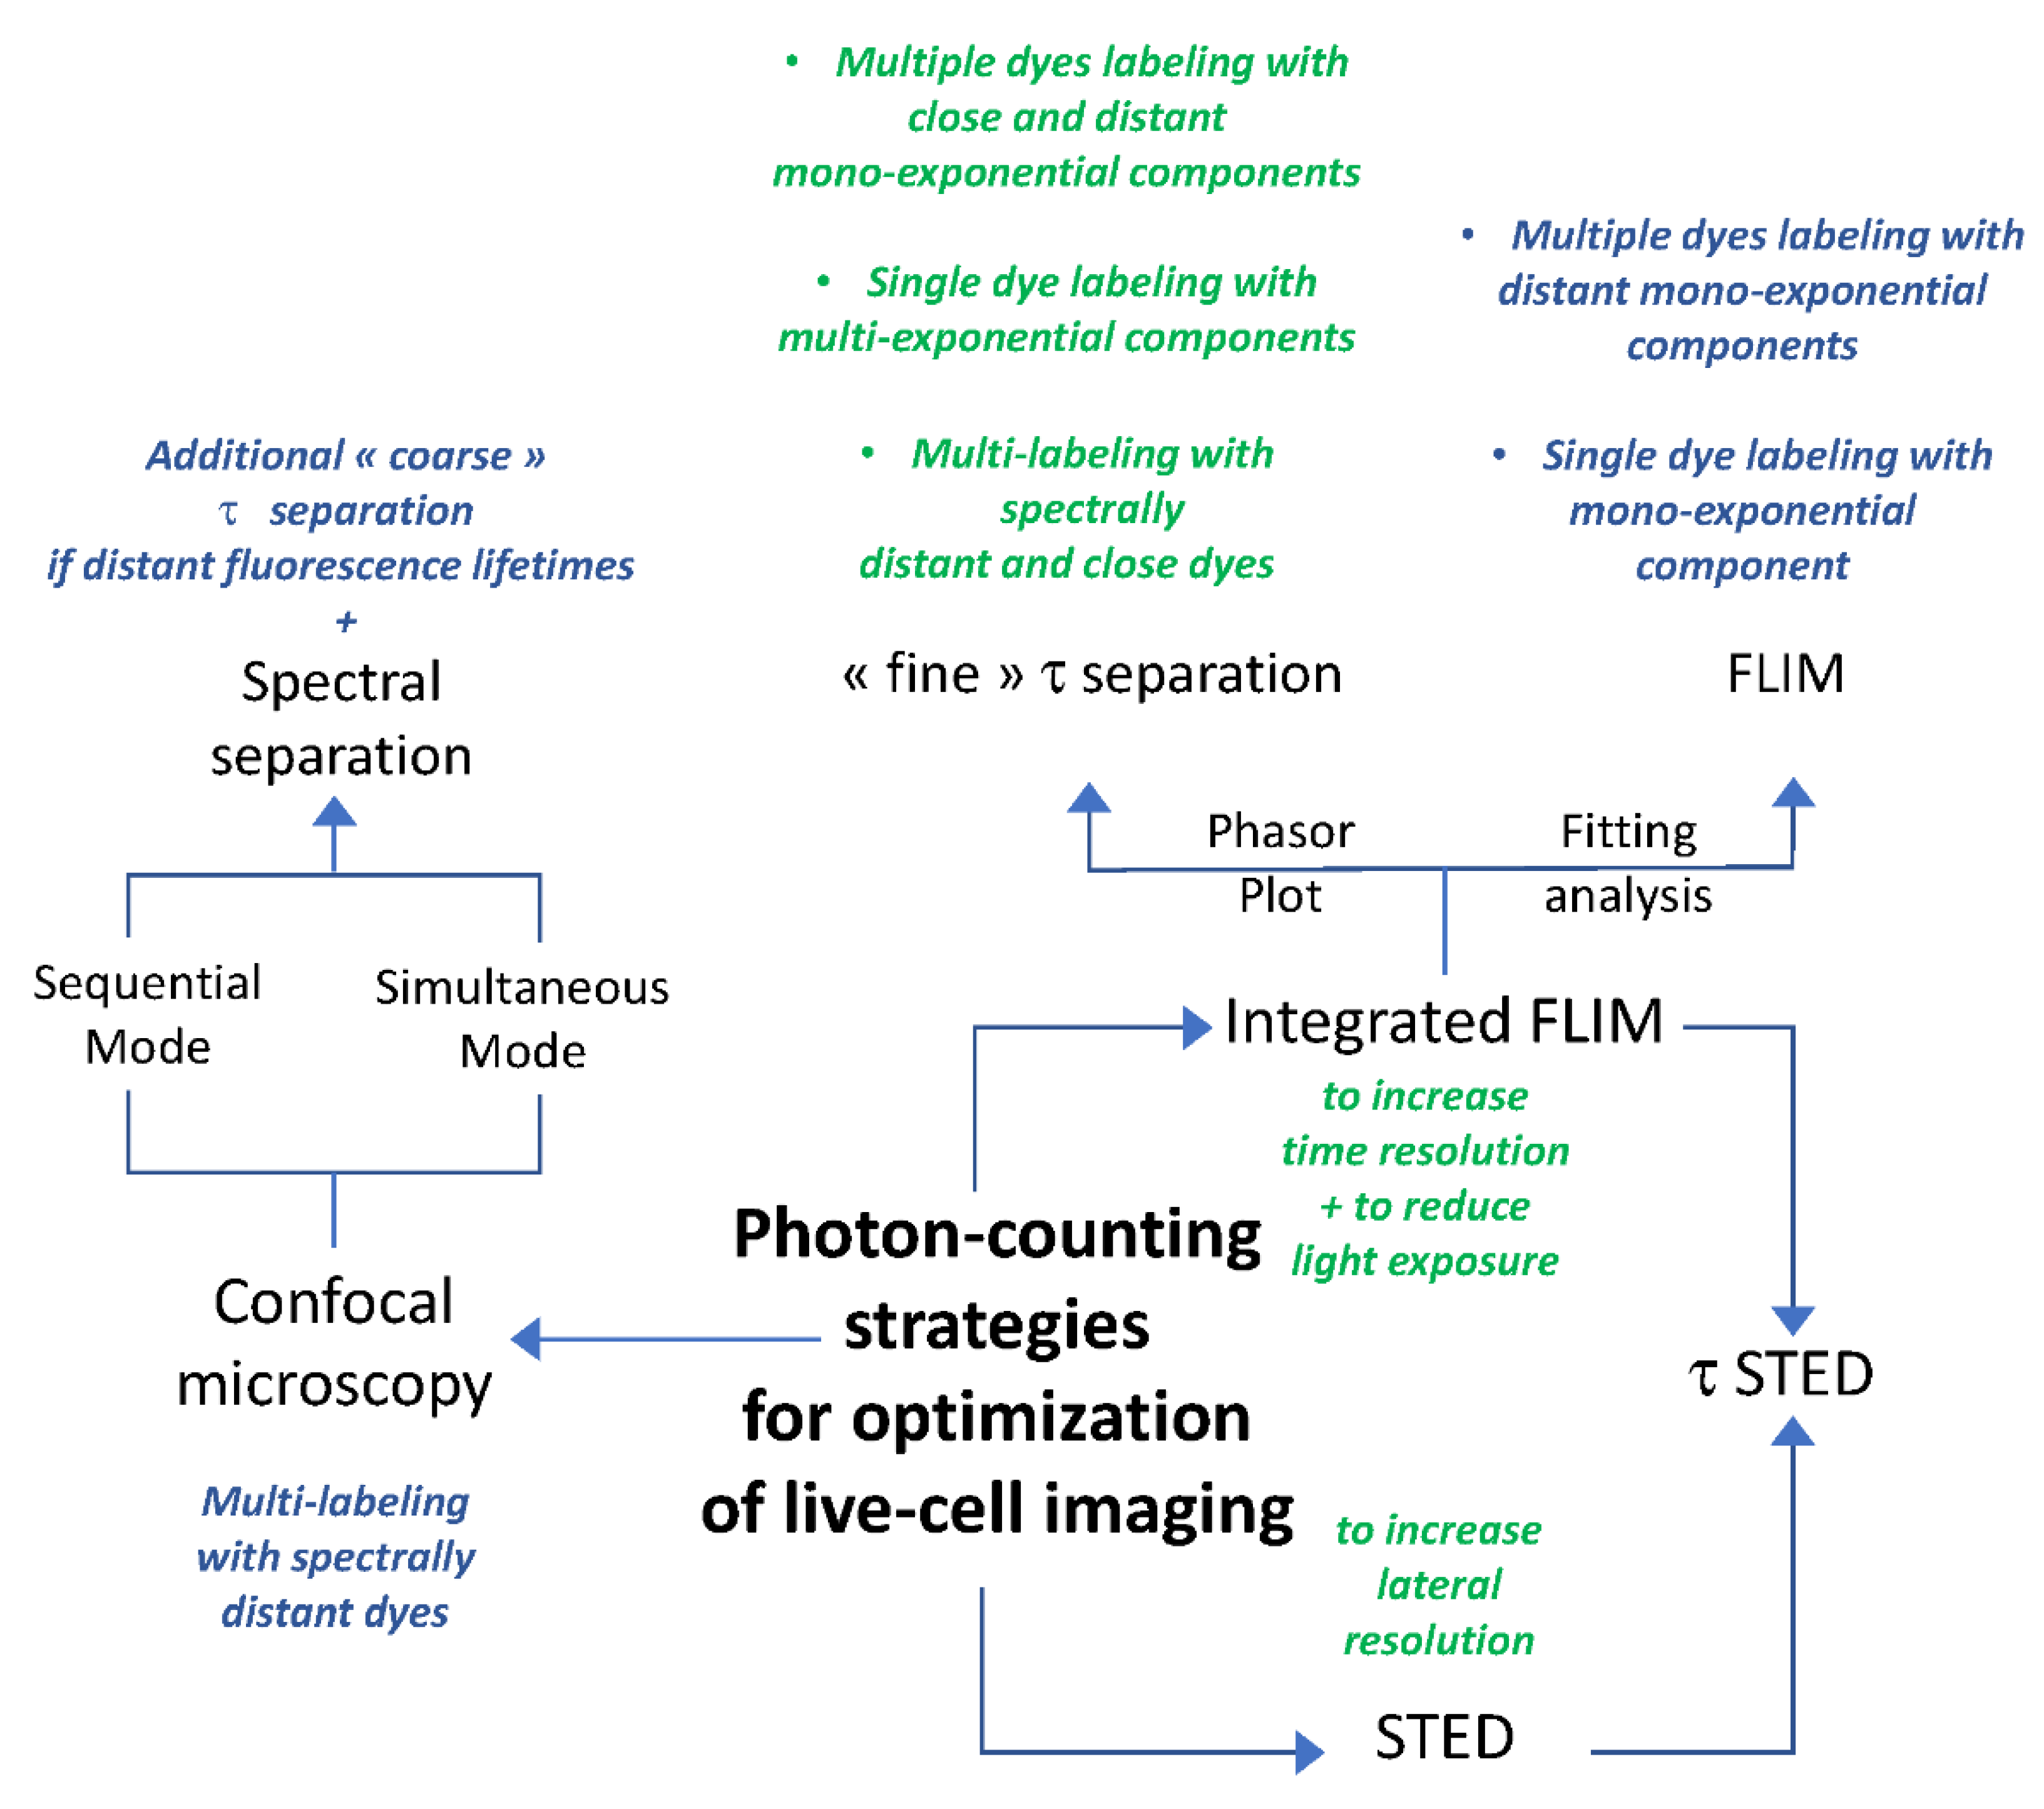
2. Results
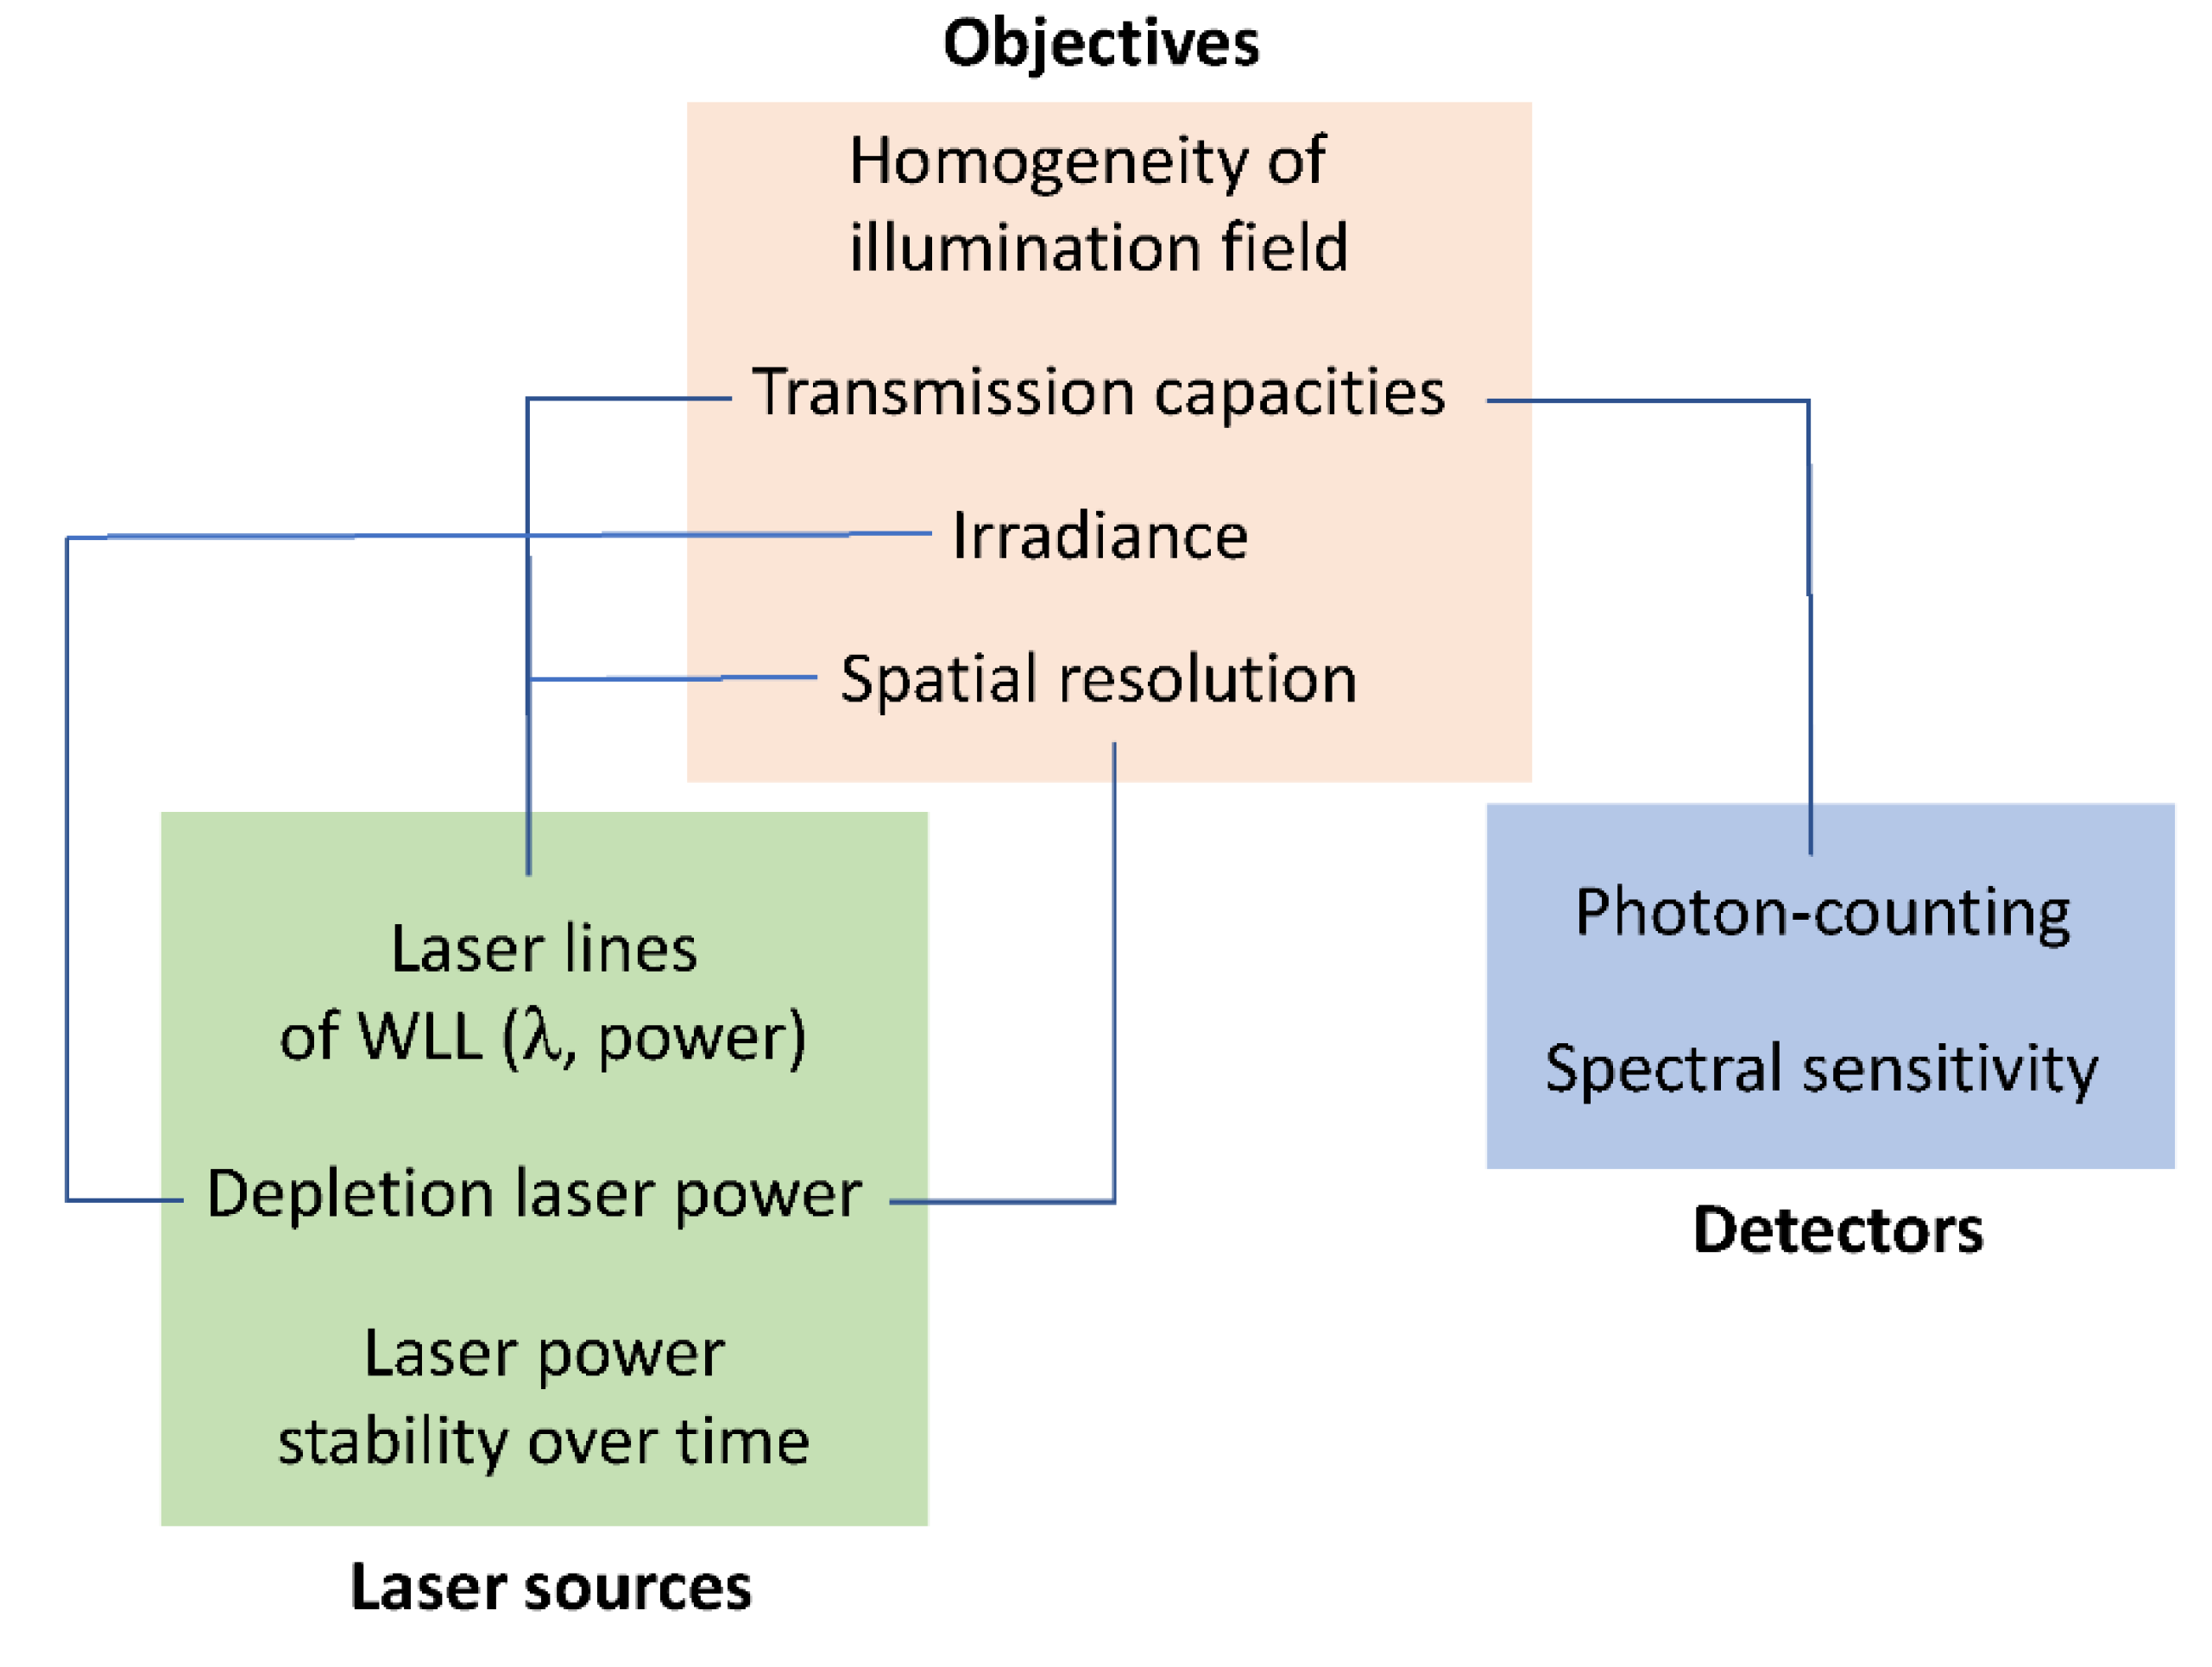
2.1. Optimization of Instrumental Configuration for Live-Cell Imaging
2.2. Optimization of Live-Cell Imaging through Confocal Microscopy and FLIM
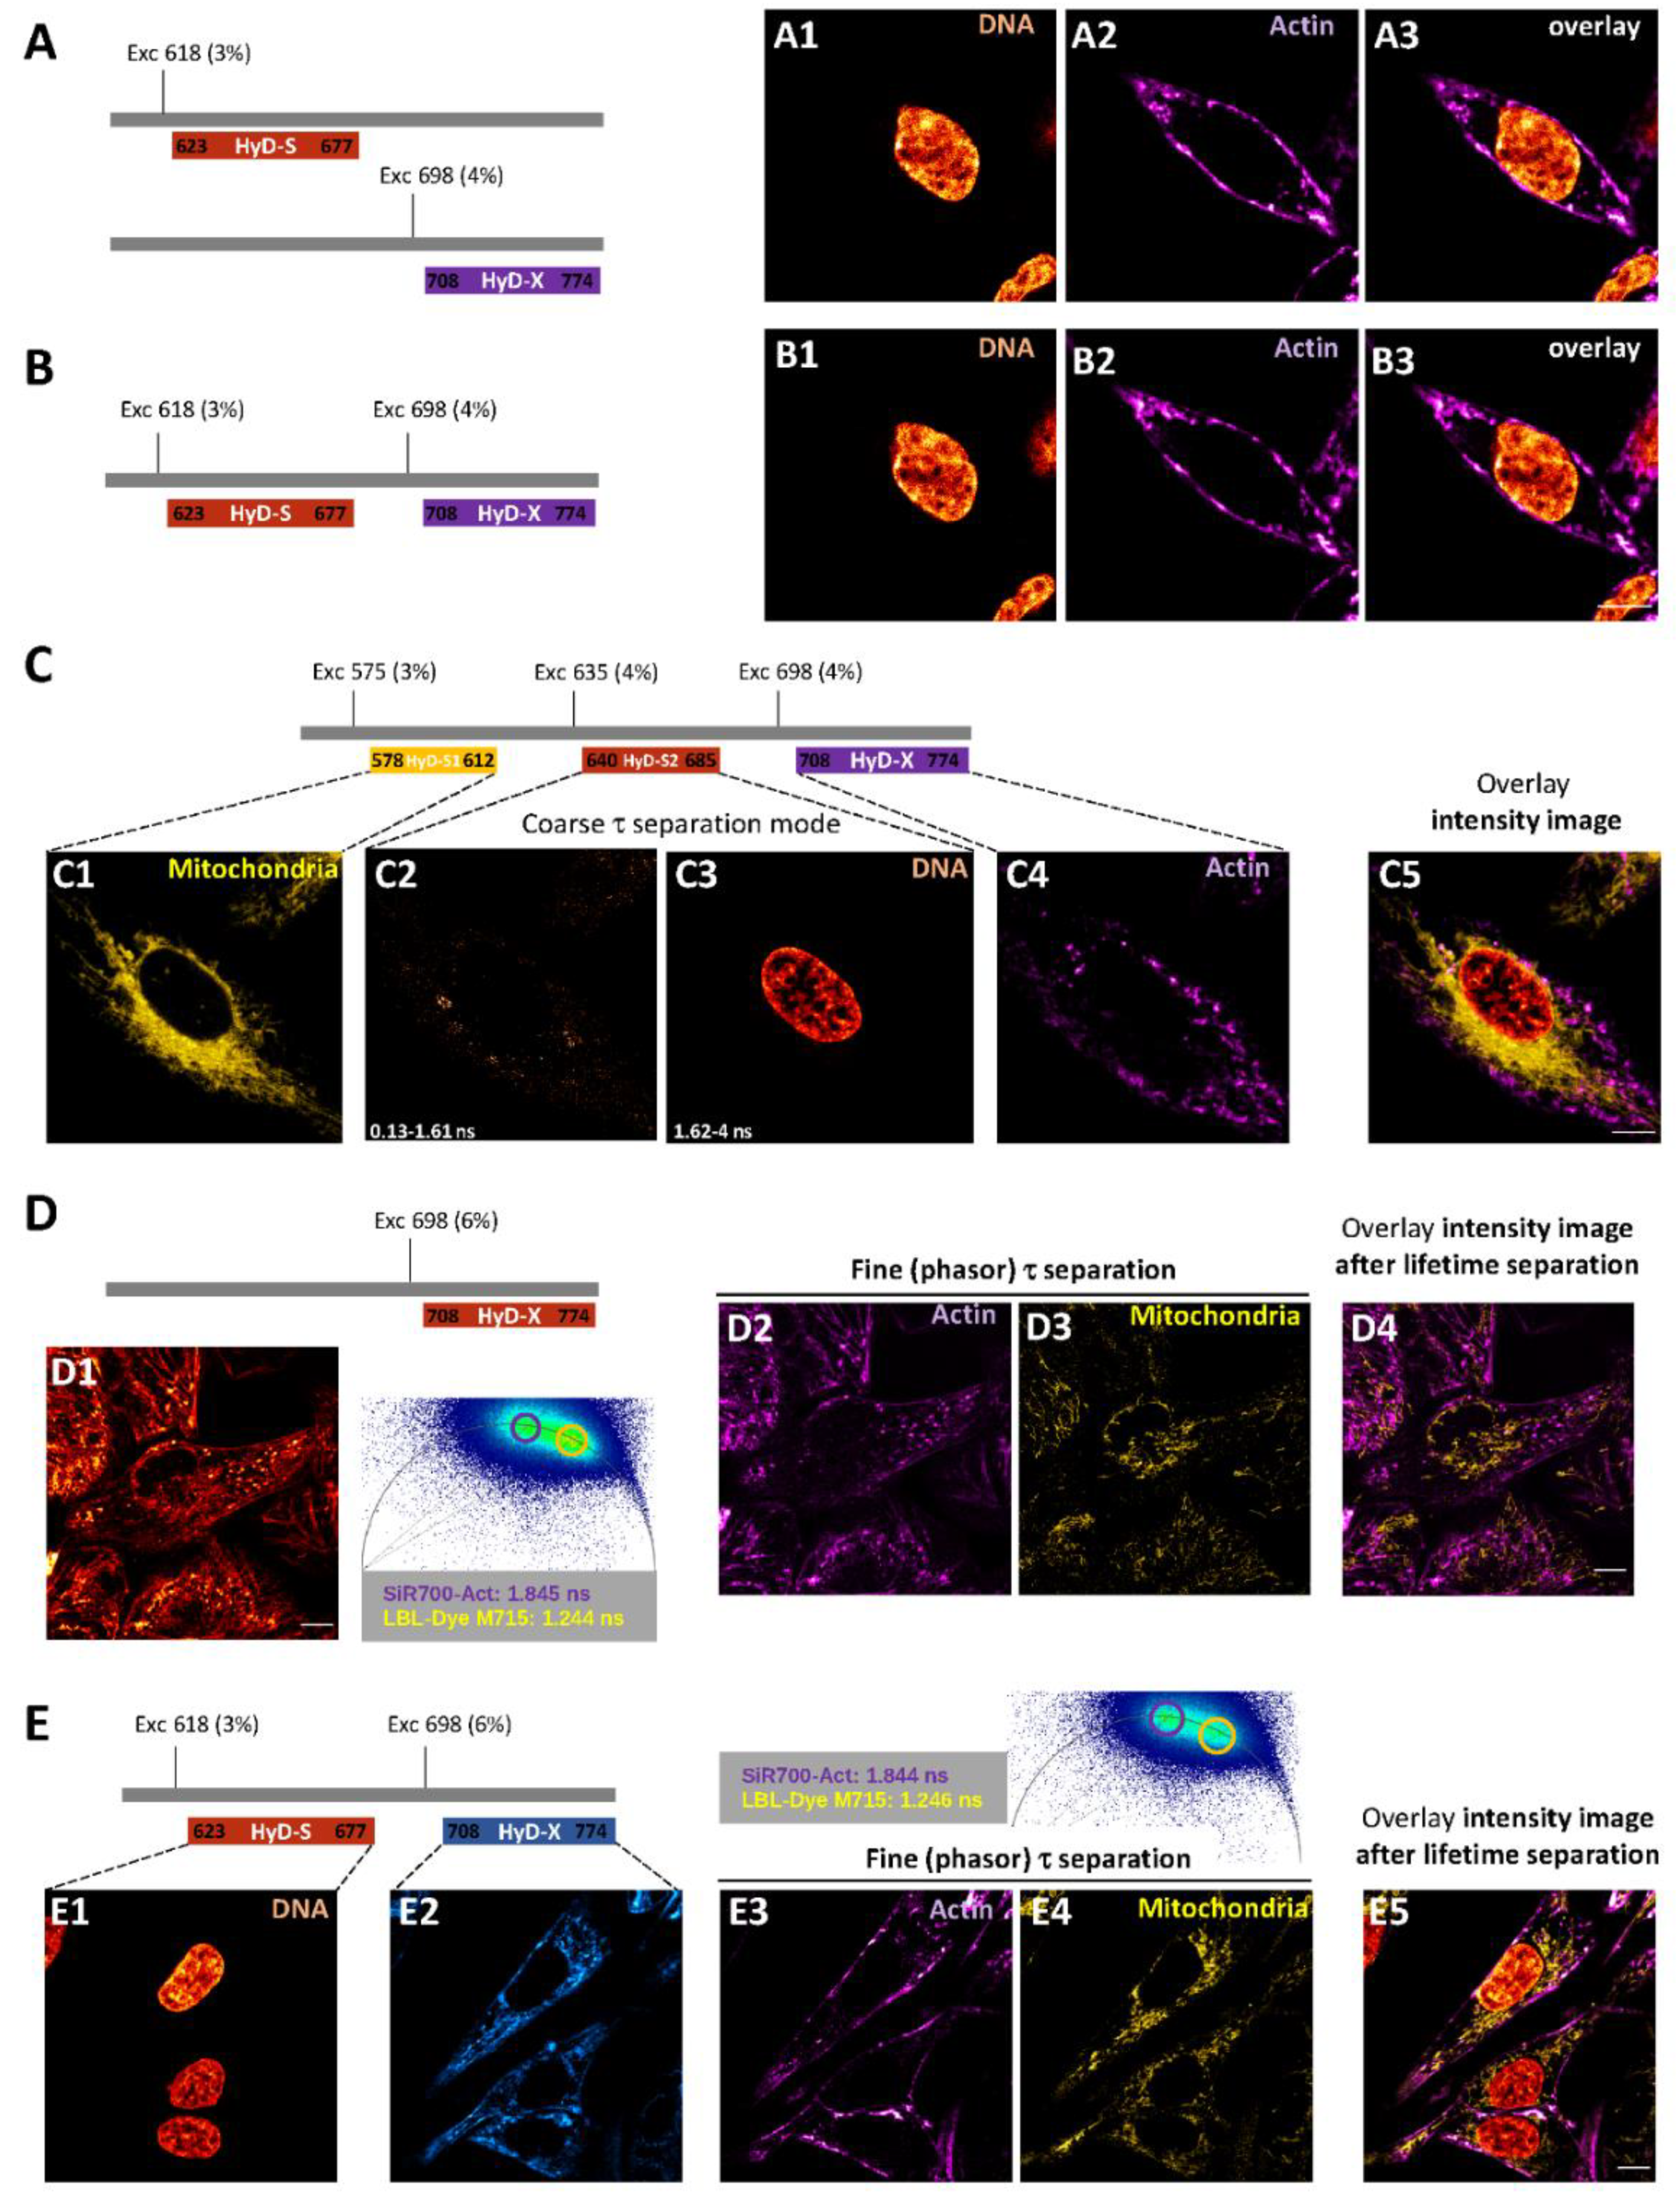
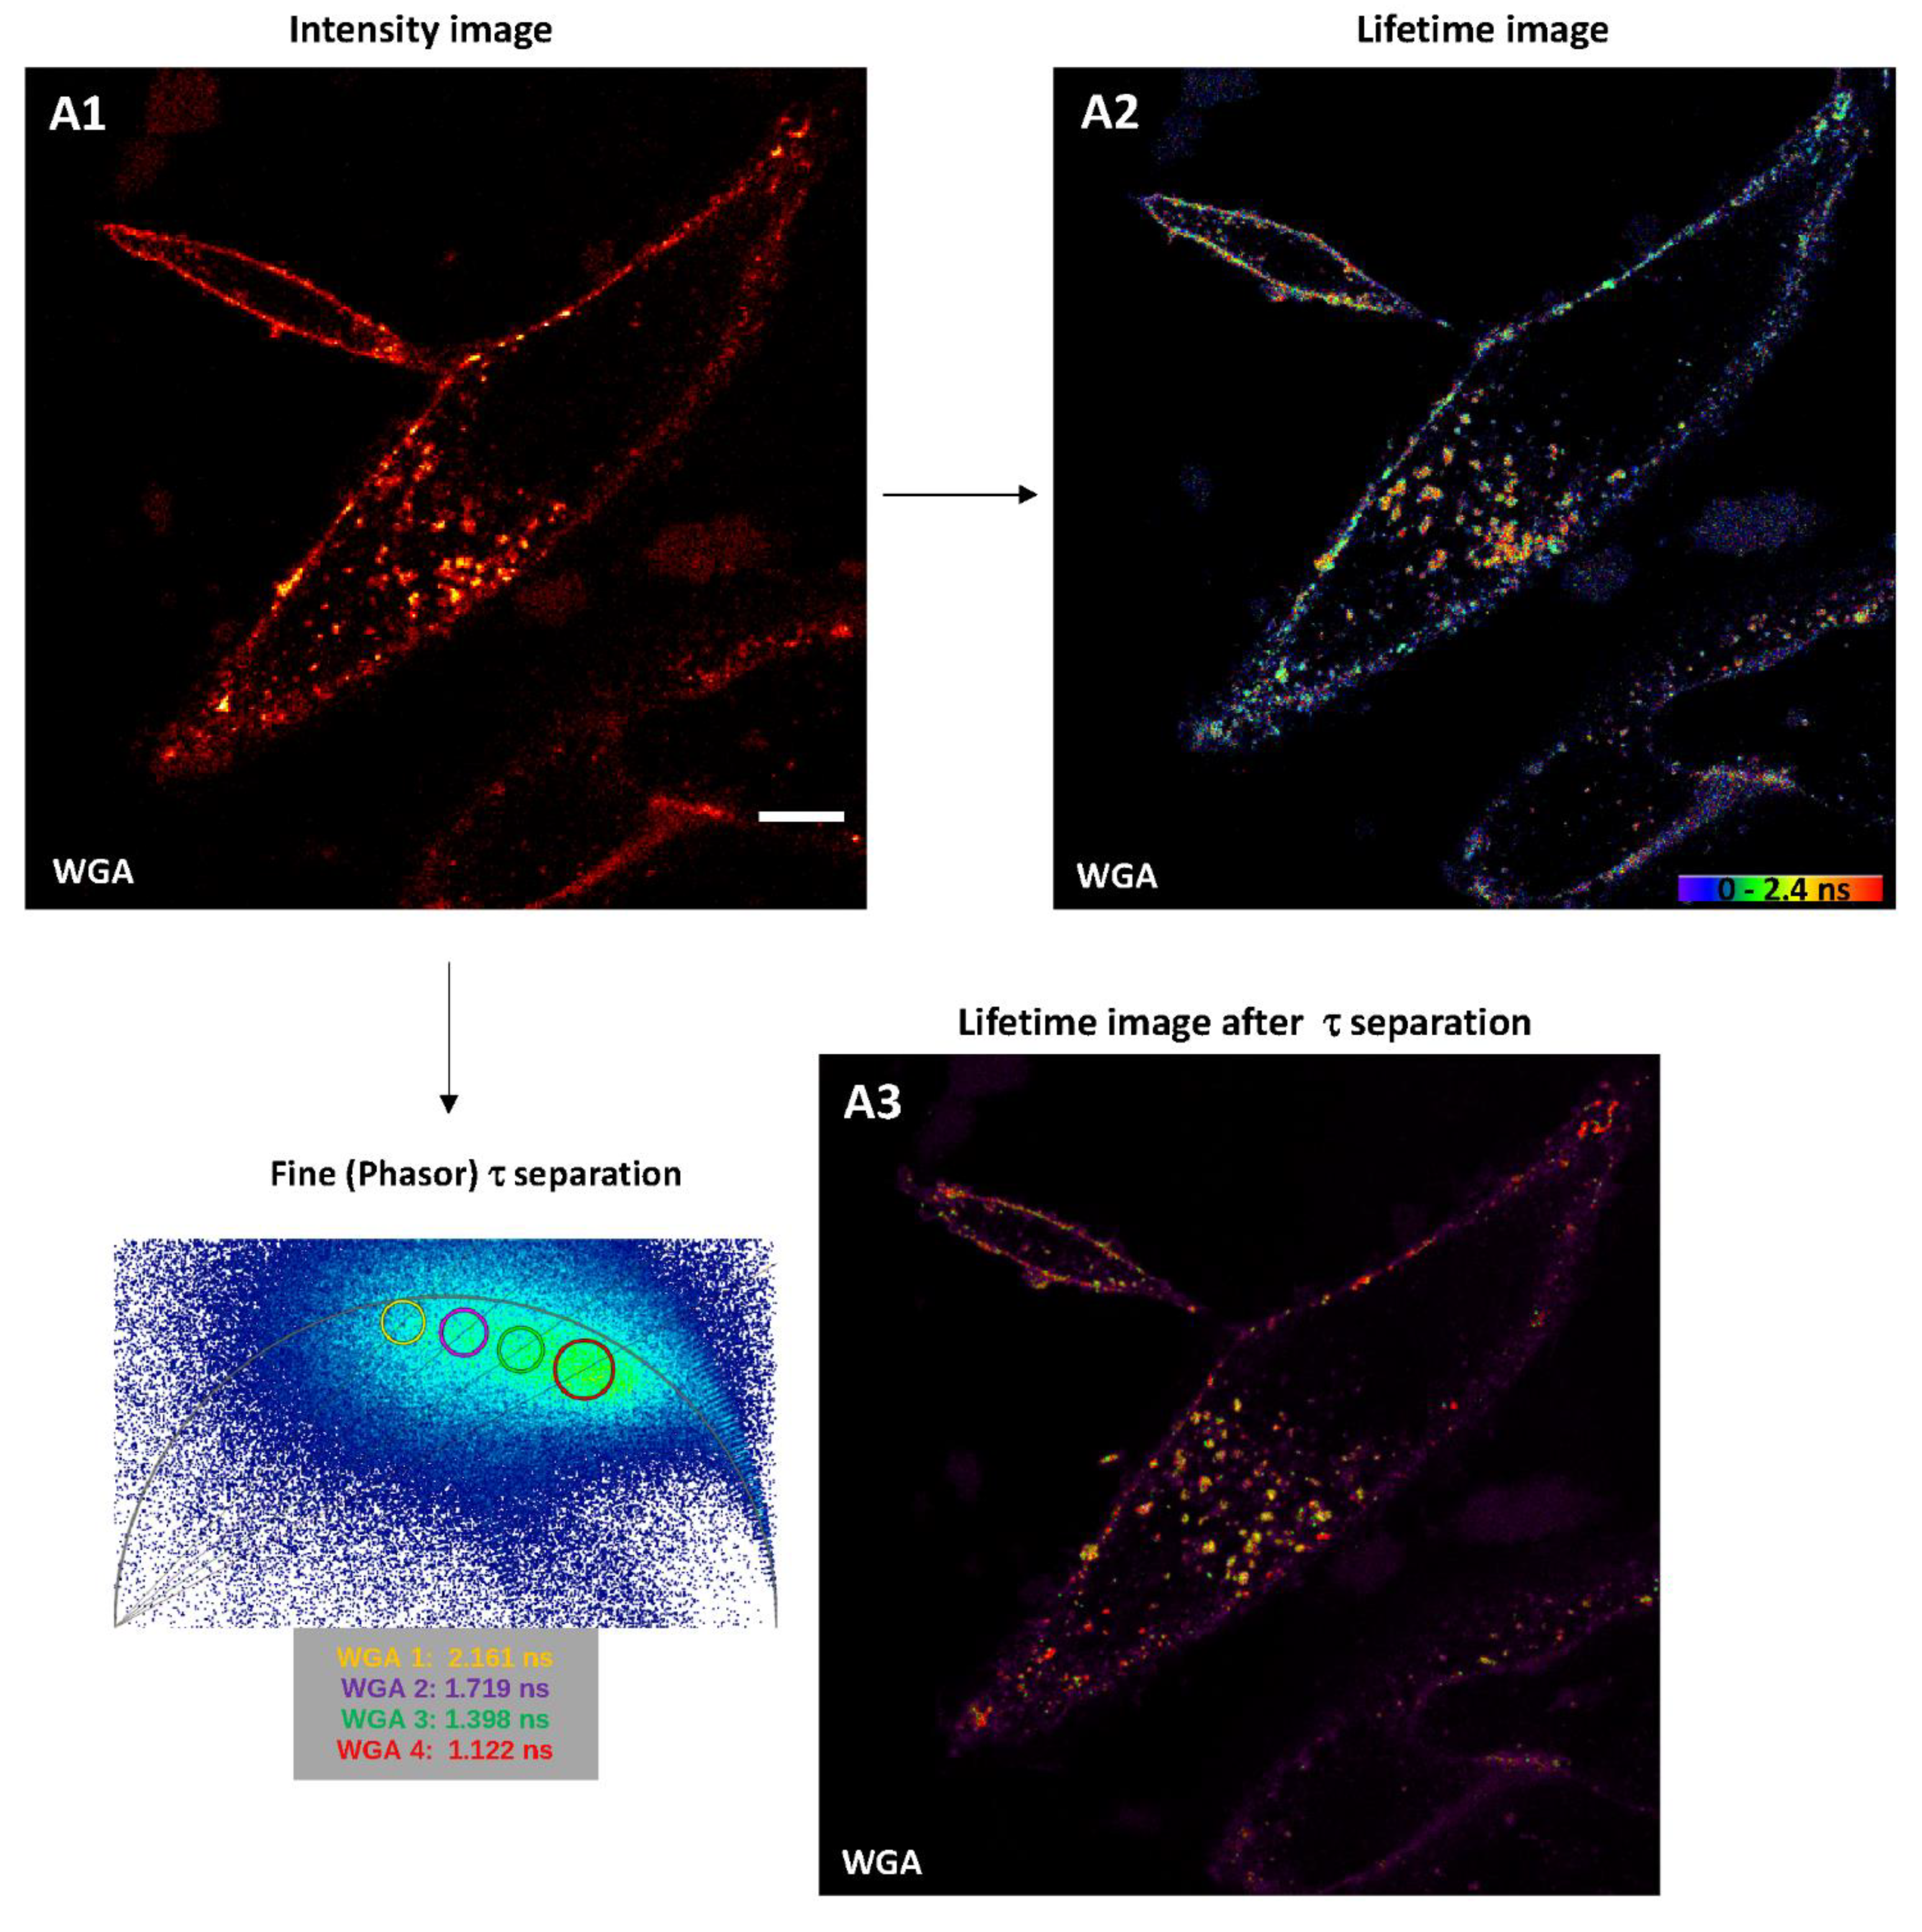
2.2.1. Intensity Images through Confocal Microscopy and Detector-Related/Phasor-Plot τ Separation
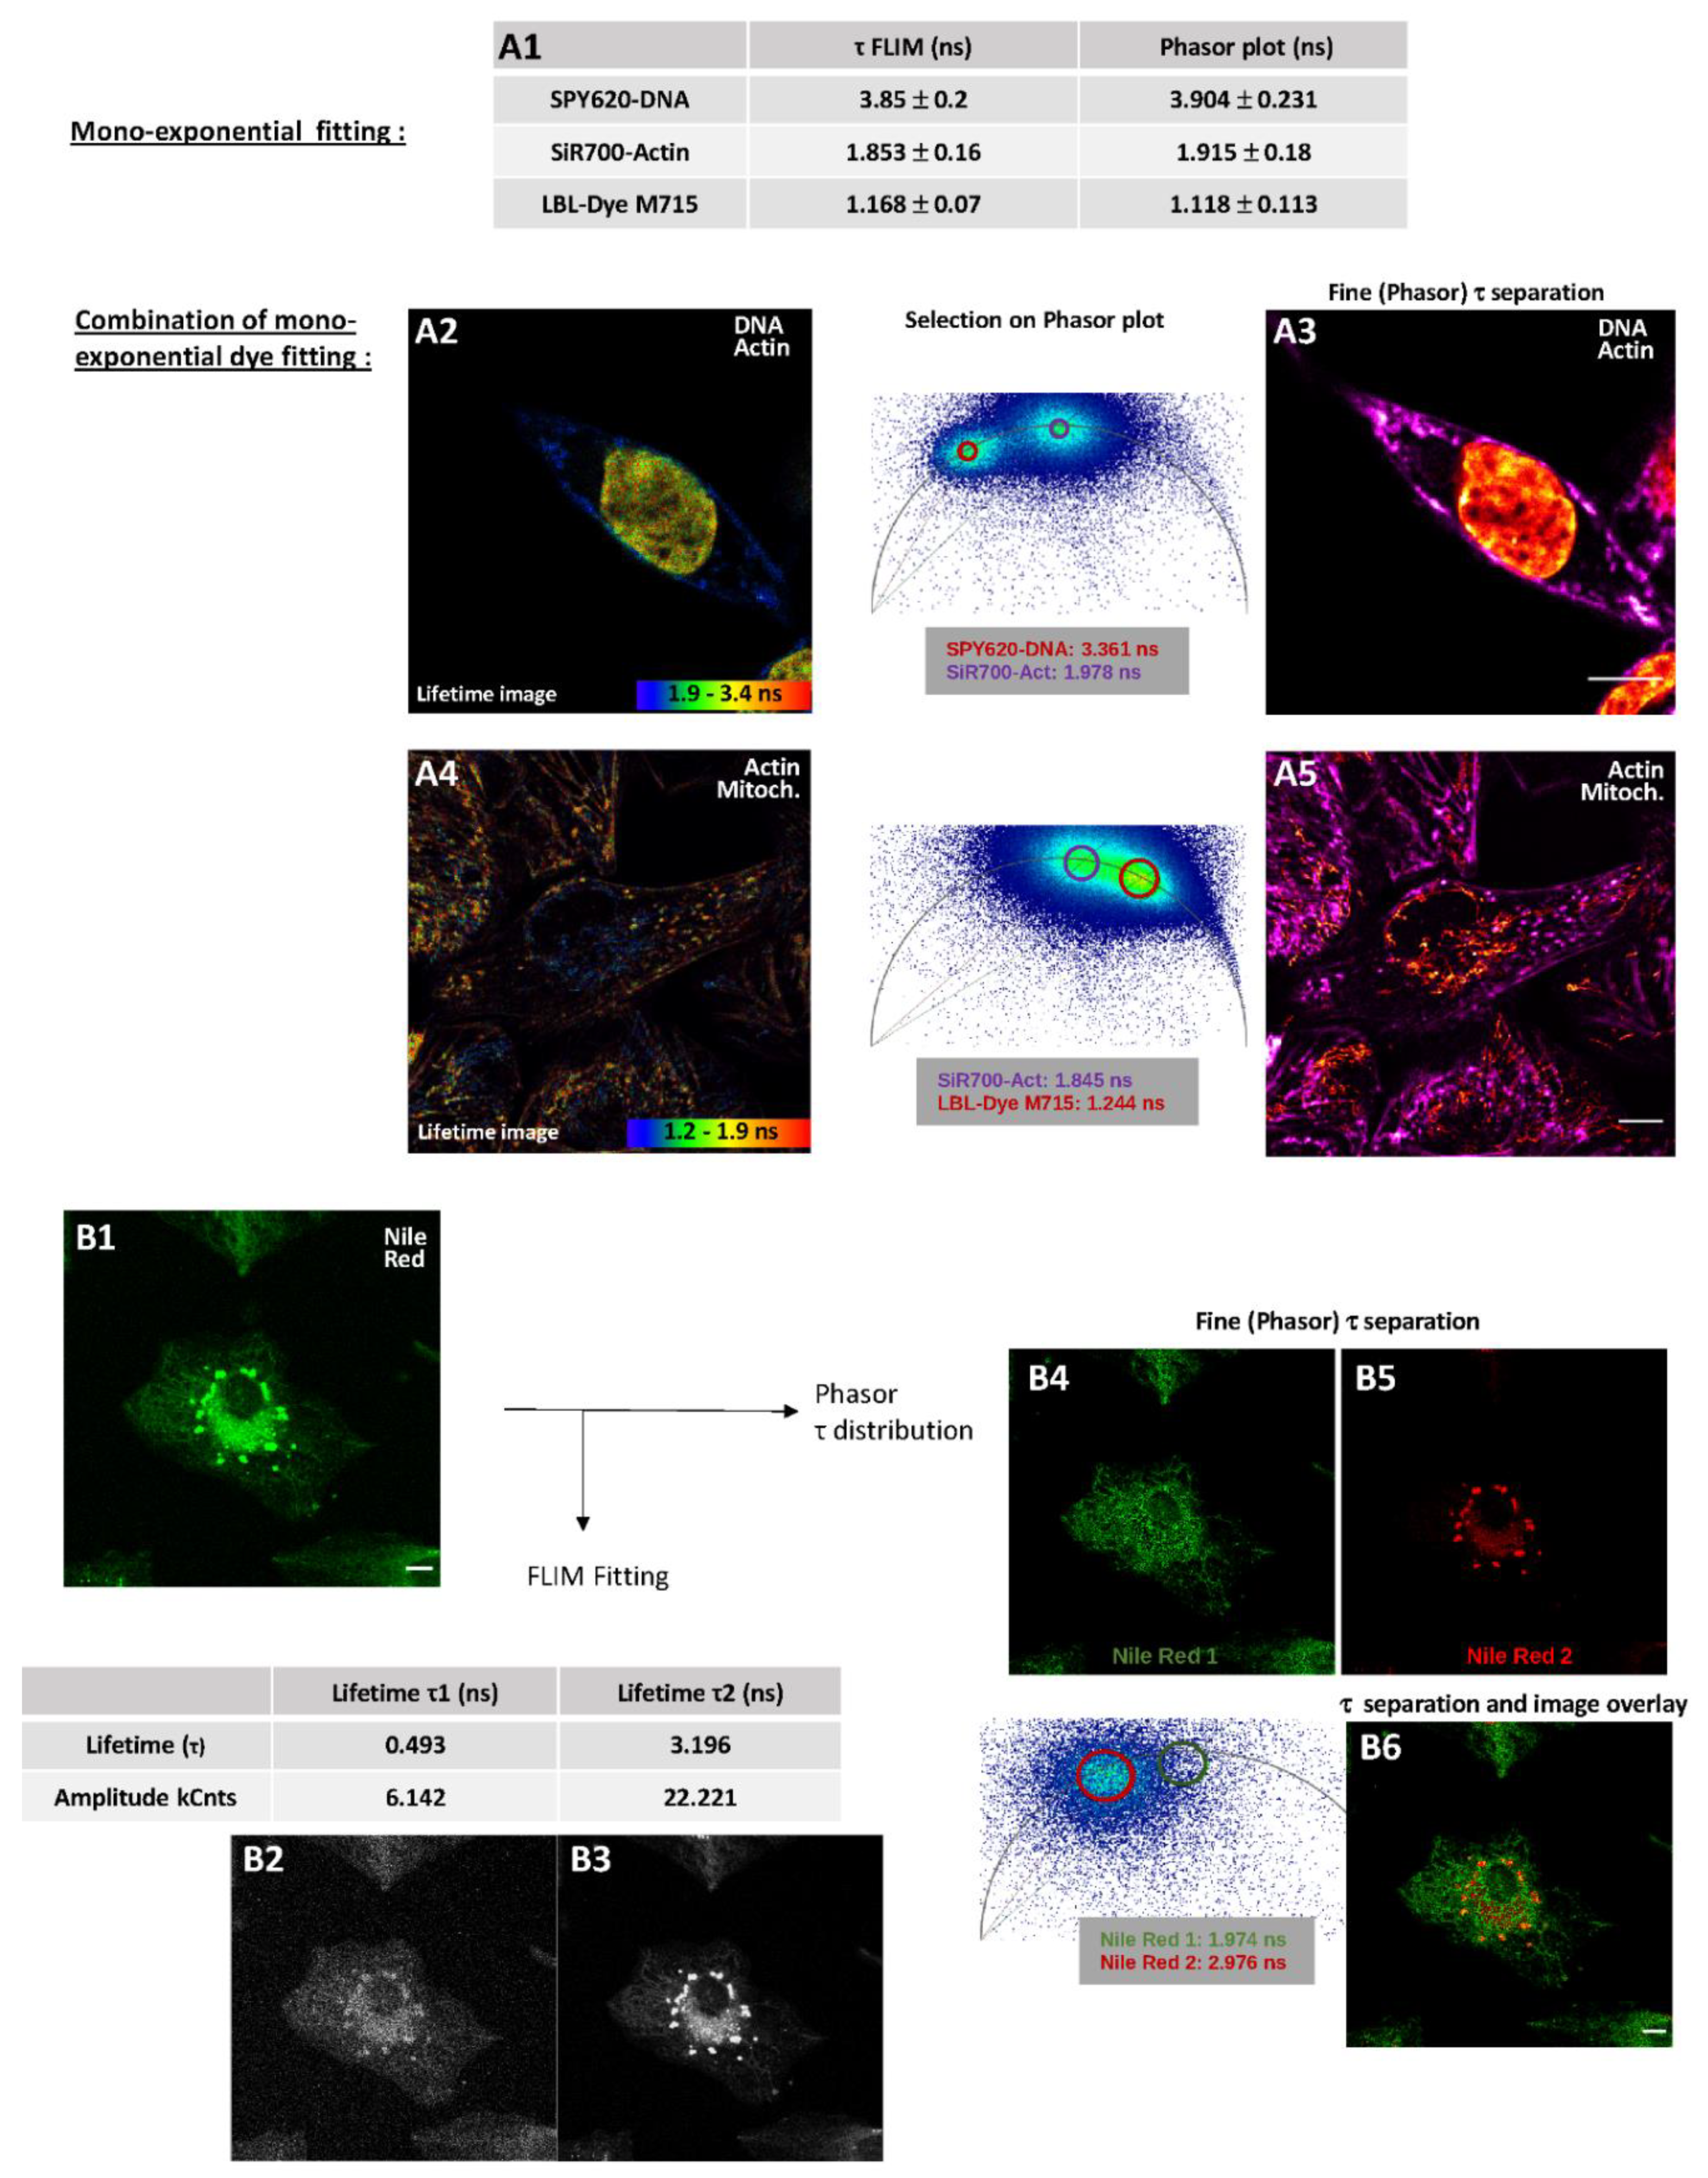
2.2.2. Fluorescence Lifetime Images through Fitting Analysis, Phasor-Plot or Phasor-Plot τ Separation
2.3. One and Two-Color FLIM-STED Nanoscopy with Red/Near-Infrared-Labeled Living Cells
3. Discussion
4. Materials and Methods
4.1. Instrumental Characterization
4.1.1. Confocal, FLIM, STED Microscope
- Confocal microscopy: A commercial inverted confocal laser scanning microscope (STELLARIS 8, Leica Microsystems, Nanterre, France) was equipped with a white light laser (440–790 nm). From Leica Microsystems (Nanterre, France) an 86× objective (NA = 1.20, water immersion, WD = 300 µm), 93× objective (NA = 1.30, glycerol immersion, WD = 300 µm) and 100× objective (NA = 1.40, oil immersion, WD = 100 µm) were used in this study. Fluorescence signals were detected in photon counting mode through four new generation Power HyD detectors including two Power HyD-S (Silicon Multi-Pixel Photon Counter; HyD-S1 and HyD-S2), one Power HyD-X (GaAsP Hybrid) and one Power HyD-R (Extended red GaAsP Hybrid). For image acquisition, appropriate zoom factor and pixel size were set in coherence with samples. A full bold line Okolab chamber (Ottaviano, Italy) installed on the inverted microscope stand was used to keep the temperature at 37 °C during image acquisition.
- FLIM: Fluorescence Lifetime imaging was performed with a fully fast integrated FLIM module, the so called FAst Lifetime CONtrast (FALCON, Leica Microsystems, Nanterre, France). FLIM images were acquired with accumulation to obtain an appropriate photon budget for phasor plot or fitting analysis.
- STED nanoscopy: A 2D STED module (Leica Microsystems, Nanterre France) installed on a STELLARIS 8 confocal base integrating two depletion lasers was used in this study. A 592-nm continuous depletion laser was dedicated to fluorochromes, with emission ranging from 470 nm to 550 nm. A 775-nm pulsed depletion laser was dedicated to fluorochromes with emission between 580 nm and 750 nm. STED images were acquired with appropriate zoom factor to ideally achieve a pixel size of 20 nm as well as frame accumulation and optimized gating for labeled samples.
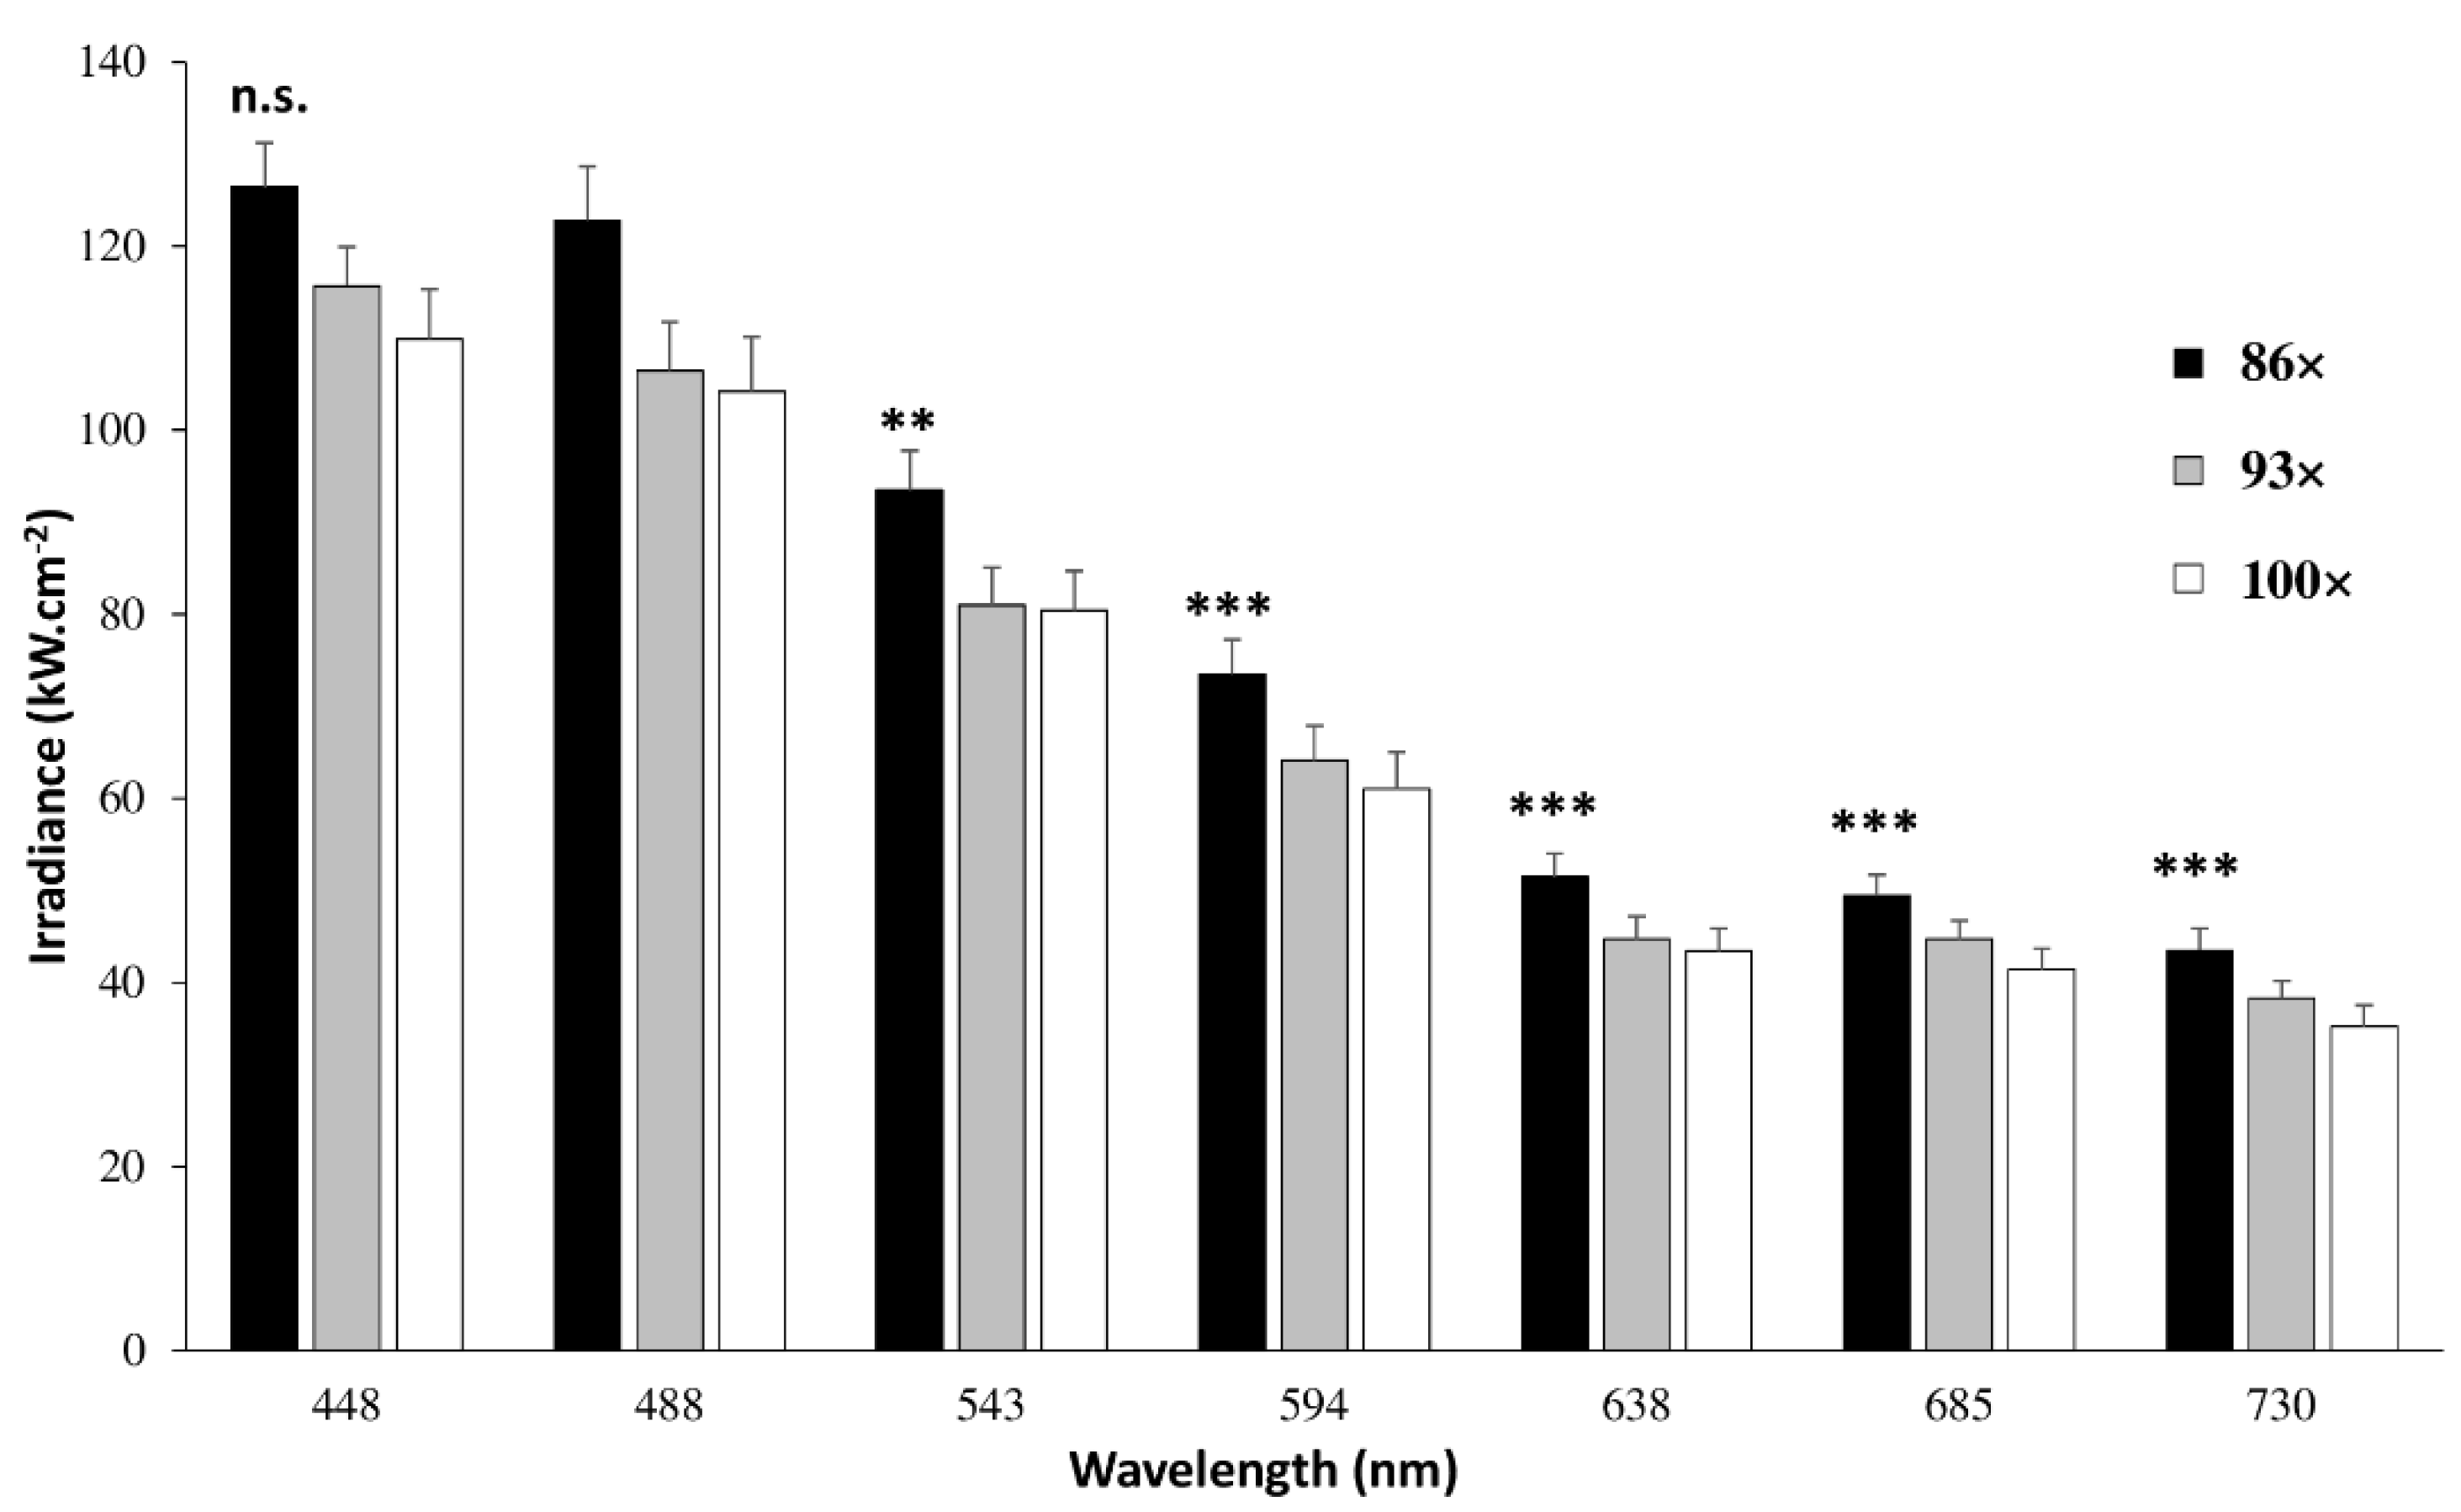
4.1.2. Laser Power, Irradiance and Transmission
4.1.3. Uniformity of Field Illumination
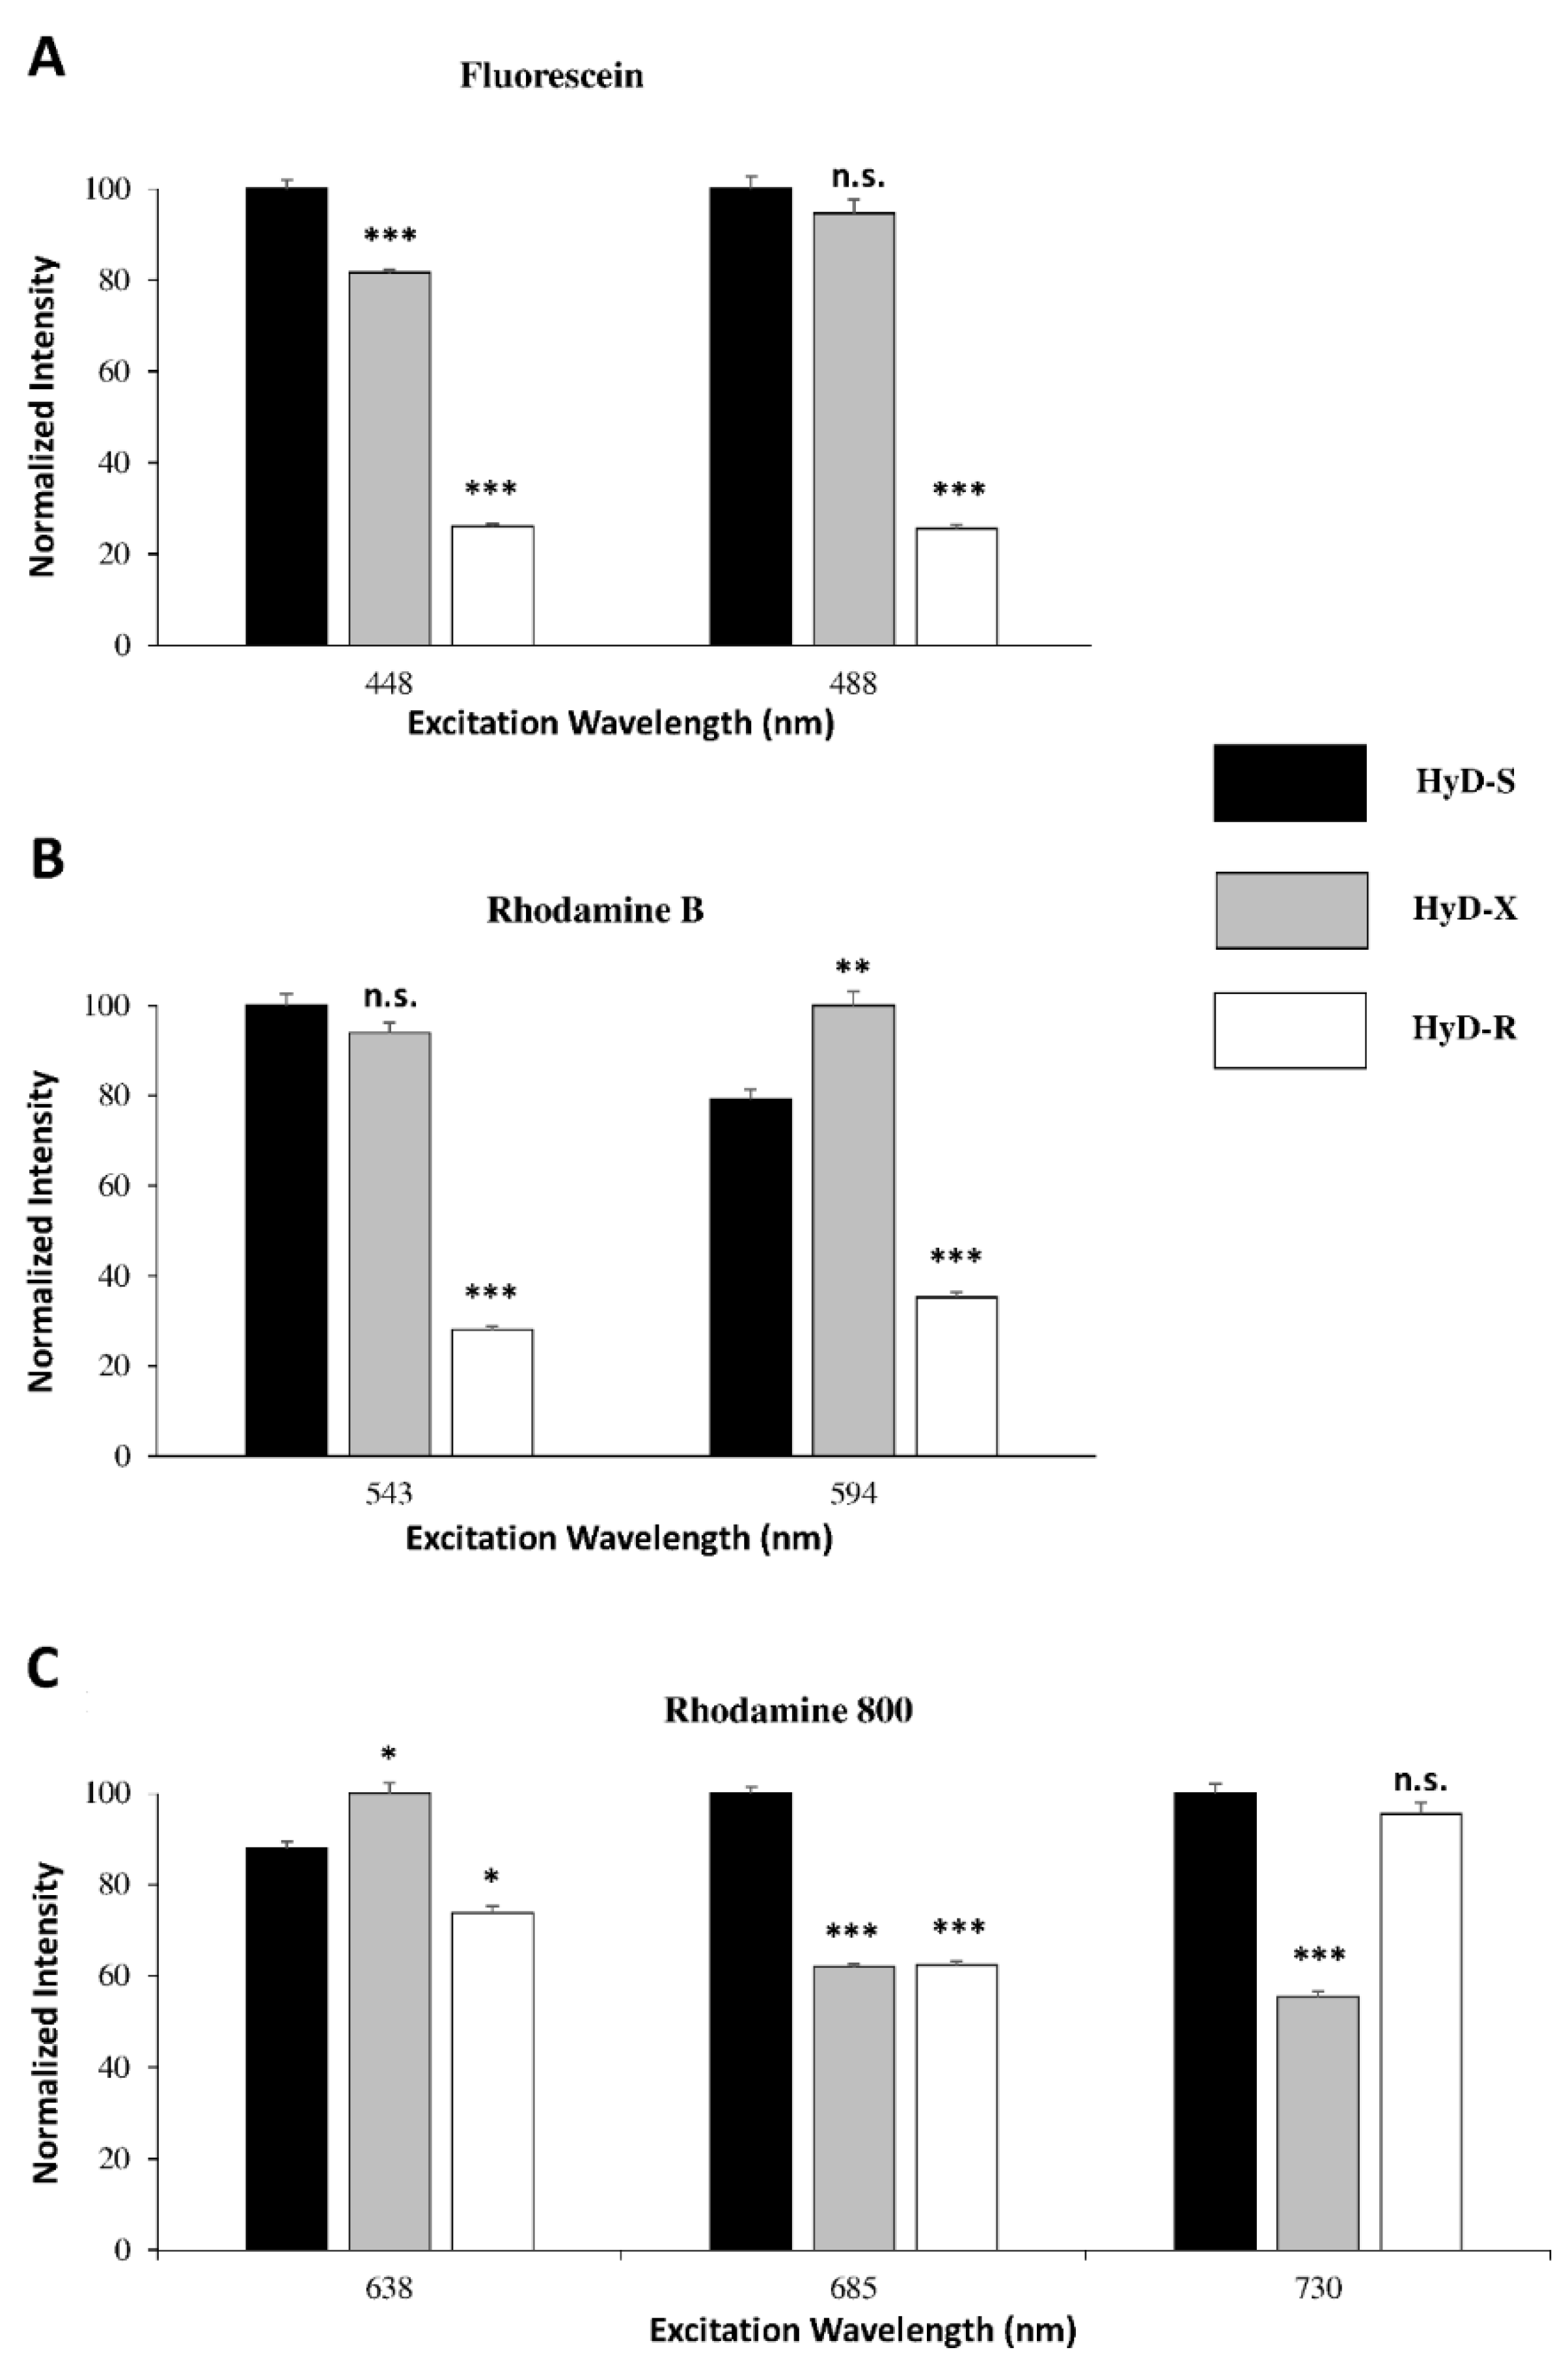
4.1.4. HyDs Sensitivity
4.1.5. FLIM Calibration
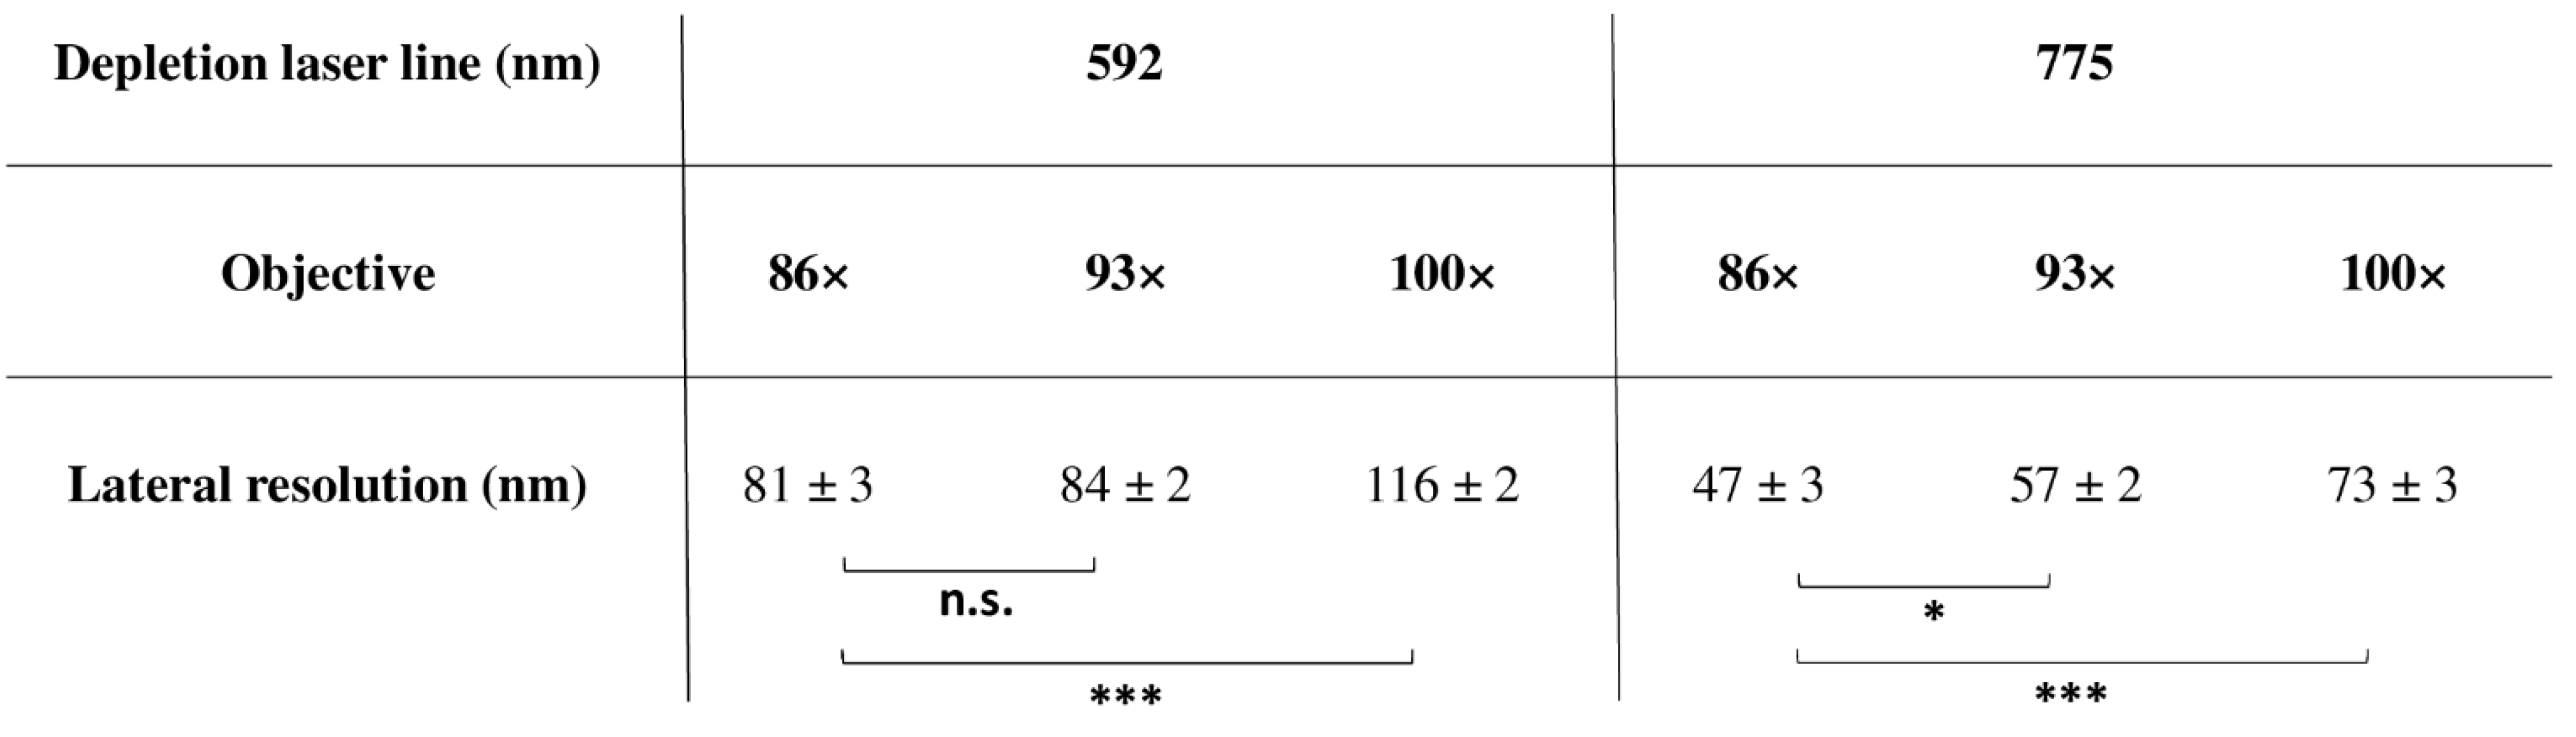
4.1.6. Super-Resolution and Objectives
4.2. Cell Culture
4.3. Cell Labeling
4.4. Confocal Imaging of Red/Near-Infrared Labeled Live-H28 Cells and Coarse τ Separation
4.5. FLIM Imaging of Red/Near-Infrared Labeled Live-H28 Cells and Phasor Plot Analysis
4.6. STED and FLIM-STED Imaging of Fixed and Live-H28 Cells
4.7. Statistical Analysis
5. Conclusions
Supplementary Materials
Author Contributions
Funding
Institutional Review Board Statement
Informed Consent Statement
Data Availability Statement
Conflicts of Interest
References
- Galas, L.; Gallavardin, T.; Bénard, M.; Lehner, A.; Schapman, D.; Lebon, A.; Komuro, H.; Lerouge, P.; Leleu, S.; Franck, X. “Probe, Sample, and Instrument (PSI)”: The Hat-Trick for Fluorescence Live Cell Imaging. Chemosensors 2018, 6, 40. [Google Scholar] [CrossRef] [Green Version]
- Marx, V. Is super-resolution microscopy right for you? Nat. Methods 2013, 10, 1157–1163. [Google Scholar] [CrossRef]
- Panchuk-Voloshina, N.; Haugland, R.P.; Bishop-Stewart, J.; Bhalgat, M.K.; Millard, P.J.; Mao, F.; Leung, W.Y.; Haugland, R.P. Alexa dyes, a series of new fluorescent dyes that yield exceptionally bright, photostable conjugates. J. Histochem. Cytochem. 1999, 47, 1179–1188. [Google Scholar] [CrossRef] [PubMed]
- Berlier, J.E.; Rothe, A.; Buller, G.; Bradford, J.; Gray, D.R.; Filanoski, B.J.; Telford, W.G.; Yue, S.; Liu, J.; Cheung, C.Y.; et al. Quantitative comparison of long-wavelength Alexa Fluor dyes to Cy dyes: Fluorescence of the dyes and their bioconjugates. J. Histochem. Cytochem. 2003, 51, 1699–1712. [Google Scholar] [CrossRef] [Green Version]
- Grimm, F.; Rehman, J.; Stoldt, S.; Khan, T.A.; Schlötel, J.G.; Nizamov, S.; John, M.; Belov, V.N.; Hell, S.W. Rhodamines with a chloronicotinic acid fragment for live cell superresolution STED microscopy. Chemistry 2021, 27, 6070–6076. [Google Scholar] [CrossRef] [PubMed]
- Tynan, C.J.; Clarke, D.T.; Coles, B.C.; Rolfe, D.J.; Martin-Fernandez, M.L.; Webb, S.E. Multicolour single molecule imaging in cells with near infra-red dyes. PLoS ONE 2012, 7, e36265. [Google Scholar] [CrossRef] [PubMed]
- Godin, A.G.; Lounis, B.; Cognet, L. Super-resolution microscopy approaches for live cell imaging. Biophys. J. 2014, 107, 1777–1784. [Google Scholar] [CrossRef] [Green Version]
- Spahn, C.; Grimm, J.B.; Lavis, L.D.; Lampe, M.; Heilemann, M. Whole-Cell, 3D, and multicolor STED imaging with exchangeable fluorophores. Nano Lett. 2019, 19, 500–505. [Google Scholar] [CrossRef] [Green Version]
- Lukinavicius, G.; Reymond, L.; Umezawa, K.; Sallin, O.; D’Este, E.; Göttfert, F.; Ta, H.; Hell, S.W.; Urano, Y.; Johnsson, K. Fluorogenic probes for multicolor imaging in living cells. J. Am. Chem. Soc. 2016, 138, 9365–9368. [Google Scholar] [CrossRef] [Green Version]
- Bucevicius, J.; Gilat, T.; Lukinavicius, G. Far-red switching DNA probes for live cell nanoscopy. Chem. Commun. 2020, 56, 14797–14800. [Google Scholar] [CrossRef]
- Stephan, T.; Roesch, A.; Riedel, D.; Jakobs, S. Live-cell STED nanoscopy of mitochondrial cristae. Sci. Rep. 2019, 9, 12419. [Google Scholar] [CrossRef] [PubMed] [Green Version]
- Yu, H.; Hu, W.; Song, X.; Zhao, Y. Immune modulation of platelet-derived mitochondria on memory CD4 + T cells in humans. Int. J. Mol. Sci. 2020, 21, 6295. [Google Scholar] [CrossRef] [PubMed]
- Fogarty, M.J.; Rana, S.; Mantilla, C.B.; Sieck, G.C. Quantifying mitochondrial volume density in phrenic motor neurons. J. Neurosci. Methods 2021, 353, 109093. [Google Scholar] [CrossRef] [PubMed]
- Chazotte, B. Labeling membrane glycoproteins or glycolipids with fluorescent wheat germ agglutinin. Cold Spring Harb. Protoc. 2011, pdb.prot5623. [Google Scholar] [CrossRef] [PubMed]
- Collot, M.; Ashokkumar, P.; Anton, H.; Boutant, E.; Faklaris, O.; Galli, T.; Mély, Y.; Danglot, L.; Klymchenko, A.S. MemBright: A family of fluorescent membrane probes for advanced cellular imaging and neuroscience. Cell. Chem. Biol. 2019, 26, 600–614. [Google Scholar] [CrossRef]
- Berezin, M.Y.; Achilefu, S. Fluorescence lifetime measurements and biological imaging. Chem. Rev. 2010, 110, 2641–2684. [Google Scholar] [CrossRef] [Green Version]
- Datta, R.; Heaster, T.M.; Sharick, J.T.; Gillette, A.A.; Skala, M.C. Fluorescence lifetime imaging microscopy: Fundamentals and advances in instrumentation, analysis, and applications. J. Biomed. Opt. 2020, 25, 1–43. [Google Scholar] [CrossRef]
- Alvarez, L.A.; Widzgowski, B.; Ossato, G.; van den Broek, B.; Jalink, K.; Kuschel, L.; Roberti, M.J.; Hecht, F. Application Note: SP8 FALCON: A novel concept in fluorescence lifetime imaging enabling video-rate confocal FLIM. Nat. Methods 2019, 16, 1069–1071. Available online: https://www.nature.com/articles/d42473-019-00261-x (accessed on 7 October 2021).
- Bitton, A.; Sambrano, J.; Valentino, S.; Houston, J.P. A review of new high-throughput methods designed for fluorescence lifetime sensing from cells and tissues. Front. Phys. 2021, 9, 648553. [Google Scholar] [CrossRef]
- Le Marois, A.; Suhling, K. Quantitative live cell FLIM imaging in three dimensions. Adv. Exp. Med. Biol. 2017, 1035, 31–48. [Google Scholar]
- Wu, Z.; Xu, X.; Xi, P. Stimulated emission depletion microscopy for biological imaging in four dimensions: A review. Microsc. Res. Tech. 2021, 84, 1947–1958. [Google Scholar] [CrossRef]
- Vicidomini, G.; Moneron, G.; Han, K.Y.; Westphal, V.; Ta, H.; Reuss, M.; Engelhardt, J.; Eggeling, C.; Hell, S.W. Sharper low-power STED nanoscopy by time gating. Nat. Methods 2011, 8, 571–573. [Google Scholar] [CrossRef]
- Bénard, M.; Schapman, D.; Lebon, A.; Monterroso, B.; Bellenger, M.; Le Foll, F.; Pasquier, J.; Vaudry, H.; Vaudry, D.; Galas, L. Structural and functional analysis of tunneling nanotubes (TnTs) using gCW STED and gconfocal approaches. Biol. Cell. 2015, 107, 419–425. [Google Scholar] [CrossRef]
- Jahr, W.; Velicky, P.; Danzl, J.G. Strategies to maximize performance in STimulated Emission Depletion (STED) nanoscopy of biological specimens. Methods 2020, 174, 27–41. [Google Scholar] [CrossRef]
- Bottanelli, F.; Kromann, E.B.; Allgeyer, E.S.; Erdmann, R.S.; Baguley, S.; Sirinakis, G.; Schepartz, A.; Baddeley, D.; Toomre, D.K.; Rothman, J.E.; et al. Two-colour live-cell nanoscale imaging of intracellular targets. Nat. Commun. 2016, 7, 10778. [Google Scholar] [CrossRef] [PubMed] [Green Version]
- Zucker, R.M. Evaluating confocal microscopy system performance. Methods Mol. Biol. 2014, 1075, 321–374. [Google Scholar]
- Deagle, R.C.; Wee, T.E.; Brown, C.M. Reproducibility in light microscopy: Maintenance, standards and SOPs. Int. J. Biochem. Cell. Biol. 2017, 89, 120–124. [Google Scholar] [CrossRef] [PubMed]
- Jost, A.P.; Waters, J.C. Designing a rigorous microscopy experiment: Validating methods and avoiding bias. J. Cell. Biol. 2019, 218, 1452–1466. [Google Scholar] [CrossRef] [PubMed] [Green Version]
- Nelson, G.; Boehm, U.; Bagley, S.; Bajcsy, P.; Bischof, J.; Brown, C.M.; Dauphin, A.; Dobbie, I.M.; Eriksson, J.E.; Faklaris, O.; et al. QUAREP-LiMi: A community-driven initiative to establish guidelines for quality assessment and reproducibility for instruments and images in light microscopy. J. Microsc. 2021, 284, 56–73. [Google Scholar] [CrossRef]
- Jonkman, J.; Brown, C.M.; Wright, G.D.; Anderson, K.I.; North, A.J. Tutorial: Guidance for quantitative confocal microscopy. Nat. Protoc. 2020, 15, 1585–1611. [Google Scholar] [CrossRef] [PubMed]
- Webb, S.E.; Zanetti-Domingues, L.; Coles, B.C.; Rolfe, D.J.; Wareham, R.J.; Martin-Fernandez, M.L. Multicolour single molecule imaging on cells using a supercontinuum source. Biomed. Opt. Express 2012, 3, 400–406. [Google Scholar] [CrossRef] [PubMed] [Green Version]
- Leutenegger, M.; Eggeling, C.; Hell, S.W. Analytical description of STED microscopy performance. Opt. Express 2010, 18, 26417–26429. [Google Scholar] [CrossRef] [PubMed] [Green Version]
- Bianchini, P.; Peres, C.; Oneto, M.; Galiani, S.; Vicidomini, G.; Diaspro, A. STED nanoscopy: A glimpse into the future. Cell Tissue Res. 2015, 360, 143–150. [Google Scholar] [CrossRef] [PubMed] [Green Version]
- Piatek, S. Detection of Light with a Silicon Photomultiplier: Operation, Circuits, and Applications. 2020. Available online: https://hub.hamamastu.com/us/en/webinar/Detection_of_light_with_a_Silicon_Photomultiplier/index.html (accessed on 7 October 2021).
- Photomultiplier Tubes: Basics and Applications, 4th ed.; Hamamatsu Photonics K.K.: Iwata, Japan, 2017.
- Schweikhard, V.; Alvarez, L.A.; Steinmetz, I.; Roberti, M.J.; Birk, H.; Giske, A. Application Note: The Power HyD family of detectors. Nat. Methods 2020. Available online: https://www.nature.com/articles/d42473-020-00398-0 (accessed on 7 October 2021).
- Roberti, J.; Ortiz Lopez, L.; Ossato, G.; Steinmetz, I.; Haas, P.; Hecht, F.; Alvarez, L.A.J. Application Note: TauSense: A fluorescence lifetime-based tool set for everyday imaging. Nat. Methods 2020. Available online: https://www.nature.com/articles/d42473-020-00364-w (accessed on 7 October 2021).
- Digman, M.A.; Caiolfa, V.R.; Zamai, M.; Gratton, E. The phasor approach to fluorescence lifetime imaging analysis. Biophys. J. 2008, 94, L14–L16. [Google Scholar] [CrossRef] [PubMed] [Green Version]
- Digman, M.; Gratton, E. Complex fluorescence decay profiles: Discrete models, stretched exponential, analytical models. In Fluorescence Lifetime Spectroscopy and Imaging: Principles and Applications in Biomedical Diagnostics; Marcu, L., French, P.M., Eds.; UC: Irvine, CA, USA, 2012; pp. 235–248. Available online: https://escholarship.org/uc/item/5g279175 (accessed on 7 October 2021).
- Hinde, E.; Digman, M.A.; Welch, C.; Hahn, K.M.; Gratton, E. Biosensor Förster resonance energy transfer detection by the phasor approach to fluorescence lifetime imaging microscopy. Microsc. Res. Tech. 2012, 75, 271–281. [Google Scholar] [CrossRef] [PubMed] [Green Version]
- Moffitt, J.R.; Osseforth, C.; Michaelis, J. Time-gating improves the spatial resolution of STED microscopy. Opt. Express 2011, 19, 4242–4254. [Google Scholar] [CrossRef] [PubMed]
- Lanzanò, L.; Coto Hernández, I.; Castello, M.; Gratton, E.; Diaspro, A.; Vicidomini, G. Encoding and decoding spatio-temporal information for super-resolution microscopy. Nat. Commun. 2015, 6, 6701. [Google Scholar] [CrossRef] [Green Version]
- Wang, P.; Hecht, F.; Ossato, G.; Tille, S.; Fraser, S.E.; Junge, J.A. Complex wavelet filter improves FLIM phasors for photon starved imaging experiments. Biomed. Opt. Express 2021, 12, 3463–3473. [Google Scholar] [CrossRef]
- Faklaris, O.; Bancel-Vallée, L.; Dauphin, A.; Monterroso, B.; Frère, P.; Geny, D.; Manoliu, T.; de Rossi, S.; Cordelières, F.P.; Schapman, D.; et al. Long-term quality assessment and monitoring of light microscope performance through accessible and reliable protocols, tools and metrics. bioRxiv 2021. [Google Scholar] [CrossRef]
- Rasband, W.S. ImageJ; National Institutes of Health: Bethesda, MA, USA; 1997–2018. Available online: https://imagej.nih.gov/ij/ (accessed on 7 October 2021).
- Dubois, F.; Jean-Jacques, B.; Roberge, H.; Bénard, M.; Galas, L.; Schapman, D.; Elie, N.; Goux, D.; Keller, M.; Maille, E.; et al. A role for RASSF1A in tunneling nanotube formation between cells through GEFH1/Rab11 pathway control. Cell Commun. Signal. 2018, 16, 66. [Google Scholar] [CrossRef] [Green Version]


Publisher’s Note: MDPI stays neutral with regard to jurisdictional claims in published maps and institutional affiliations. |
© 2021 by the authors. Licensee MDPI, Basel, Switzerland. This article is an open access article distributed under the terms and conditions of the Creative Commons Attribution (CC BY) license (https://creativecommons.org/licenses/by/4.0/).
Share and Cite
Bénard, M.; Schapman, D.; Chamot, C.; Dubois, F.; Levallet, G.; Komuro, H.; Galas, L. Optimization of Advanced Live-Cell Imaging through Red/Near-Infrared Dye Labeling and Fluorescence Lifetime-Based Strategies. Int. J. Mol. Sci. 2021, 22, 11092. https://doi.org/10.3390/ijms222011092
Bénard M, Schapman D, Chamot C, Dubois F, Levallet G, Komuro H, Galas L. Optimization of Advanced Live-Cell Imaging through Red/Near-Infrared Dye Labeling and Fluorescence Lifetime-Based Strategies. International Journal of Molecular Sciences. 2021; 22(20):11092. https://doi.org/10.3390/ijms222011092
Chicago/Turabian StyleBénard, Magalie, Damien Schapman, Christophe Chamot, Fatéméh Dubois, Guénaëlle Levallet, Hitoshi Komuro, and Ludovic Galas. 2021. "Optimization of Advanced Live-Cell Imaging through Red/Near-Infrared Dye Labeling and Fluorescence Lifetime-Based Strategies" International Journal of Molecular Sciences 22, no. 20: 11092. https://doi.org/10.3390/ijms222011092
APA StyleBénard, M., Schapman, D., Chamot, C., Dubois, F., Levallet, G., Komuro, H., & Galas, L. (2021). Optimization of Advanced Live-Cell Imaging through Red/Near-Infrared Dye Labeling and Fluorescence Lifetime-Based Strategies. International Journal of Molecular Sciences, 22(20), 11092. https://doi.org/10.3390/ijms222011092