
Astaxanthin Prevents Diet-Induced NASH Progression by Shaping Intrahepatic Immunity


Abstract
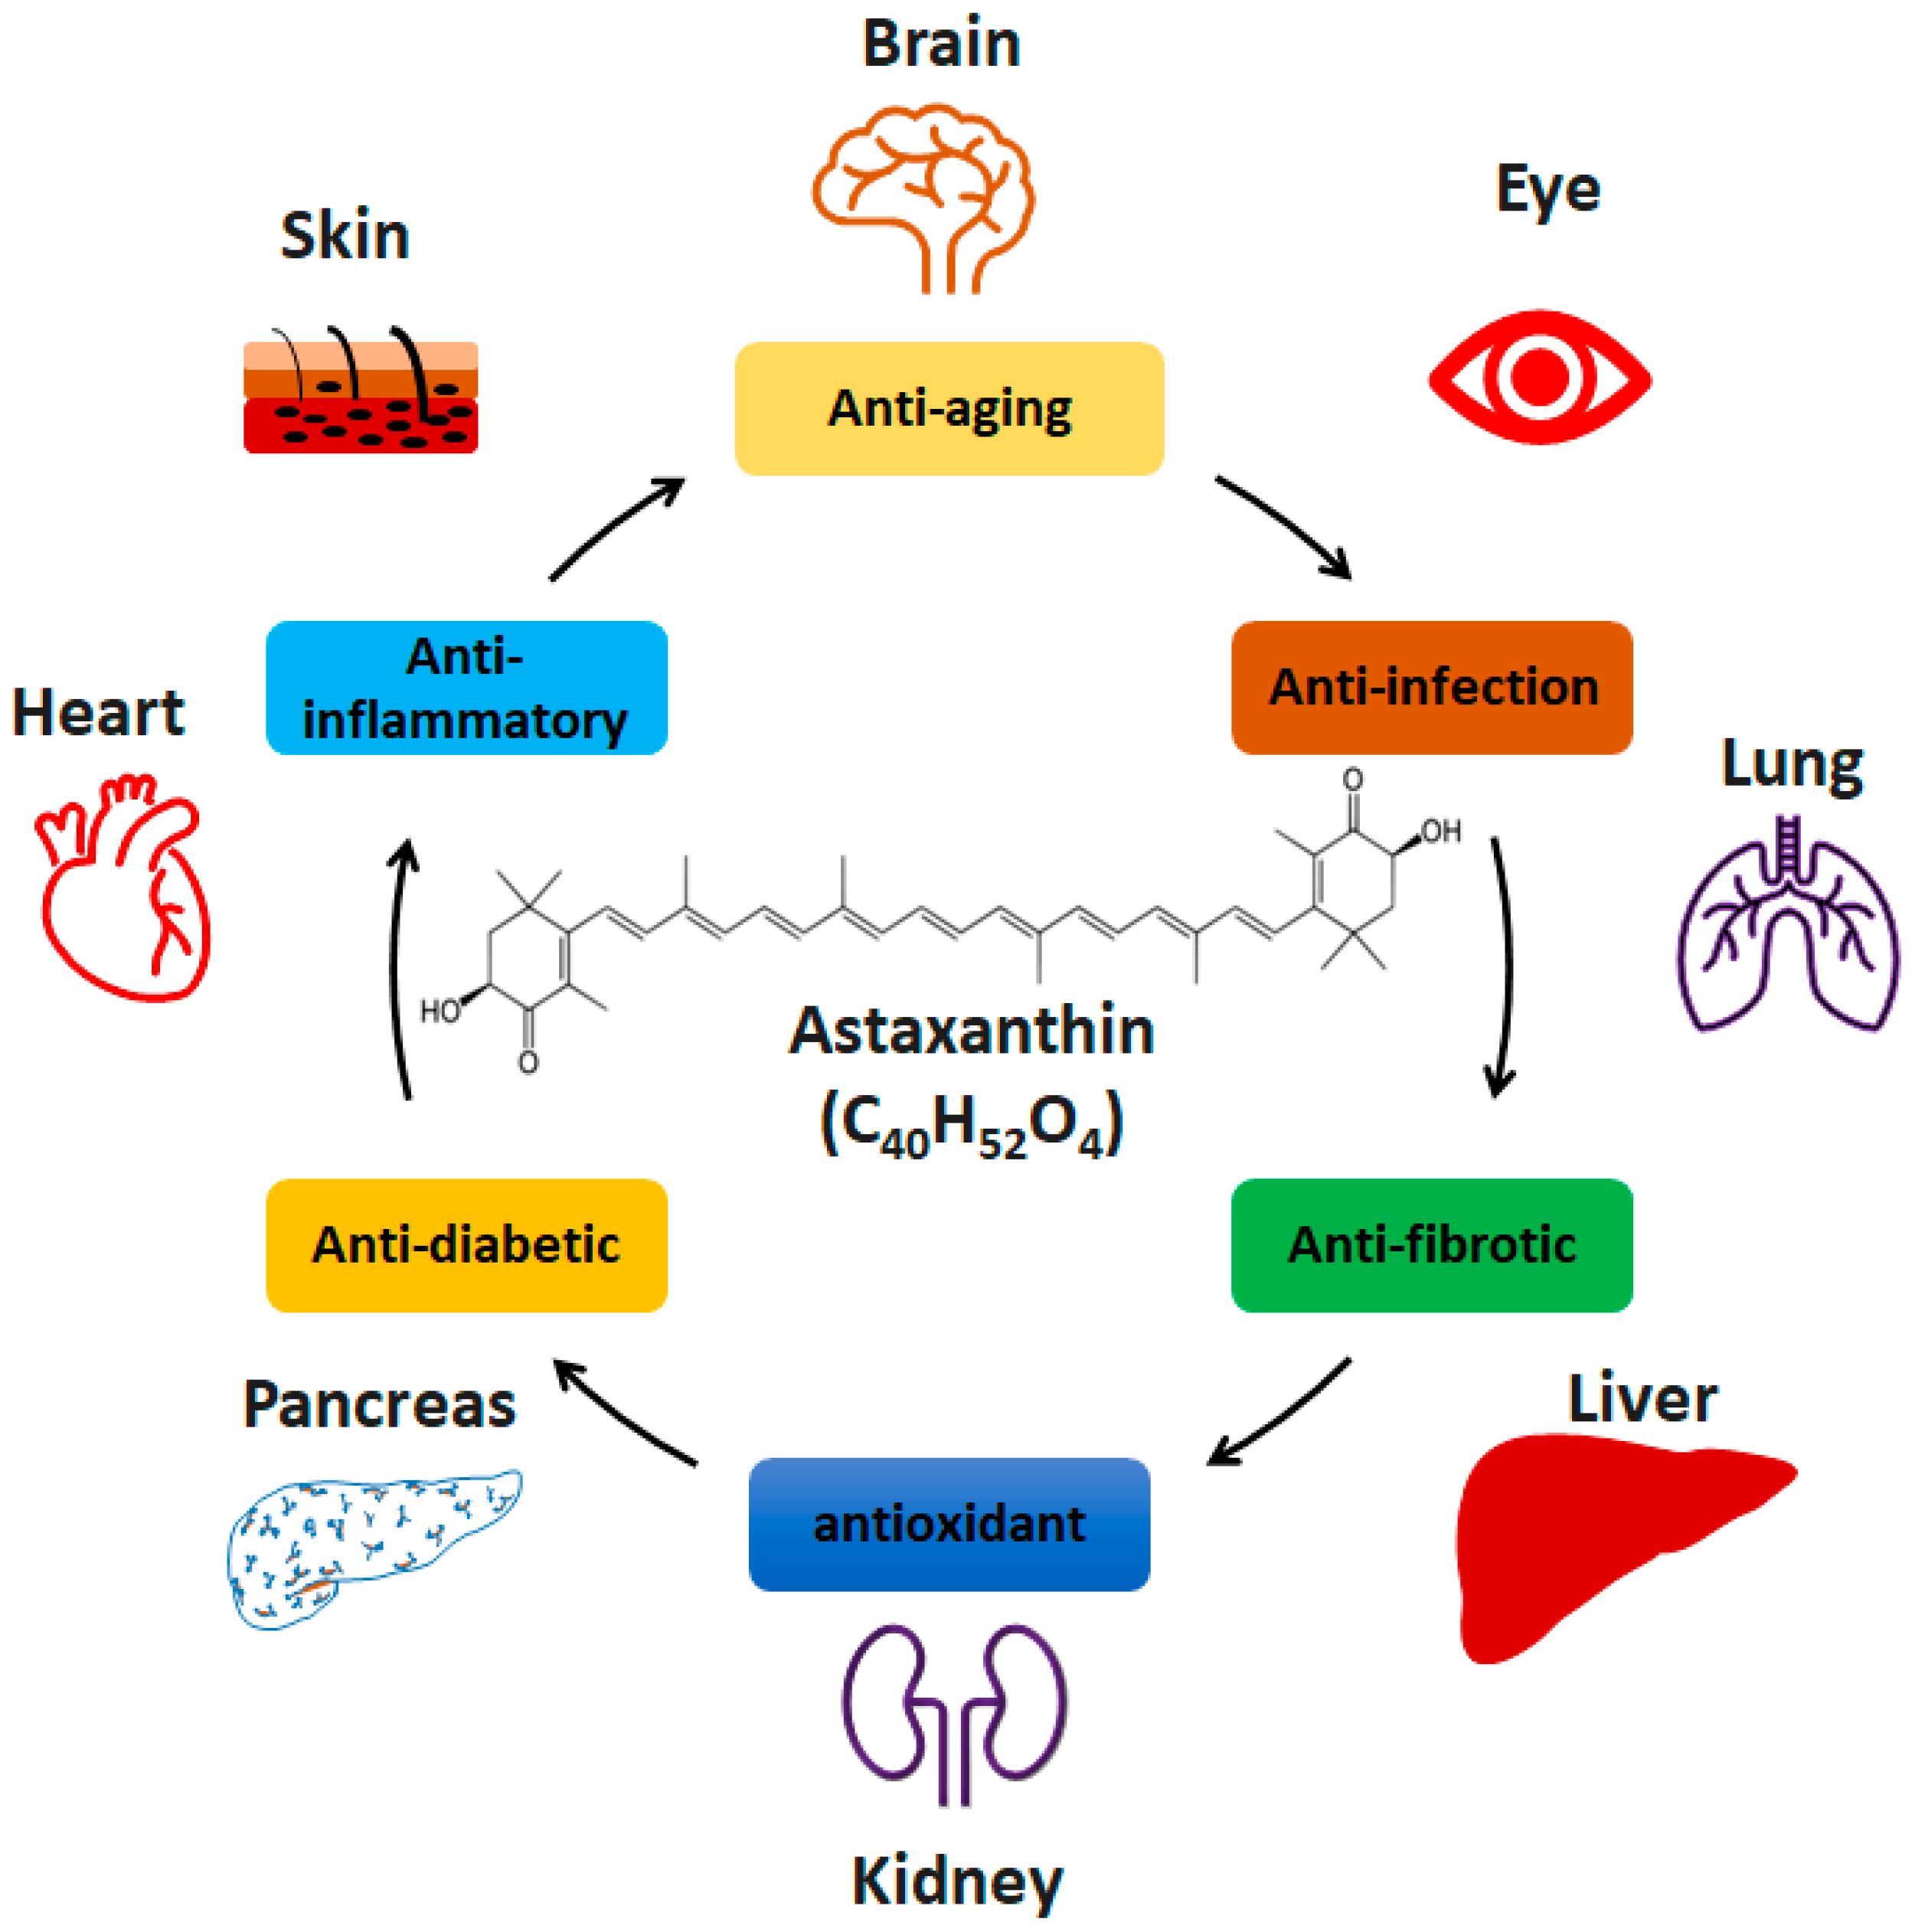
:1. Introduction
2. Results
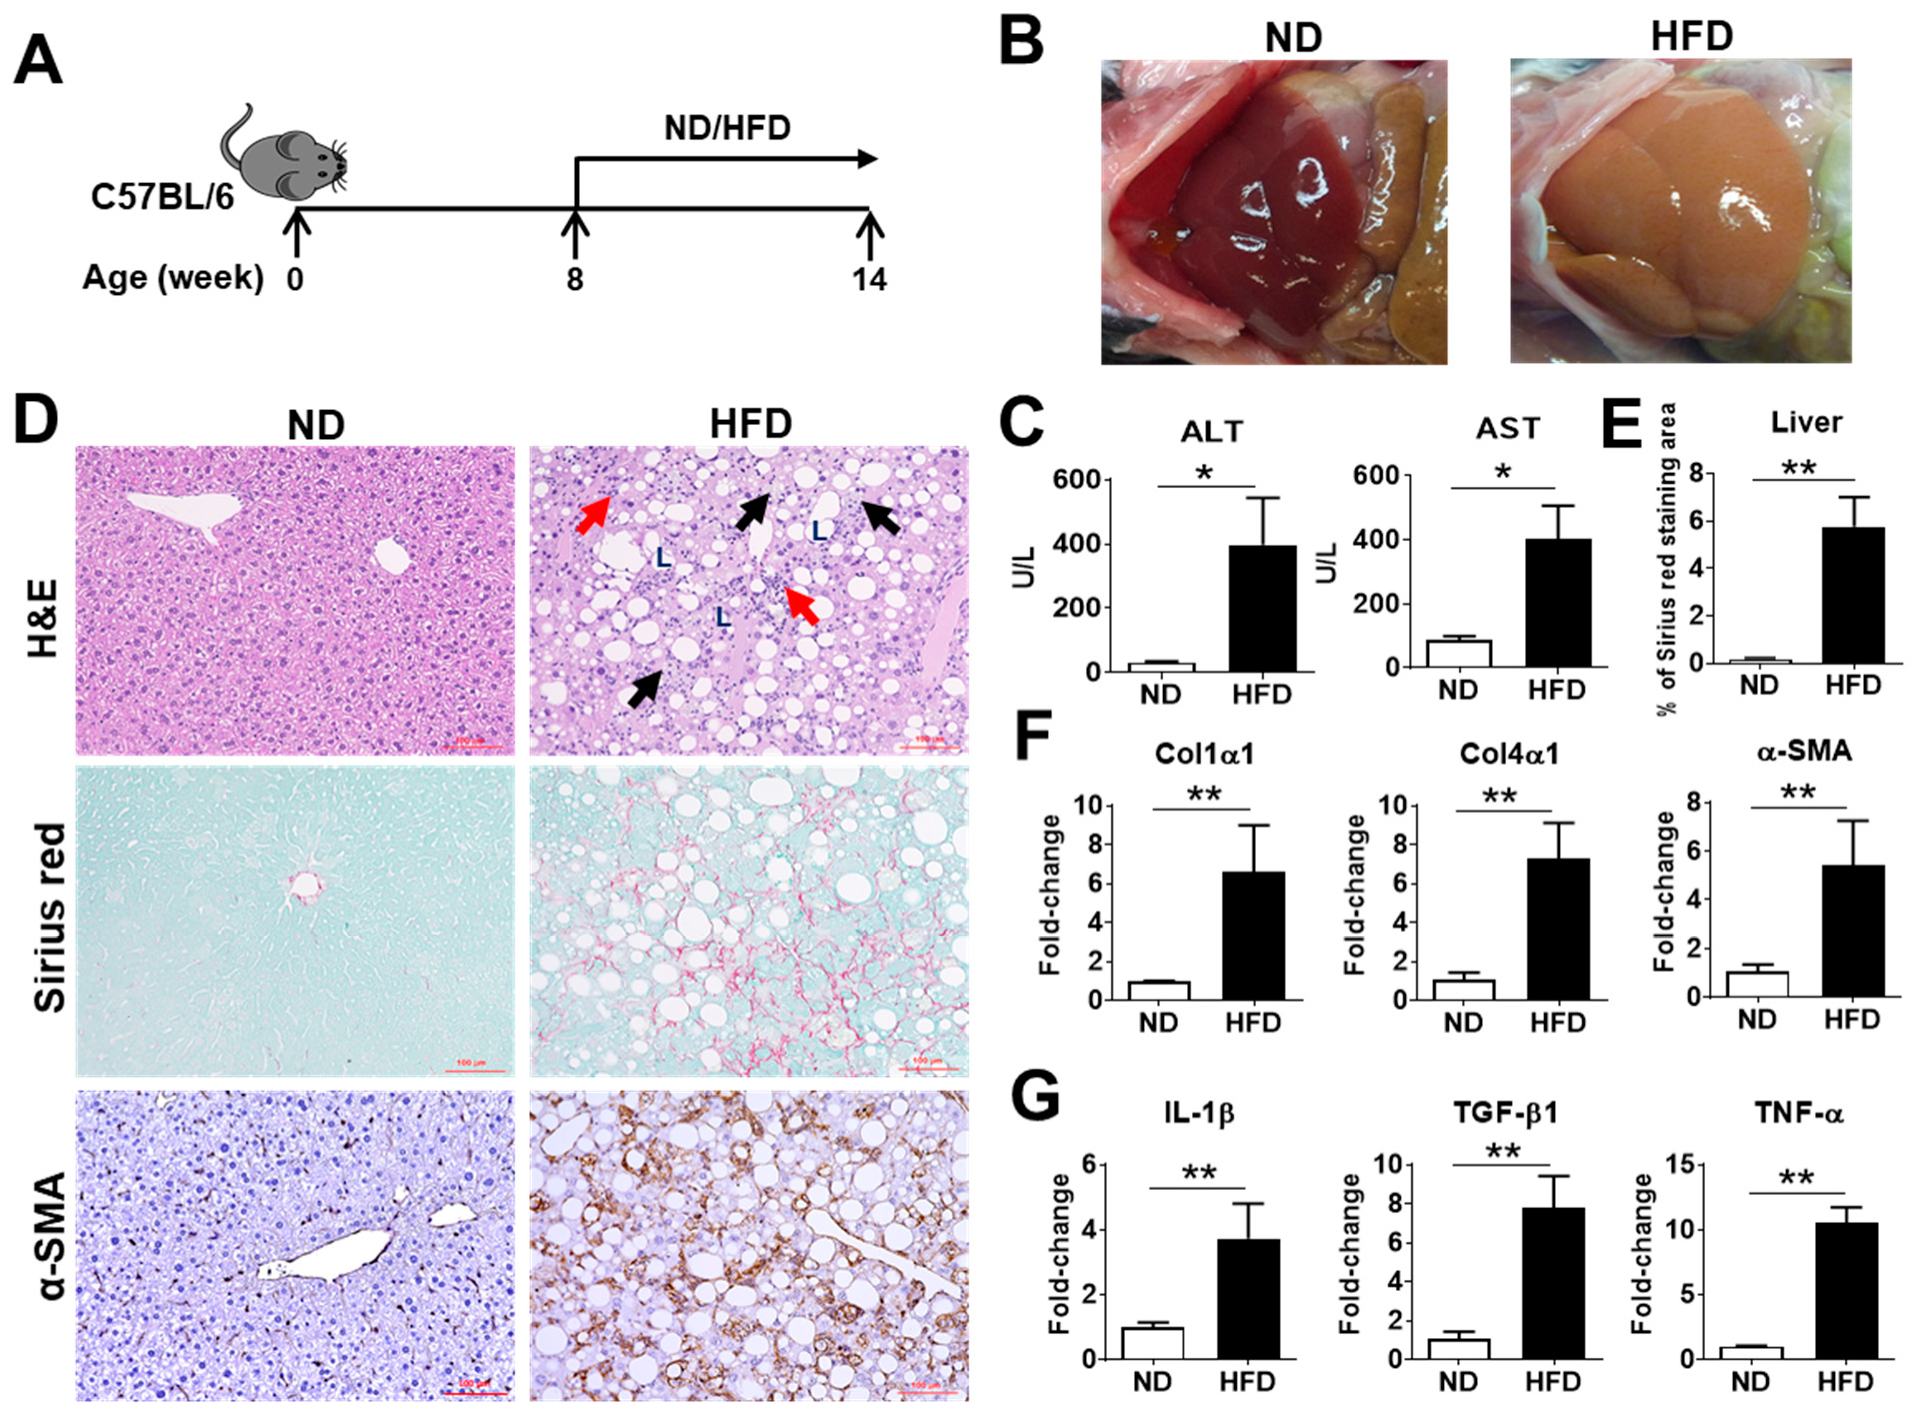
2.1. Characterization of NASH Pathogenesis in Mice Induced by a Choline-Deficient, L-Amino Acid-Defined, High-Fat Diet (CDAHFD)
2.2. ASTN Inhibits the Progression of NASH
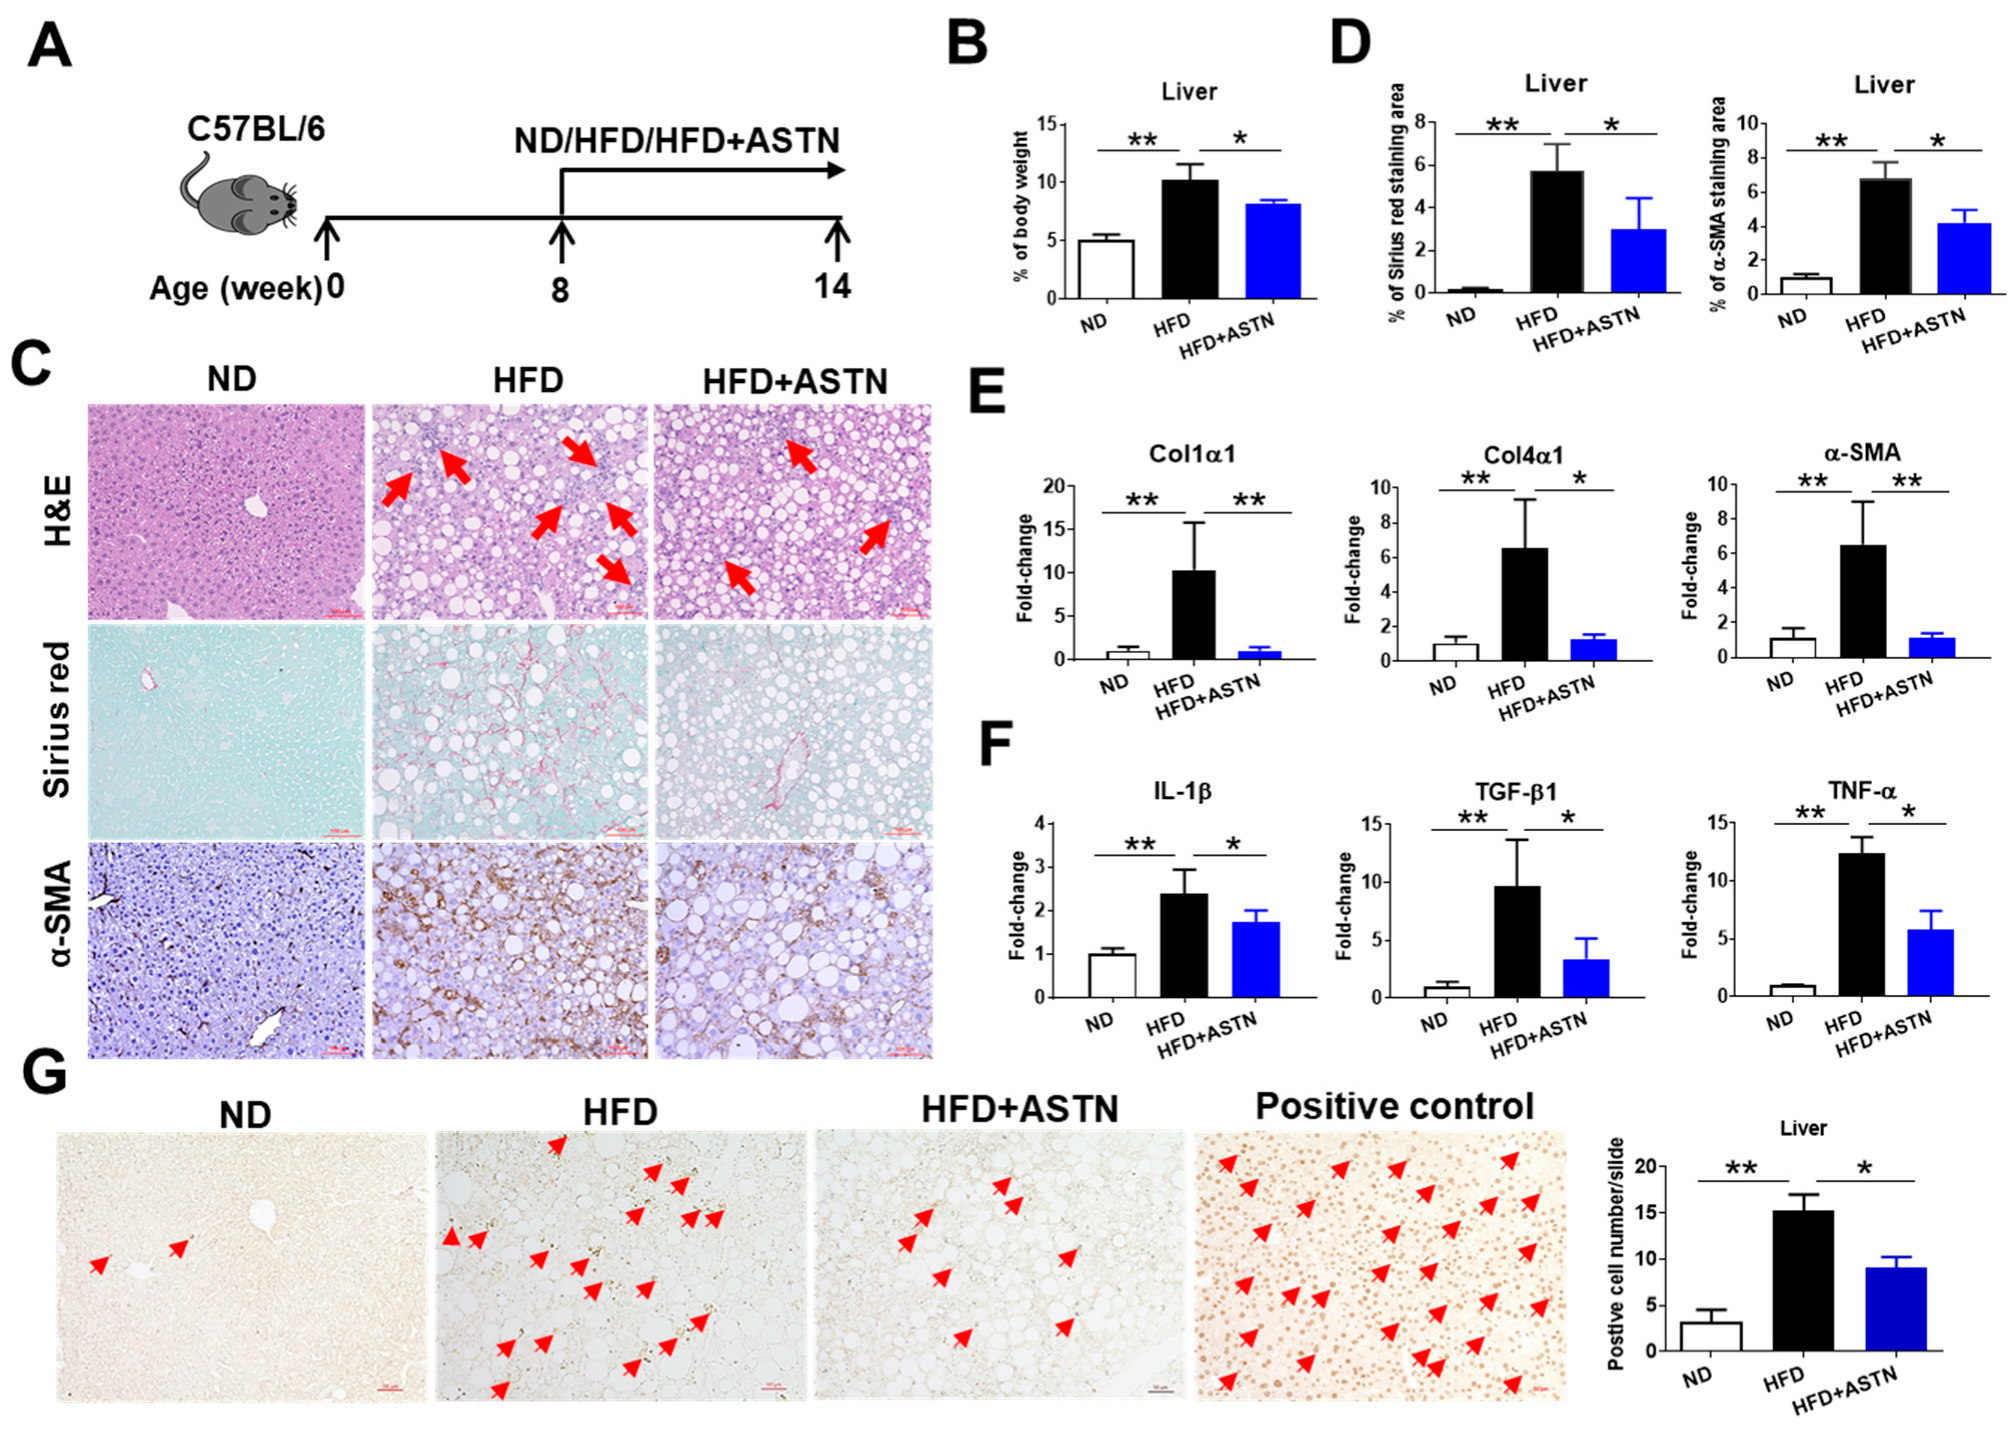
2.3. ASTN Inhibits the Progression of Liver Fibrosis
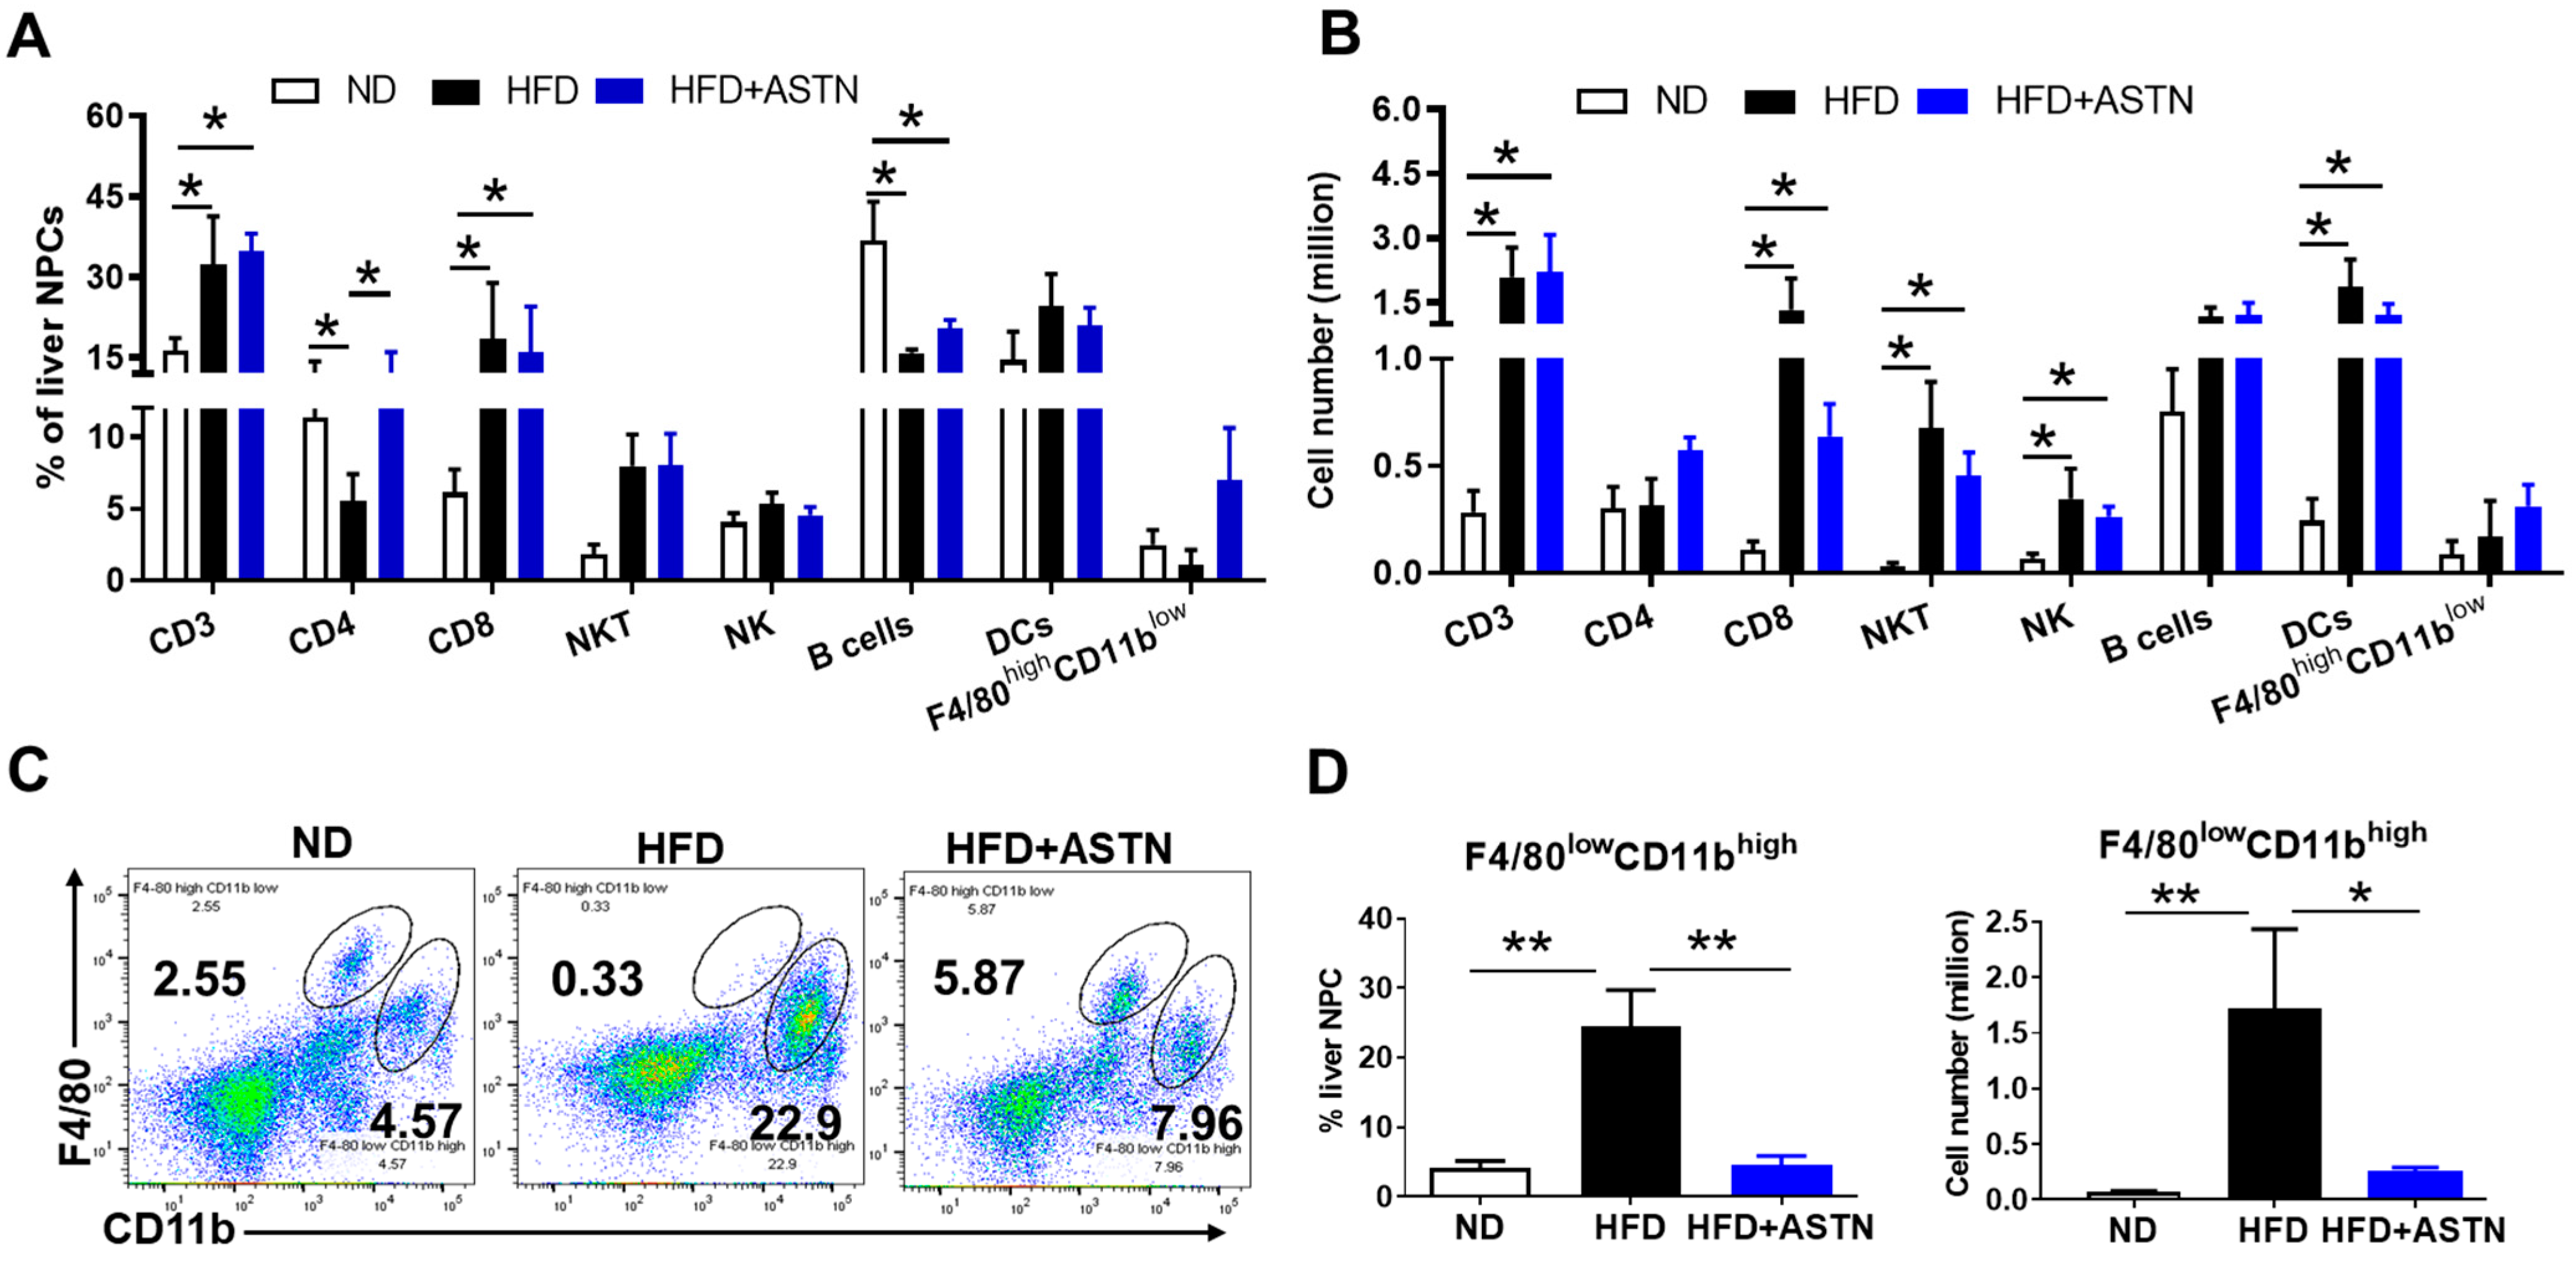
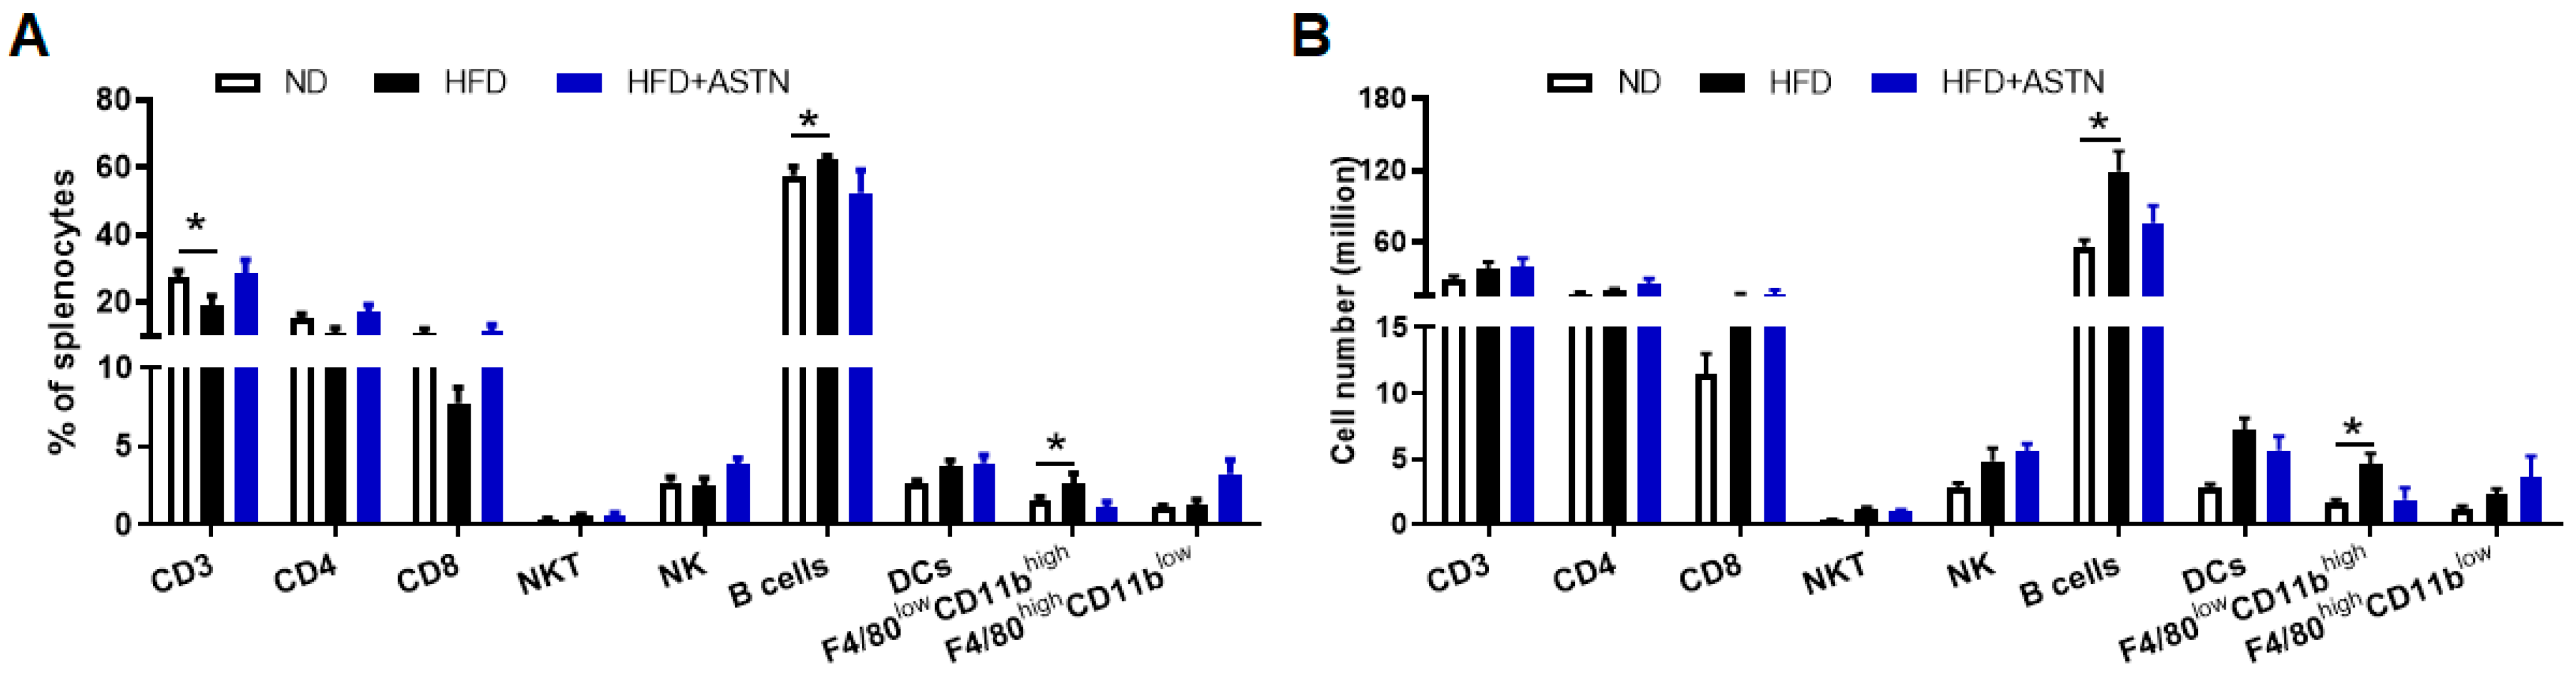
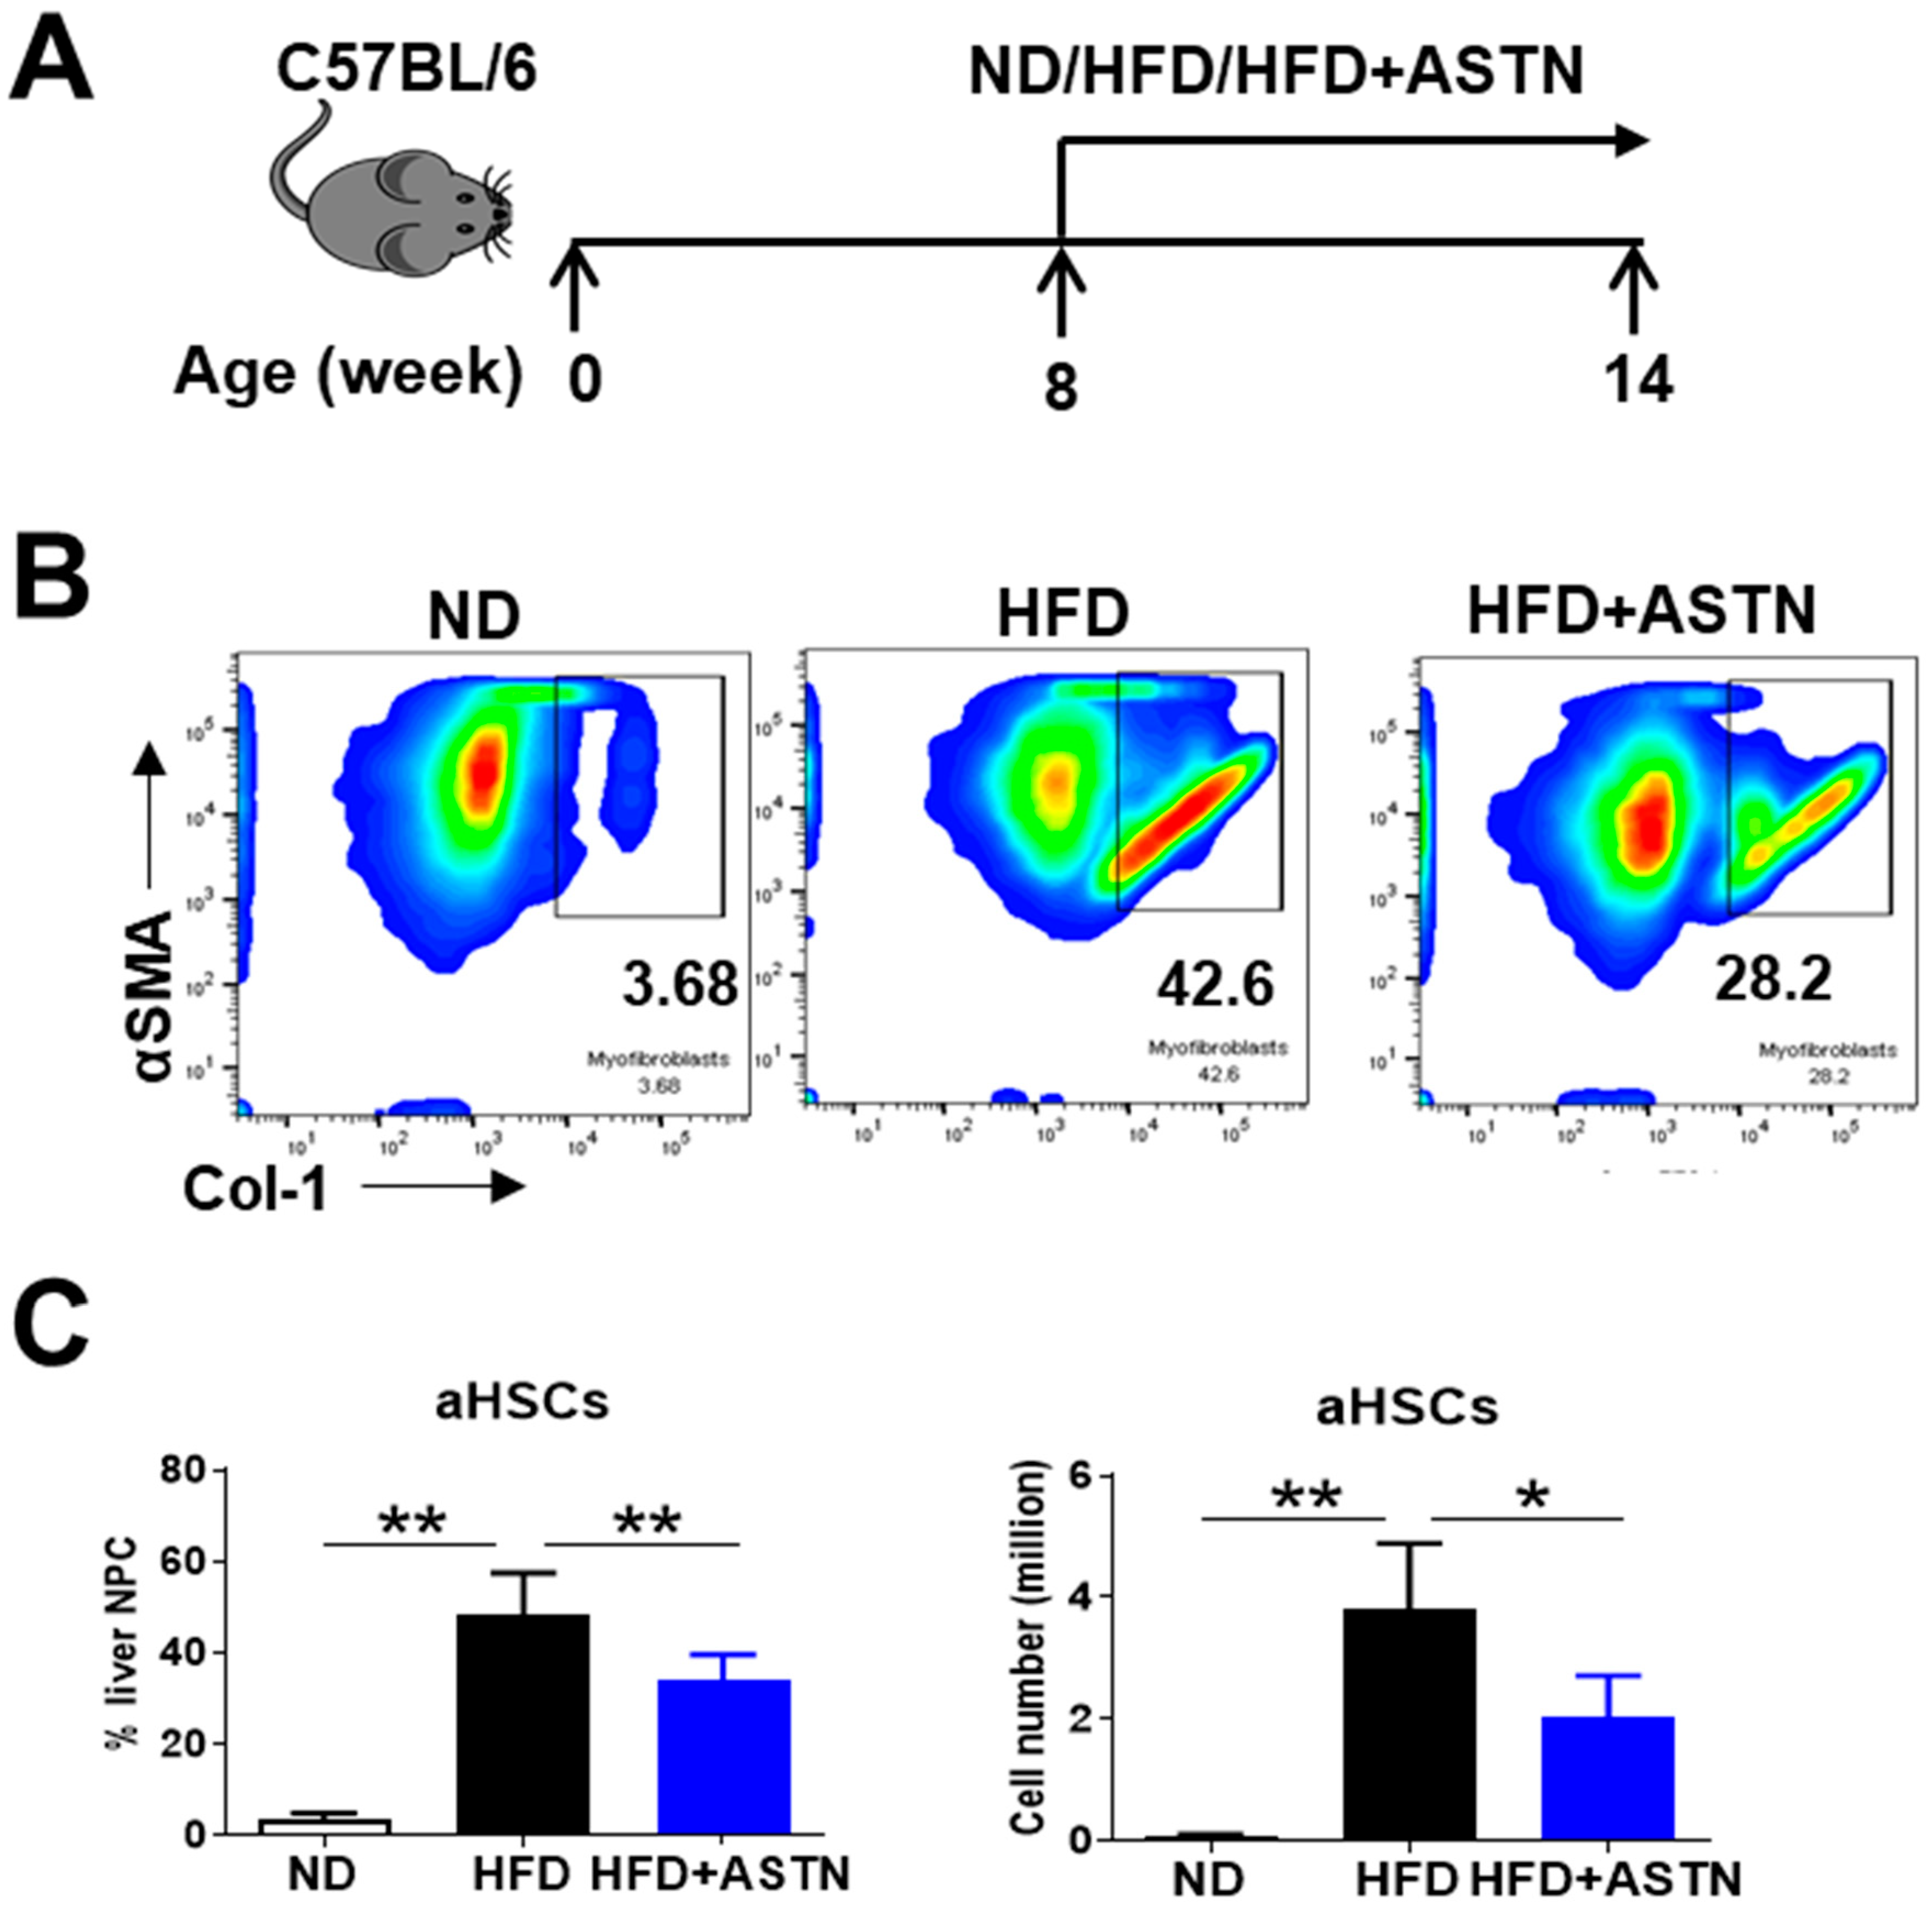
2.4. ASTN Modulates Intrahepatic Immunity
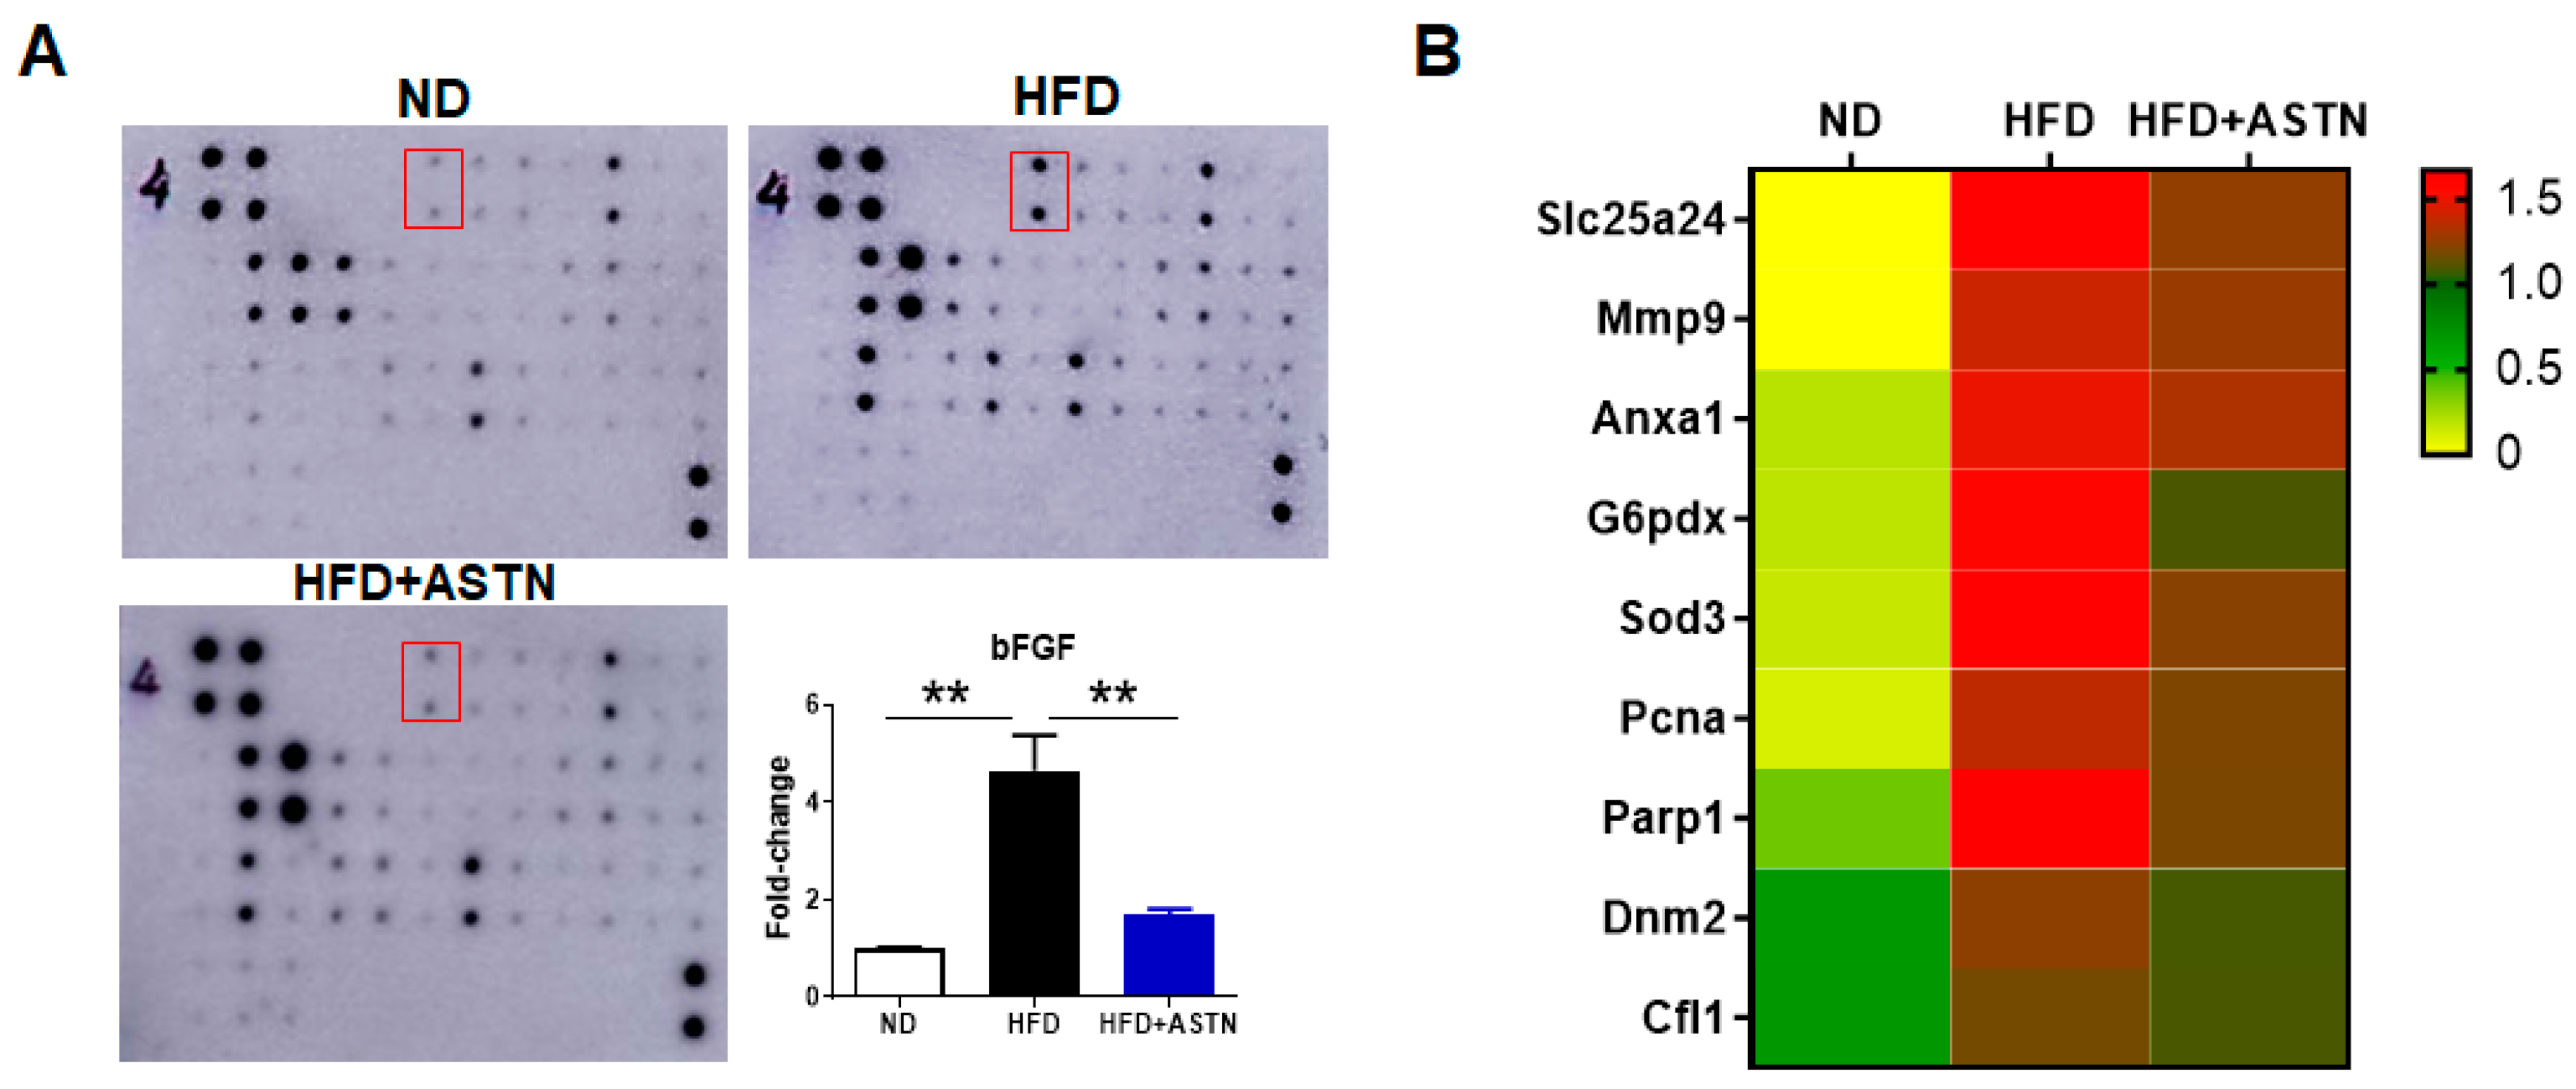
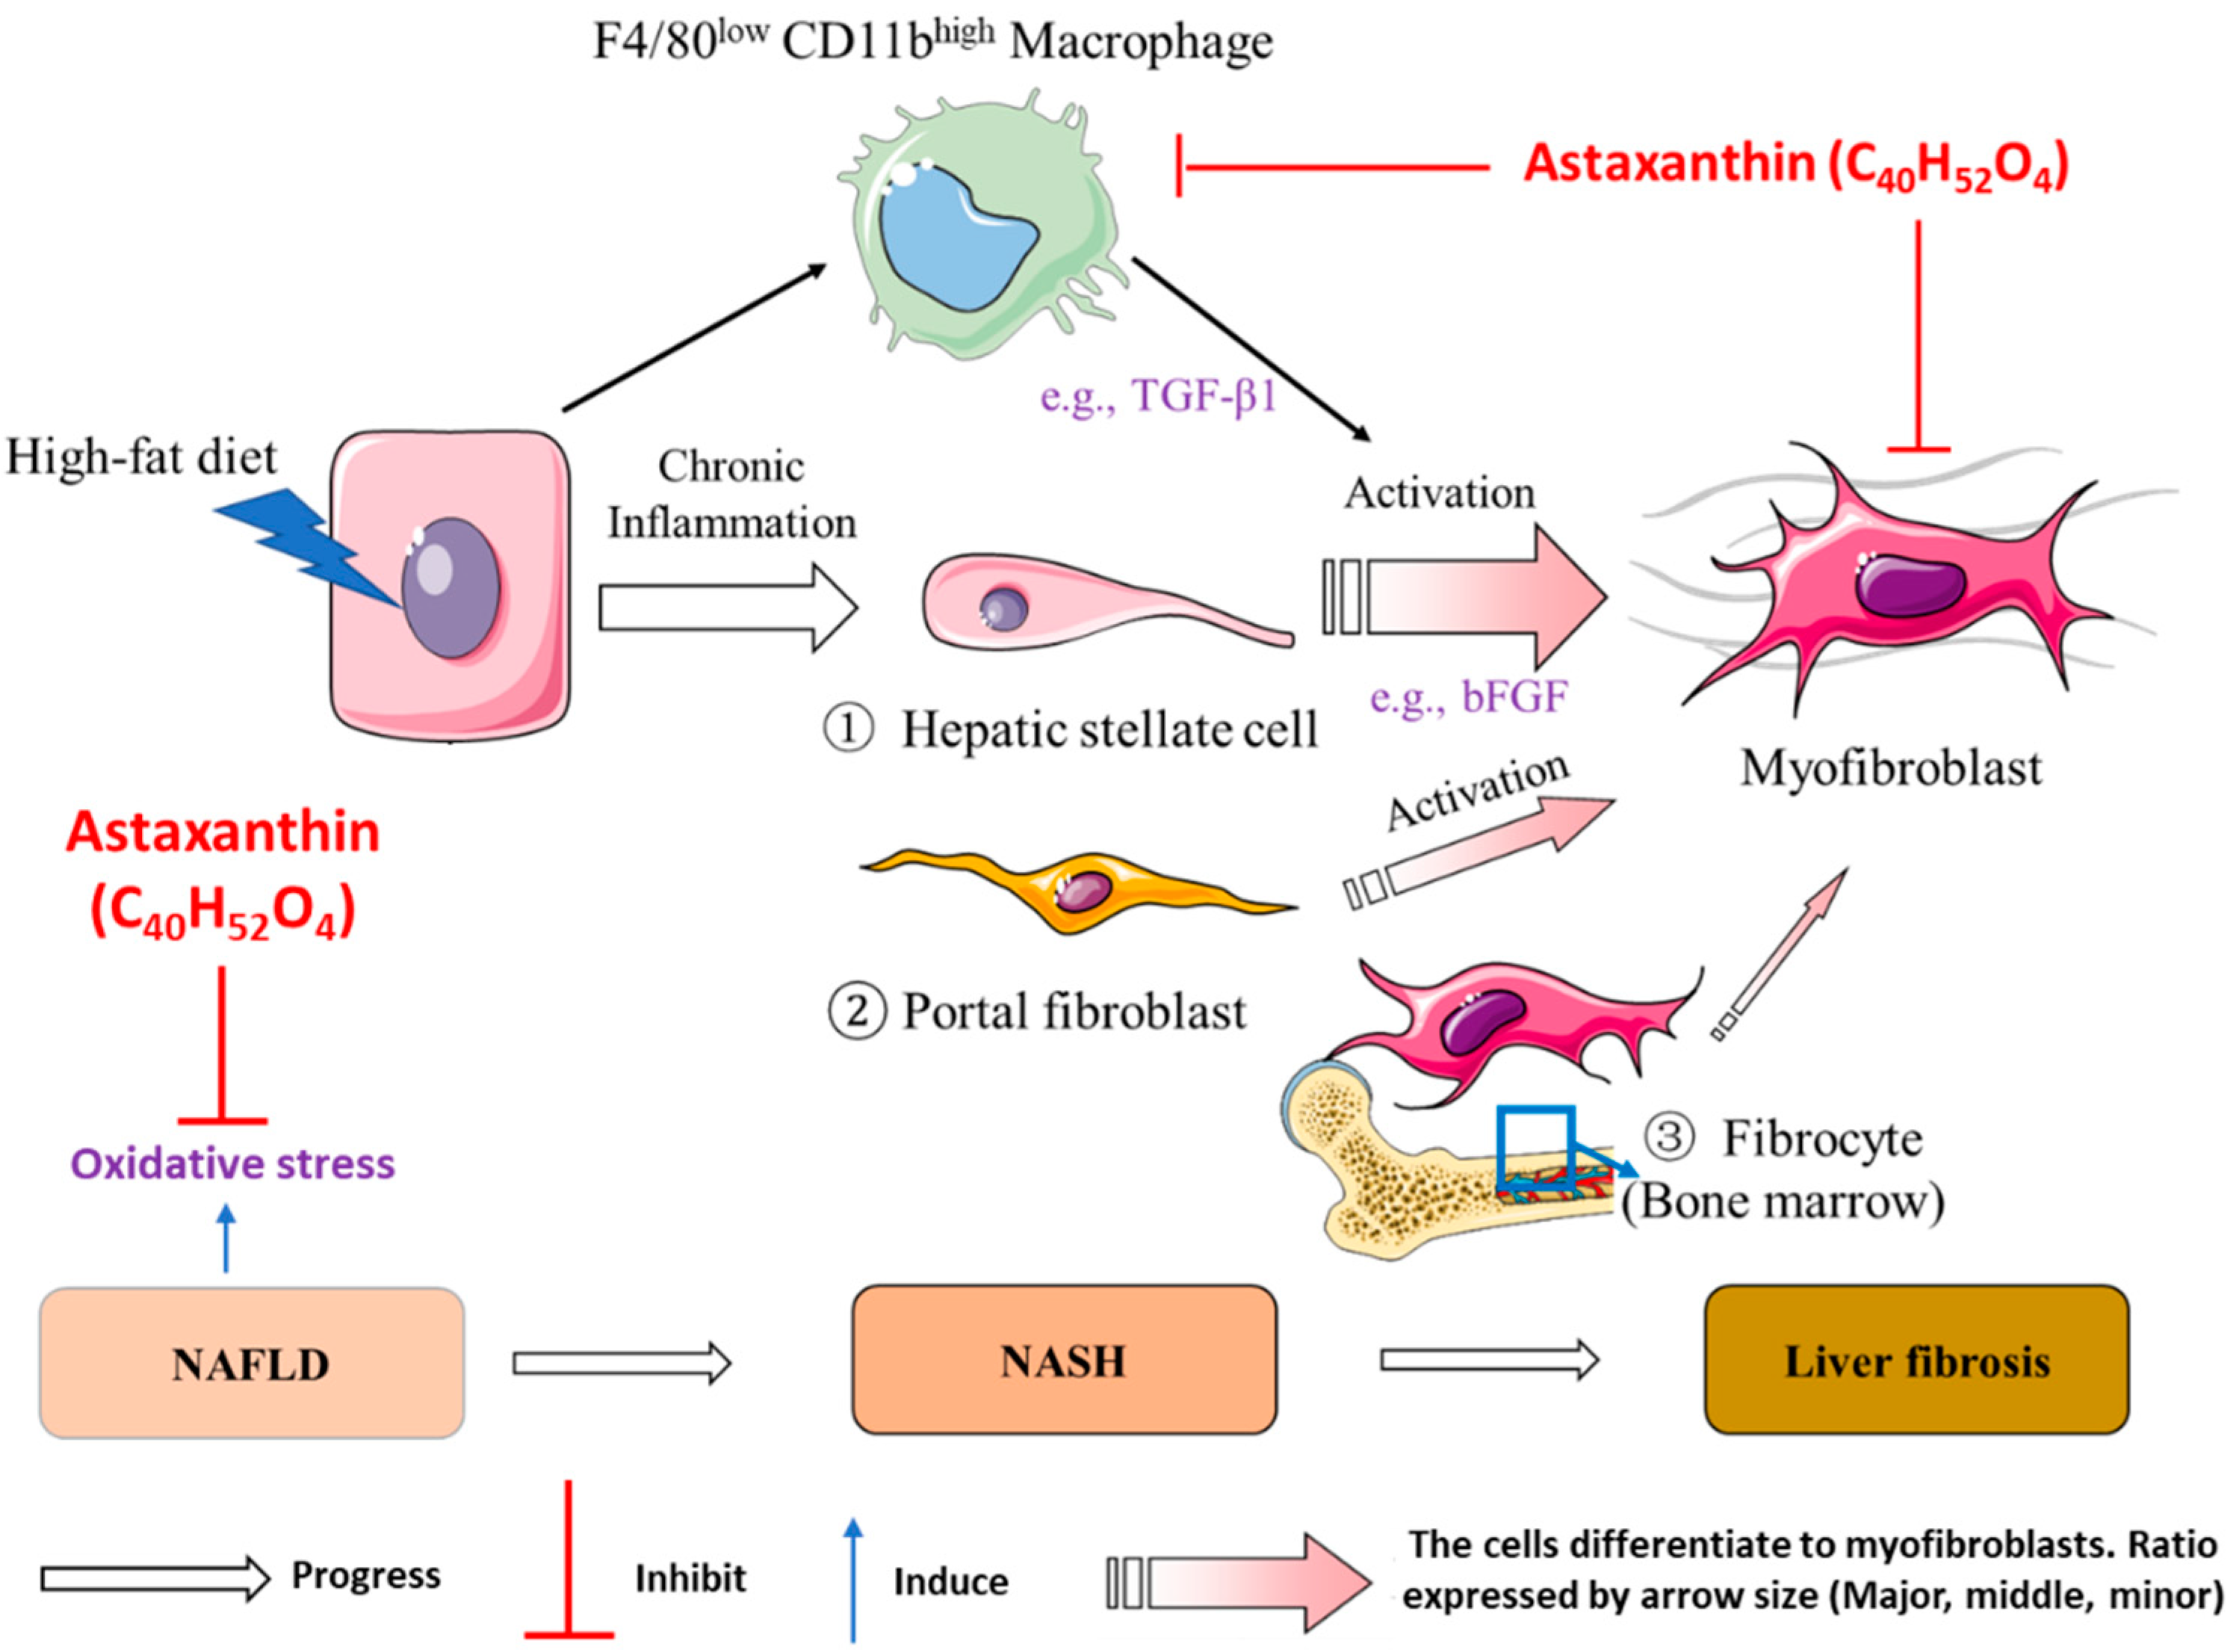
2.5. ASTN Inhibits Hepatic bFGF Expression and Oxidative Stress in NASH Mice
3. Discussion
4. Materials and Methods
4.1. Animals, Diets, and Murine NASH Model
4.2. Cell Lines, Bacterial Strains, and Medium
4.3. Blood Biochemistry Test
4.4. Total RNA Extraction and Real-Time PCR (qPCR)
4.5. Isolation of Liver-Infiltrating Leukocytes and Spleen Lymphocytes
4.6. Flow Cytometry
4.7. H&E Staining
4.8. Liver Collagen Staining
4.9. Immunohistochemical Staining (IHC)
4.10. TUNEL Assay
4.11. Cytokine Array Assay
4.12. Proteomic Analysis
4.13. Statistical Analysis
5. Conclusions
Supplementary Materials
Author Contributions
Funding
Institutional Review Board Statement
Informed Consent Statement
Data Availability Statement
Conflicts of Interest
References
- Younossi, Z.M. Non-alcoholic fatty liver disease—A global public health perspective. J. Hepatol. 2019, 70, 531–544. [Google Scholar] [CrossRef] [Green Version]
- Kleiner, D.E.; Makhlouf, H.R. Histology of Nonalcoholic Fatty Liver Disease and Nonalcoholic Steatohepatitis in Adults and Children. Clin. Liver Dis. 2016, 20, 293–312. [Google Scholar] [CrossRef] [Green Version]
- Younossi, Z.M.; Koenig, A.B.; Abdelatif, D.; Fazel, Y.; Henry, L.; Wymer, M. Global epidemiology of nonalcoholic fatty liver disease-Meta-analytic assessment of prevalence, incidence, and outcomes. Hepatology 2016, 64, 73–84. [Google Scholar] [CrossRef] [Green Version]
- Akahane, T.; Akahane, M.; Namisaki, T.; Kaji, K.; Moriya, K.; Kawaratani, H.; Takaya, H.; Sawada, Y.; Shimozato, N.; Fujinaga, Y.; et al. Association between Non-Alcoholic Fatty Liver Disease and Chronic Kidney Disease: A Cross-Sectional Study. J. Clin. Med. 2020, 9, 1635. [Google Scholar] [CrossRef]
- Saokaew, S.; Kanchanasurakit, S.; Thawichai, K.; Duangprom, P.; Wannasri, M.; Khankham, S.; Kositamongkol, C.; Chaiyakunapruk, N.; Phisalprapa, P. Association of non-alcoholic fatty liver disease and all-cause mortality in hospitalized cardiovascular disease patients: A systematic review and meta-analysis. Medicine (Baltimore) 2021, 100, e24557. [Google Scholar] [CrossRef] [PubMed]
- Simon, T.G.; Roelstraete, B.; Hartjes, K.; Shah, U.; Khalili, H.; Arnell, H.; Ludvigsson, J.F. Non-alcoholic fatty liver disease in children and young adults is associated with increased long-term mortality. J. Hepatol. 2021. [Google Scholar] [CrossRef]
- Zhang, C.; Yang, M. The Emerging Factors and Treatment Options for NAFLD-Related Hepatocellular Carcinoma. Cancers 2021, 13, 3740. [Google Scholar] [CrossRef]
- Zhang, C.; Yang, M. Current Options and Future Directions for NAFLD and NASH Treatment. Int. J. Mol. Sci. 2021, 22, 7571. [Google Scholar] [CrossRef]
- Arroyave-Ospina, J.C.; Wu, Z.; Geng, Y.; Moshage, H. Role of Oxidative Stress in the Pathogenesis of Non-Alcoholic Fatty Liver Disease: Implications for Prevention and Therapy. Antioxidants 2021, 10, 174. [Google Scholar] [CrossRef]
- Boussiba, S.; Vonshak, A. Astaxanthin Accumulation in the Green Alga Haematococcus pluvialis1. Plant Cell Physiol. 1991, 32, 1077–1082. [Google Scholar] [CrossRef] [Green Version]
- Liu, J.; Sun, Z.; Gerken, H.; Liu, Z.; Jiang, Y.; Chen, F. Chlorella zofingiensis as an alternative microalgal producer of astaxanthin: Biology and industrial potential. Mar. Drugs 2014, 12, 3487–3515. [Google Scholar] [CrossRef] [Green Version]
- Barredo, J.L.; García-Estrada, C.; Kosalkova, K.; Barreiro, C. Biosynthesis of Astaxanthin as a Main Carotenoid in the Heterobasidiomycetous Yeast Xanthophyllomyces dendrorhous. J. Fungi 2017, 3, 44. [Google Scholar] [CrossRef] [Green Version]
- Brasil, F.B.; de Almeida, F.J.S.; Luckachaki, M.D.; Dall’Oglio, E.L.; de Oliveira, M.R. Astaxanthin prevents mitochondrial impairment in the dopaminergic SH-SY5Y cell line exposed to glutamate-mediated excitotoxicity: Role for the Nrf2/HO-1/CO-BR axis. Eur. J. Pharmacol. 2021, 908, 174336. [Google Scholar] [CrossRef]
- Ni, Y.; Wu, T.; Yang, L.; Xu, Y.; Ota, T.; Fu, Z. Protective effects of astaxanthin on a combination of D-galactose and jet lag-induced aging model in mice. Endocr. J. 2018, 65, 569–578. [Google Scholar] [CrossRef] [Green Version]
- Badak, B.; Aykanat, N.E.B.; Kacar, S.; Sahinturk, V.; Arik, D.; Canaz, F. Effects of astaxanthin on metastasis suppressors in ductal carcinoma. A preliminary study. Ann. Ital. Chir. 2021, 10. [Google Scholar]
- Davinelli, S.; Nielsen, M.E.; Scapagnini, G. Astaxanthin in Skin Health, Repair, and Disease: A Comprehensive Review. Nutrients 2018, 10, 522. [Google Scholar] [CrossRef] [Green Version]
- Liu, N.; Zeng, L.; Zhang, Y.M.; Pan, W.; Lai, H. Astaxanthin alleviates pathological brain aging through the upregulation of hippocampal synaptic proteins. Neural Regen. Res. 2021, 16, 1062–1067. [Google Scholar] [CrossRef] [PubMed]
- Li, Y.; Wang, Q.; Chu, C.; Liu, S. Astaxanthin protects retinal ganglion cells from acute glaucoma via the Nrf2/HO-1 pathway. J. Chem. Neuroanat. 2020, 110, 101876. [Google Scholar] [CrossRef] [PubMed]
- Zaafan, M.A.; Abdelhamid, A.M. The cardioprotective effect of astaxanthin against isoprenaline-induced myocardial injury in rats: Involvement of TLR4/NF-κB signaling pathway. Eur. Rev. Med. Pharmacol. Sci. 2021, 25, 4099–4105. [Google Scholar] [CrossRef]
- Cai, X.; Chen, Y.; Xie, X.; Yao, D.; Ding, C.; Chen, M. Astaxanthin prevents against lipopolysaccharide-induced acute lung injury and sepsis via inhibiting activation of MAPK/NF-κB. Am. J. Transl. Res. 2019, 11, 1884–1894. [Google Scholar]
- Guo, S.; Guo, L.; Fang, Q.; Yu, M.; Zhang, L.; You, C.; Wang, X.; Liu, Y.; Han, C. Astaxanthin protects against early acute kidney injury in severely burned rats by inactivating the TLR4/MyD88/NF-κB axis and upregulating heme oxygenase-1. Sci. Rep. 2021, 11, 6679. [Google Scholar] [CrossRef]
- Zhang, H.; Yang, W.; Li, Y.; Hu, L.; Dai, Y.; Chen, J.; Xu, S.; Xu, X.; Jiang, H. Astaxanthin ameliorates cerulein-induced acute pancreatitis in mice. Int. Immunopharmacol. 2018, 56, 18–28. [Google Scholar] [CrossRef]
- Shen, M.; Chen, K.; Lu, J.; Cheng, P.; Xu, L.; Dai, W.; Wang, F.; He, L.; Zhang, Y.; Chengfen, W.; et al. Protective effect of astaxanthin on liver fibrosis through modulation of TGF-β1 expression and autophagy. Mediat. Inflamm. 2014, 2014, 954502. [Google Scholar] [CrossRef] [PubMed] [Green Version]
- Nishida, Y.; Nawaz, A.; Kado, T.; Takikawa, A.; Igarashi, Y.; Onogi, Y.; Wada, T.; Sasaoka, T.; Yamamoto, S.; Sasahara, M.; et al. Astaxanthin stimulates mitochondrial biogenesis in insulin resistant muscle via activation of AMPK pathway. J. Cachexia Sarcopenia Muscle 2020, 11, 241–258. [Google Scholar] [CrossRef] [PubMed] [Green Version]
- Imajo, K.; Yoneda, M.; Kessoku, T.; Ogawa, Y.; Maeda, S.; Sumida, Y.; Hyogo, H.; Eguchi, Y.; Wada, K.; Nakajima, A. Rodent models of nonalcoholic fatty liver disease/nonalcoholic steatohepatitis. Int. J. Mol. Sci. 2013, 14, 21833–21857. [Google Scholar] [CrossRef] [PubMed] [Green Version]
- Matsumoto, M.; Hada, N.; Sakamaki, Y.; Uno, A.; Shiga, T.; Tanaka, C.; Ito, T.; Katsume, A.; Sudoh, M. An improved mouse model that rapidly develops fibrosis in non-alcoholic steatohepatitis. Int. J. Exp. Pathol. 2013, 94, 93–103. [Google Scholar] [CrossRef] [PubMed] [Green Version]
- Ikawa-Yoshida, A.; Matsuo, S.; Kato, A.; Ohmori, Y.; Higashida, A.; Kaneko, E.; Matsumoto, M. Hepatocellular carcinoma in a mouse model fed a choline-deficient, L-amino acid-defined, high-fat diet. Int. J. Exp. Pathol. 2017, 98, 221–233. [Google Scholar] [CrossRef]
- Zhong, F.; Zhou, X.; Xu, J.; Gao, L. Rodent Models of Nonalcoholic Fatty Liver Disease. Digestion 2020, 101, 522–535. [Google Scholar] [CrossRef]
- Friedman, S.L.; Neuschwander-Tetri, B.A.; Rinella, M.; Sanyal, A.J. Mechanisms of NAFLD development and therapeutic strategies. Nat. Med. 2018, 24, 908–922. [Google Scholar] [CrossRef]
- Mederacke, I.; Hsu, C.C.; Troeger, J.S.; Huebener, P.; Mu, X.; Dapito, D.H.; Pradere, J.P.; Schwabe, R.F. Fate tracing reveals hepatic stellate cells as dominant contributors to liver fibrosis independent of its aetiology. Nat. Commun. 2013, 4, 2823. [Google Scholar] [CrossRef] [Green Version]
- Kisseleva, T.; Cong, M.; Paik, Y.; Scholten, D.; Jiang, C.; Benner, C.; Iwaisako, K.; Moore-Morris, T.; Scott, B.; Tsukamoto, H.; et al. Myofibroblasts revert to an inactive phenotype during regression of liver fibrosis. Proc. Natl. Acad. Sci. USA 2012, 109, 9448–9453. [Google Scholar] [CrossRef] [Green Version]
- Sutti, S.; Albano, E. Adaptive immunity: An emerging player in the progression of NAFLD. Nat. Rev. Gastroenterol. Hepatol. 2020, 17, 81–92. [Google Scholar] [CrossRef] [PubMed]
- Ore, A.; Akinloye, O.A. Oxidative Stress and Antioxidant Biomarkers in Clinical and Experimental Models of Non-Alcoholic Fatty Liver Disease. Medicina (Kaunas) 2019, 55, 26. [Google Scholar] [CrossRef] [Green Version]
- Anstee, Q.M.; Reeves, H.L.; Kotsiliti, E.; Govaere, O.; Heikenwalder, M. From NASH to HCC: Current concepts and future challenges. Nat. Rev. Gastroenterol. Hepatol. 2019, 16, 411–428. [Google Scholar] [CrossRef] [PubMed]
- Hussein, G.; Nakagawa, T.; Goto, H.; Shimada, Y.; Matsumoto, K.; Sankawa, U.; Watanabe, H. Astaxanthin ameliorates features of metabolic syndrome in SHR/NDmcr-cp. Life Sci. 2007, 80, 522–529. [Google Scholar] [CrossRef] [PubMed]
- Zhuge, F.; Ni, Y.; Wan, C.; Liu, F.; Fu, Z. Anti-diabetic effects of astaxanthin on an STZ-induced diabetic model in rats. Endocr. J. 2021, 68, 451–459. [Google Scholar] [CrossRef] [PubMed]
- Ni, Y.; Nagashimada, M.; Zhuge, F.; Zhan, L.; Nagata, N.; Tsutsui, A.; Nakanuma, Y.; Kaneko, S.; Ota, T. Astaxanthin prevents and reverses diet-induced insulin resistance and steatohepatitis in mice: A comparison with vitamin E. Sci. Rep. 2015, 5, 17192. [Google Scholar] [CrossRef] [PubMed]
- Mashhadi, N.S.; Zakerkish, M.; Mohammadiasl, J.; Zarei, M.; Mohammadshahi, M.; Haghighizadeh, M.H. Astaxanthin improves glucose metabolism and reduces blood pressure in patients with type 2 diabetes mellitus. Asia Pac. J. Clin. Nutr. 2018, 27, 341–346. [Google Scholar] [CrossRef]
- Zhang, Z.; Guo, C.; Jiang, H.; Han, B.; Wang, X.; Li, S.; Lv, Y.; Lv, Z.; Zhu, Y. Inflammation response after the cessation of chronic arsenic exposure and post-treatment of natural astaxanthin in liver: Potential role of cytokine-mediated cell-cell interactions. Food Funct. 2020, 11, 9252–9262. [Google Scholar] [CrossRef]
- Lee, S.J.; Bai, S.K.; Lee, K.S.; Namkoong, S.; Na, H.J.; Ha, K.S.; Han, J.A.; Yim, S.V.; Chang, K.; Kwon, Y.G.; et al. Astaxanthin inhibits nitric oxide production and inflammatory gene expression by suppressing I(kappa)B kinase-dependent NF-kappaB activation. Mol. Cells 2003, 16, 97–105. [Google Scholar]
- Baeck, C.; Wehr, A.; Karlmark, K.R.; Heymann, F.; Vucur, M.; Gassler, N.; Huss, S.; Klussmann, S.; Eulberg, D.; Luedde, T.; et al. Pharmacological inhibition of the chemokine CCL2 (MCP-1) diminishes liver macrophage infiltration and steatohepatitis in chronic hepatic injury. Gut 2012, 61, 416–426. [Google Scholar] [CrossRef] [PubMed]
- Li, J.; Xia, Y.; Liu, T.; Wang, J.; Dai, W.; Wang, F.; Zheng, Y.; Chen, K.; Li, S.; Abudumijiti, H.; et al. Protective effects of astaxanthin on ConA-induced autoimmune hepatitis by the JNK/p-JNK pathway-mediated inhibition of autophagy and apoptosis. PLoS ONE 2015, 10, e0120440. [Google Scholar] [CrossRef]
- Wu, L.; Mo, W.; Feng, J.; Li, J.; Yu, Q.; Li, S.; Zhang, J.; Chen, K.; Ji, J.; Dai, W.; et al. Astaxanthin attenuates hepatic damage and mitochondrial dysfunction in non-alcoholic fatty liver disease by up-regulating the FGF21/PGC-1α pathway. Br. J. Pharmacol. 2020, 177, 3760–3777. [Google Scholar] [CrossRef] [PubMed]
- Daemen, S.; Chan, M.M.; Schilling, J.D. Comprehensive analysis of liver macrophage composition by flow cytometry and immunofluorescence in murine NASH. STAR Protoc. 2021, 2, 100511. [Google Scholar] [CrossRef] [PubMed]
- Roth, K.; Rockwell, C.E.; Copple, B.L. Differential Sensitivity of Kupffer Cells and Hepatic Monocyte-Derived Macrophages to Bacterial Lipopolysaccharide. Clin. Exp. Gastroenterol. Hepatol. 2019, 1, 106. [Google Scholar] [CrossRef]
- Ota, T. Prevention of NAFLD/NASH by Astaxanthin and β-Cryptoxanthin. Adv. Exp. Med. Biol. 2021, 1261, 231–238. [Google Scholar] [CrossRef]
- Dudek, M.; Pfister, D.; Donakonda, S.; Filpe, P.; Schneider, A.; Laschinger, M.; Hartmann, D.; Hüser, N.; Meiser, P.; Bayerl, F.; et al. Auto-aggressive CXCR6(+) CD8 T cells cause liver immune pathology in NASH. Nature 2021, 592, 444–449. [Google Scholar] [CrossRef]
- Pfister, D.; Núñez, N.G.; Pinyol, R.; Govaere, O.; Pinter, M.; Szydlowska, M.; Gupta, R.; Qiu, M.; Deczkowska, A.; Weiner, A.; et al. NASH limits anti-tumour surveillance in immunotherapy-treated HCC. Nature 2021, 592, 450–456. [Google Scholar] [CrossRef]
- Barrow, F.; Khan, S.; Fredrickson, G.; Wang, H.; Dietsche, K.; Parthiban, P.; Robert, S.; Kaiser, T.; Winer, S.; Herman, A.; et al. Microbiota-Driven Activation of Intrahepatic B Cells Aggravates NASH through Innate and Adaptive Signaling. Hepatology 2021, 74, 704–722. [Google Scholar] [CrossRef]
- Barrow, F.; Khan, S.; Wang, H.; Revelo, X.S. The Emerging Role of B Cells in the Pathogenesis of NAFLD. Hepatology 2021, 74, 2277–2286. [Google Scholar] [CrossRef]
- Yu, C.; Wang, F.; Jin, C.; Huang, X.; Miller, D.L.; Basilico, C.; McKeehan, W.L. Role of fibroblast growth factor type 1 and 2 in carbon tetrachloride-induced hepatic injury and fibrogenesis. Am. J. Pathol. 2003, 163, 1653–1662. [Google Scholar] [CrossRef] [Green Version]
- Peng, X.; Wang, B.; Wang, T.; Zhao, Q. Expression of basic fibroblast growth factor in rat liver fibrosis and hepatic stellate cells. J. Huazhong Univ. Sci. Technol. Med. Sci. 2005, 25, 166–169. [Google Scholar] [CrossRef]
- Jin-no, K.; Tanimizu, M.; Hyodo, I.; Kurimoto, F.; Yamashita, T. Plasma level of basic fibroblast growth factor increases with progression of chronic liver disease. J. Gastroenterol. 1997, 32, 119–121. [Google Scholar] [CrossRef]
- Tsunematsu, H.; Tatsumi, T.; Kohga, K.; Yamamoto, M.; Aketa, H.; Miyagi, T.; Hosui, A.; Hiramatsu, N.; Kanto, T.; Hayashi, N.; et al. Fibroblast growth factor-2 enhances NK sensitivity of hepatocellular carcinoma cells. Int. J. Cancer 2012, 130, 356–364. [Google Scholar] [CrossRef]
- Chengye, W.; Yu, T.; Ping, S.; Deguang, S.; Keyun, W.; Yan, W.; Rixin, Z.; Rui, L.; Zhenming, G.; Mingliang, Y.; et al. Metformin reverses bFGF-induced epithelial-mesenchymal transition in HCC cells. Oncotarget 2017, 8, 104247–104257. [Google Scholar] [CrossRef] [PubMed] [Green Version]
- Dewidar, B.; Meyer, C.; Dooley, S.; Meindl-Beinker, A.N. TGF-β in Hepatic Stellate Cell Activation and Liver Fibrogenesis-Updated 2019. Cells 2019, 8, 1419. [Google Scholar] [CrossRef] [PubMed] [Green Version]
- Gao, Y.; Yang, L.; Chin, Y.; Liu, F.; Li, R.W.; Yuan, S.; Xue, C.; Xu, J.; Tang, Q. Astaxanthin n-Octanoic Acid Diester Ameliorates Insulin Resistance and Modulates Gut Microbiota in High-Fat and High-Sucrose Diet-Fed Mice. Int. J. Mol. Sci. 2020, 21, 2149. [Google Scholar] [CrossRef] [PubMed] [Green Version]
- Zhu, Y.; Gu, Z.; Liao, Y.; Li, S.; Xue, Y.; Adu Firempong, M.; Xu, Y.; Yu, J.; Smyth, H.D.C.; Xu, X. Improved intestinal absorption and oral bioavailability of astaxanthin via poly (ethylene glycol)-graft-chitosan nanoparticle: Preparation, in vitro evaluation and pharmacokinetics in rats. J. Sci. Food Agric. 2021. [Google Scholar] [CrossRef]
- Ponto, T.; Latter, G.; Luna, G.; Leite-Silva, V.R.; Wright, A.; Benson, H.A.E. Novel Self-Nano-Emulsifying Drug Delivery Systems Containing Astaxanthin for Topical Skin Delivery. Pharmaceutics 2021, 13, 649. [Google Scholar] [CrossRef]
- Qi, X.; Yang, M.; Ma, L.; Sauer, M.; Avella, D.; Kaifi, J.T.; Bryan, J.; Cheng, K.; Staveley-O’Carroll, K.F.; Kimchi, E.T.; et al. Synergizing sunitinib and radiofrequency ablation to treat hepatocellular cancer by triggering the antitumor immune response. J. Immunother. Cancer 2020, 8, e001038. [Google Scholar] [CrossRef]


Publisher’s Note: MDPI stays neutral with regard to jurisdictional claims in published maps and institutional affiliations. |
© 2021 by the authors. Licensee MDPI, Basel, Switzerland. This article is an open access article distributed under the terms and conditions of the Creative Commons Attribution (CC BY) license (https://creativecommons.org/licenses/by/4.0/).
Share and Cite
Yang, M.; Kimchi, E.T.; Staveley-O’Carroll, K.F.; Li, G. Astaxanthin Prevents Diet-Induced NASH Progression by Shaping Intrahepatic Immunity. Int. J. Mol. Sci. 2021, 22, 11037. https://doi.org/10.3390/ijms222011037
Yang M, Kimchi ET, Staveley-O’Carroll KF, Li G. Astaxanthin Prevents Diet-Induced NASH Progression by Shaping Intrahepatic Immunity. International Journal of Molecular Sciences. 2021; 22(20):11037. https://doi.org/10.3390/ijms222011037
Chicago/Turabian StyleYang, Ming, Eric T. Kimchi, Kevin F. Staveley-O’Carroll, and Guangfu Li. 2021. "Astaxanthin Prevents Diet-Induced NASH Progression by Shaping Intrahepatic Immunity" International Journal of Molecular Sciences 22, no. 20: 11037. https://doi.org/10.3390/ijms222011037
APA StyleYang, M., Kimchi, E. T., Staveley-O’Carroll, K. F., & Li, G. (2021). Astaxanthin Prevents Diet-Induced NASH Progression by Shaping Intrahepatic Immunity. International Journal of Molecular Sciences, 22(20), 11037. https://doi.org/10.3390/ijms222011037