
Amyloid-β Processing in Aged S100B Transgenic Mice Is Sex Dependent

 ,
,  and
and
Abstract
:
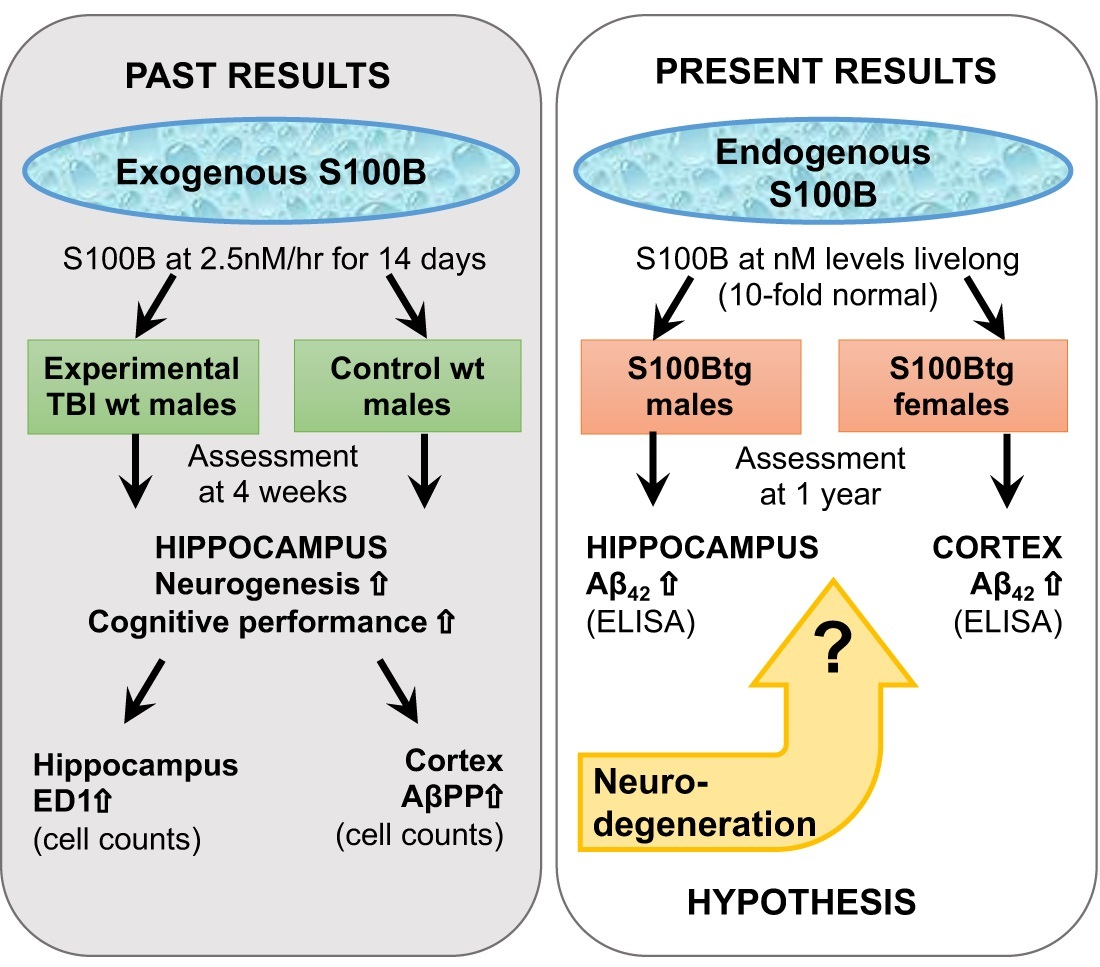
1. Introduction
2. Results
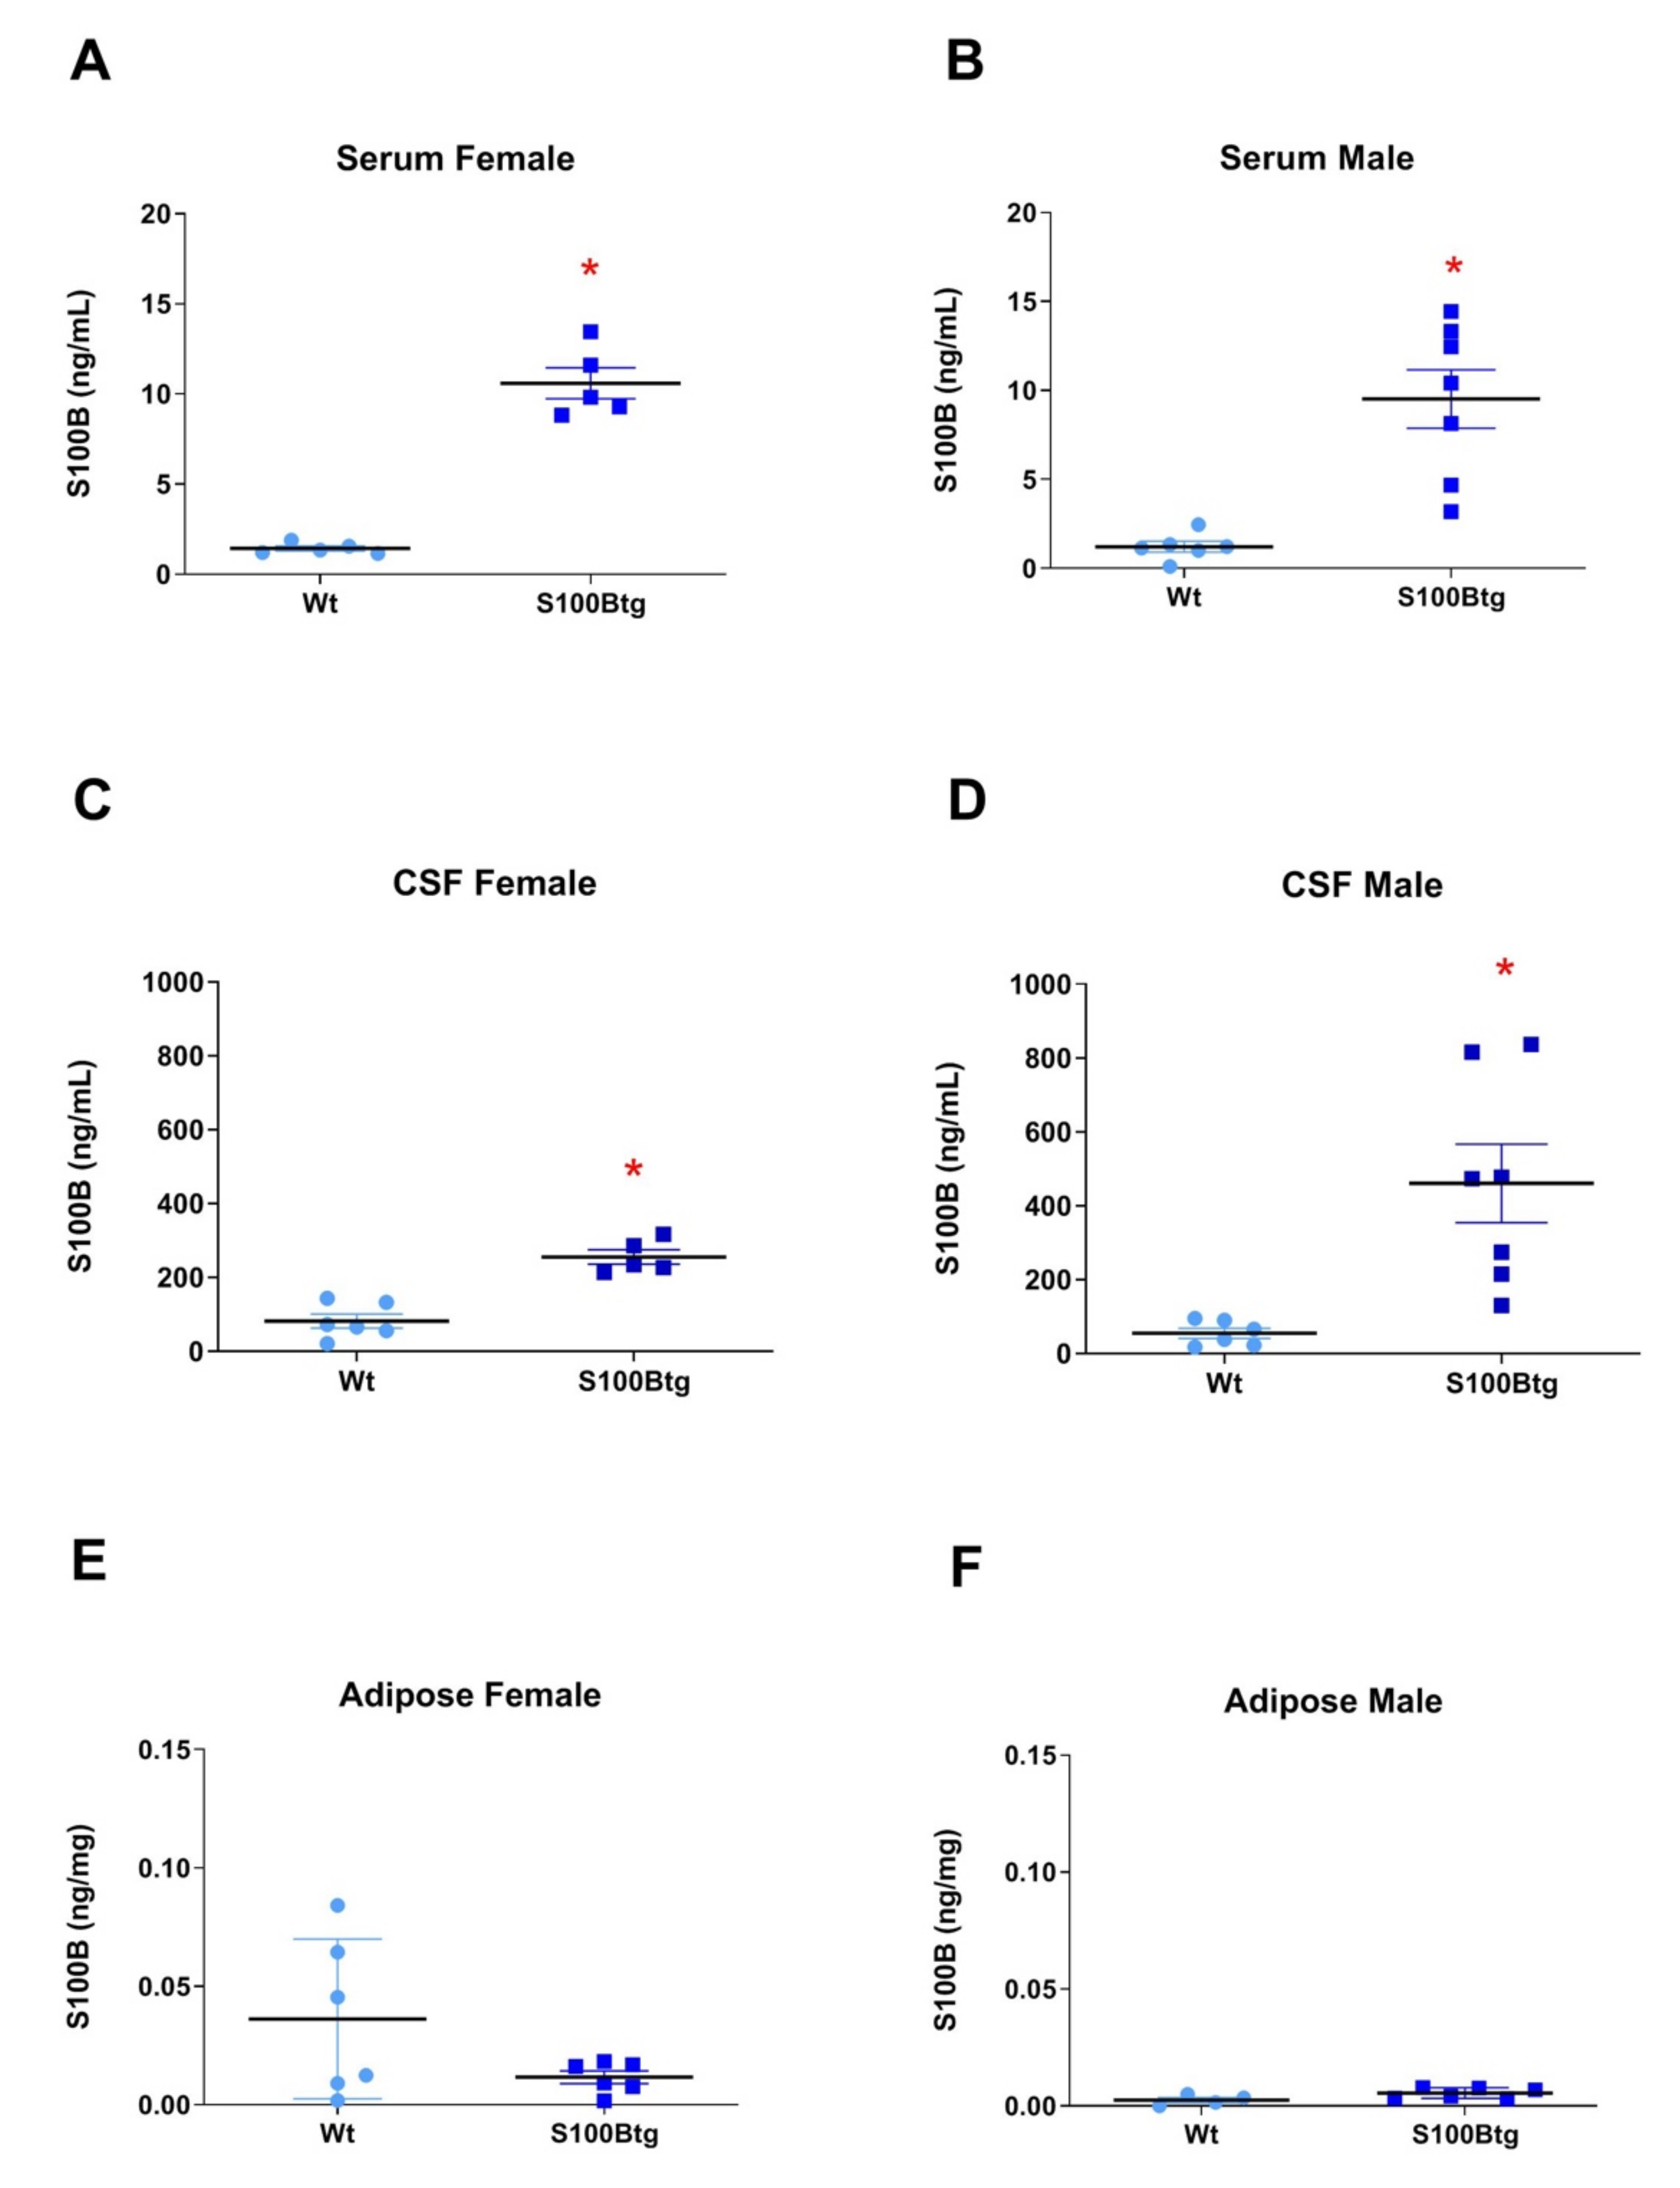
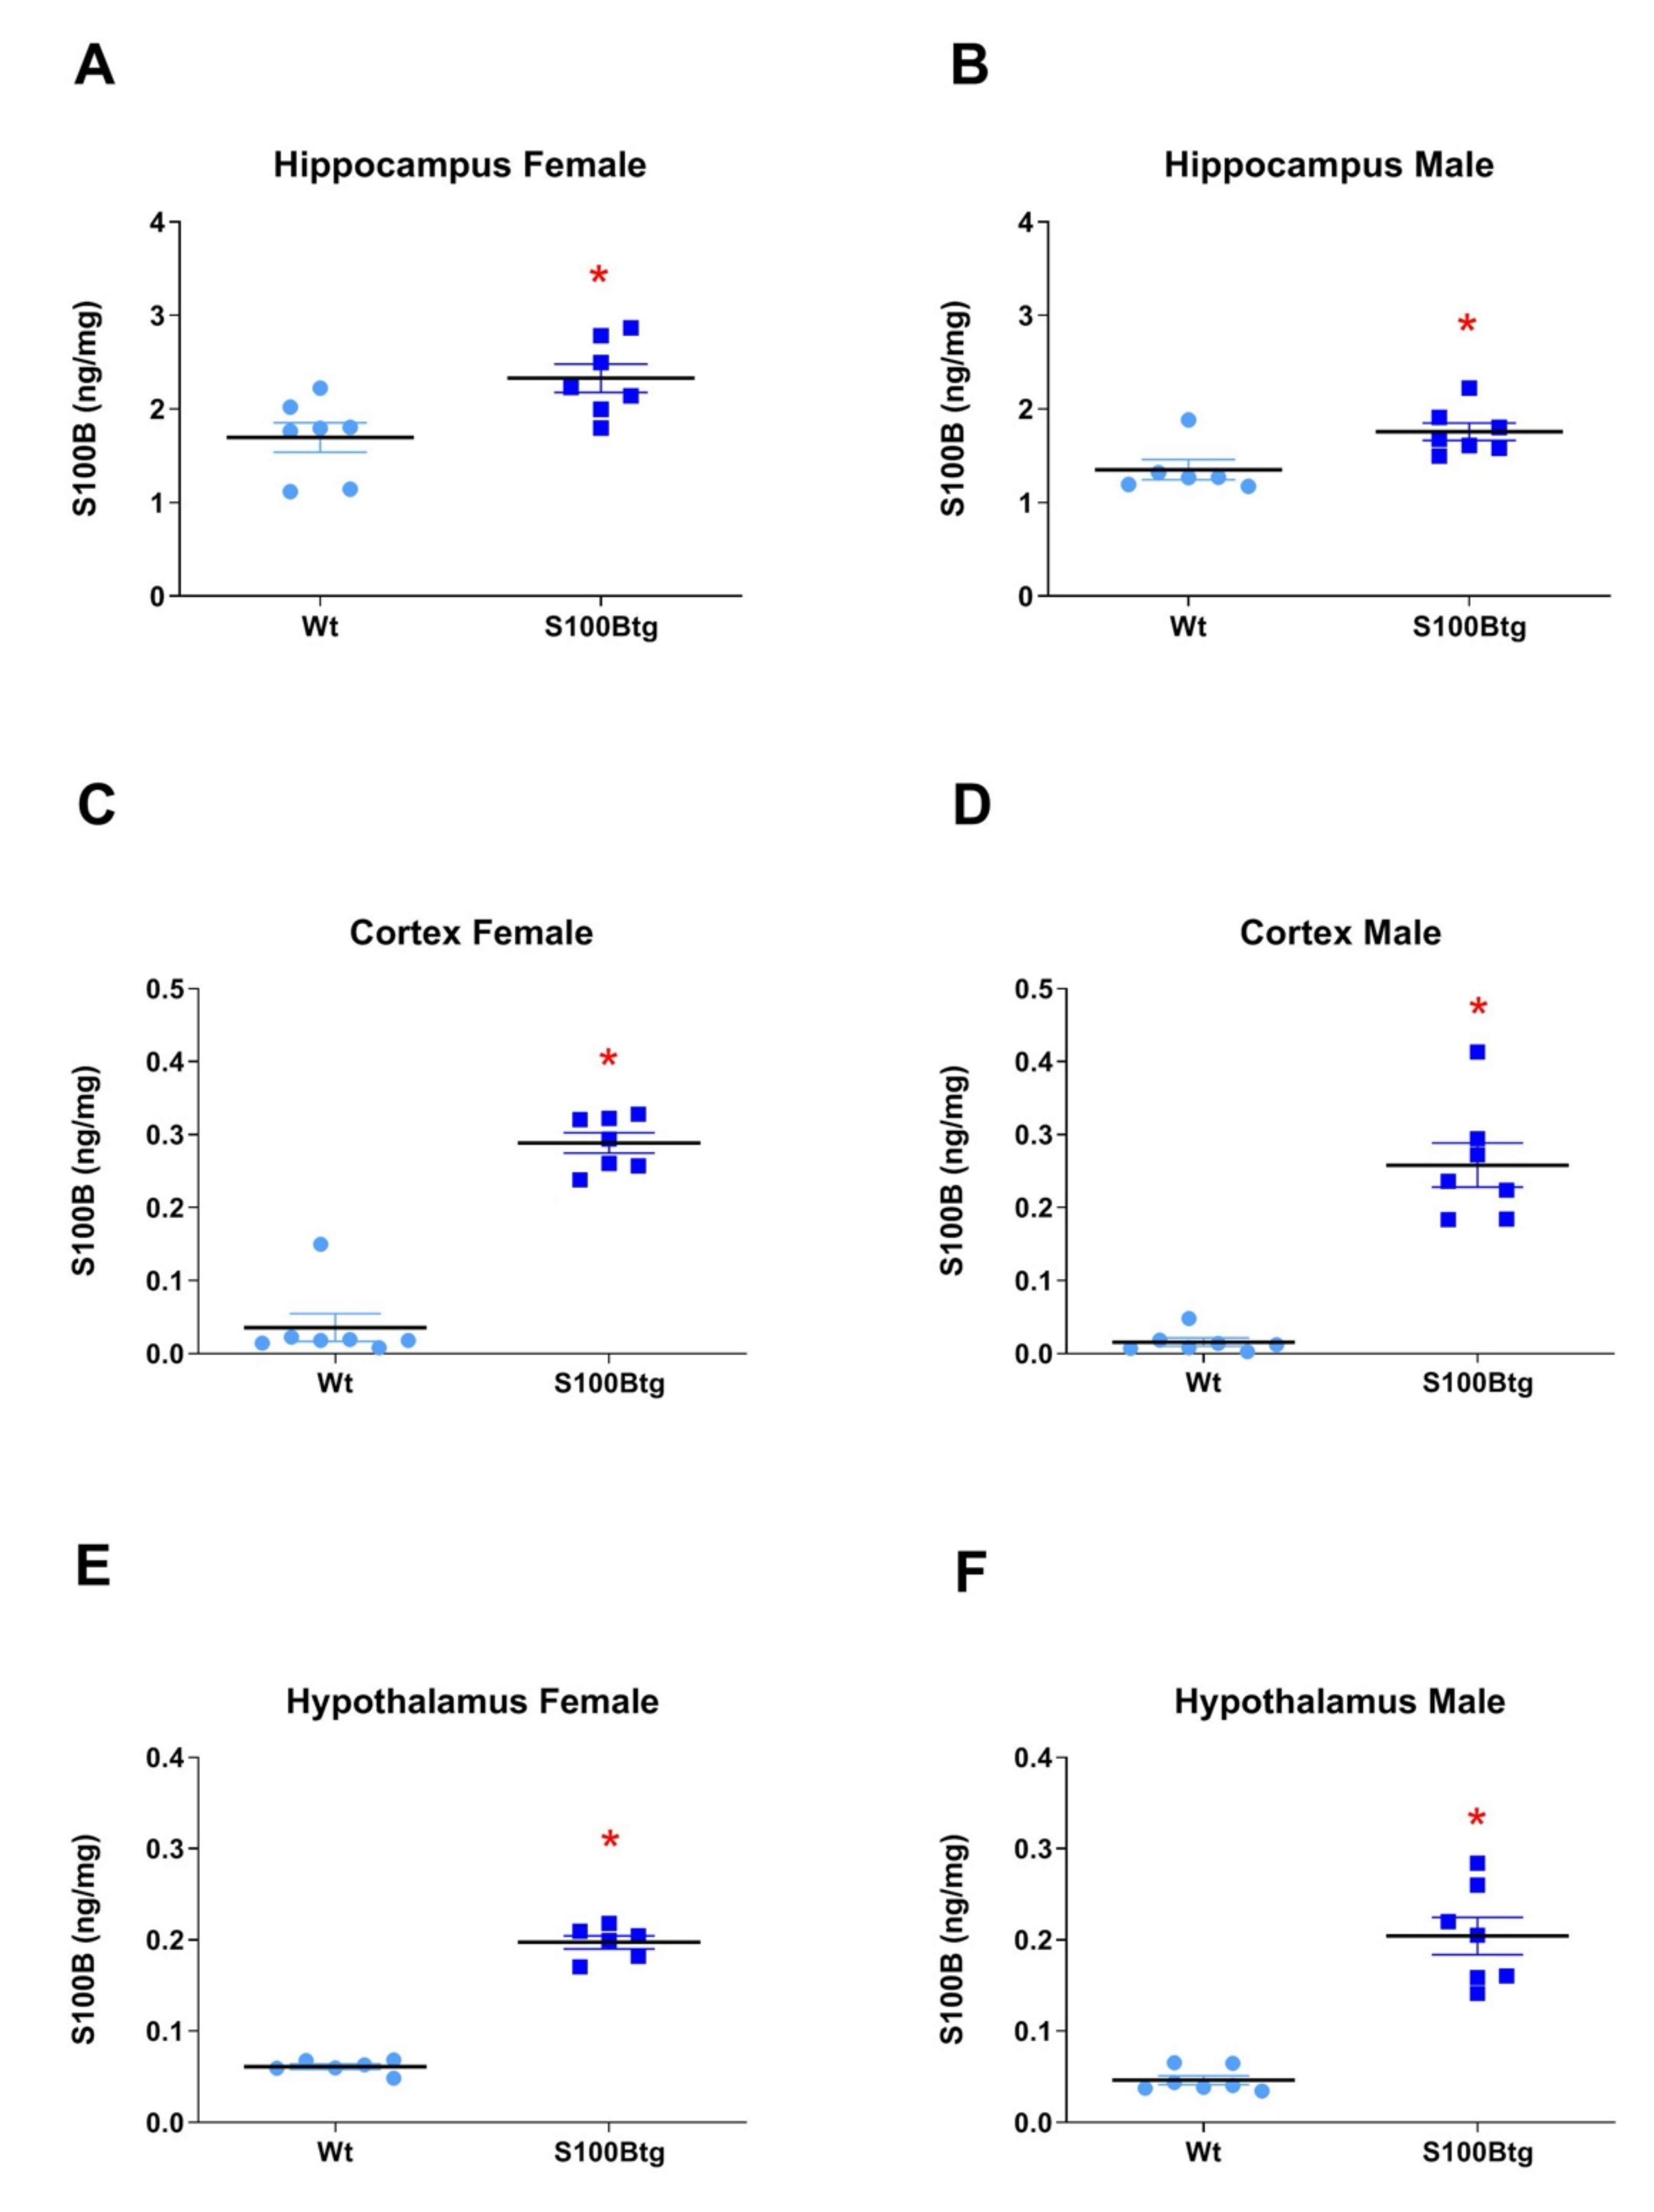
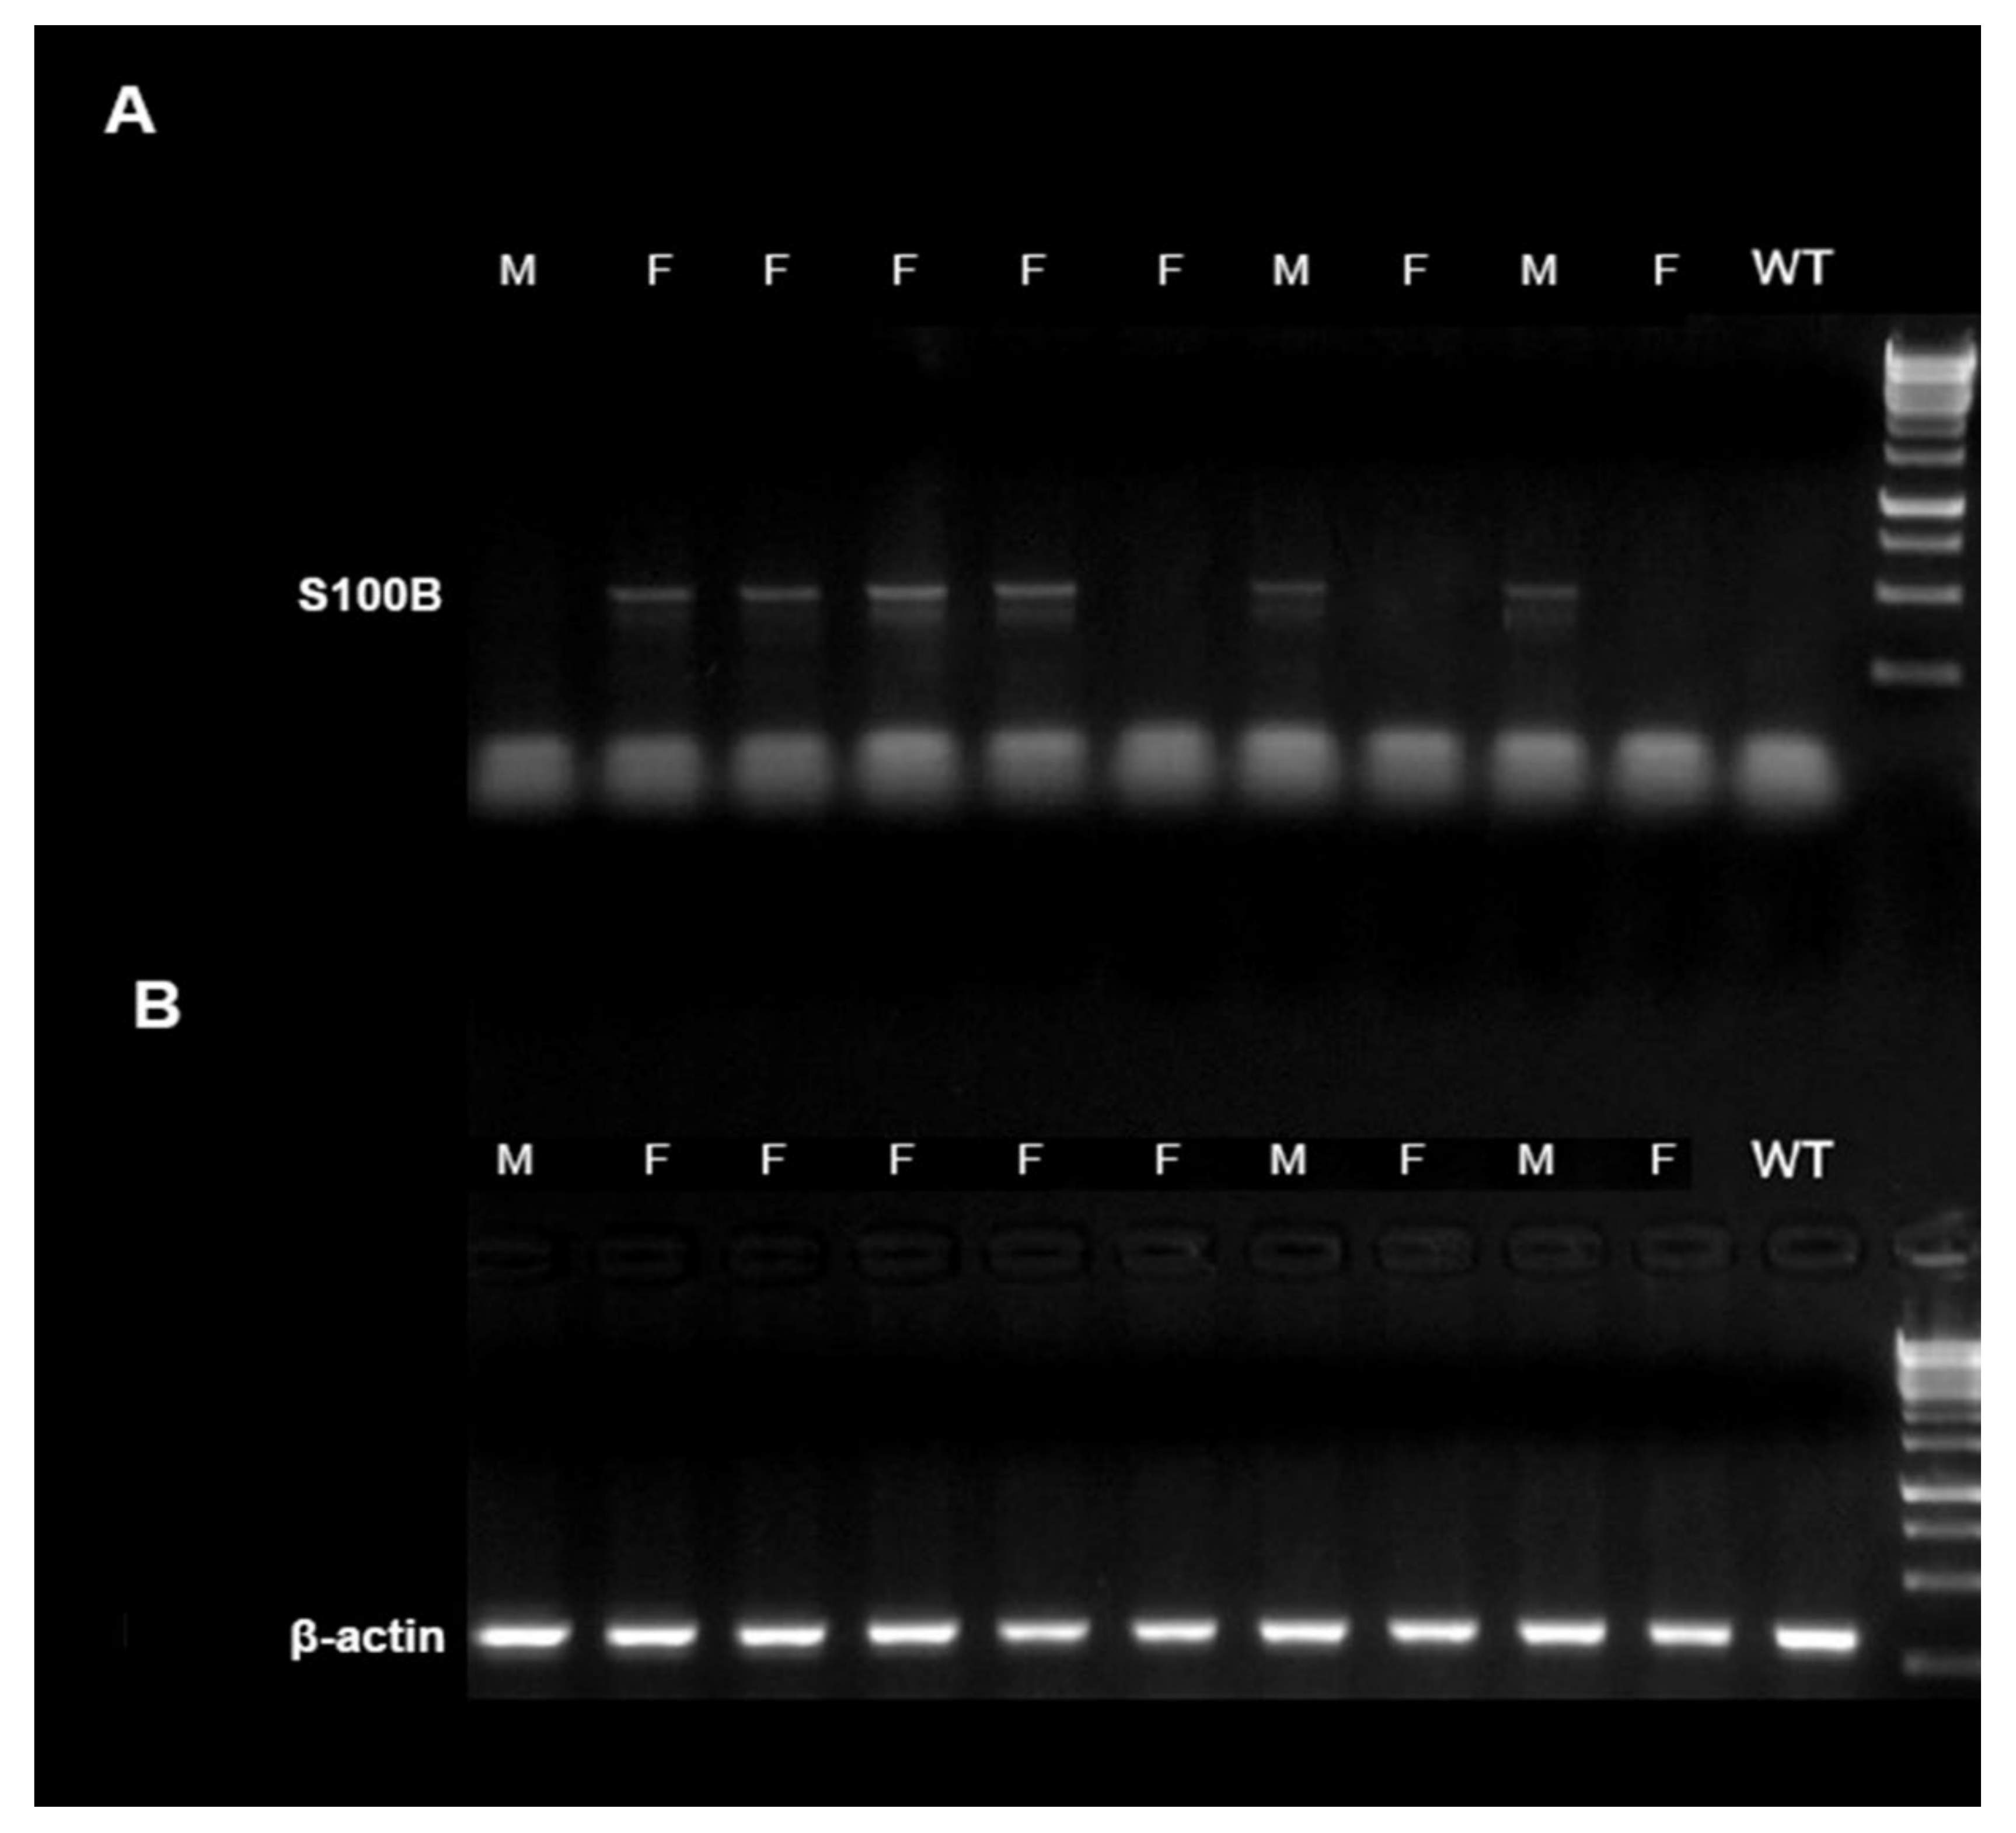
2.1. Central and Peripheral S100B Levels in S100Btg Mice
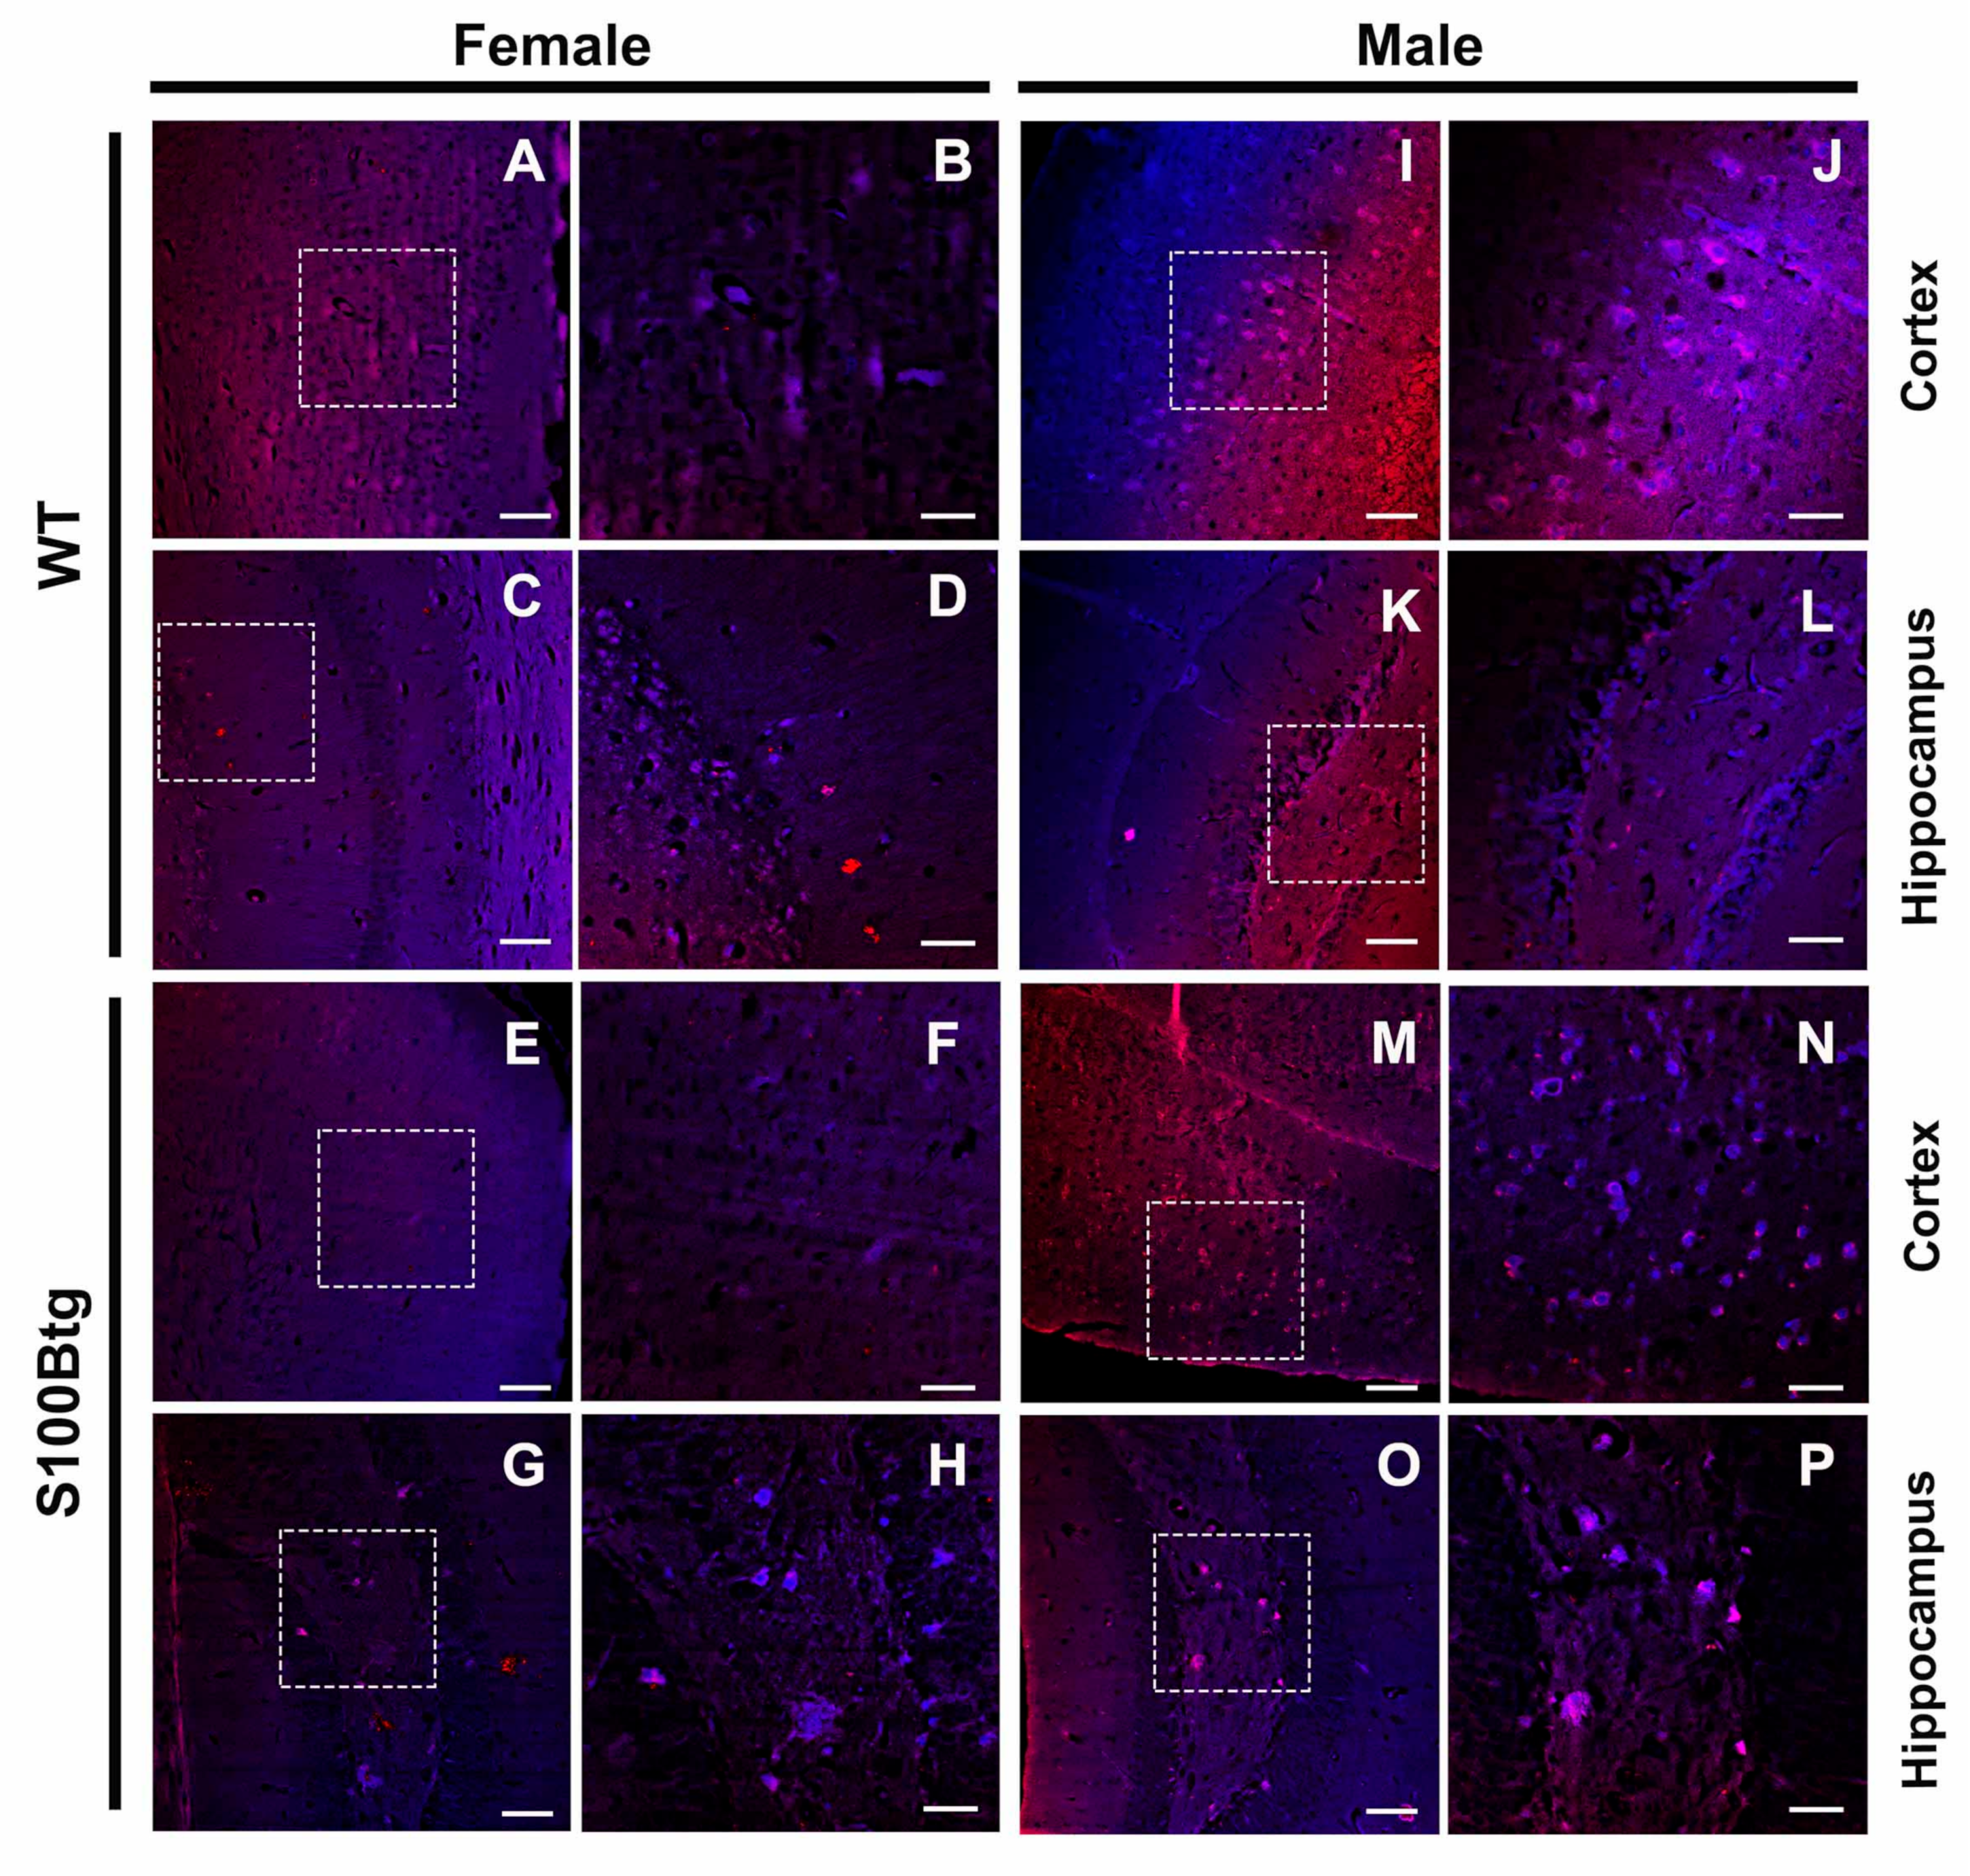
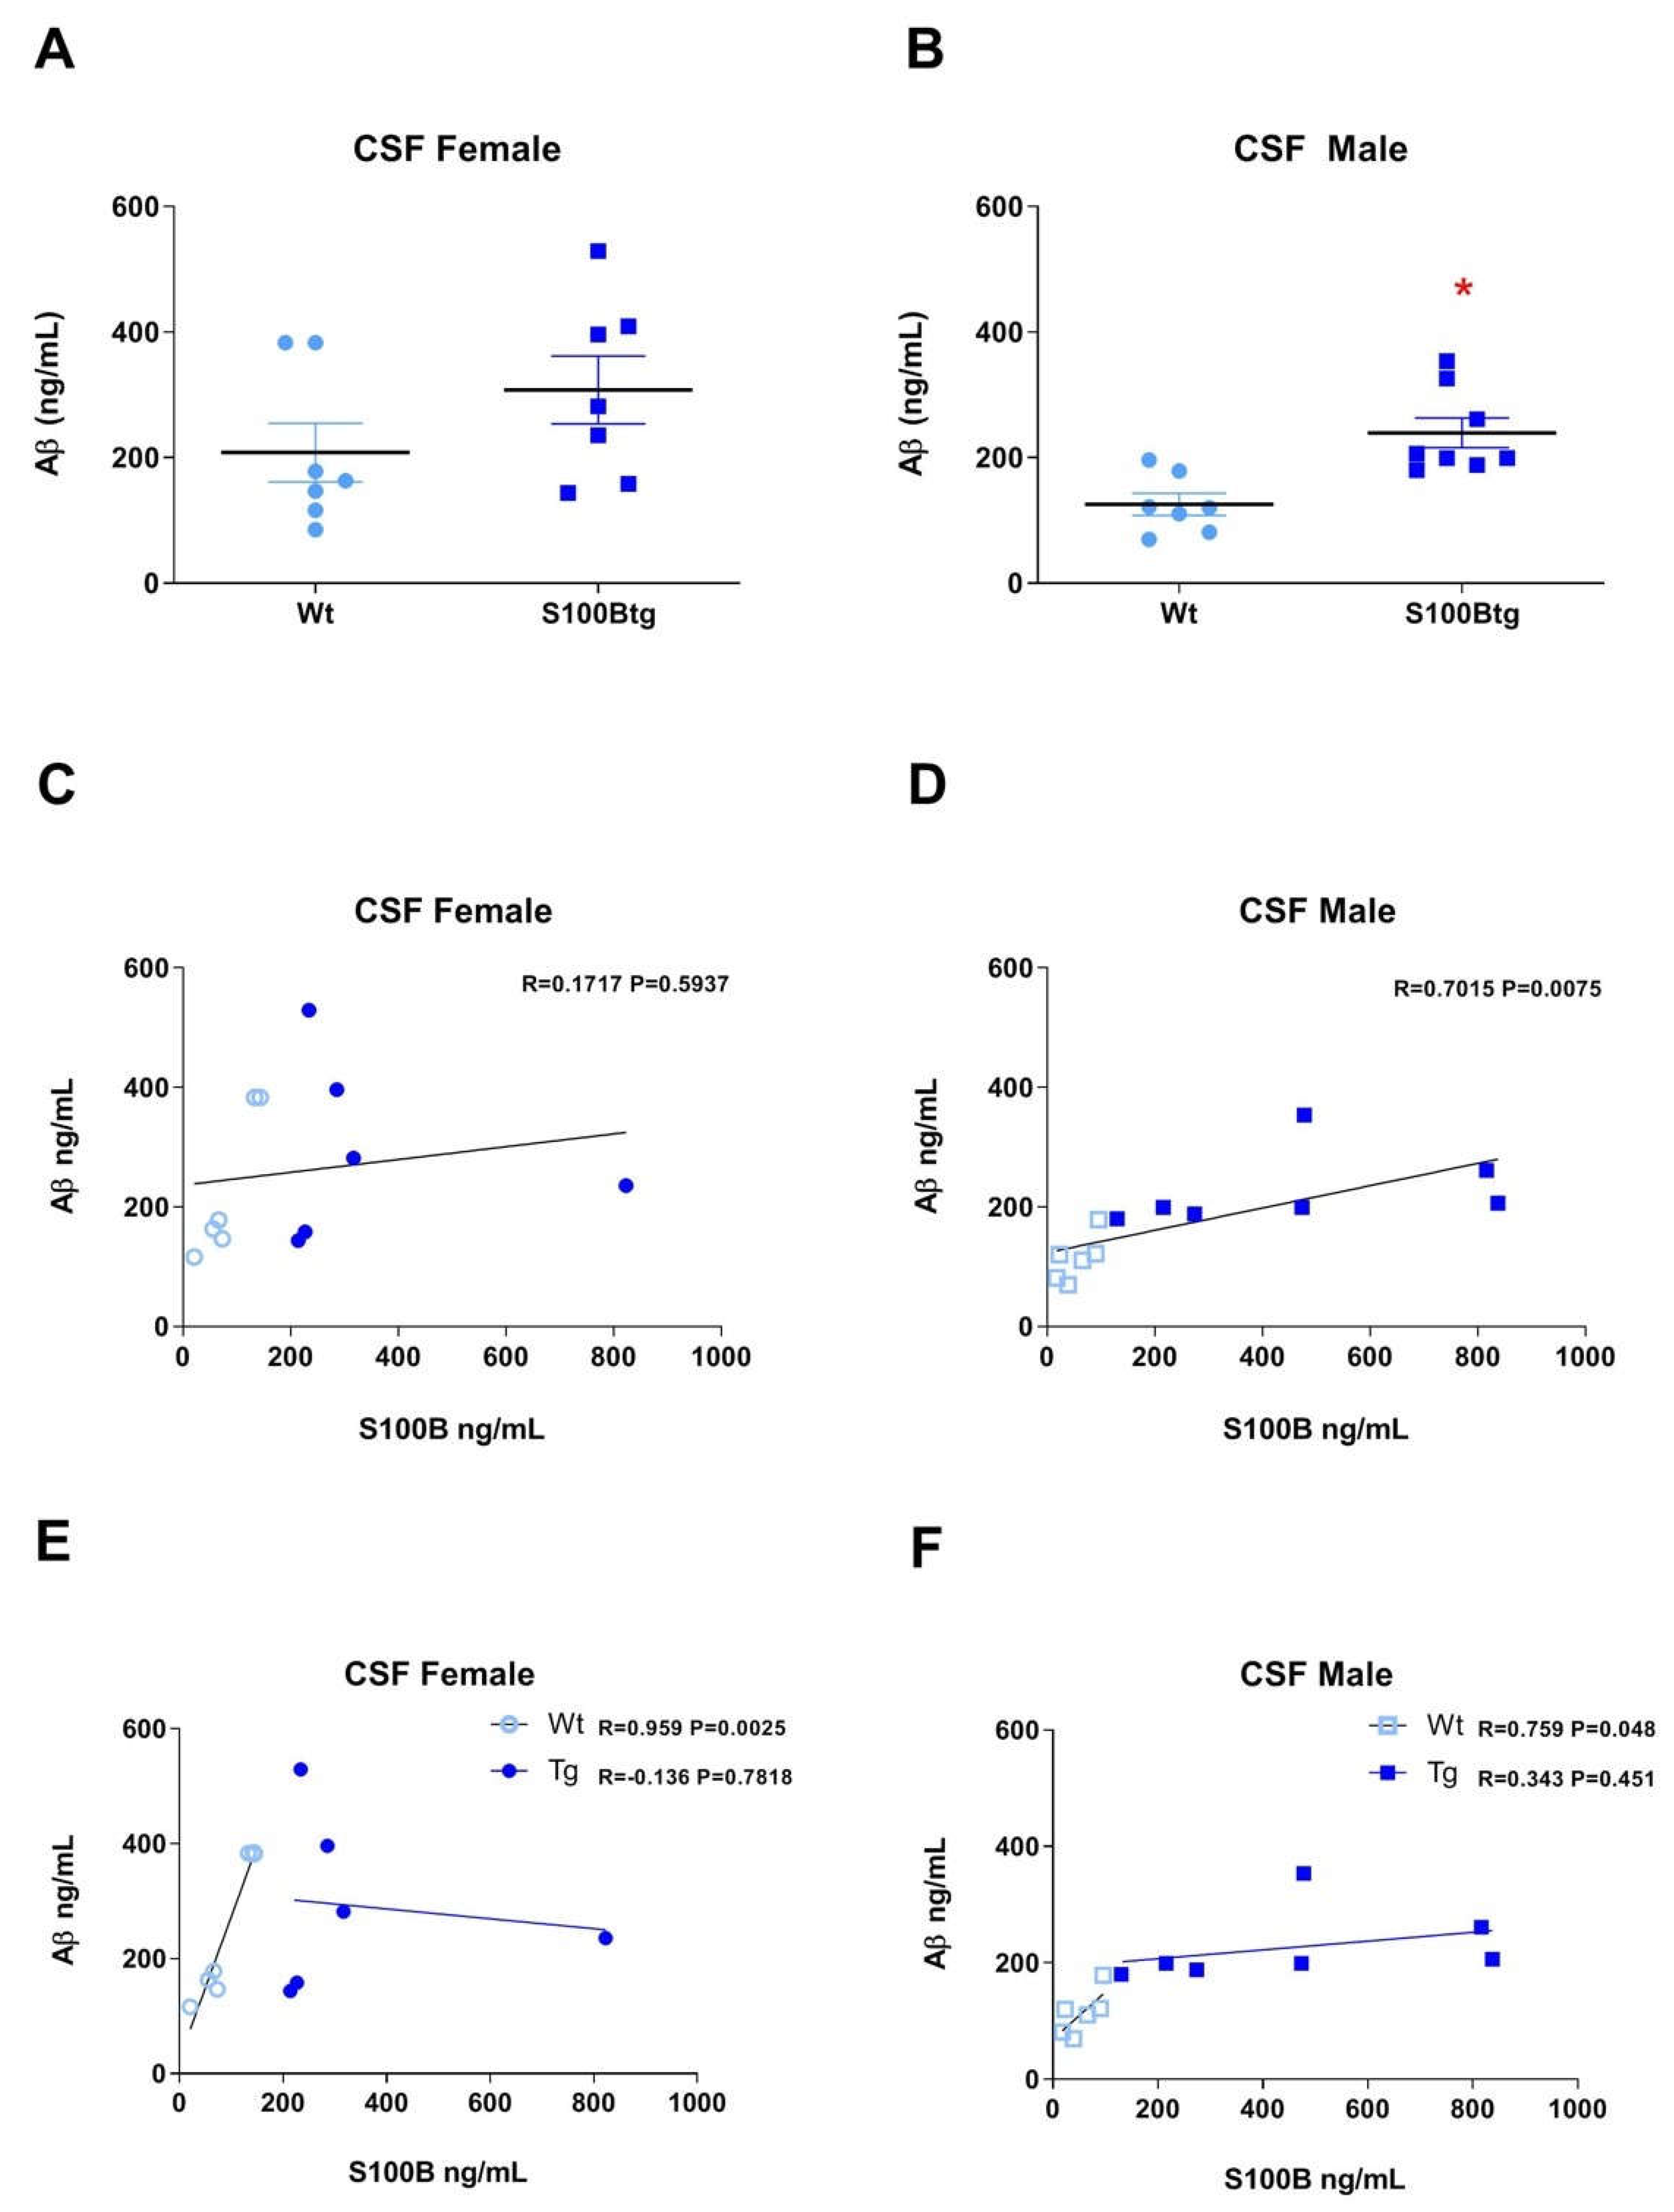
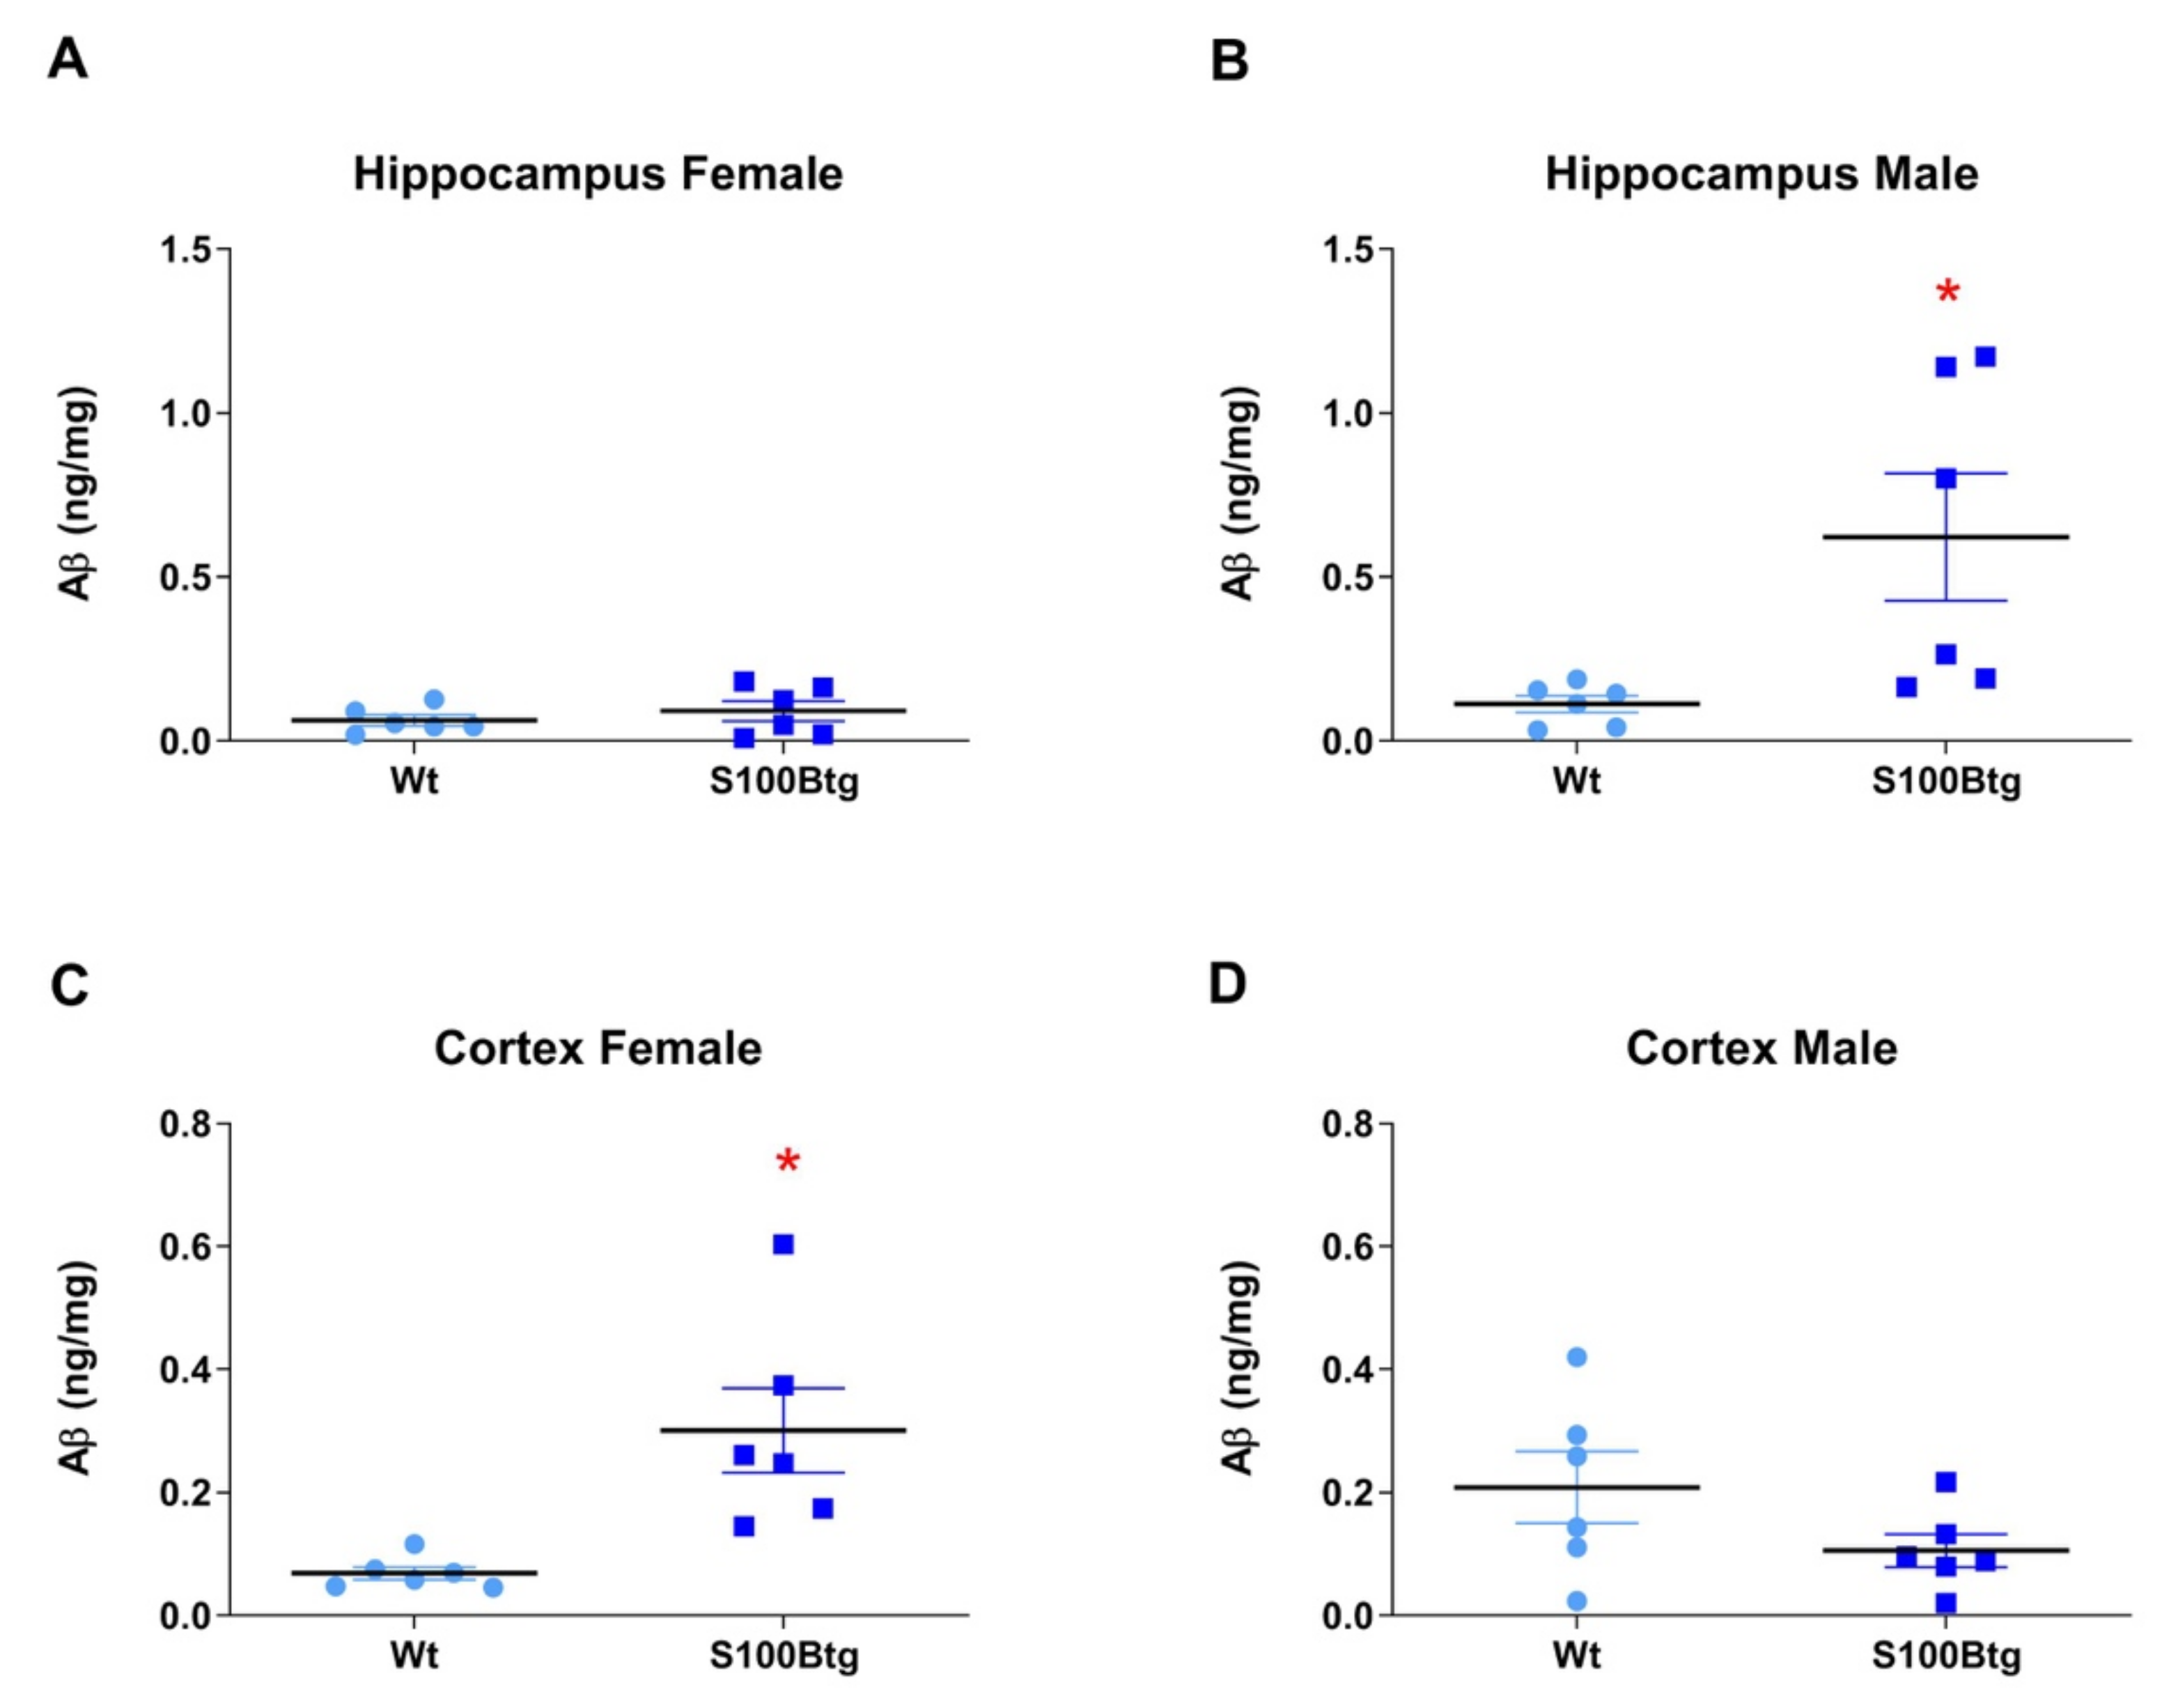
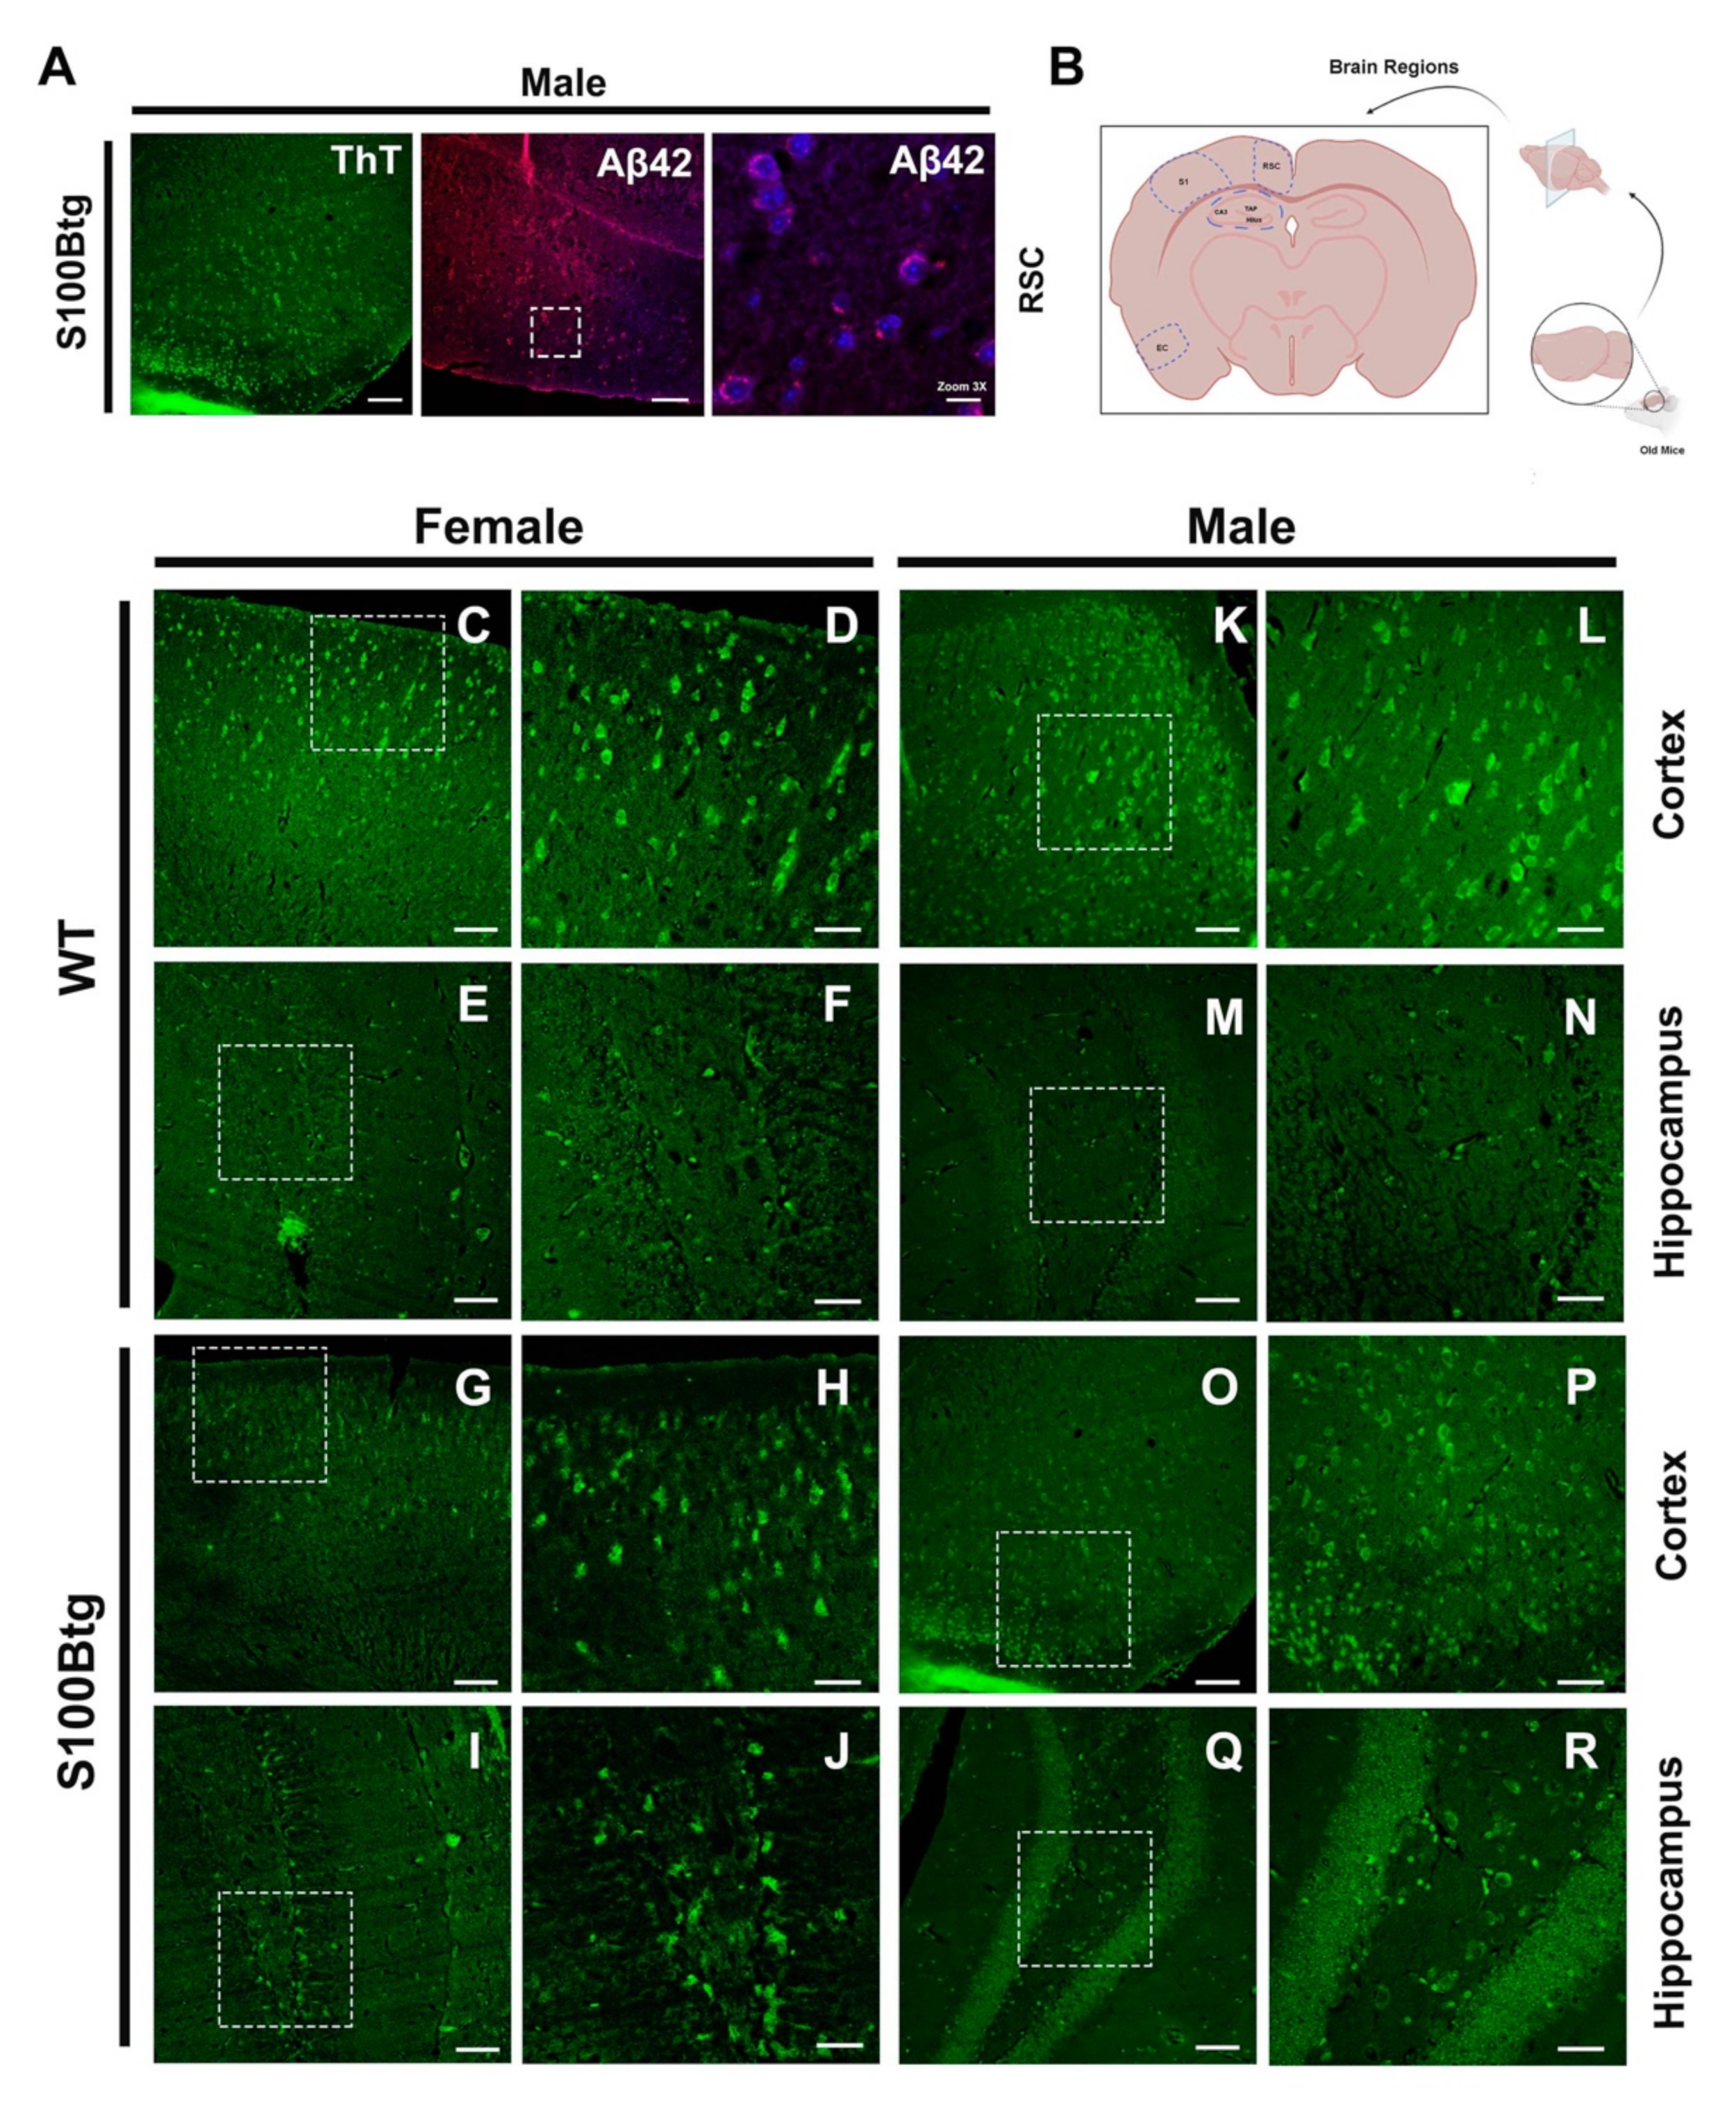
2.2. Amyloid β42 Levels and Aβ Immunoreactivity in S100Btg Mice
2.3. Correlation of S100B and Amyloid β42 in S100Btg Mice
2.4. Amyloid-β Aggregation as Assessed by Thioflavin T Fluorescence
3. Discussion
3.1. S100B Serum and CSF Levels in One-Year-Old S100Btg Mice
3.2. S100B and Aβ42 Brain Content in One-Year-Old S100Btg Mice
3.3. Correlation of S100B and Aβ42 Levels in One-Year-Old S100Btg Mice
3.4. Indication of Amyloid-β Aggregations in S100Btg Mice
4. Conclusions
5. Materials and Methods
5.1. Polymerase Chain Reaction for Mice Genotyping
5.2. Enzyme-Linked Immunosorbent Assay for S100B Quantification
5.3. Enzyme-Linked Immunosorbent Assay for Amyloid β42 Quantification
5.4. Histological Assessment
5.5. Amyloid-β Immunofluorescence and Thioflavin T Fluorescence
5.6. Image Analysis
5.7. Statistical Analysis
Author Contributions
Funding
Institutional Review Board Statement
Informed Consent Statement
Data Availability Statement
Conflicts of Interest
References
- Donato, R.; Sorci, G.; Riuzzi, F.; Arcuri, C.; Bianchi, R.; Brozzi, F.; Tubaro, C.; Giambanco, I. S100B’s double life: Intracellular regulator and extracellular signal. Biochim. Biophys. Acta 2009, 1793, 1008–1022. [Google Scholar] [CrossRef] [Green Version]
- Van Eldik, L.J.; Wainwright, M.S. The Janus face of glial-derived S100B: Beneficial and detrimental functions in the brain. Restor. Neurol. Neurosci. 2003, 21, 97–108. [Google Scholar] [PubMed]
- Goncalves, C.A.; Leite, M.C.; Nardin, P. Biological and methodological features of the measurement of S100B, a putative marker of brain injury. Clin. Biochem. 2008, 41, 755–763. [Google Scholar] [CrossRef] [PubMed]
- Michetti, F.; D’Ambrosi, N.; Toesca, A.; Puglisi, M.A.; Serrano, A.; Marchese, E.; Corvino, V.; Geloso, M.C. The S100B story: From biomarker to active factor in neural injury. J. Neurochem. 2019, 148, 168–187. [Google Scholar] [CrossRef] [PubMed] [Green Version]
- Buckman, L.B.; Anderson-Baucum, E.K.; Hasty, A.H.; Ellacott, K. Regulation of S100B in white adipose tissue by obesity in mice. Adipocyte 2014, 3, 215–220. [Google Scholar] [CrossRef] [Green Version]
- Schafer, B.W.; Wicki, R.; Engelkamp, D.; Mattei, M.G.; Heizmann, C.W. Isolation of a YAC clone covering a cluster of nine S100 genes on human chromosome 1q21: Rationale for a new nomenclature of the S100 calcium-binding protein family. Genomics 1995, 25, 638–643. [Google Scholar] [CrossRef]
- Griffin, W.S.; Stanley, L.C.; Ling, C.; White, L.; MacLeod, V.; Perrot, L.J.; White, C.L., 3rd; Araoz, C. Brain interleukin 1 and S-100 immunoreactivity are elevated in Down syndrome and Alzheimer disease. Proc. Natl. Acad. Sci. USA 1989, 86, 7611–7615. [Google Scholar] [CrossRef] [Green Version]
- Sheng, J.G.; Mrak, R.E.; Griffin, W.S. S100 beta protein expression in Alzheimer disease: Potential role in the pathogenesis of neuritic plaques. J. Neurosci. Res. 1994, 39, 398–404. [Google Scholar] [CrossRef]
- Mrak, R.E.; Sheng, J.G.; Griffin, W.S. Correlation of astrocytic S100 beta expression with dystrophic neurites in amyloid plaques of Alzheimer’s disease. J. Neuropathol. Exp. Neurol. 1996, 55, 273–279. [Google Scholar] [CrossRef] [Green Version]
- Kleindienst, A.; McGinn, M.J.; Harvey, H.B.; Colello, R.J.; Hamm, R.J.; Bullock, M.R. Enhanced hippocampal neurogenesis by intraventricular S100B infusion is associated with improved cognitive recovery after traumatic brain injury. J. Neurotrauma 2005, 22, 645–655. [Google Scholar] [CrossRef] [Green Version]
- Kleindienst, A.; Grunbeck, F.; Buslei, R.; Emtmann, I.; Buchfelder, M. Intraperitoneal treatment with S100B enhances hippocampal neurogenesis in juvenile mice and after experimental brain injury. Acta Neurochir. 2013, 155, 1351–1360. [Google Scholar] [CrossRef] [PubMed]
- Reeves, R.H.; Yao, J.; Crowley, M.R.; Buck, S.; Zhang, X.; Yarowsky, P.; Gearhart, J.D.; Hilt, D.C. Astrocytosis and axonal proliferation in the hippocampus of S100b transgenic mice. Proc. Natl. Acad. Sci. USA 1994, 91, 5359–5363. [Google Scholar] [CrossRef] [Green Version]
- Friend, W.C.; Clapoff, S.; Landry, C.; Becker, L.E.; O’Hanlon, D.; Allore, R.J.; Brown, I.R.; Marks, A.; Roder, J.; Dunn, R.J. Cell-specific expression of high levels of human S100 beta in transgenic mouse brain is dependent on gene dosage. J. Neurosci. 1992, 12, 4337–4346. [Google Scholar] [CrossRef]
- Gerlai, R.; Friend, W.; Becker, L.; O’Hanlon, D.; Marks, A.; Roder, J. Female transgenic mice carrying multiple copies of the human gene for S100 beta are hyperactive. Behav. Brain Res. 1993, 55, 51–59. [Google Scholar] [CrossRef]
- Gerlai, R.; Roder, J. Abnormal exploratory behavior in transgenic mice carrying multiple copies of the human gene for S100 beta. J. Psychiatry Neurosci. JPN 1995, 20, 105–112. [Google Scholar]
- Gerlai, R.; Wojtowicz, J.M.; Marks, A.; Roder, J. Overexpression of a calcium-binding protein, S100 beta, in astrocytes alters synaptic plasticity and impairs spatial learning in transgenic mice. Learn Mem. 1995, 2, 26–39. [Google Scholar] [CrossRef] [Green Version]
- Whitaker-Azmitia, P.M.; Wingate, M.; Borella, A.; Gerlai, R.; Roder, J.; Azmitia, E.C. Transgenic mice overexpressing the neurotrophic factor S-100 beta show neuronal cytoskeletal and behavioral signs of altered aging processes: Implications for Alzheimer’s disease and Down’s syndrome. Brain Res. 1997, 776, 51–60. [Google Scholar] [CrossRef]
- Mori, T.; Koyama, N.; Arendash, G.W.; Horikoshi-Sakuraba, Y.; Tan, J.; Town, T. Overexpression of human S100B exacerbates cerebral amyloidosis and gliosis in the Tg2576 mouse model of Alzheimer’s disease. Glia 2010, 58, 300–314. [Google Scholar] [CrossRef] [PubMed] [Green Version]
- de Souza, D.F.; Leite, M.C.; Quincozes-Santos, A.; Nardin, P.; Tortorelli, L.S.; Rigo, M.M.; Gottfried, C.; Leal, R.B.; Goncalves, C.A. S100B secretion is stimulated by IL-1beta in glial cultures and hippocampal slices of rats: Likely involvement of MAPK pathway. J Neuroimmunol. 2009, 206, 52–57. [Google Scholar] [CrossRef]
- Dos Santos, J.P.A.; Vizuete, A.F.; Goncalves, C.A. Calcineurin-Mediated Hippocampal Inflammatory Alterations in Streptozotocin-Induced Model of Dementia. Mol. Neurobiol. 2020, 57, 502–512. [Google Scholar] [CrossRef]
- Kubis-Kubiak, A.; Wiatrak, B.; Piwowar, A. The Impact of High Glucose or Insulin Exposure on S100B Protein Levels, Oxidative and Nitrosative Stress and DNA Damage in Neuron-Like Cells. Int. J. Mol. Sci. 2021, 22, 5526. [Google Scholar] [CrossRef] [PubMed]
- Rodrigues, F.E.P.; Figueira, A.J.; Gomes, C.M.; Machuqueiro, M. Computational Analysis of the Interactions between the S100B Extracellular Chaperone and Its Amyloid beta Peptide Client. Int. J. Mol. Sci. 2021, 22, 3629. [Google Scholar] [CrossRef]
- Bellaver, B.; Ferrari-Souza, J.P.; Uglione da Ros, L.; Carter, S.F.; Rodriguez-Vieitez, E.; Nordberg, A.; Pellerin, L.; Rosa-Neto, P.; Leffa, D.T.; Zimmer, E.R. Astrocyte Biomarkers in Alzheimer Disease: A Systematic Review and Meta-analysis. Neurology 2021. [Google Scholar] [CrossRef] [PubMed]
- Takami, M.; Nagashima, Y.; Sano, Y.; Ishihara, S.; Morishima-Kawashima, M.; Funamoto, S.; Ihara, Y. gamma-Secretase: Successive tripeptide and tetrapeptide release from the transmembrane domain of beta-carboxyl terminal fragment. J. Neurosci. 2009, 29, 13042–13052. [Google Scholar] [CrossRef] [PubMed]
- Portela, L.V.; Tort, A.B.; Schaf, D.V.; Ribeiro, L.; Nora, D.B.; Walz, R.; Rotta, L.N.; Silva, C.T.; Busnello, J.V.; Kapczinski, F.; et al. The serum S100B concentration is age dependent. Clin. Chem. 2002, 48, 950–952. [Google Scholar] [CrossRef] [Green Version]
- Tramontina, F.; Conte, S.; Goncalves, D.; Gottfried, C.; Portela, L.V.; Vinade, L.; Salbego, C.; Goncalves, C.A. Developmental changes in S100B content in brain tissue, cerebrospinal fluid, and astrocyte cultures of rats. Cell Mol. Neurobiol. 2002, 22, 373–378. [Google Scholar] [CrossRef]
- Rothermundt, M.; Peters, M.; Prehn, J.H.; Arolt, V. S100B in brain damage and neurodegeneration. Microsc. Res. Tech. 2003, 60, 614–632. [Google Scholar] [CrossRef]
- Huttunen, H.J.; Kuja-Panula, J.; Sorci, G.; Agneletti, A.L.; Donato, R.; Rauvala, H. Coregulation of neurite outgrowth and cell survival by amphoterin and S100 proteins through receptor for advanced glycation end products (RAGE) activation. J. Biol. Chem. 2000, 275, 40096–40105. [Google Scholar] [CrossRef] [Green Version]
- Li, Y.; Wang, J.; Sheng, J.G.; Liu, L.; Barger, S.W.; Jones, R.A.; Van Eldik, L.J.; Mrak, R.E.; Griffin, W.S. S100 beta increases levels of beta-amyloid precursor protein and its encoding mRNA in rat neuronal cultures. J. Neurochem. 1998, 71, 1421–1428. [Google Scholar] [CrossRef]
- Netto, C.B.; Portela, L.V.; Ferreira, C.T.; Kieling, C.; Matte, U.; Felix, T.; da Silveira, T.R.; Souza, D.O.; Goncalves, C.A.; Giugliani, R. Ontogenetic changes in serum S100B in Down syndrome patients. Clin. Biochem. 2005, 38, 433–435. [Google Scholar] [CrossRef]
- Shapiro, L.A.; Marks, A.; Whitaker-Azmitia, P.M. Increased clusterin expression in old but not young adult S100B transgenic mice: Evidence of neuropathological aging in a model of Down Syndrome. Brain Res. 2004, 1010, 17–21. [Google Scholar] [CrossRef]
- Zimmer, D.B.; Chessher, J.; Wilson, G.L.; Zimmer, W.E. S100A1 and S100B expression and target proteins in type I diabetes. Endocrinology 1997, 138, 5176–5183. [Google Scholar] [CrossRef]
- Baudier, J.; Gentil, B.J. The S100B Protein and Partners in Adipocyte Response to Cold Stress and Adaptive Thermogenesis: Facts, Hypotheses, and Perspectives. Biomolecules 2020, 10, 843. [Google Scholar] [CrossRef] [PubMed]
- Guerra, M.C.; Tortorelli, L.S.; Galland, F.; Da Re, C.; Negri, E.; Engelke, D.S.; Rodrigues, L.; Leite, M.C.; Goncalves, C.A. Lipopolysaccharide modulates astrocytic S100B secretion: A study in cerebrospinal fluid and astrocyte cultures from rats. J. Neuroinflammation 2011, 8, 128. [Google Scholar] [CrossRef] [Green Version]
- Kleindienst, A.; Schmidt, C.; Parsch, H.; Emtmann, I.; Xu, Y.; Buchfelder, M. The Passage of S100B from Brain to Blood Is Not Specifically Related to the Blood-Brain Barrier Integrity. Cardiovasc. Psychiatry Neurol. 2010, 2010, 801295. [Google Scholar] [CrossRef]
- Mrak, R.E.; Griffin, W.S. Interleukin-1, neuroinflammation, and Alzheimer’s disease. Neurobiol. Aging 2001, 22, 903–908. [Google Scholar] [CrossRef]
- Peskind, E.R.; Griffin, W.S.; Akama, K.T.; Raskind, M.A.; Van Eldik, L.J. Cerebrospinal fluid S100B is elevated in the earlier stages of Alzheimer’s disease. Neurochem. Int. 2001, 39, 409–413. [Google Scholar] [CrossRef]
- Lam, V.; Albrecht, M.A.; Takechi, R.; Giles, C.; James, A.P.; Foster, J.K.; Mamo, J.C. The Serum Concentration of the Calcium Binding Protein S100B is Positively Associated with Cognitive Performance in Older Adults. Front. Aging Neurosci. 2013, 5, 61. [Google Scholar] [CrossRef] [PubMed] [Green Version]
- Chaves, M.L.; Camozzato, A.L.; Ferreira, E.D.; Piazenski, I.; Kochhann, R.; Dall’Igna, O.; Mazzini, G.S.; Souza, D.O.; Portela, L.V. Serum levels of S100B and NSE proteins in Alzheimer’s disease patients. J. Neuroinflammation 2010, 7, 6. [Google Scholar] [CrossRef] [Green Version]
- Cristovao, J.S.; Morris, V.K.; Cardoso, I.; Leal, S.S.; Martinez, J.; Botelho, H.M.; Gobl, C.; David, R.; Kierdorf, K.; Alemi, M.; et al. The neuronal S100B protein is a calcium-tuned suppressor of amyloid-beta aggregation. Sci. Adv. 2018, 4, eaaq1702. [Google Scholar] [CrossRef] [Green Version]
- Cristovao, J.S.; Figueira, A.J.; Carapeto, A.P.; Rodrigues, M.S.; Cardoso, I.; Gomes, C.M. The S100B Alarmin Is a Dual-Function Chaperone Suppressing Amyloid-beta Oligomerization through Combined Zinc Chelation and Inhibition of Protein Aggregation. ACS Chem. Neurosci. 2020, 11, 2753–2760. [Google Scholar] [CrossRef]
- Nebel, R.A.; Aggarwal, N.T.; Barnes, L.L.; Gallagher, A.; Goldstein, J.M.; Kantarci, K.; Mallampalli, M.P.; Mormino, E.C.; Scott, L.; Yu, W.H.; et al. Understanding the impact of sex and gender in Alzheimer’s disease: A call to action. Alzheimers Dement. 2018, 14, 1171–1183. [Google Scholar] [CrossRef]
- Callahan, M.J.; Lipinski, W.J.; Bian, F.; Durham, R.A.; Pack, A.; Walker, L.C. Augmented senile plaque load in aged female beta-amyloid precursor protein-transgenic mice. Am. J. Pathol. 2001, 158, 1173–1177. [Google Scholar] [CrossRef]
- Merlo, S.; Spampinato, S.F.; Sortino, M.A. Estrogen and Alzheimer’s disease: Still an attractive topic despite disappointment from early clinical results. Eur. J. Pharmacol. 2017, 817, 51–58. [Google Scholar] [CrossRef] [PubMed]
- Hsiao, K.; Chapman, P.; Nilsen, S.; Eckman, C.; Harigaya, Y.; Younkin, S.; Yang, F.; Cole, G. Correlative memory deficits, Abeta elevation, and amyloid plaques in transgenic mice. Science 1996, 274, 99–102. [Google Scholar] [CrossRef]
- Plaschke, K.; Muller, D.; Hoyer, S. Insulin-resistant brain state (IRBS) changes membrane composition of fatty acids in temporal and entorhinal brain cortices of rats: Relevance to sporadic Alzheimer’s disease? J. Neural. Transm. 2010, 117, 1419–1422. [Google Scholar] [CrossRef] [PubMed]
- Salkovic-Petrisic, M.; Osmanovic, J.; Grunblatt, E.; Riederer, P.; Hoyer, S. Modeling sporadic Alzheimer’s disease: The insulin resistant brain state generates multiple long-term morphobiological abnormalities including hyperphosphorylated tau protein and amyloid-beta. J. Alzheimers. Dis. 2009, 18, 729–750. [Google Scholar] [CrossRef] [Green Version]
- Maruszak, A.; Thuret, S. Why looking at the whole hippocampus is not enough-a critical role for anteroposterior axis, subfield and activation analyses to enhance predictive value of hippocampal changes for Alzheimer’s disease diagnosis. Front. Cell. Neurosci. 2014, 8, 95. [Google Scholar] [CrossRef] [Green Version]
- Bramanti, E.; Fulgentini, L.; Bizzarri, R.; Lenci, F.; Sgarbossa, A. beta-Amyloid amorphous aggregates induced by the small natural molecule ferulic acid. J. Phys. Chem. B 2013, 117, 13816–13821. [Google Scholar] [CrossRef]
- Biancalana, M.; Koide, S. Molecular mechanism of Thioflavin-T binding to amyloid fibrils. Biochim. Biophys. Acta 2010, 1804, 1405–1412. [Google Scholar] [CrossRef] [Green Version]
- Hudson, S.A.; Ecroyd, H.; Kee, T.W.; Carver, J.A. The thioflavin T fluorescence assay for amyloid fibril detection can be biased by the presence of exogenous compounds. FEBS J. 2009, 276, 5960–5972. [Google Scholar] [CrossRef] [PubMed] [Green Version]
- Yamaguchi, Y.; Saito, K.; Matsuno, T.; Takeda, K.; Hino, M. Effects of ZSET1446/ST101 on cognitive deficits and amyloid beta deposition in the senescence accelerated prone mouse brain. J. Pharmacol. Sci. 2012, 119, 160–166. [Google Scholar] [CrossRef] [PubMed] [Green Version]
- Little, C.S.; Hammond, C.J.; MacIntyre, A.; Balin, B.J.; Appelt, D.M. Chlamydia pneumoniae induces Alzheimer-like amyloid plaques in brains of BALB/c mice. Neurobiol. Aging 2004, 25, 419–429. [Google Scholar] [CrossRef] [Green Version]
- Busquets, O.; Ettcheto, M.; Pallas, M.; Beas-Zarate, C.; Verdaguer, E.; Auladell, C.; Folch, J.; Camins, A. Long-term exposition to a high fat diet favors the appearance of beta-amyloid depositions in the brain of C57BL/6J mice. A potential model of sporadic Alzheimer’s disease. Mech. Ageing Dev. 2017, 162, 38–45. [Google Scholar] [CrossRef]
- Billings, L.M.; Oddo, S.; Green, K.N.; McGaugh, J.L.; LaFerla, F.M. Intraneuronal Abeta causes the onset of early Alzheimer’s disease-related cognitive deficits in transgenic mice. Neuron 2005, 45, 675–688. [Google Scholar] [CrossRef] [Green Version]
- Mastrangelo, M.A.; Bowers, W.J. Detailed immunohistochemical characterization of temporal and spatial progression of Alzheimer’s disease-related pathologies in male triple-transgenic mice. BMC Neurosci. 2008, 9, 81. [Google Scholar] [CrossRef] [Green Version]
- den Haan, J.; Morrema, T.H.J.; Verbraak, F.D.; de Boer, J.F.; Scheltens, P.; Rozemuller, A.J.; Bergen, A.A.B.; Bouwman, F.H.; Hoozemans, J.J. Amyloid-beta and phosphorylated tau in post-mortem Alzheimer’s disease retinas. Acta Neuropathol. Commun. 2018, 6, 147. [Google Scholar] [CrossRef]
- Verma, S.; Ranawat, P.; Sharma, N.; Nehru, B. Ginkgo biloba attenuates aluminum lactate-induced neurotoxicity in reproductive senescent female rats: Behavioral, biochemical, and histopathological study. Environ. Sci. Pollut. Res. Int. 2019, 26, 27148–27167. [Google Scholar] [CrossRef]
- Baecker, J.; Wartchow, K.; Sehm, T.; Ghoochani, A.; Buchfelder, M.; Kleindienst, A. Treatment with the Neurotrophic Protein S100B Increases Synaptogenesis after Traumatic Brain Injury. J. Neurotrauma 2020, 37, 1097–1107. [Google Scholar] [CrossRef]
- Franklin, K.B.J.; Paxinos, G. Paxinos and Franklin’s the Mouse Brain in Stereotaxic Coordinates, 4th ed.; Academic Press: Cambridge, MA, USA, 2013; Volume 1. [Google Scholar]


| Female | p Value | Male | p Value | ||||||
|---|---|---|---|---|---|---|---|---|---|
| Age | Brain Region | wt Mice | S100Btg Mice | wt vs. S100Btg | wt Mice | S100Btg Mice | wt vs. S100Btg | wt Sex | tg Sex |
| 3 months | Hilus CA3 TAP | 3.7 ± 0.4 3.7 ± 0.3 5.1 ± 0.4 | 6.5 ± 0.4 4.3 ± 0.4 6.4 ± 0.4 | 0.033 n.s. n.s. | 5.9 ± 0.8 5.8 ± 1.0 7.5 ± 1.0 | 7.3 ± 0.5 4.7 ± 0.4 7.6 ± 0.6 | n.s. n.s. n.s. | n.s. n.s. n.s. | n.s. n.s. n.s. |
| p value | region | n.s. | n.s. | n.s. | n.s. | ||||
| 1 year | Hilus CA3 TAP | 11.9 ± 0.7 17.9 ± 1.1 13.1 ± 0.7 | 11.0 ± 0.7 9.2 ± 0.7 10.0 ± 0.5 | n.s. n.s n.s | 4.3 ± 1.1 4.7 ± 0.6 6.5 ± 0.9 | 10.9 ± 0.7 9.0 ± 0.6 11.4 ± 0.6 | <0.001 <0.001 <0.001 | <0.001 <0.001 <0.001 | n.s. n.s. n.s. |
| p value | region | n.s. | n.s. | n.s. | n.s. | ||||
| p value | age | <0.001 | <0.001 | n.s. | <0.001 | ||||
| 3 months | FC | 7.0 ± 0.5 | 6.6±0.7 | n.s. | 17.6 ± 1.5 | 10.8 ± 0.7 | <0.001 | <0.001 | n.s. |
| 1 year | FC | 19.2 ± 1.2 | 3.6±0.7 | <0.001 | 22.8 ± 0.7 | 12.4 ± 1.2 | <0.001 | n.s. | <0.001 |
| p value | FC age | <0.001 | n.s. | 0.042 | n.s. | ||||
Publisher’s Note: MDPI stays neutral with regard to jurisdictional claims in published maps and institutional affiliations. |
© 2021 by the authors. Licensee MDPI, Basel, Switzerland. This article is an open access article distributed under the terms and conditions of the Creative Commons Attribution (CC BY) license (https://creativecommons.org/licenses/by/4.0/).
Share and Cite
Wartchow, K.M.; Rodrigues, L.; Swierzy, I.; Buchfelder, M.; de Souza, D.O.; Gonçalves, C.-A.; Kleindienst, A. Amyloid-β Processing in Aged S100B Transgenic Mice Is Sex Dependent. Int. J. Mol. Sci. 2021, 22, 10823. https://doi.org/10.3390/ijms221910823
Wartchow KM, Rodrigues L, Swierzy I, Buchfelder M, de Souza DO, Gonçalves C-A, Kleindienst A. Amyloid-β Processing in Aged S100B Transgenic Mice Is Sex Dependent. International Journal of Molecular Sciences. 2021; 22(19):10823. https://doi.org/10.3390/ijms221910823
Chicago/Turabian StyleWartchow, Krista Minéia, Leticia Rodrigues, Izabela Swierzy, Michael Buchfelder, Diogo Onofre de Souza, Carlos-Alberto Gonçalves, and Andrea Kleindienst. 2021. "Amyloid-β Processing in Aged S100B Transgenic Mice Is Sex Dependent" International Journal of Molecular Sciences 22, no. 19: 10823. https://doi.org/10.3390/ijms221910823
APA StyleWartchow, K. M., Rodrigues, L., Swierzy, I., Buchfelder, M., de Souza, D. O., Gonçalves, C.-A., & Kleindienst, A. (2021). Amyloid-β Processing in Aged S100B Transgenic Mice Is Sex Dependent. International Journal of Molecular Sciences, 22(19), 10823. https://doi.org/10.3390/ijms221910823