
Role of L-Type Voltage-Gated Calcium Channels in Epileptiform Activity of Neurons

 ,
,  , and
, and 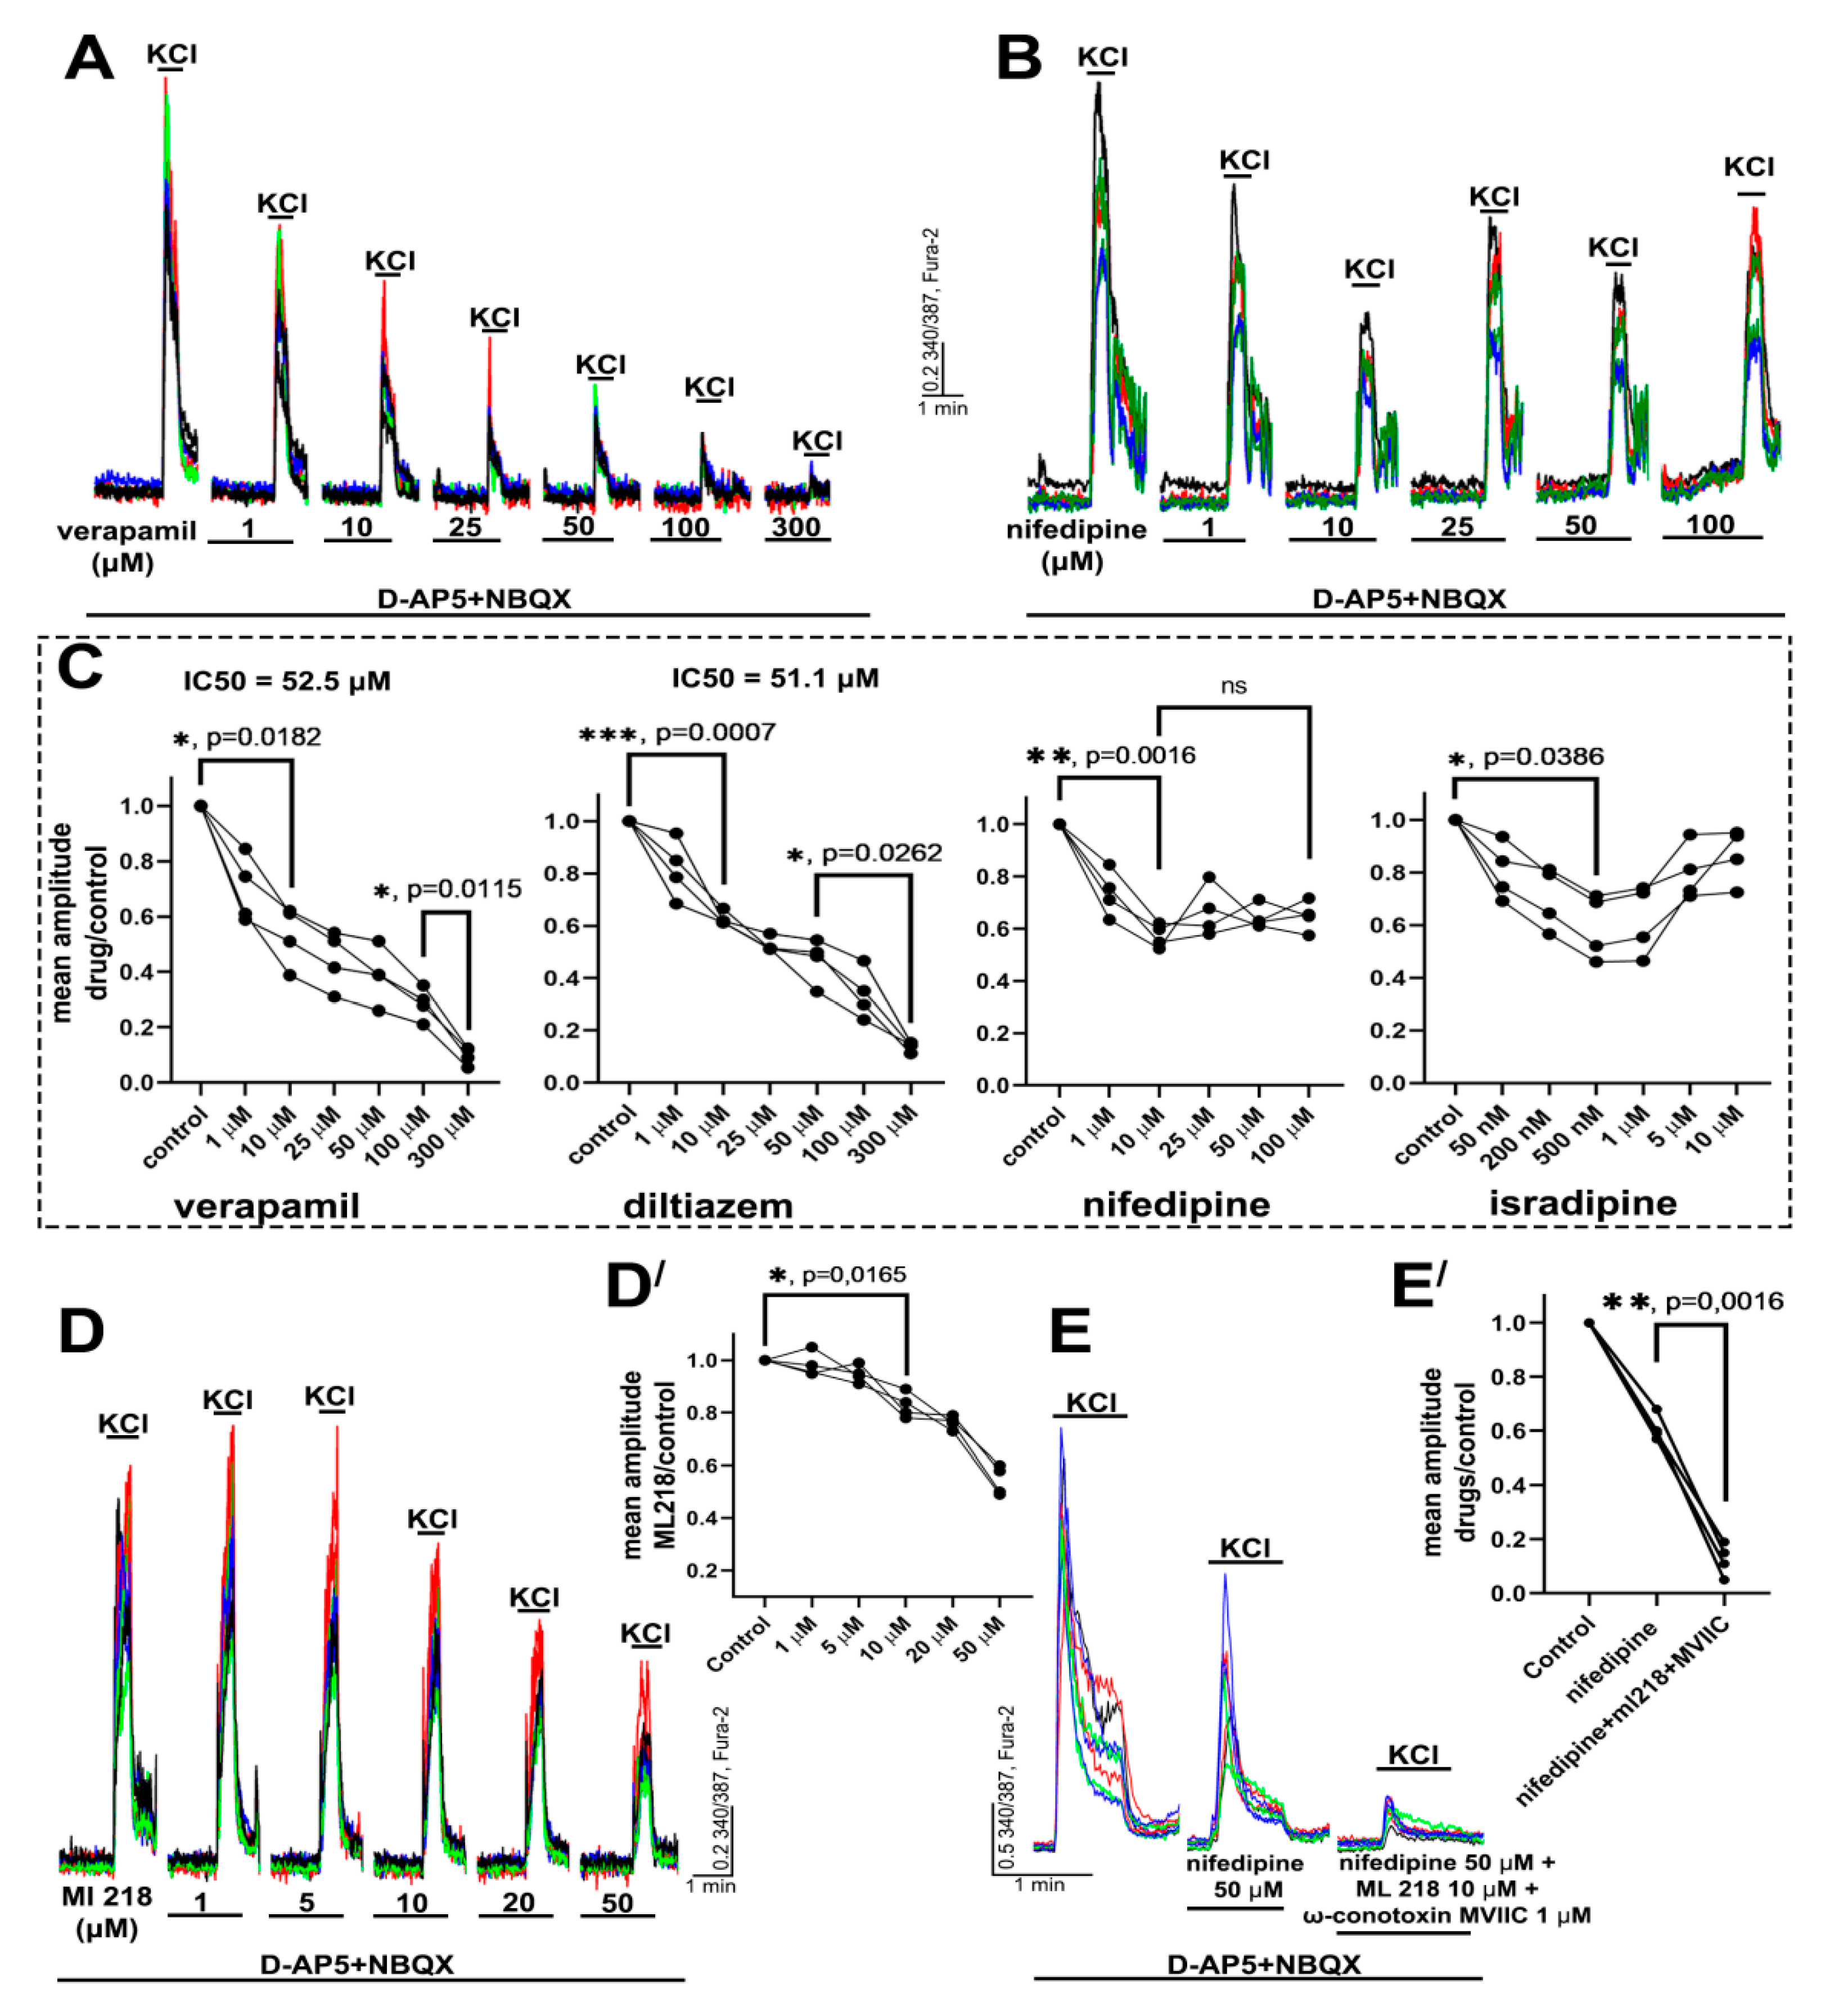
Abstract
1. Introduction
2. Results
2.1. Determination of Effective Concentrations of L-Type VGCC Blockers
2.2. Contribution of L-Type VGCC to the Epileptiform Activity of Neurons
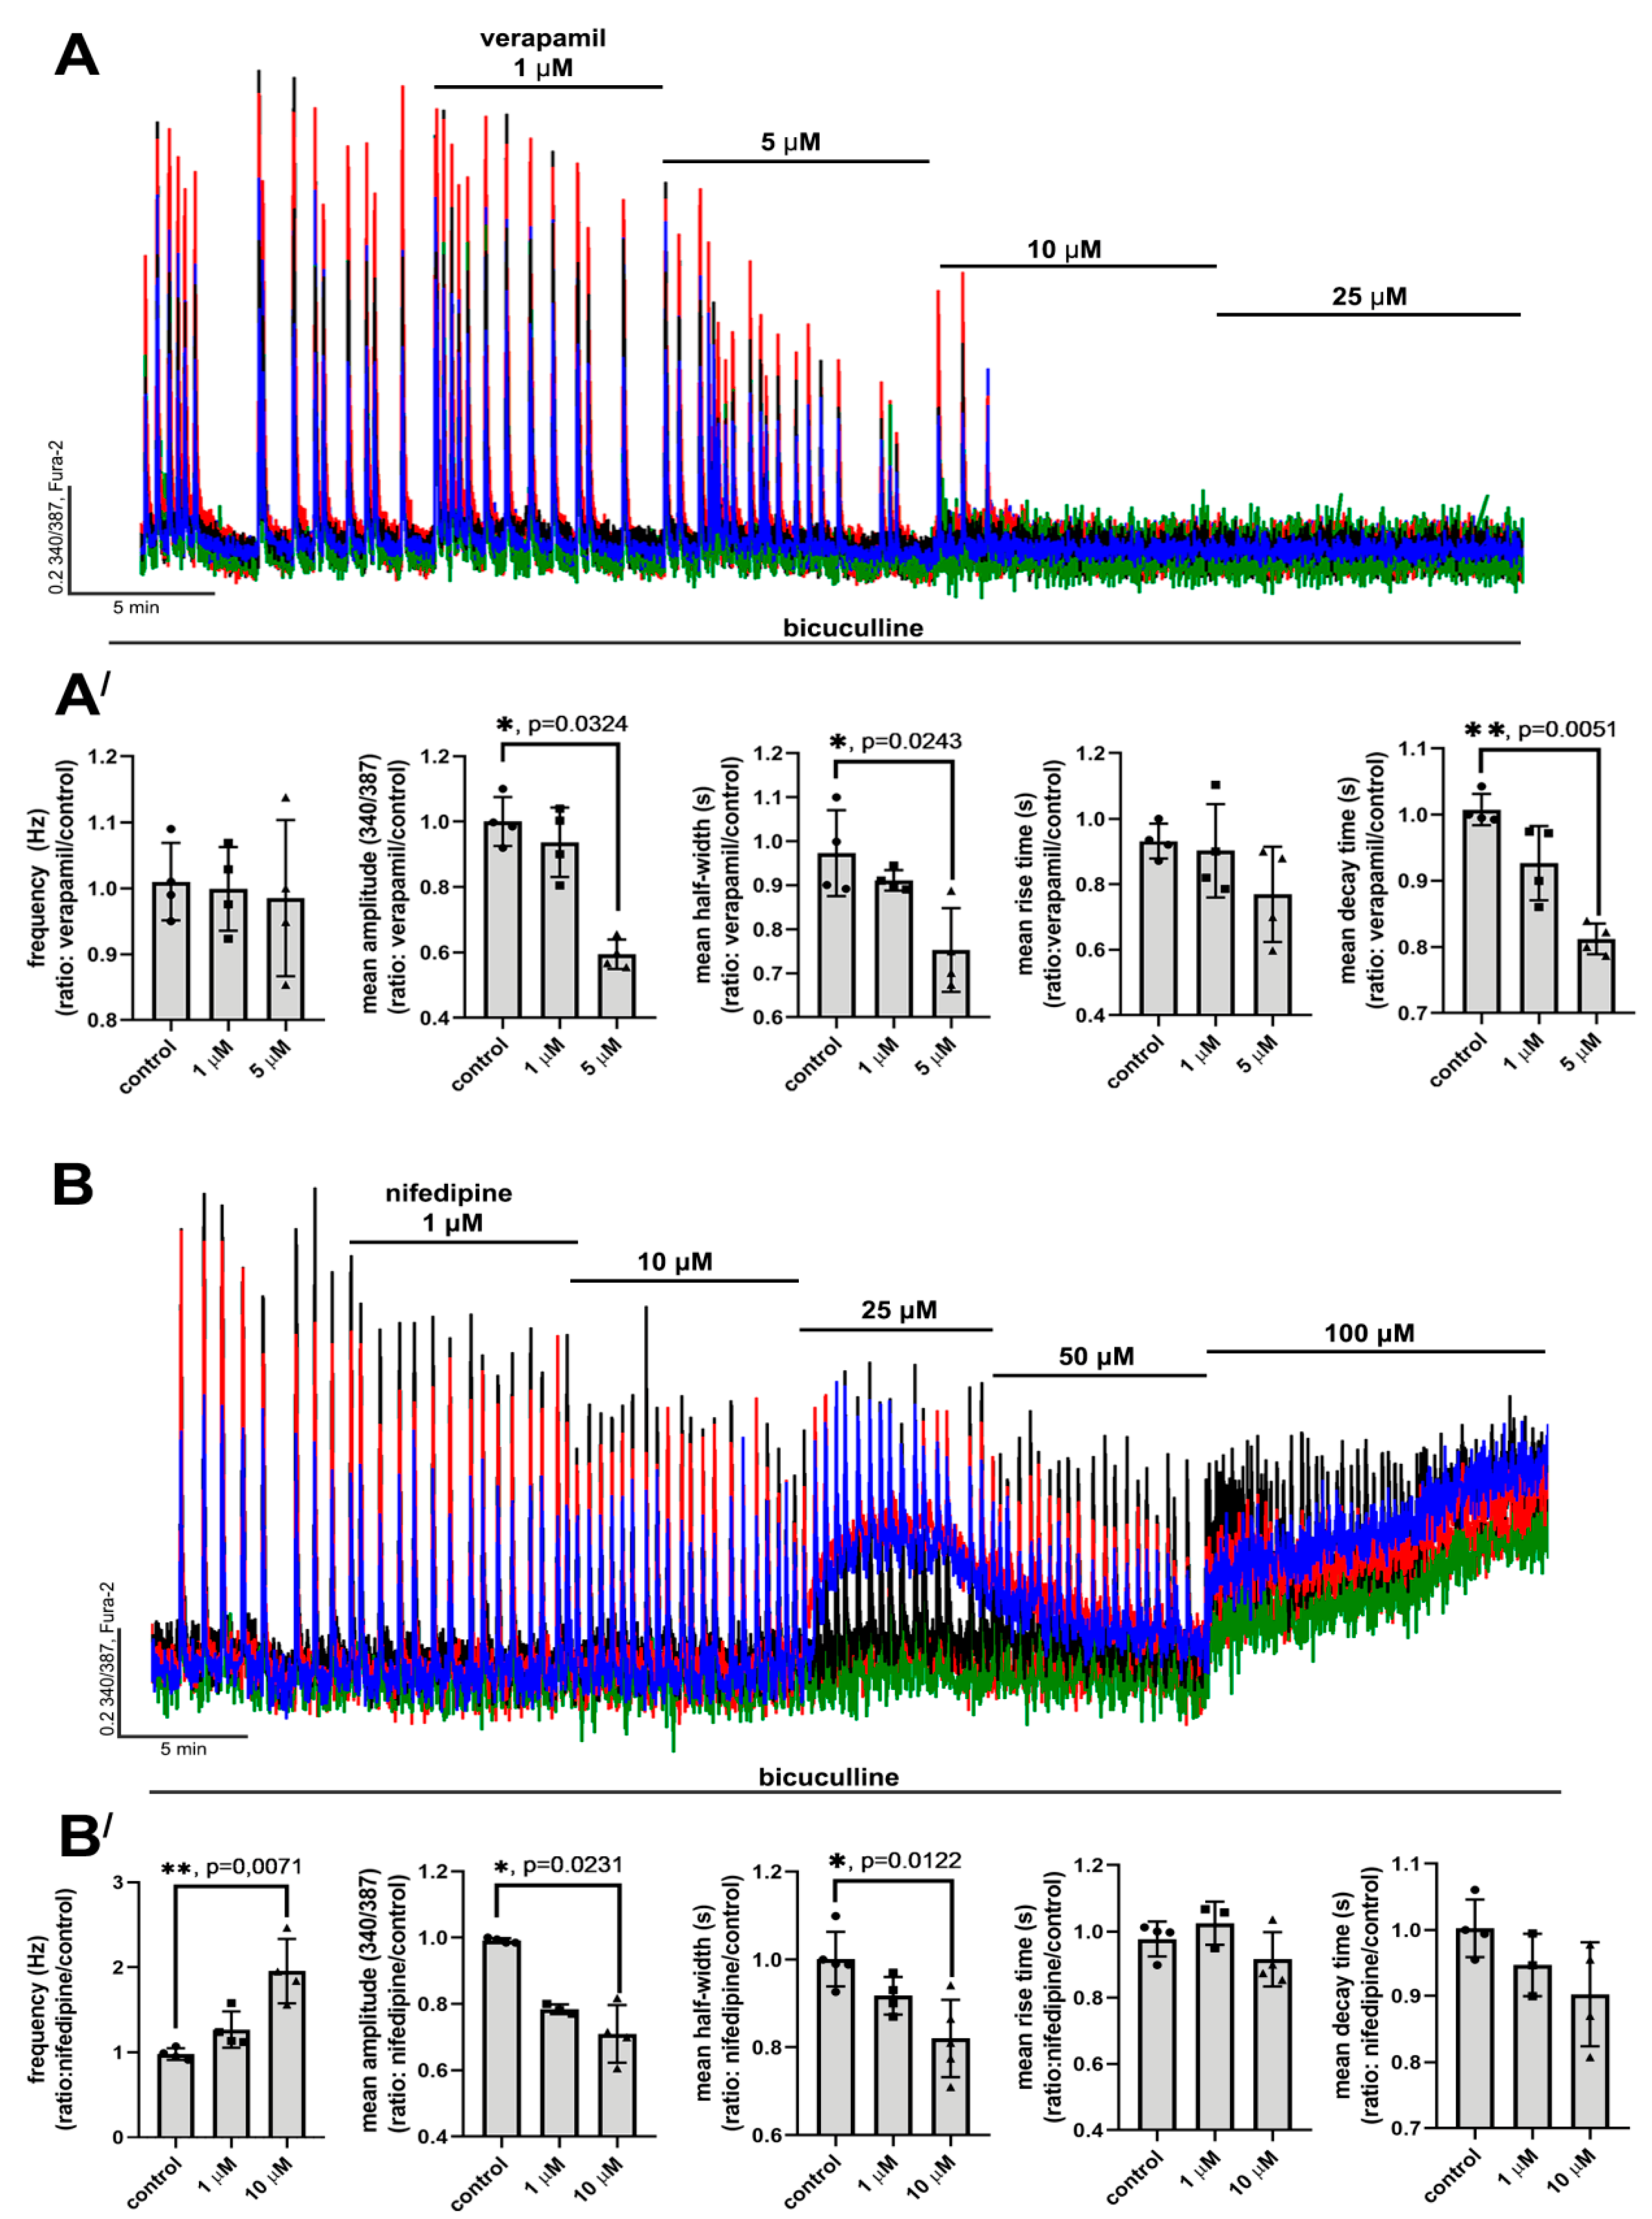
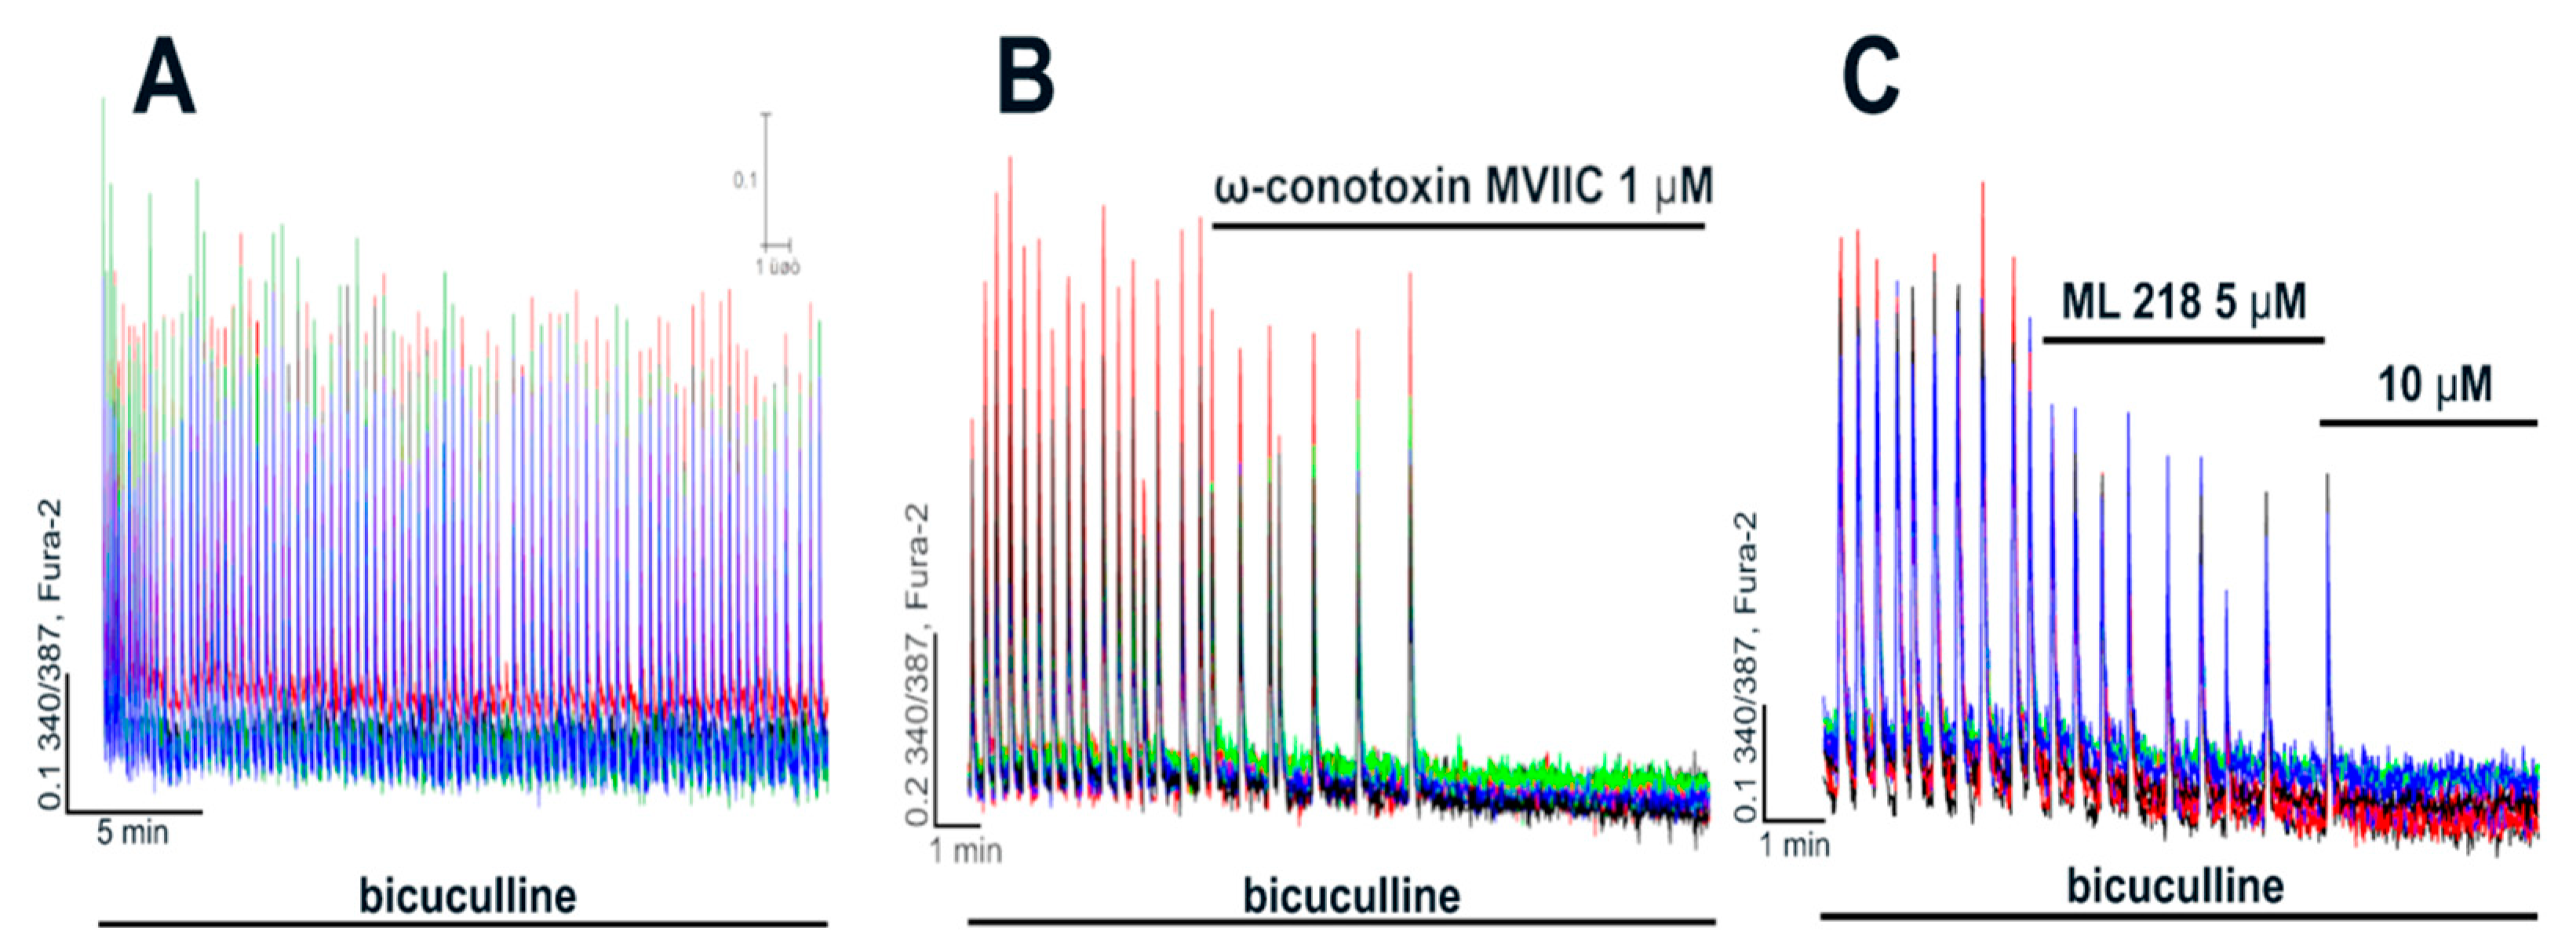
2.2.1. The Effects of L-Type VGCC Blockade on the Parameters of [Ca2+]i Oscillations
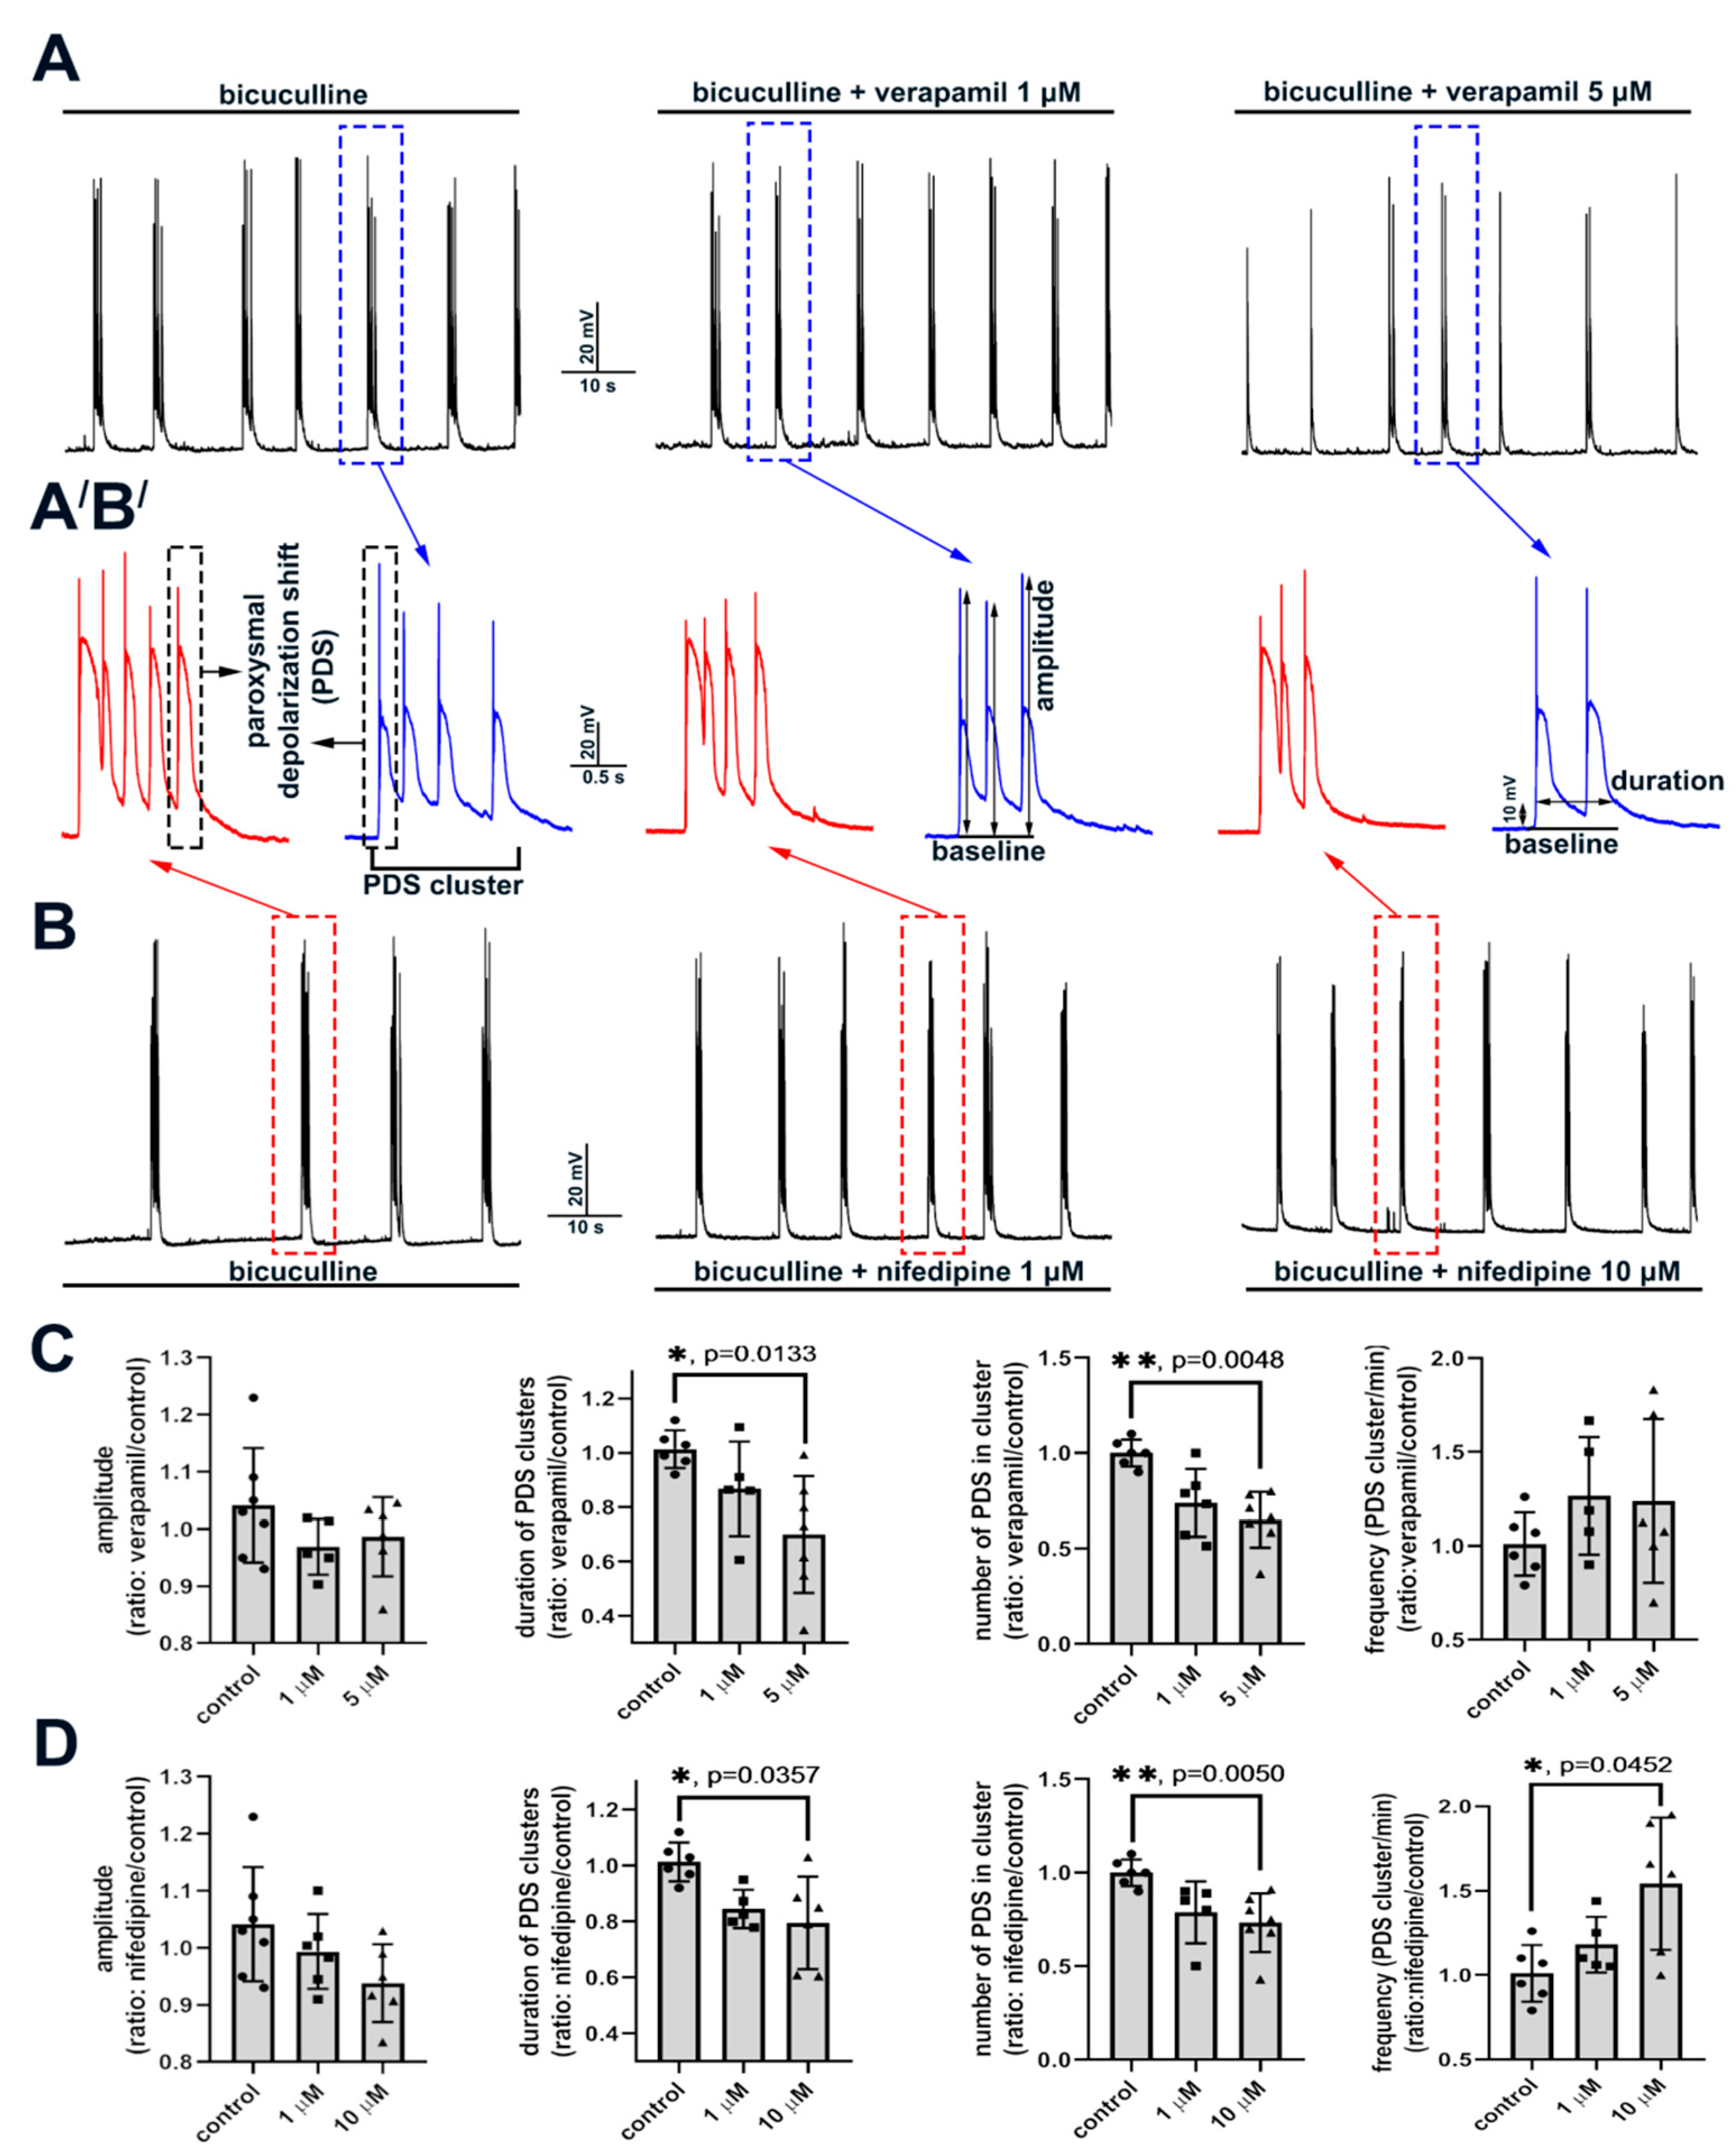
2.2.2. The Effect of L-Type VGCC Blockade on Paroxysmal Depolarization Shift in Neurons
2.3. Side Effects of High Doses of Dihydropyridines
3. Discussion
3.1. L-Type VGCC Blockers
3.2. Role of L-Type VGCC in Epileptiform Activity
4. Materials and Methods
4.1. Preparation of Hippocampal Cell Cultures
4.2. Fluorescent [Ca2+]i Measurements
4.3. Immunocytochemistry
4.4. Whole-Cell Patch-Clamp
4.5. Statistics and Data Analysis
4.6. Reagents
Supplementary Materials
Author Contributions
Funding
Institutional Review Board Statement
Informed Consent Statement
Data Availability Statement
Acknowledgments
Conflicts of Interest
References
- Ngugi, A.K.; Bottomley, C.; Kleinschmidt, I.; Sander, J.W.; Newton, C.R. Estimation of the burden of active and life-time epilepsy: A meta-analytic approach. Epilepsia 2010, 51, 883–890. [Google Scholar] [CrossRef] [PubMed]
- Shao, L.-R.; Habela, C.W.; Stafstrom, C.E. Pediatric Epilepsy Mechanisms: Expanding the Paradigm of Excitation/Inhibition Imbalance. Children 2019, 6, 23. [Google Scholar] [CrossRef] [PubMed]
- Stiglbauer, V.; Hotka, M.; Ruiß, M.; Hilber, K.; Boehm, S.; Kubista, H. Cav1.3 channels play a crucial role in the formation of paroxysmal depolarization shifts in cultured hippocampal neurons. Epilepsia 2017, 58, 858–871. [Google Scholar] [CrossRef] [PubMed]
- Kubista, H.; Boehm, S.; Hotka, M. The Paroxysmal Depolarization Shift: Reconsidering Its Role in Epilepsy, Epileptogenesis and Beyond. Int. J. Mol. Sci. 2019, 20, 577. [Google Scholar] [CrossRef]
- Dreier, J.P.; Major, S.; Pannek, H.-W.; Woitzik, J.; Scheel, M.; Wiesenthal, D.; Martus, P.; Winkler, M.K.L.; Hartings, J.A.; Fabricius, M.; et al. Spreading convulsions, spreading depolarization and epileptogenesis in human cerebral cortex. Brain 2012, 135, 259–275. [Google Scholar] [CrossRef]
- Silva-Barrat, C.; Szente, M.; Menini, C.; Velluti, J.C.; Champagnat, J. Muscarinic depression of synaptic transmission in the epileptogenic GABA withdrawal syndrome focus. J. Neurophysiol. 2001, 85, 2159–2165. [Google Scholar] [CrossRef]
- Sun, D.A.; Sombati, S.; DeLorenzo, R.J. Glutamate injury-induced epileptogenesis in hippocampal neurons: An in vitro model of stroke-induced “epilepsy”. Stroke 2001, 32, 2344–2350. [Google Scholar] [CrossRef]
- Yang, Y.-C.; Wang, G.-H.; Chuang, A.-Y.; Hsueh, S.-W. Perampanel reduces paroxysmal depolarizing shift and inhibitory synaptic input in excitatory neurons to inhibit epileptic network oscillations. Br. J. Pharmacol. 2020, 177, 5177–5194. [Google Scholar] [CrossRef]
- Bazhenov, M.; Timofeev, I.; Fröhlich, F.; Sejnowski, T.J. Cellular and network mechanisms of electrographic seizures. Drug Discov. Today Dis. Models 2008, 5, 45–57. [Google Scholar] [CrossRef]
- Hablitz, J.J. Picrotoxin-induced epileptiform activity in hippocampus: Role of endogenous versus synaptic factors. J. Neurophysiol. 1984, 51, 1011–1027. [Google Scholar] [CrossRef]
- Straub, H.; Speckmann, E.-J.; Bingmann, D.; Walden, J. Paroxysmal depolarization shifts induced by bicuculline in CA3 neurons of hippocampal slices: Suppression by the organic calcium antagonist verapamil. Neurosci. Lett. 1990, 111, 99–101. [Google Scholar] [CrossRef]
- Gaidin, S.G.; Zinchenko, V.P.; Teplov, I.Y.; Tuleukhanov, S.T.; Kosenkov, A.M. Epileptiform activity promotes decreasing of Ca2+ conductivity of NMDARs, AMPARs, KARs, and voltage-gated calcium channels in Mg2+-free model. Epilepsy Res. 2019, 158, 106224. [Google Scholar] [CrossRef]
- Schiller, Y. Inter-ictal- and ictal-like epileptic discharges in the dendritic tree of neocortical pyramidal neurons. J. Neurophysiol. 2002, 88, 2954–2962. [Google Scholar] [CrossRef]
- Nikolaev, M.V.; Chizhov, A.V.; Tikhonov, D.B. Molecular mechanisms of action determine inhibition of paroxysmal depolarizing shifts by NMDA receptor antagonists in rat cortical neurons. Neuropharmacology 2021, 184, 108443. [Google Scholar] [CrossRef]
- Yaron-Jakoubovitch, A.; Koch, C.; Segev, I.; Yarom, Y. The unimodal distribution of sub-threshold, ongoing activity in cortical networks. Front. Neural Circuits 2013, 7, 116. [Google Scholar] [CrossRef]
- Matsumoto, H.; Marsan, C.A. Cortical cellular phenomena in experimental epilepsy: Interictal manifestations. Exp. Neurol. 1964, 9, 286–304. [Google Scholar] [CrossRef]
- Prince, D.A. The depolarization shift in “epileptic” neurons. Exp. Neurol. 1968, 21, 467–485. [Google Scholar] [CrossRef]
- Staley, K.; Hellier, J.L.; Dudek, F.E. Do interictal spikes drive epileptogenesis? Neuroscientist 2005, 11, 272–276. [Google Scholar] [CrossRef] [PubMed]
- Librizzi, L.; de Curtis, M. Epileptiform ictal discharges are prevented by periodic interictal spiking in the olfactory cortex. Ann. Neurol. 2003, 53, 382–389. [Google Scholar] [CrossRef]
- Rogawski, M.A. Point-counterpoint: Do interictal spikes trigger seizures or protect against them? Epilepsy Curr. 2006, 6, 197–198. [Google Scholar] [CrossRef] [PubMed]
- Staley, K.J.; White, A.; Dudek, F.E. Interictal spikes: Harbingers or causes of epilepsy? Neurosci. Lett. 2011, 497, 247–250. [Google Scholar] [CrossRef]
- Kam, K.; Duffy, Á.M.; Moretto, J.; LaFrancois, J.J.; Scharfman, H.E. Interictal spikes during sleep are an early defect in the Tg2576 mouse model of β-amyloid neuropathology. Sci. Rep. 2016, 6, 20119. [Google Scholar] [CrossRef]
- Lam, A.D.; Deck, G.; Goldman, A.; Eskandar, E.N.; Noebels, J.; Cole, A.J. Silent hippocampal seizures and spikes identified by foramen ovale electrodes in Alzheimer’s disease. Nat. Med. 2017, 23, 678–680. [Google Scholar] [CrossRef]
- Pignatelli, M.; Lebreton, F.; Cho, Y.H.; Leinekugel, X. “Ectopic” theta oscillations and interictal activity during slow-wave state in the R6/1 mouse model of Huntington’s disease. Neurobiol. Dis. 2012, 48, 409–417. [Google Scholar] [CrossRef]
- Rubi, L.; Schandl, U.; Lagler, M.; Geier, P.; Spies, D.; Gupta, K.D.; Boehm, S.; Kubista, H. Raised activity of L-type calcium channels renders neurons prone to form paroxysmal depolarization shifts. Neuromolecular Med. 2013, 15, 476–492. [Google Scholar] [CrossRef]
- Striessnig, J.; Pinggera, A.; Kaur, G.; Bock, G.; Tuluc, P. L-type Ca2+ channels in heart and brain. Wiley Interdiscip. Rev. Membr. Transp. Signal. 2014, 3, 15–38. [Google Scholar] [CrossRef] [PubMed]
- Tuluc, P.; Yarov-Yarovoy, V.; Benedetti, B.; Flucher, B.E. Molecular Interactions in the Voltage Sensor Controlling Gating Properties of CaV Calcium Channels. Structure 2016, 24, 261–271. [Google Scholar] [CrossRef]
- Frishman, W.H. Calcium channel blockers: Differences between subclasses. Am. J. Cardiovasc. Drugs 2007, 7 (Suppl. 1), 17–23. [Google Scholar] [CrossRef] [PubMed]
- Ramírez, D.; Gonzalez, W.; Fissore, R.A.; Carvacho, I. Conotoxins as Tools to Understand the Physiological Function of Voltage-Gated Calcium (CaV) Channels. Mar. Drugs 2017, 15, 313. [Google Scholar] [CrossRef] [PubMed]
- Xiang, Z.; Thompson, A.D.; Brogan, J.T.; Schulte, M.L.; Melancon, B.J.; Mi, D.; Lewis, L.M.; Zou, B.; Yang, L.; Morrison, R.; et al. The Discovery and Characterization of ML218: A Novel, Centrally Active T-Type Calcium Channel Inhibitor with Robust Effects in STN Neurons and in a Rodent Model of Parkinson’s Disease. ACS Chem. Neurosci. 2011, 2, 730–742. [Google Scholar] [CrossRef]
- Kosenkov, A.M.; Gaidin, S.G.; Sergeev, A.I.; Teplov, I.Y.; Zinchenko, V.P. Fast changes of NMDA and AMPA receptor activity under acute hyperammonemia in vitro. Neurosci. Lett. 2018, 686, 80–86. [Google Scholar] [CrossRef]
- Teplov, I.Y.; Zinchenko, V.P.; Kosenkov, A.M.; Gaidin, S.G.; Nenov, M.N.; Sergeev, A.I. Involvement of NMDA and GABA(A) receptors in modulation of spontaneous activity in hippocampal culture: Interrelations between burst firing and intracellular calcium signal. Biochem. Biophys. Res. Commun. 2021, 553, 99–106. [Google Scholar] [CrossRef]
- Xu, W.; Lipscombe, D. Neuronal CaV1.3α 1 L-Type Channels Activate at Relatively Hyperpolarized Membrane Potentials and Are Incompletely Inhibited by Dihydropyridines. J. Neurosci. 2001, 21, 5944–5951. [Google Scholar] [CrossRef] [PubMed]
- Chang, C.-C.; Cao, S.; Kang, S.; Kai, L.; Tian, X.; Pandey, P.; Dunne, S.F.; Luan, C.-H.; Surmeier, D.J.; Silverman, R.B. Antagonism of 4-substituted 1,4-dihydropyridine-3,5-dicarboxylates toward voltage-dependent L-type Ca2+ channels CaV1.3 and CaV1.2. Bioorg. Med. Chem. 2010, 18, 3147–3158. [Google Scholar] [CrossRef]
- Kang, S.; Cooper, G.; Dunne, S.F.; Dusel, B.; Luan, C.H.; Surmeier, D.J.; Silverman, R.B. CaV1.3-selective L-type calcium channel antagonists as potential new therapeutics for Parkinson’s disease. Nat. Commun. 2012, 3, 1146. [Google Scholar] [CrossRef] [PubMed]
- Bergson, P.; Lipkind, G.; Lee, S.P.; Duban, M.-E.; Hanck, D.A. Verapamil block of T-type calcium channels. Mol. Pharmacol. 2011, 79, 411–419. [Google Scholar] [CrossRef]
- Freeze, B.S.; McNulty, M.M.; Hanck, D.A. State-dependent verapamil block of the cloned human Ca(v)3.1 T-type Ca(2+) channel. Mol. Pharmacol. 2006, 70, 718–726. [Google Scholar] [CrossRef] [PubMed]
- Kuryshev, Y.A.; Brown, A.M.; Duzic, E.; Kirsch, G.E. Evaluating state dependence and subtype selectivity of calcium channel modulators in automated electrophysiology assays. Assay Drug Dev. Technol. 2014, 12, 110–119. [Google Scholar] [CrossRef]
- Hirasawa, M.; Pittman, Q.J. Nifedipine facilitates neurotransmitter release independently of calcium channels. Proc. Natl. Acad. Sci. USA 2003, 100, 6139–6144. [Google Scholar] [CrossRef] [PubMed]
- Bengtson, C.P.; Kaiser, M.; Obermayer, J.; Bading, H. Calcium responses to synaptically activated bursts of action potentials and their synapse-independent replay in cultured networks of hippocampal neurons. Biochim. Biophys. Acta 2013, 1833, 1672–1679. [Google Scholar] [CrossRef] [PubMed]
- Derchansky, M.; Shahar, E.; Wennberg, R.A.; Samoilova, M.; Jahromi, S.S.; Abdelmalik, P.A.; Zhang, L.; Carlen, P.L. Model of frequent, recurrent, and spontaneous seizures in the intact mouse hippocampus. Hippocampus 2004, 14, 935–947. [Google Scholar] [CrossRef]
- Gorji, A.; Moddel, G.; Speckmann, E.-J. Background potassium concentrations and epileptiform discharges. Brain Res. 2003, 959, 149–159. [Google Scholar] [CrossRef]
- Köhling, R.; Straub, H.; Speckmann, E.J. Differential involvement of L-type calcium channels in epileptogenesis of rat hippocampal slices during ontogenesis. Neurobiol. Dis. 2000, 7, 471–482. [Google Scholar] [CrossRef] [PubMed][Green Version]
- Link, M.C.; Wiemann, M.; Bingmann, D. Organic and inorganic calcium antagonists inhibit veratridine-induced epileptiform activity in CA3 neurons of the guinea pig. Epilepsy Res. 2008, 78, 147–154. [Google Scholar] [CrossRef]
- Gaidin, S.G.; Zinchenko, V.P.; Sergeev, A.I.; Teplov, I.Y.; Mal’tseva, V.N.; Kosenkov, A.M. Activation of alpha-2 adrenergic receptors stimulates GABA release by astrocytes. Glia 2020, 68, 1114–1130. [Google Scholar] [CrossRef] [PubMed]
- Le Meur, K.; Mendizabal-Zubiaga, J.; Grandes, P.; Audinat, E. GABA release by hippocampal astrocytes. Front. Comput. Neurosci. 2012, 6, 59. [Google Scholar] [CrossRef] [PubMed]
- Hotka, M.; Kubista, H. The paroxysmal depolarization shift in epilepsy research. Int. J. Biochem. Cell Biol. 2019, 107, 77–81. [Google Scholar] [CrossRef]
- Rajakulendran, S.; Hanna, M.G. The Role of Calcium Channels in Epilepsy. Cold Spring Harb. Perspect. Med. 2016, 6, a022723. [Google Scholar] [CrossRef]
- Steinlein, O.K. Calcium signaling and epilepsy. Cell Tissue Res. 2014, 357, 385–393. [Google Scholar] [CrossRef]
- Pisani, A.; Bonsi, P.; Martella, G.; de Persis, C.; Costa, C.; Pisani, F.; Bernardi, G.; Calabresi, P. Intracellular calcium increase in epileptiform activity: Modulation by levetiracetam and lamotrigine. Epilepsia 2004, 45, 719–728. [Google Scholar] [CrossRef]
- Teplov, I.Y.; Tuleukhanov, S.T.; Zinchenko, V.P. Regulation of Action Potential Frequency and Amplitude by T-type Ca2+ Channel During Spontaneous Synchronous Activity of Hippocampal Neurons. Biophysics 2018, 63, 566–575. [Google Scholar] [CrossRef]
- Maiorov, S.A.; Zinchenko, V.P.; Gaidin, S.G.; Kosenkov, A.M. Potential mechanism of GABA secretion in response to the activation of GluK1-containing kainate receptors. Neurosci. Res. 2021, 171, 27–33. [Google Scholar] [CrossRef]
- Kosenkov, A.M.; Teplov, I.Y.; Sergeev, A.I.; Maiorov, S.A.; Zinchenko, V.P.; Gaidin, S.G. Domoic acid suppresses hyperexcitation in the network due to activation of kainate receptors of GABAergic neurons. Arch. Biochem. Biophys. 2019, 671, 52–61. [Google Scholar] [CrossRef]


Publisher’s Note: MDPI stays neutral with regard to jurisdictional claims in published maps and institutional affiliations. |
© 2021 by the authors. Licensee MDPI, Basel, Switzerland. This article is an open access article distributed under the terms and conditions of the Creative Commons Attribution (CC BY) license (https://creativecommons.org/licenses/by/4.0/).
Share and Cite
Laryushkin, D.P.; Maiorov, S.A.; Zinchenko, V.P.; Gaidin, S.G.; Kosenkov, A.M. Role of L-Type Voltage-Gated Calcium Channels in Epileptiform Activity of Neurons. Int. J. Mol. Sci. 2021, 22, 10342. https://doi.org/10.3390/ijms221910342
Laryushkin DP, Maiorov SA, Zinchenko VP, Gaidin SG, Kosenkov AM. Role of L-Type Voltage-Gated Calcium Channels in Epileptiform Activity of Neurons. International Journal of Molecular Sciences. 2021; 22(19):10342. https://doi.org/10.3390/ijms221910342
Chicago/Turabian StyleLaryushkin, Denis P., Sergei A. Maiorov, Valery P. Zinchenko, Sergei G. Gaidin, and Artem M. Kosenkov. 2021. "Role of L-Type Voltage-Gated Calcium Channels in Epileptiform Activity of Neurons" International Journal of Molecular Sciences 22, no. 19: 10342. https://doi.org/10.3390/ijms221910342
APA StyleLaryushkin, D. P., Maiorov, S. A., Zinchenko, V. P., Gaidin, S. G., & Kosenkov, A. M. (2021). Role of L-Type Voltage-Gated Calcium Channels in Epileptiform Activity of Neurons. International Journal of Molecular Sciences, 22(19), 10342. https://doi.org/10.3390/ijms221910342