
Computational Methods to Study Human Transcript Variants in COVID-19 Infected Lung Cancer Cells

 , and
, and
Abstract
:1. Introduction
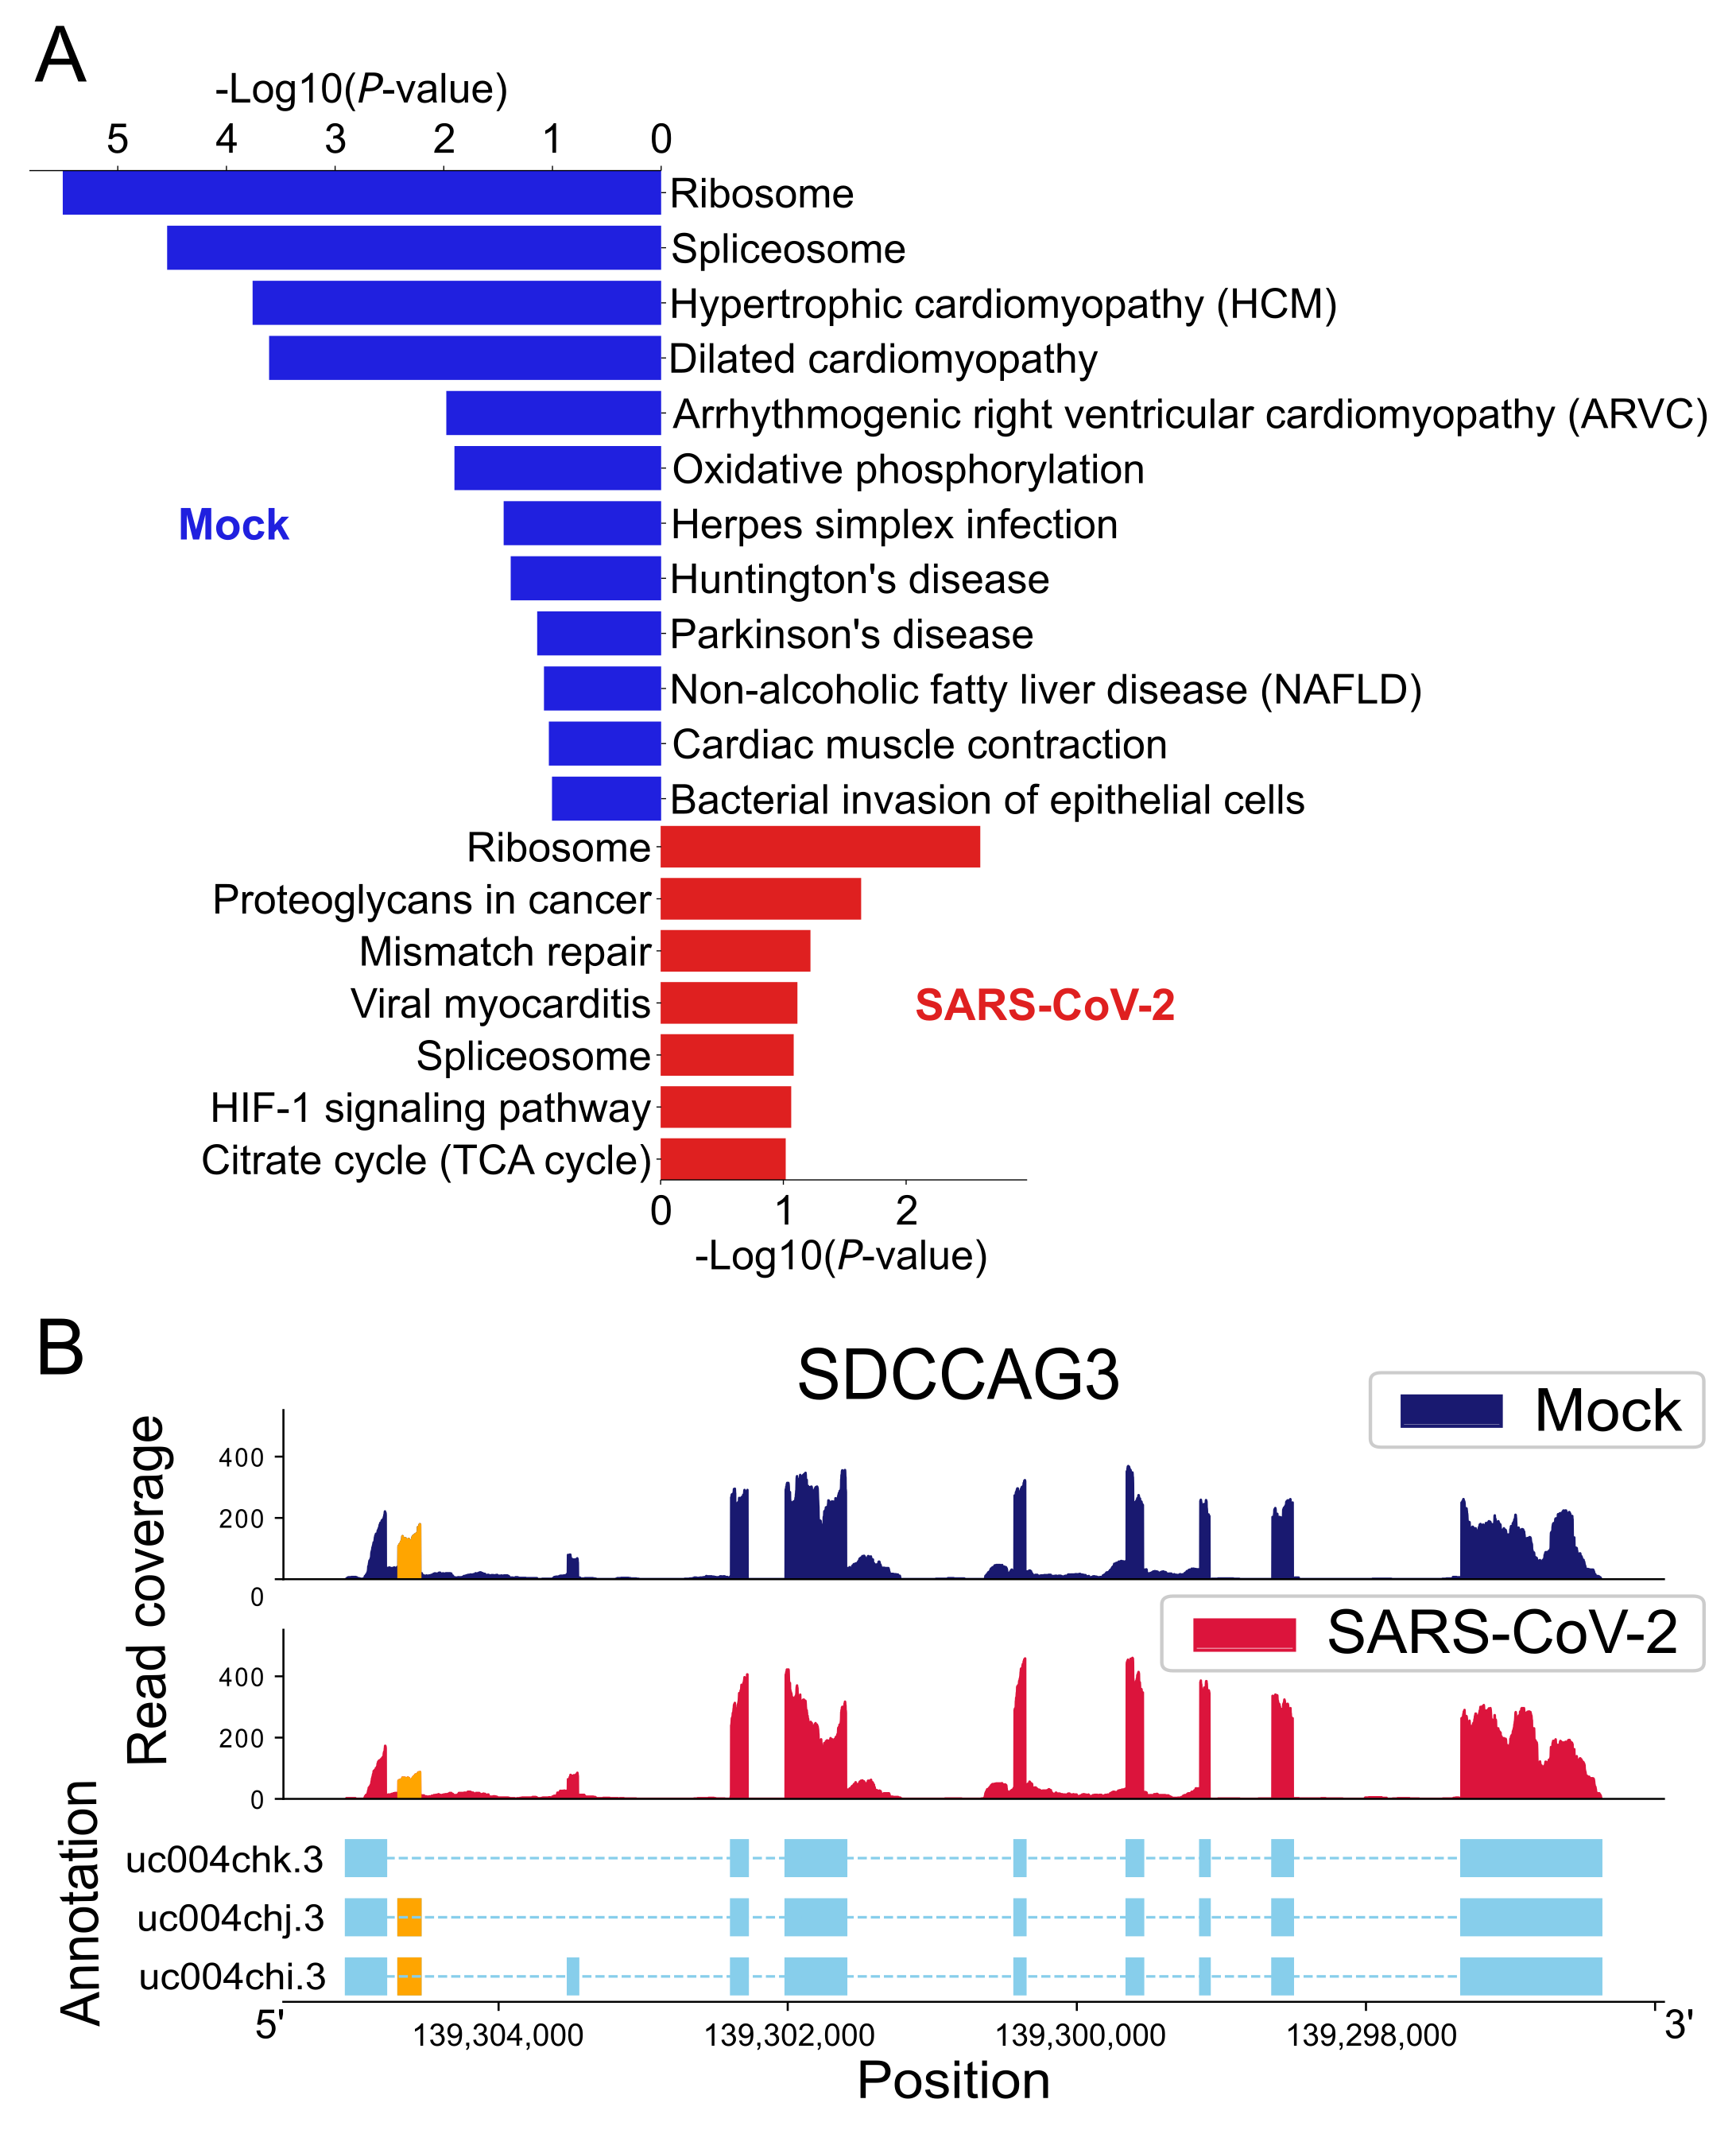
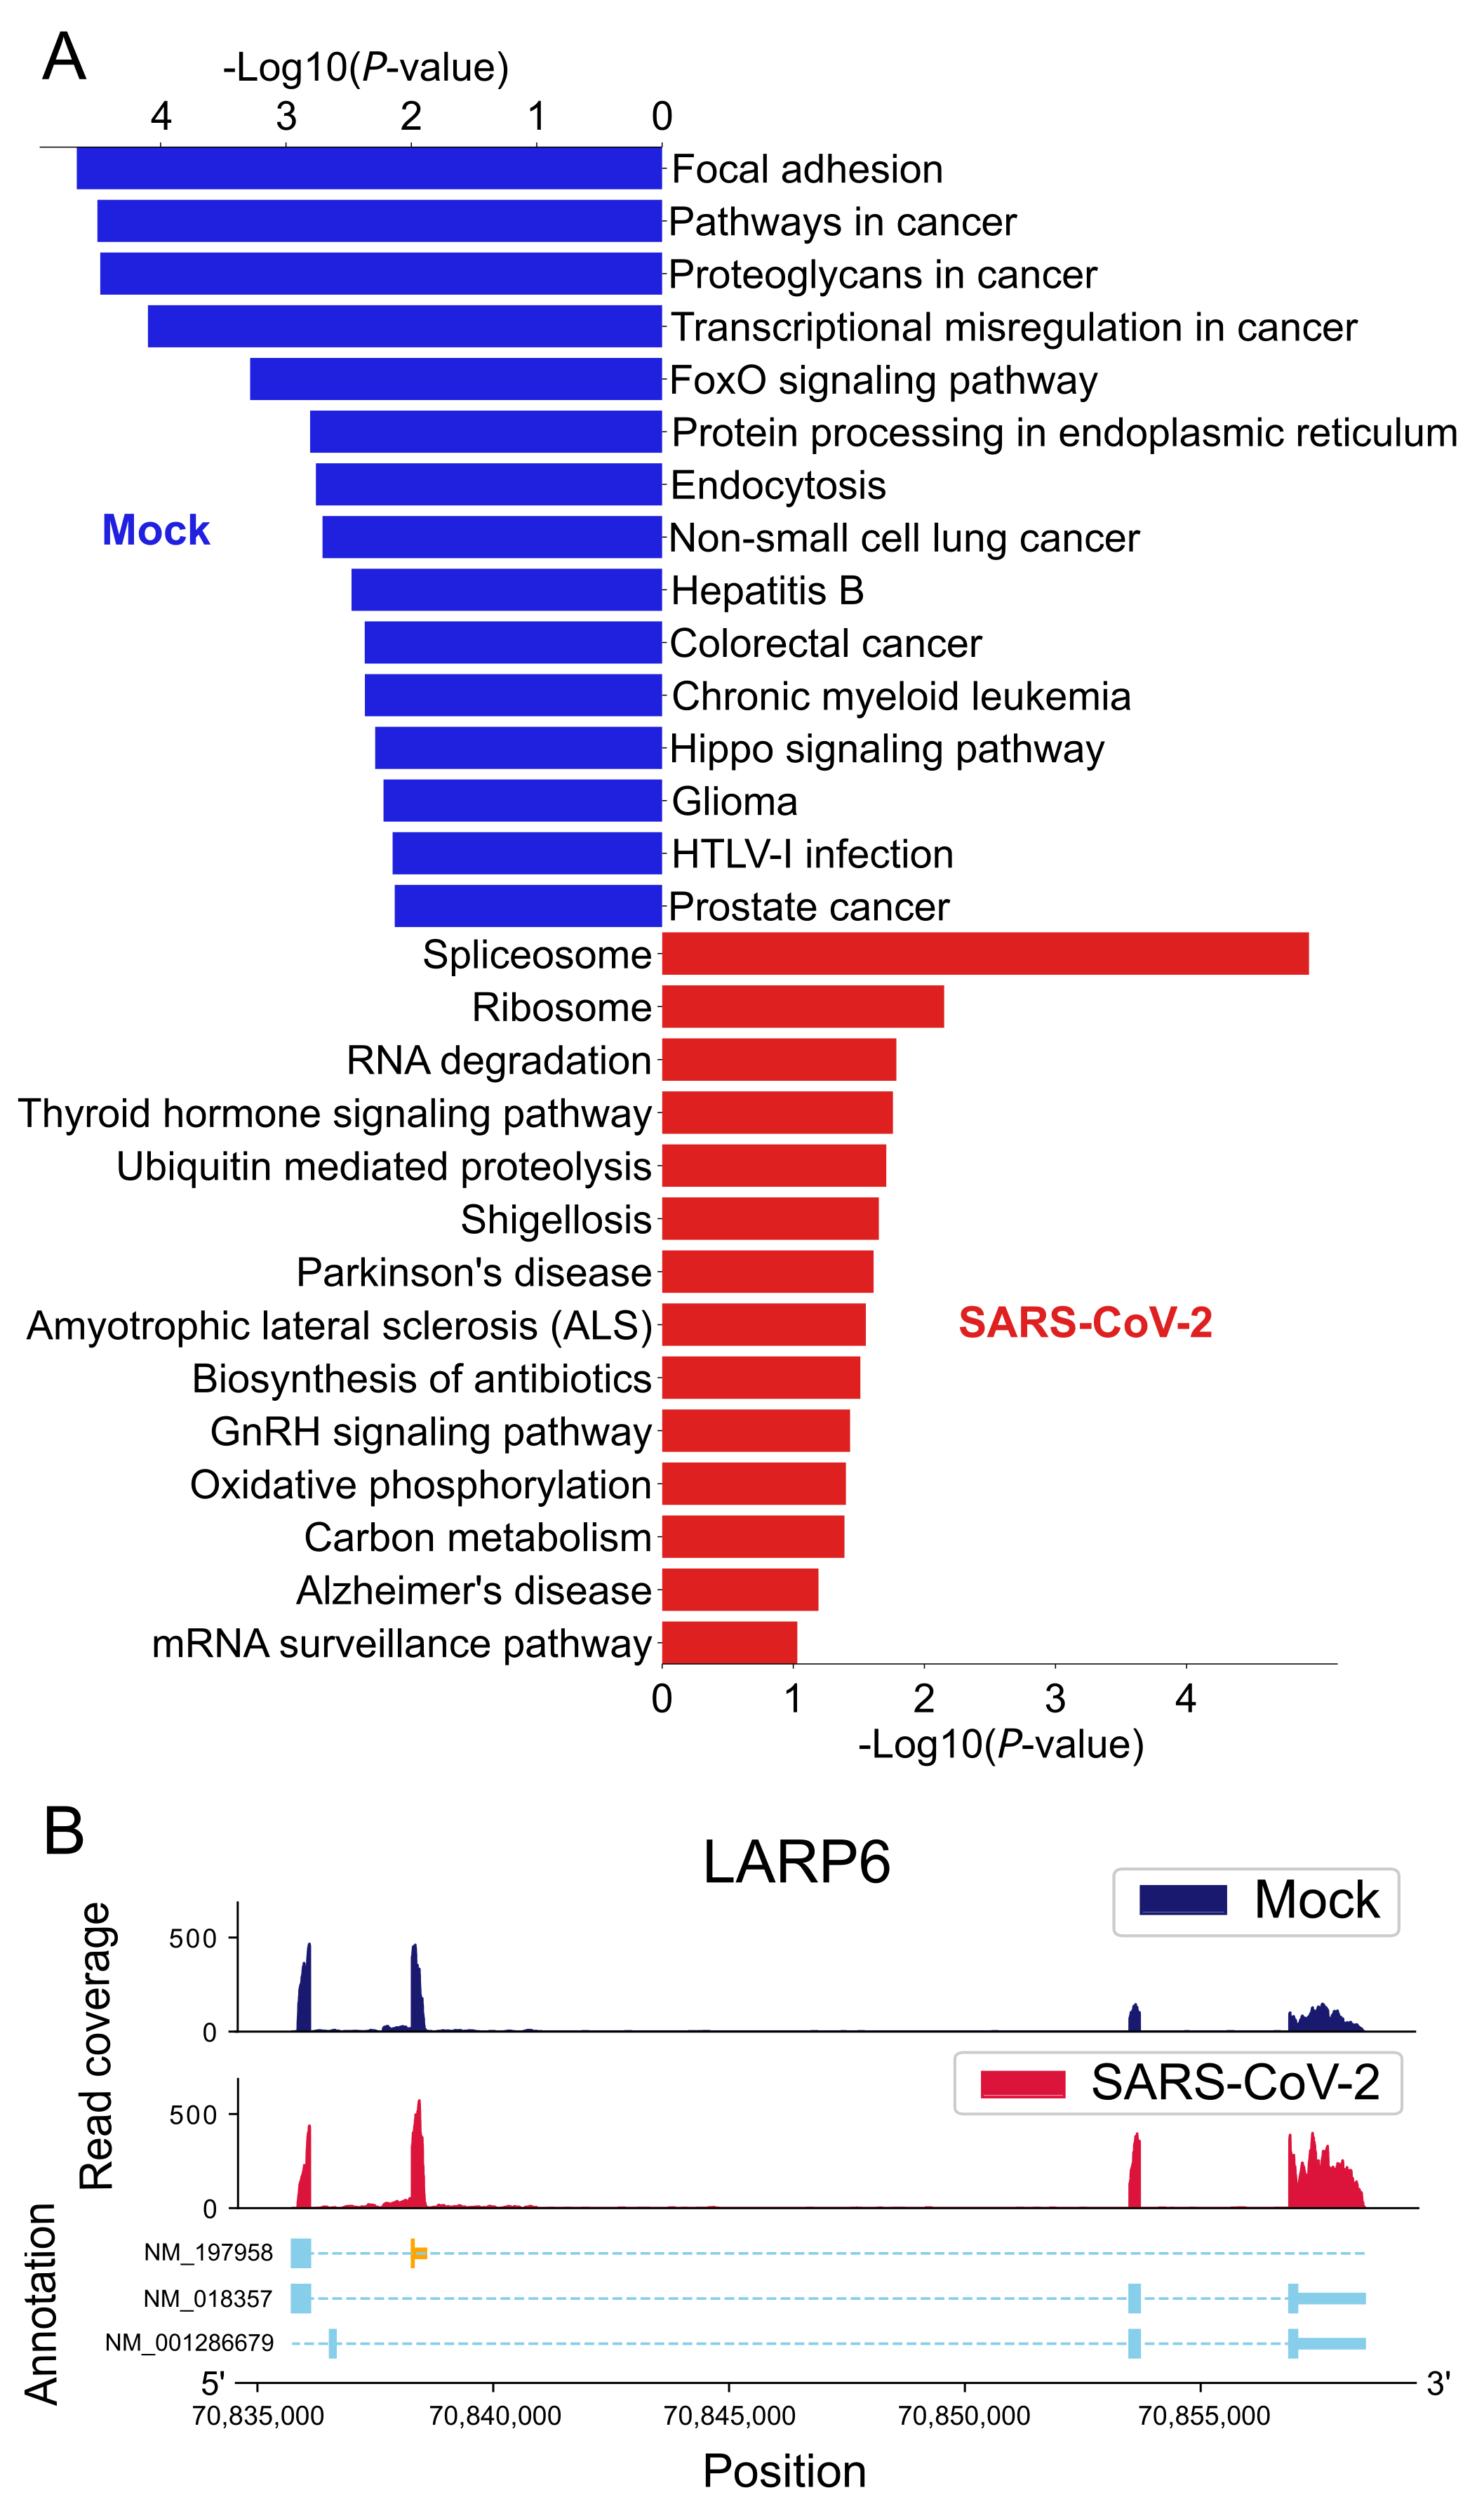
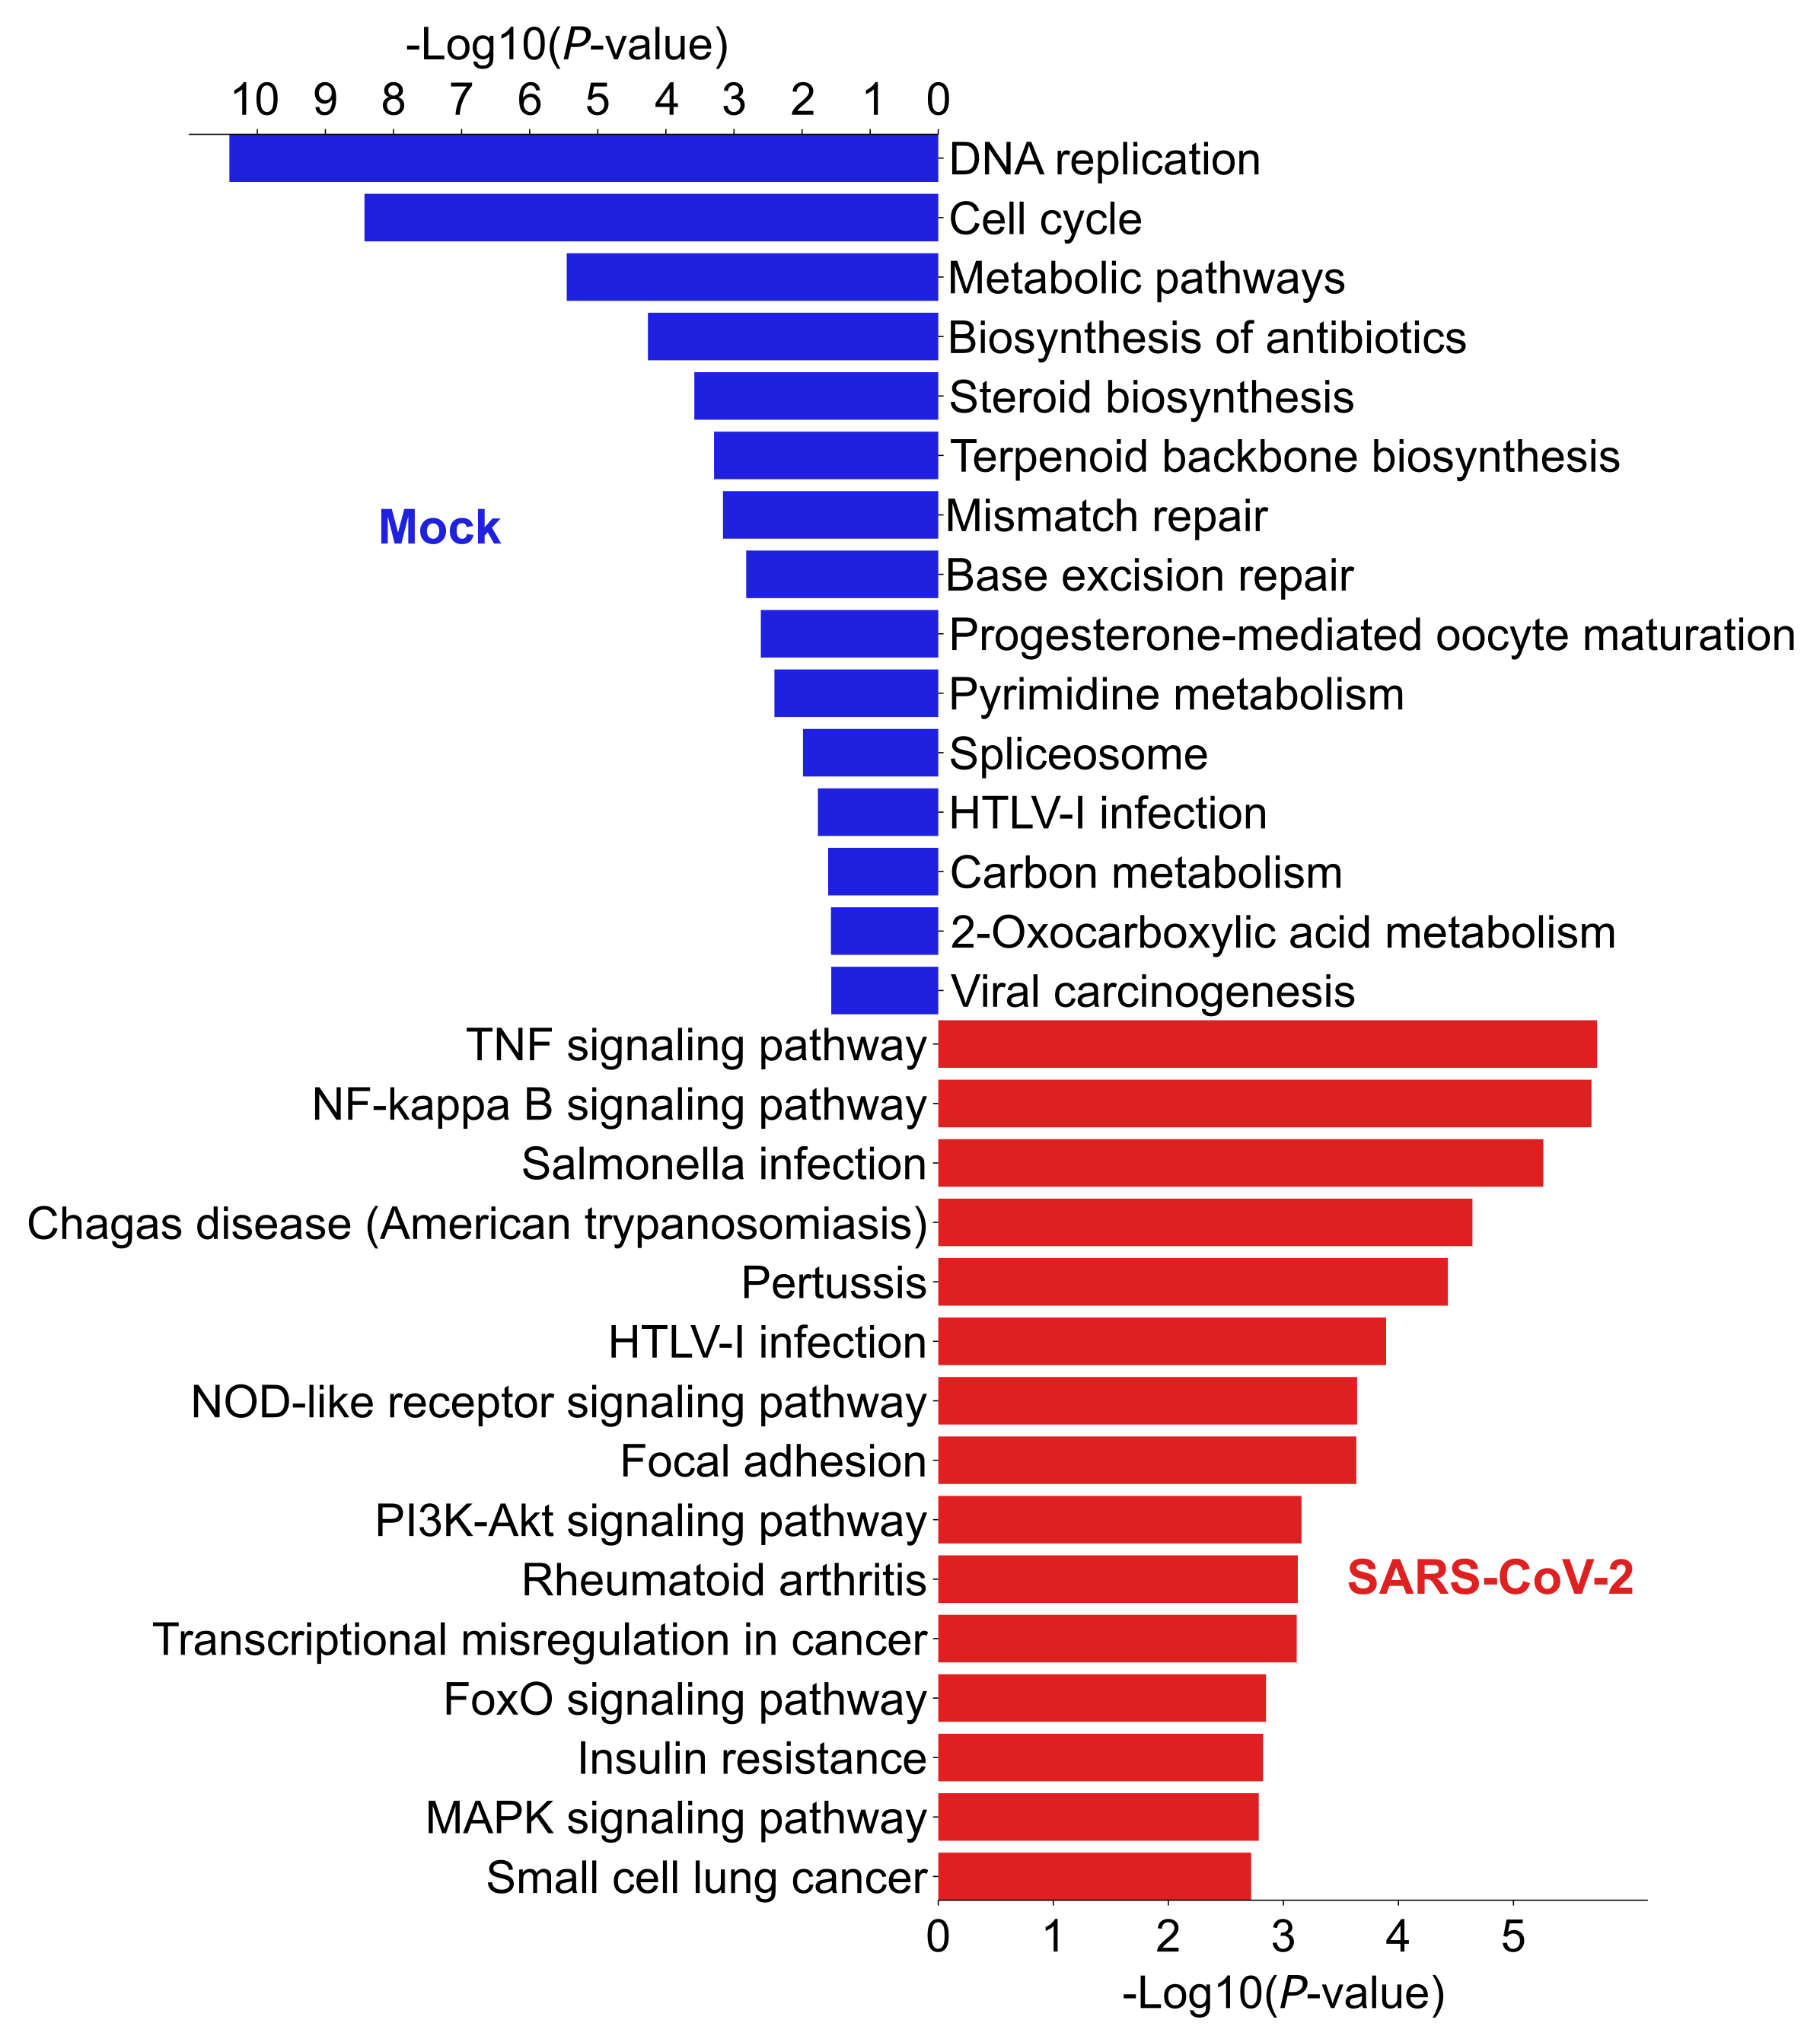
2. Results
2.1. Data
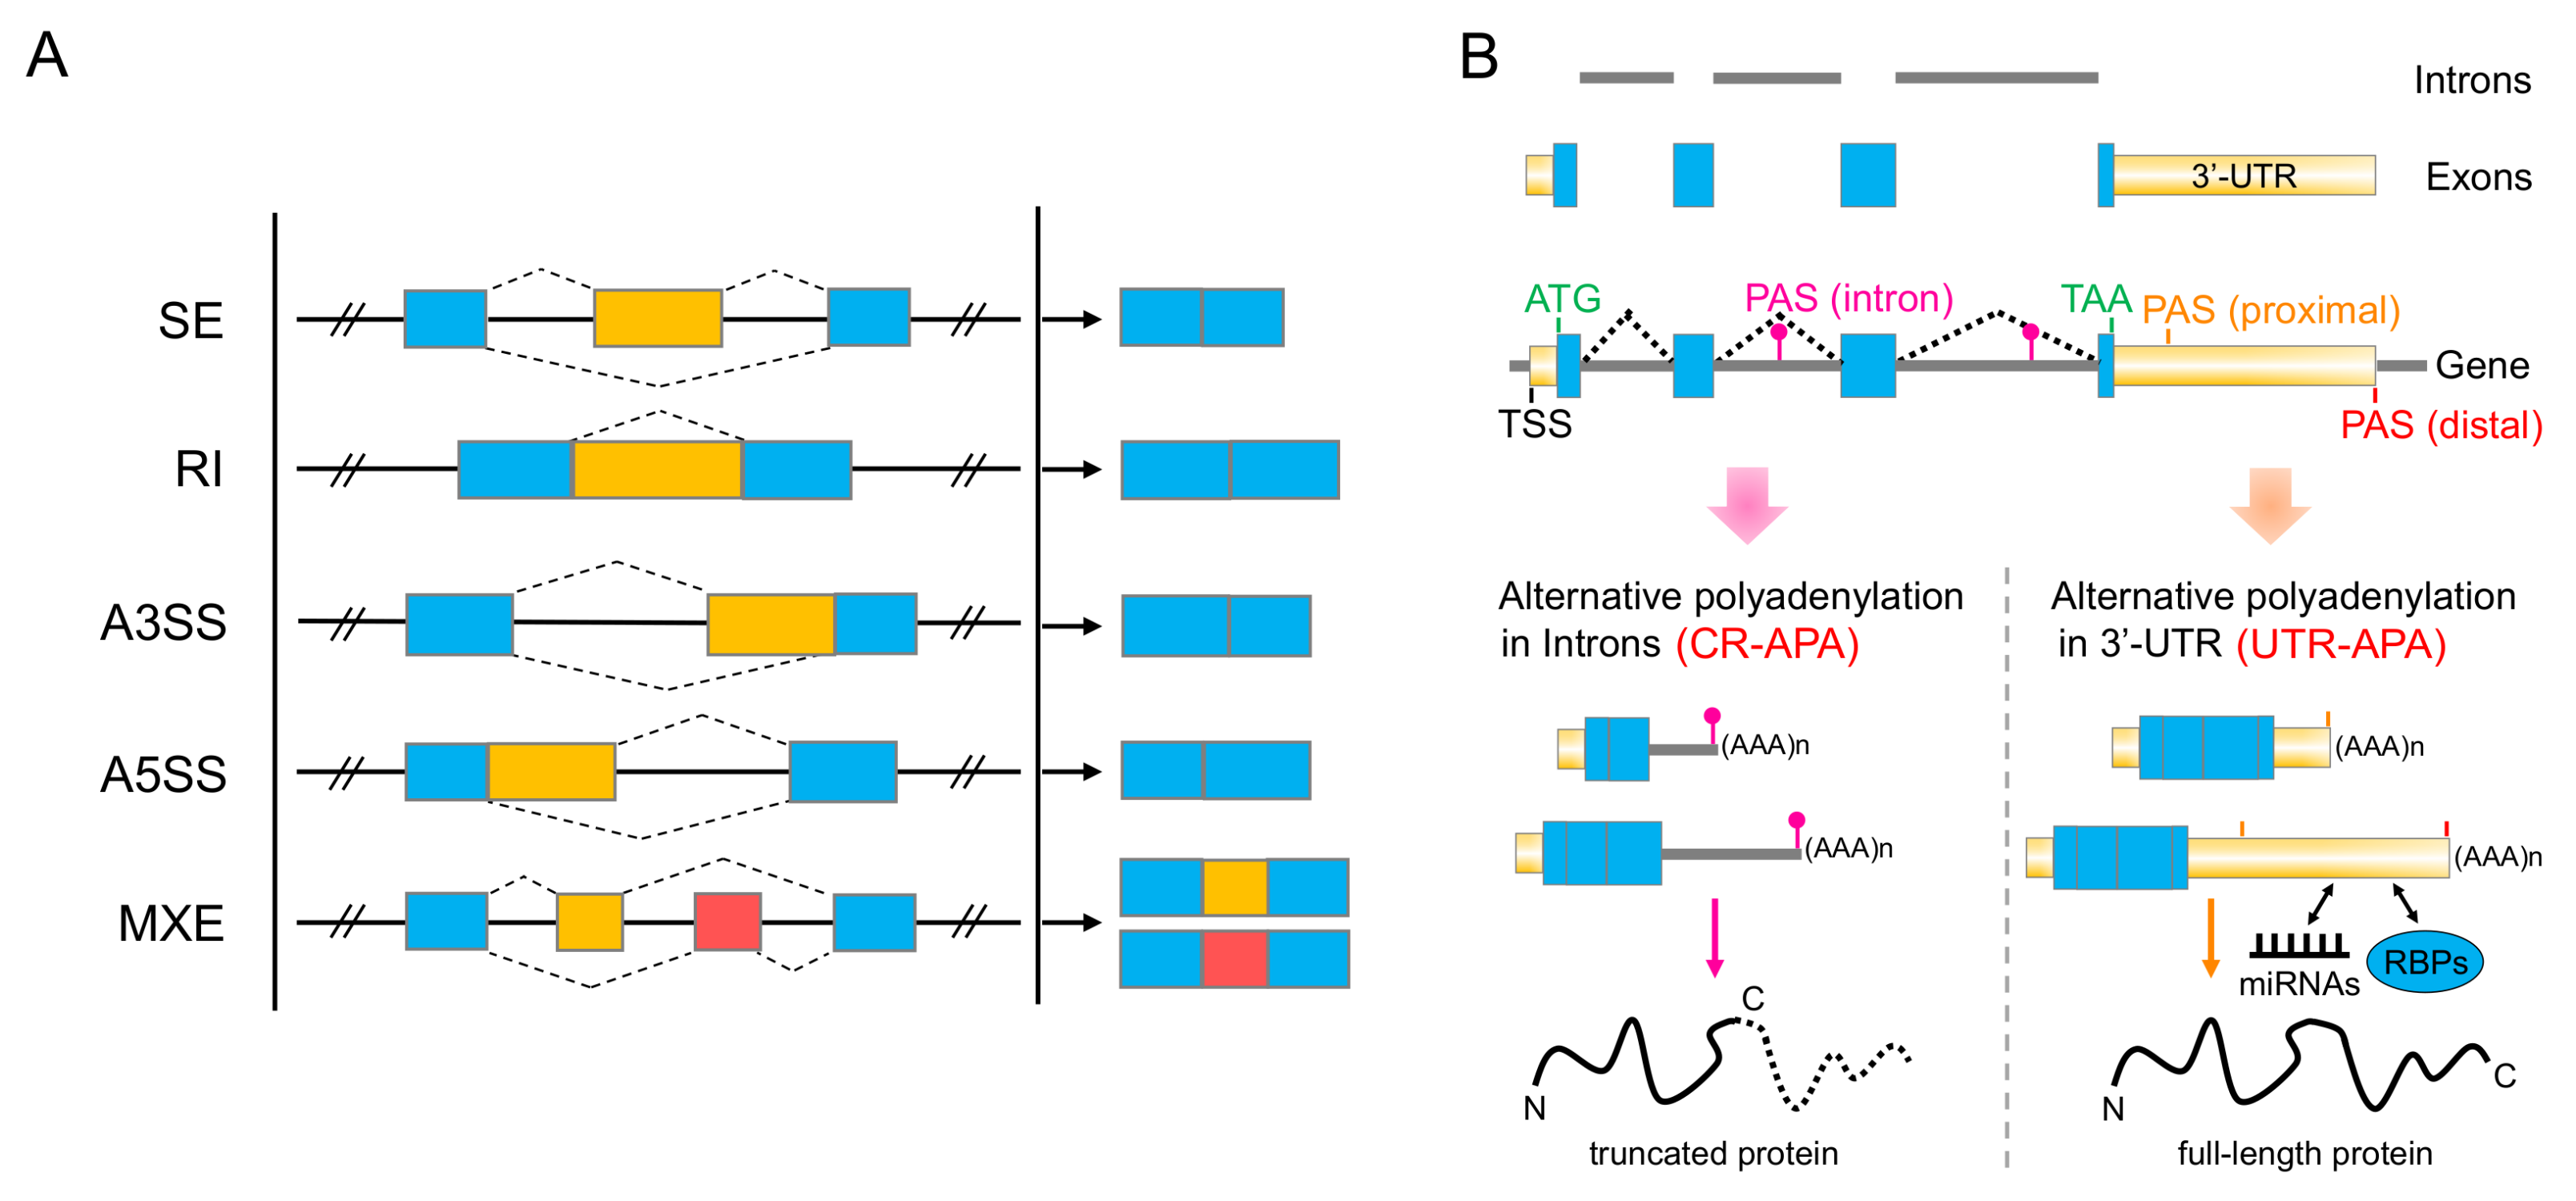
2.2. Alternative Splicing
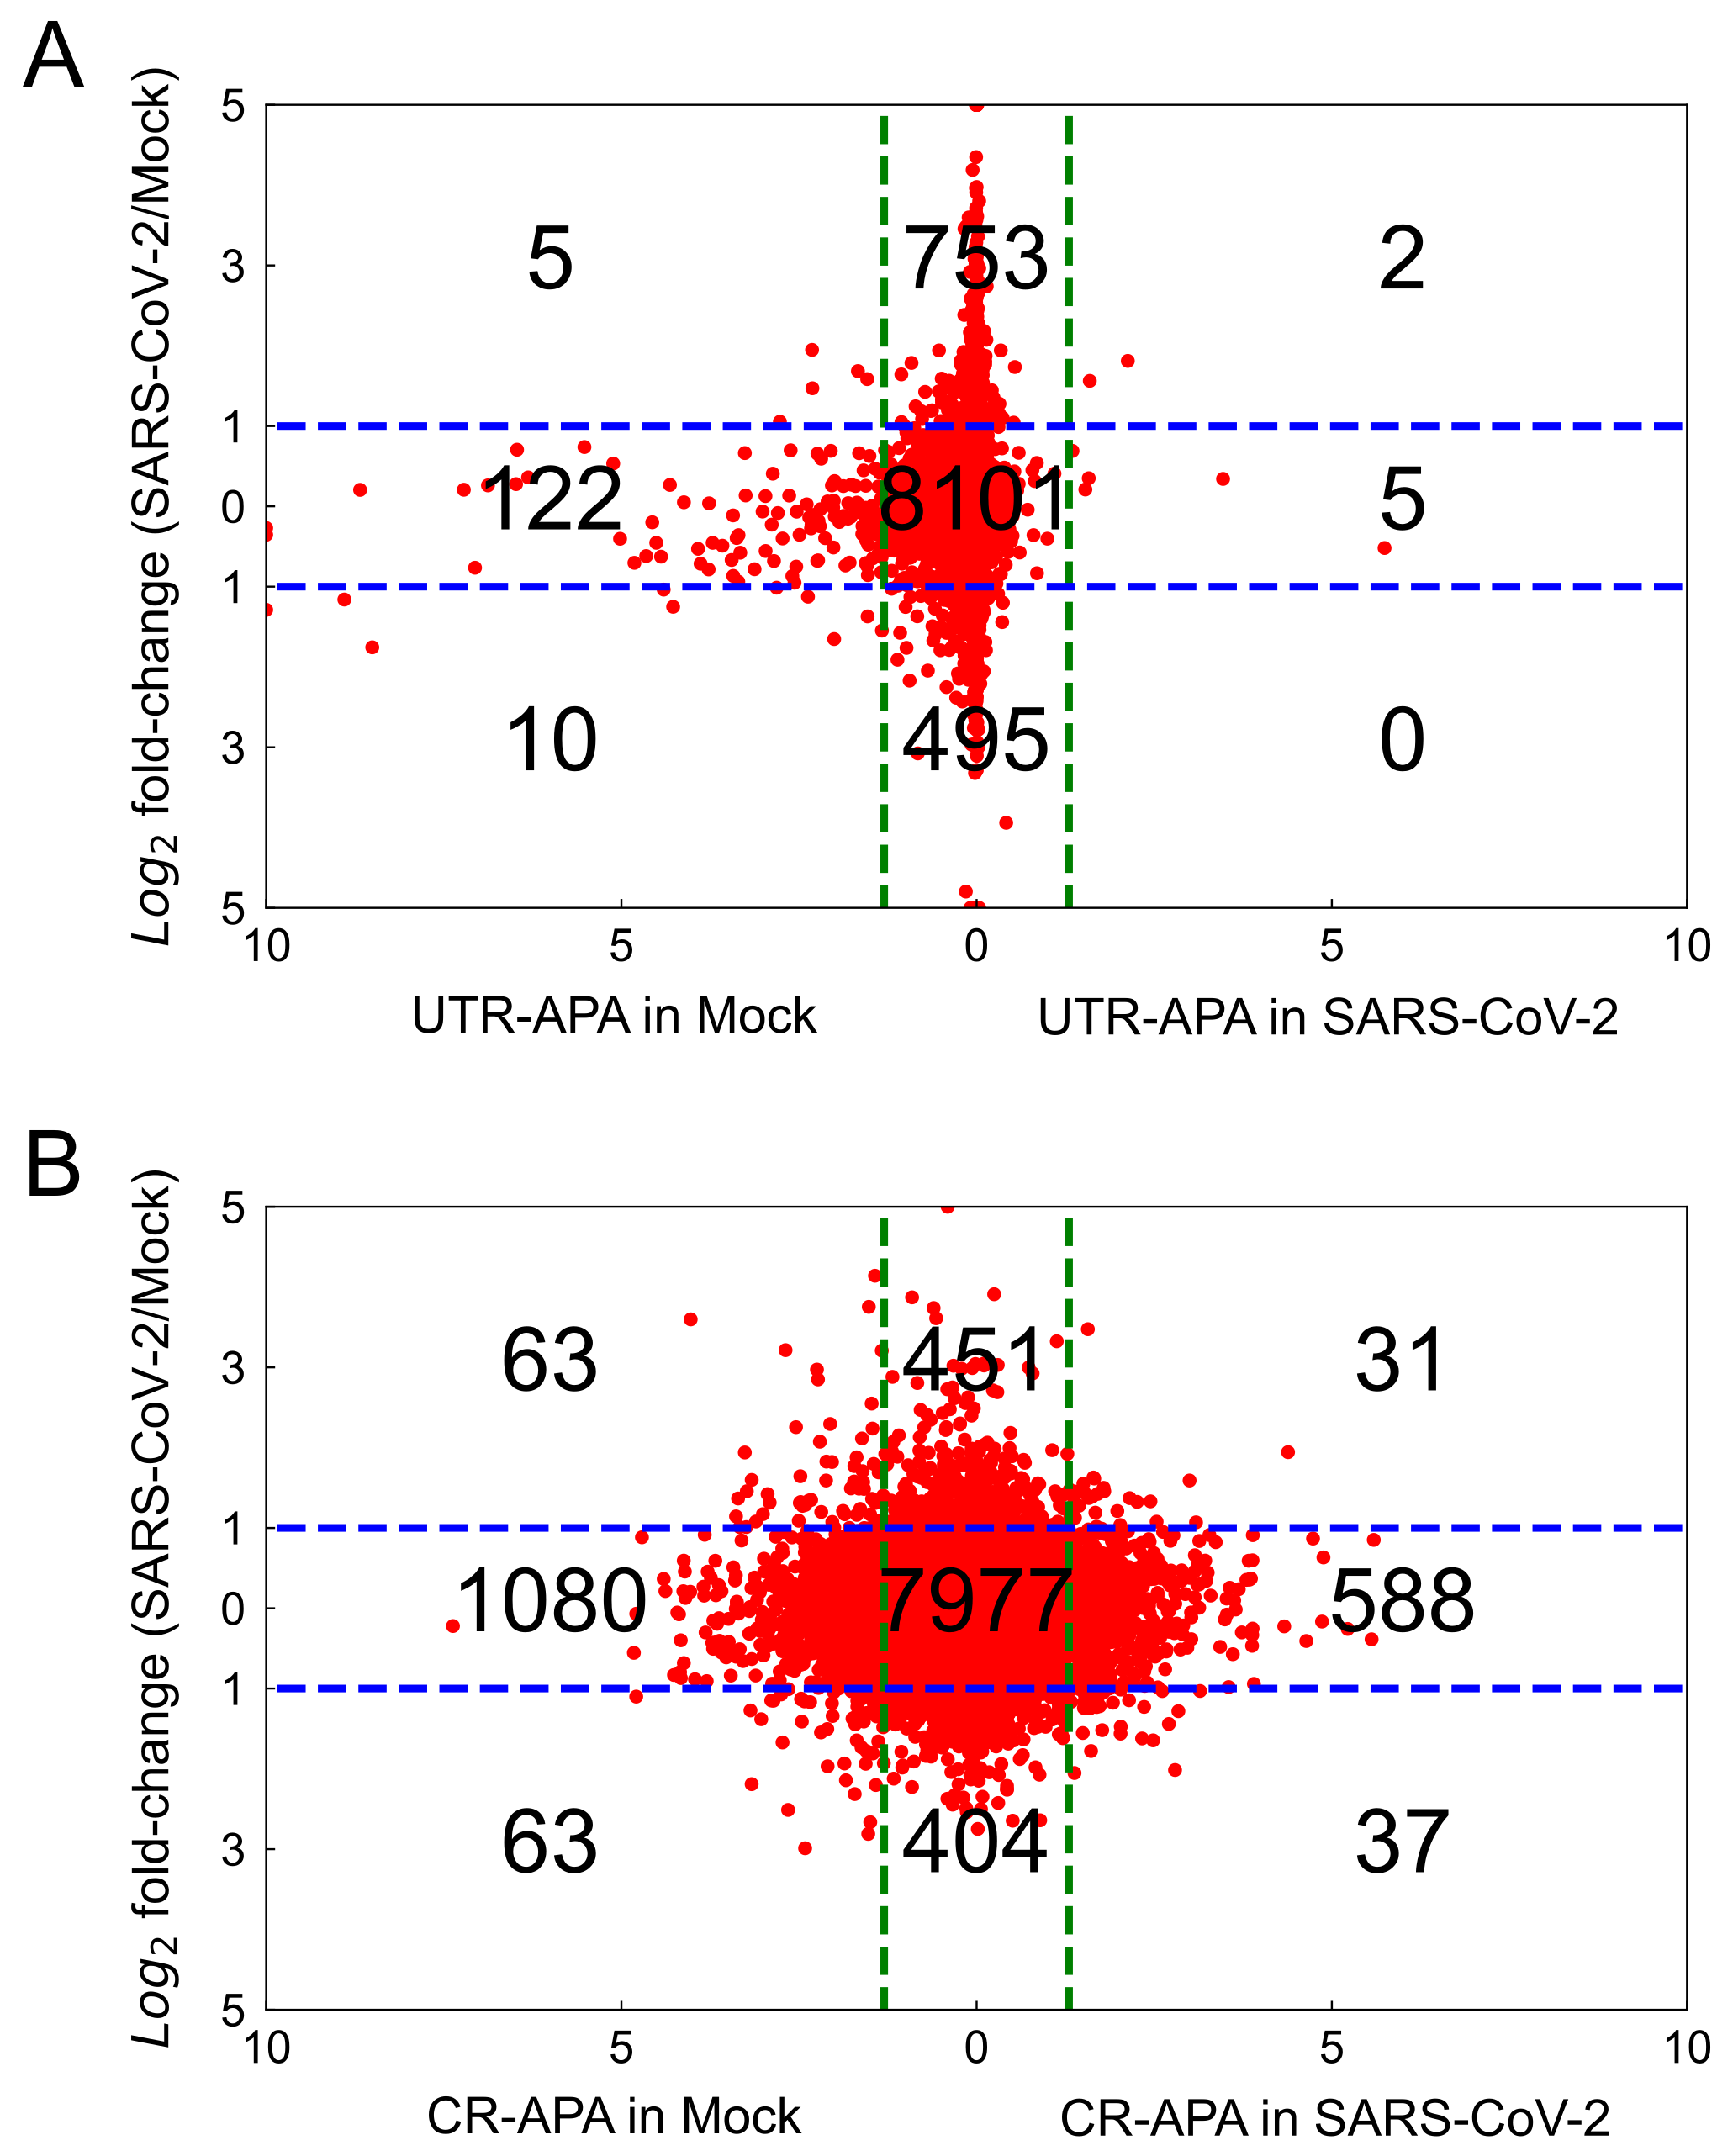
2.3. Alternative Polyadenylation
2.3.1. UTR-APA
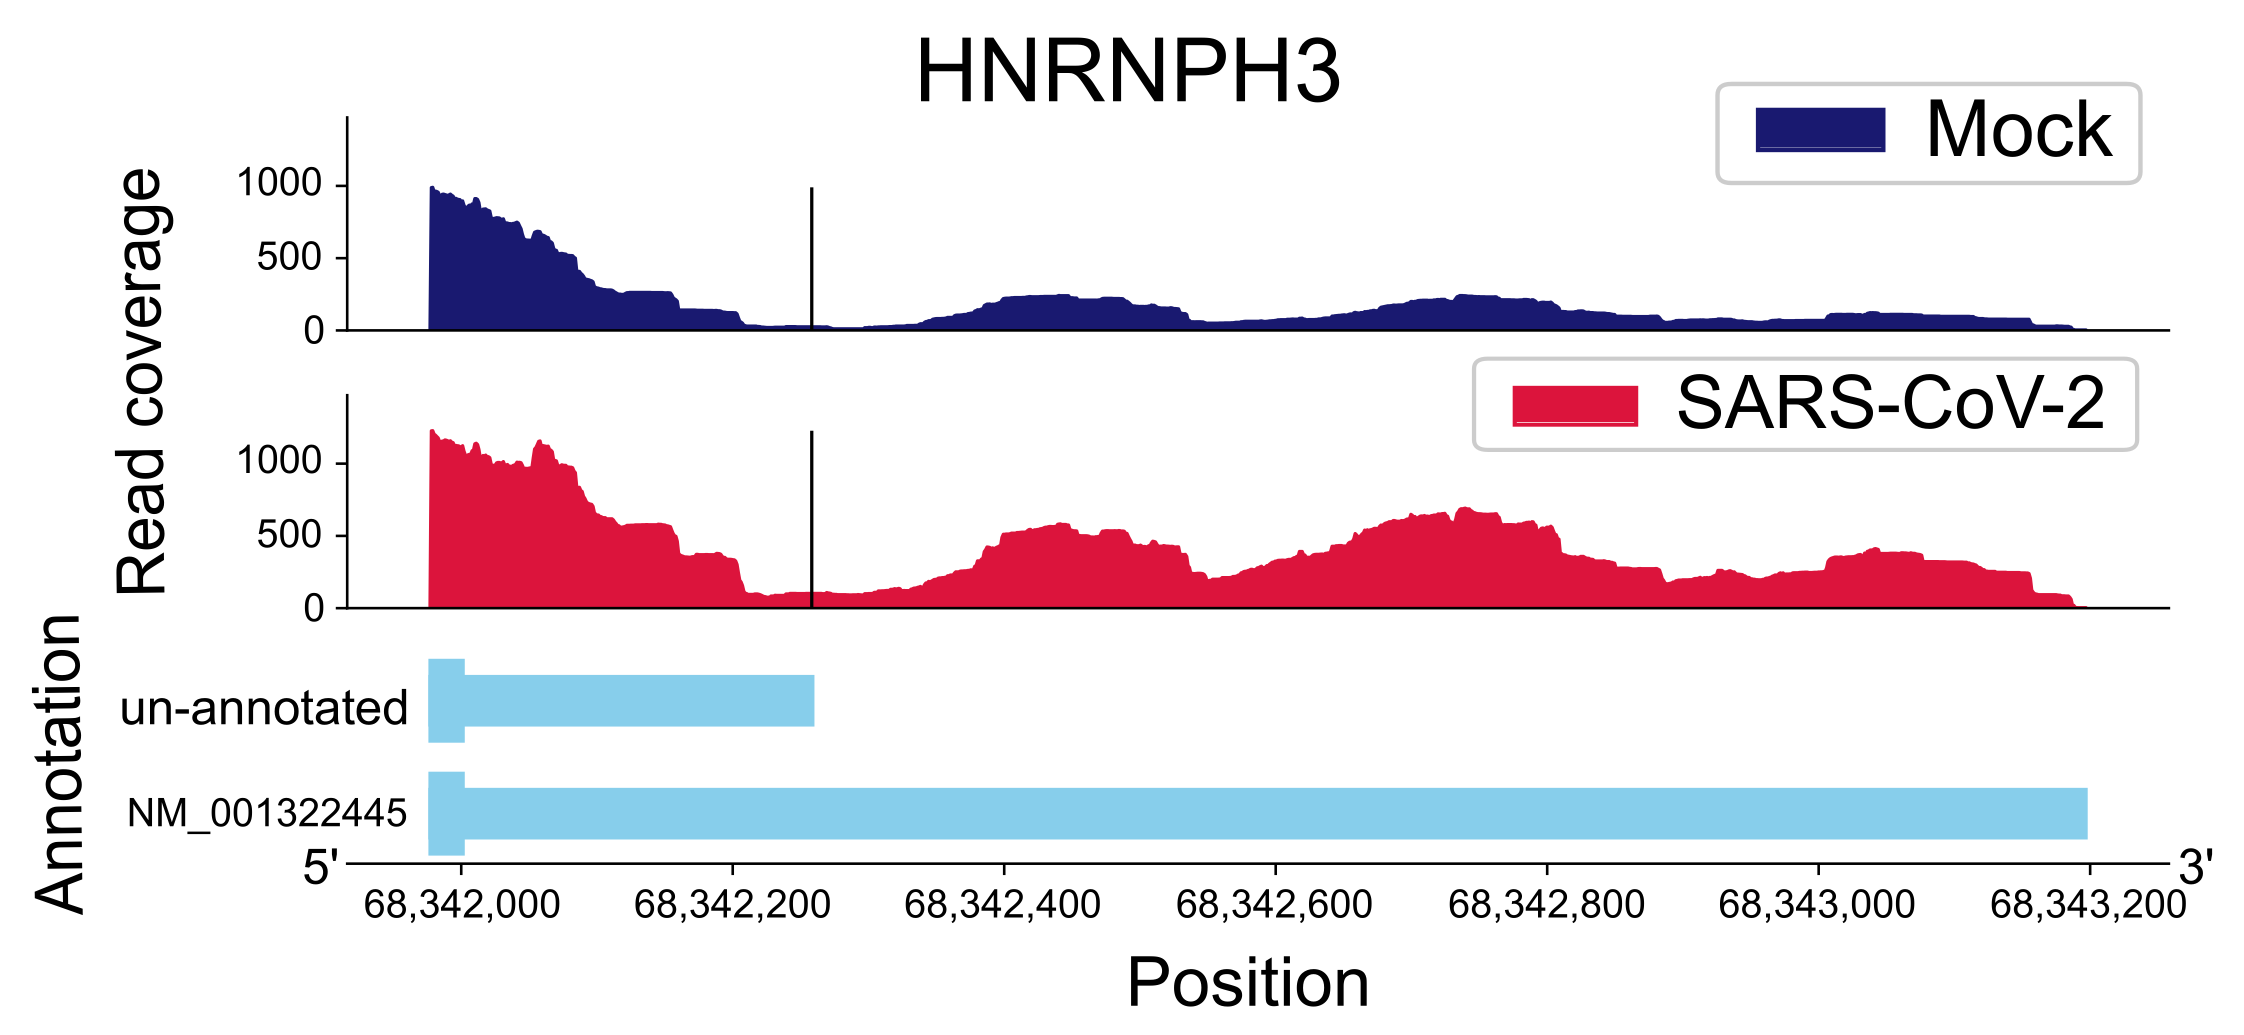
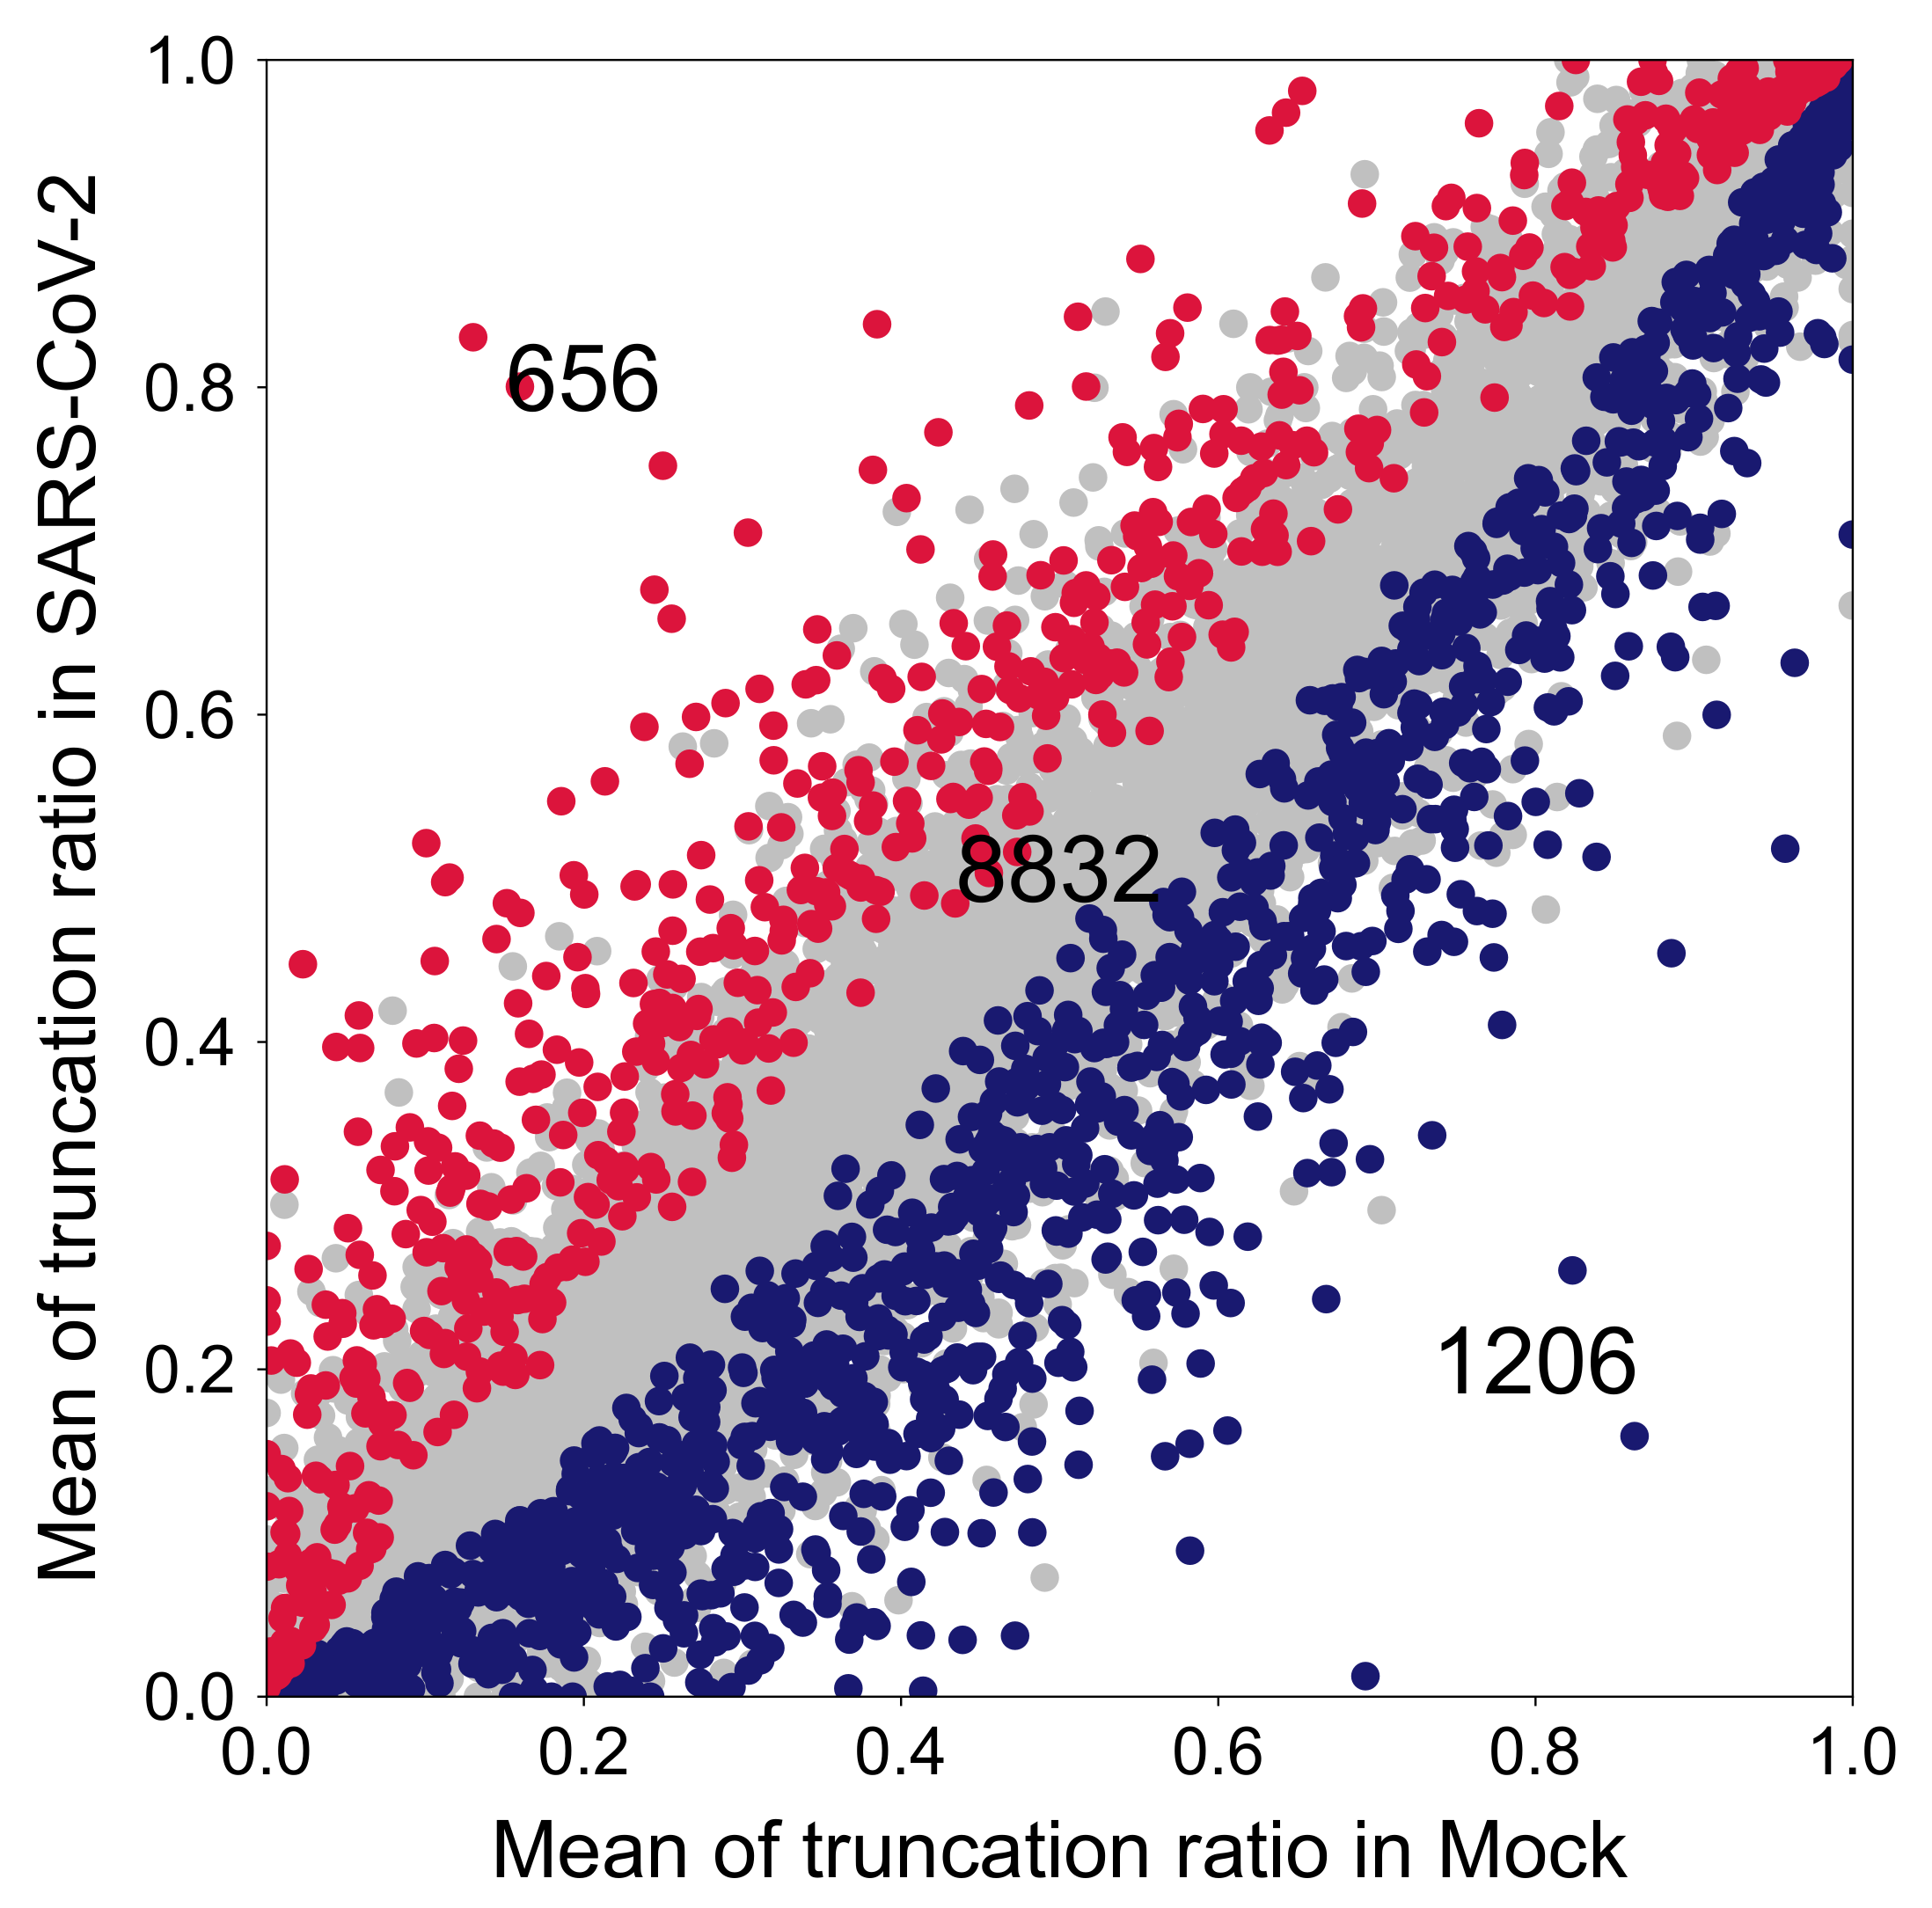
2.3.2. CR-APA
2.4. Differential Gene/Transcript Expression
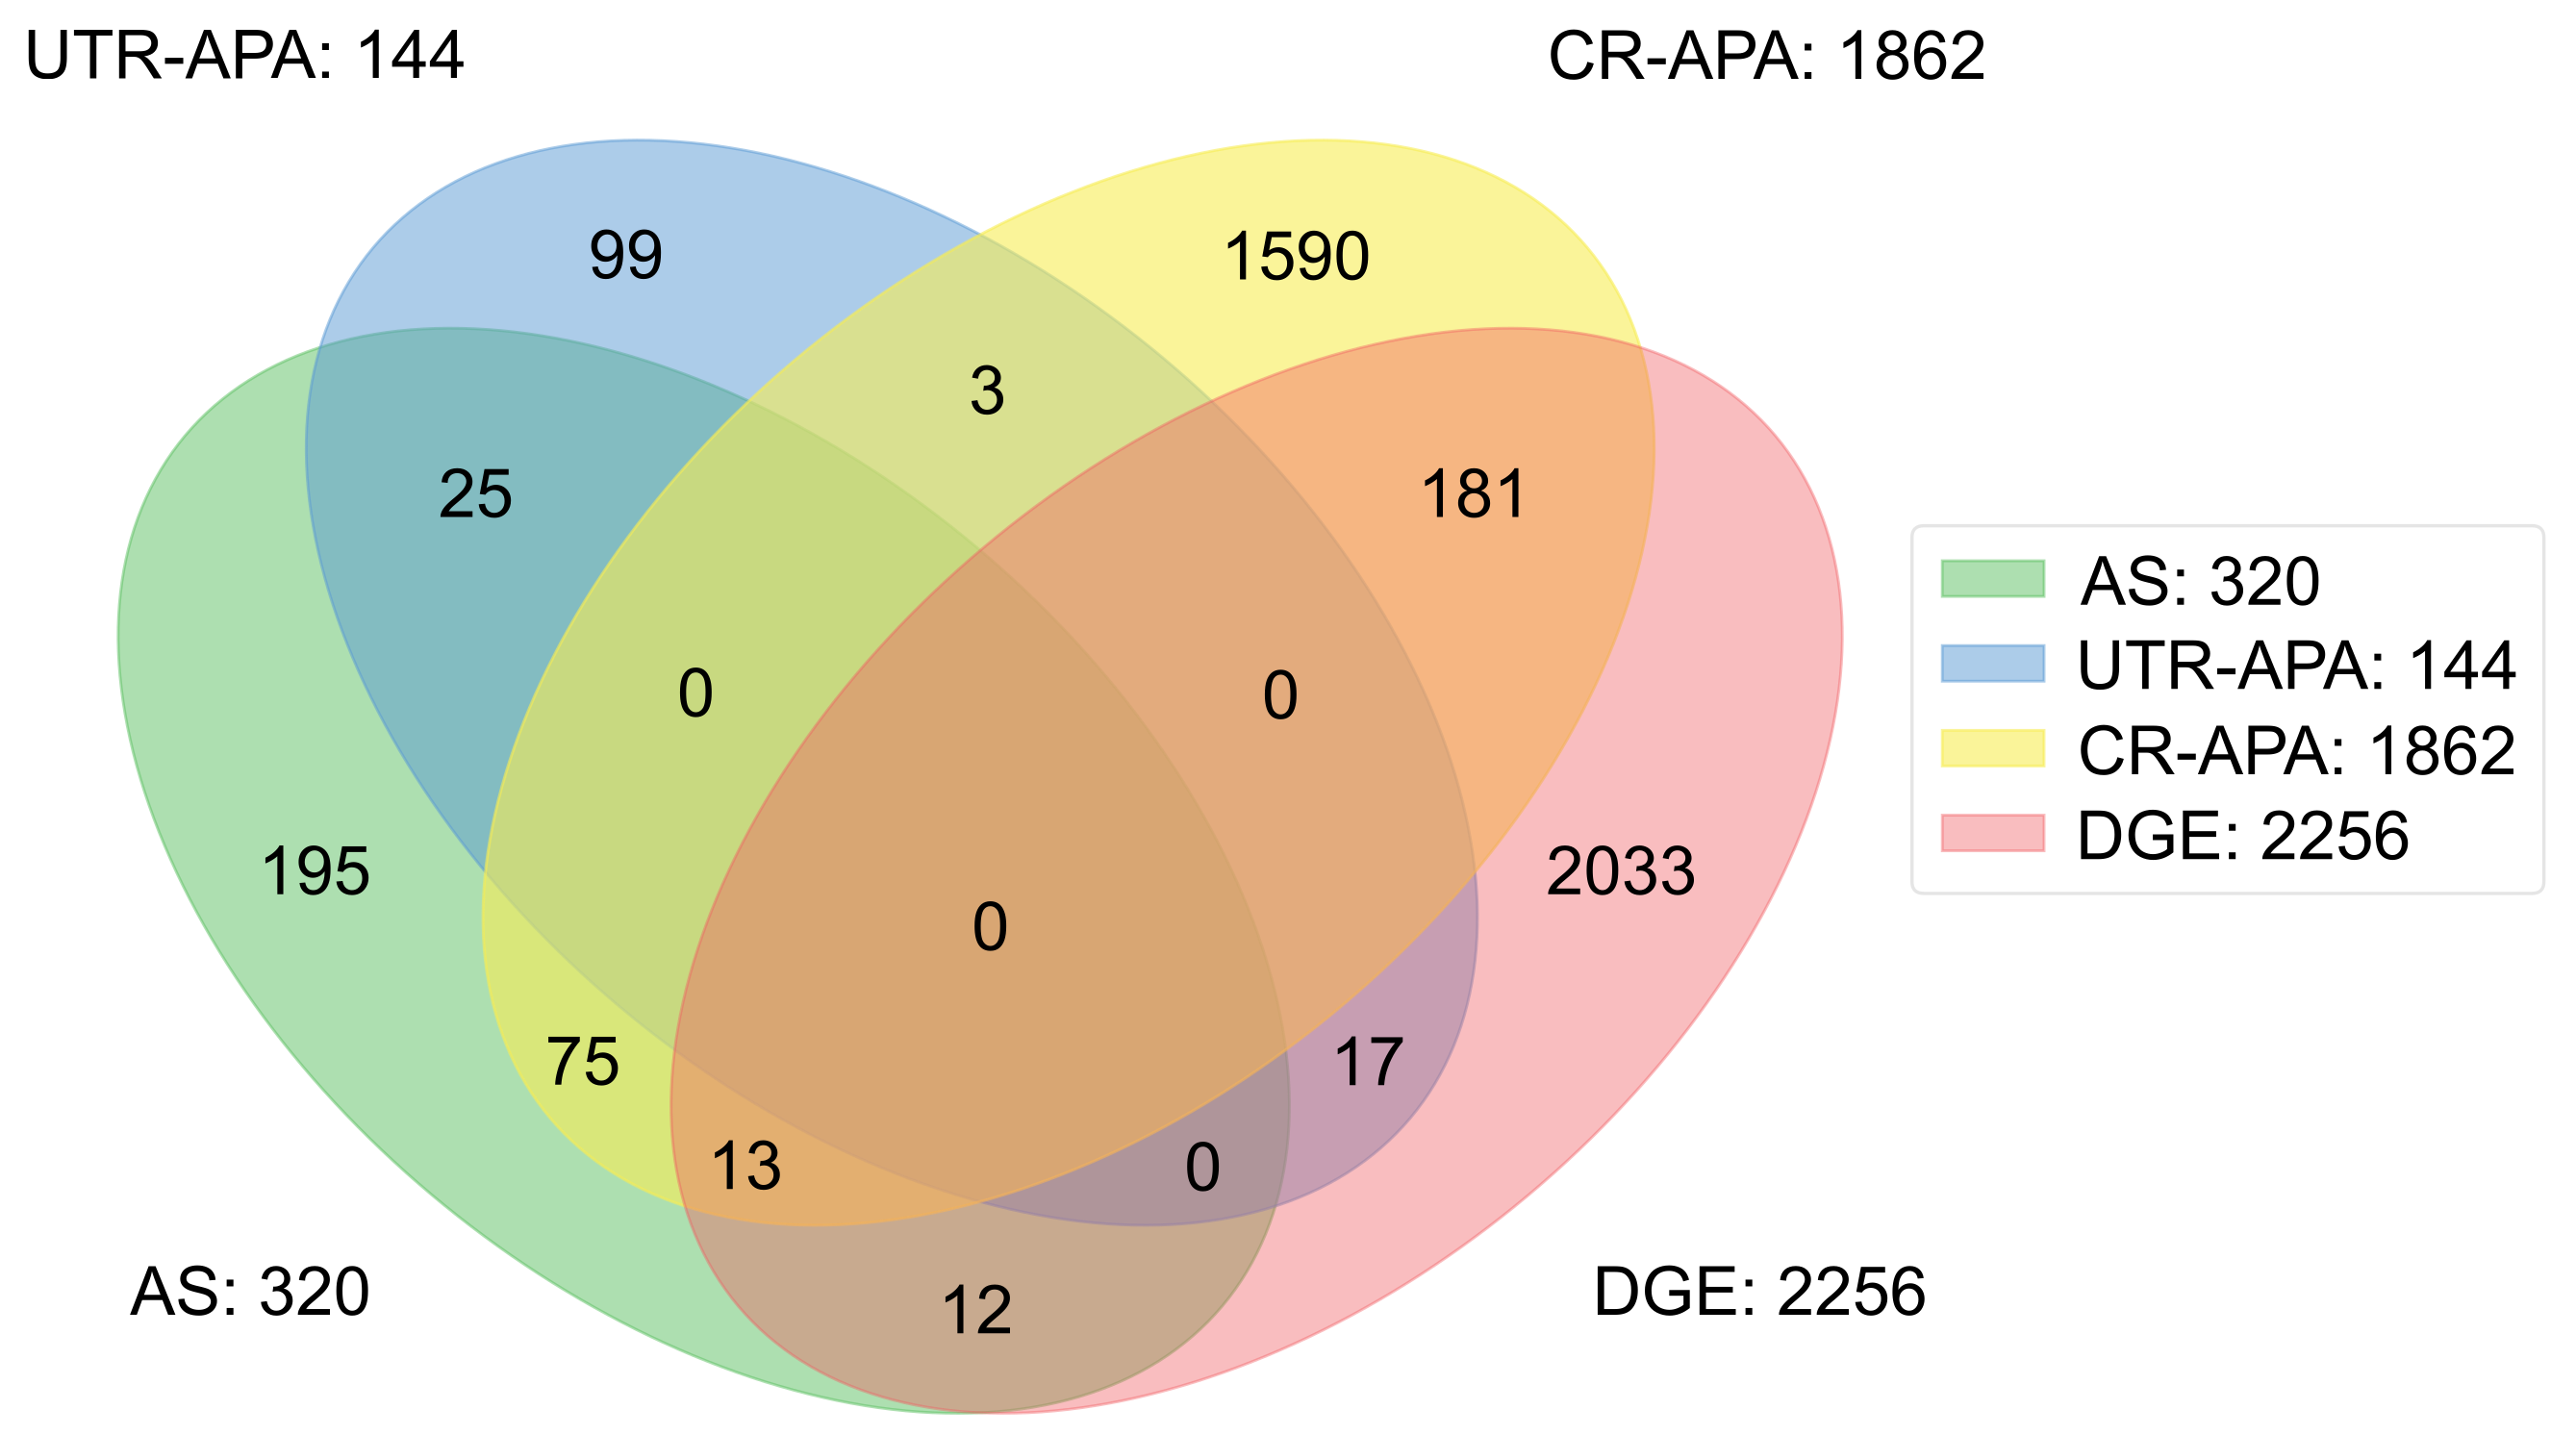
2.5. Comparison between Alternative Processing of Pre-mRNA and Differential Gene Expression
3. Discussion and Conclusions
4. Materials and Methods
4.1. Detection of Alternative Splicing Events
4.2. Detection of APA Events
4.2.1. UTR-APA
4.2.2. CR-APA
4.3. Differential Gene/Transcript Expressions
4.4. Enriched Pathway Analysis
Supplementary Materials
Author Contributions
Funding
Institutional Review Board Statement
Informed Consent Statement
Data Availability Statement
Conflicts of Interest
Abbreviations
| RT-PCR | Real-Time Polymerase Chain Reaction |
| CR-APA | Coding Region Alternative PolyAdenylation |
| UTR-APA | UnTranslated Region Alternative PolyAdenylation |
| AS-Quant | Alternative Splicing Quantitation |
| APA-Scan | Alternative Polyadenylation Scan |
| PAS | PolyAdenylation Signal |
| DEG | Differentially Expressed Genes |
| MAPK | Mitogen-Activated Protein Kinase |
| GEO | Gene Expression Omnibus |
| GO | Gene Ontology |
| KEGG | Kyoto Encyclopedia of Genes and Genomes |
References
- Blanco-Melo, D.; Nilsson-Payant, B.E.; Liu, W.C.; Uhl, S.; Hoagland, D.; Møller, R.; Jordan, T.X.; Oishi, K.; Panis, M.; Sachs, D.; et al. Imbalanced host response to SARS-CoV-2 drives development of COVID-19. Cell 2020, 181, 1036–1045.e9. [Google Scholar] [CrossRef]
- Sun, J.; Ye, F.; Wu, A.; Yang, R.; Pan, M.; Sheng, J.; Zhu, W.; Mao, L.; Wang, M.; Xia, Z.; et al. Comparative transcriptome analysis reveals the intensive early stage responses of host cells to SARS-CoV-2 infection. Front. Microbiol. 2020, 11, 2881. [Google Scholar] [CrossRef]
- Moni, M.A.; Quinn, J.M.; Sinmaz, N.; Summers, M.A. Gene expression profiling of SARS-CoV-2 infections reveal distinct primary lung cell and systemic immune infection responses that identify pathways relevant in COVID-19 disease. Brief. Bioinform. 2021, 22, 1324–1337. [Google Scholar] [CrossRef]
- Lieberman, N.A.; Peddu, V.; Xie, H.; Shrestha, L.; Huang, M.L.; Mears, M.C.; Cajimat, M.N.; Bente, D.A.; Shi, P.Y.; Bovier, F.; et al. In vivo antiviral host transcriptional response to SARS-CoV-2 by viral load, sex, and age. PLoS Biol. 2020, 18, e3000849. [Google Scholar] [CrossRef]
- Thompson, M.G.; Dittmar, M.; Mallory, M.J.; Bhat, P.; Ferretti, M.B.; Fontoura, B.M.; Cherry, S.; Lynch, K.W. Viral-induced alternative splicing of host genes promotes influenza replication. eLife 2020, 9, e55500. [Google Scholar] [CrossRef]
- Boudreault, S.; Roy, P.; Lemay, G.; Bisaillon, M. Viral modulation of cellular RNA alternative splicing: A new key player in virus–host interactions? Wiley Interdiscip. Rev. RNA 2019, 10, e1543. [Google Scholar] [CrossRef] [Green Version]
- Su, Z.; Huang, D. Alternative Splicing of Pre-mRNA in the Control of Immune Activity. Genes 2021, 12, 574. [Google Scholar] [CrossRef]
- Tsai, P.L.; Chiou, N.T.; Kuss, S.; García-Sastre, A.; Lynch, K.W.; Fontoura, B.M. Cellular RNA binding proteins NS1-BP and hnRNP K regulate influenza A virus RNA splicing. PLoS Pathog. 2013, 9, e1003460. [Google Scholar] [CrossRef] [PubMed]
- Kalam, H.; Singh, K.; Chauhan, K.; Fontana, M.F.; Kumar, D. Alternate splicing of transcripts upon Mycobacterium tuberculosis infection impacts the expression of functional protein domains. IUBMB Life 2018, 70, 845–854. [Google Scholar] [CrossRef] [PubMed] [Green Version]
- Banerjee, A.K.; Blanco, M.R.; Bruce, E.A.; Honson, D.D.; Chen, L.M.; Chow, A.; Bhat, P.; Ollikainen, N.; Quinodoz, S.A.; Loney, C.; et al. SARS-CoV-2 disrupts splicing, translation, and protein trafficking to suppress host defenses. Cell 2020, 183, 1325–1339. [Google Scholar] [CrossRef] [PubMed]
- Kim, D.; Pertea, G.; Trapnell, C.; Pimentel, H.; Kelley, R.; Salzberg, S.L. TopHat2: Accurate alignment of transcriptomes in the presence of insertions, deletions and gene fusions. Genome Biol. 2013, 14, R36. [Google Scholar] [CrossRef] [Green Version]
- Bray, N.L.; Pimentel, H.; Melsted, P.; Pachter, L. Near-optimal probabilistic RNA-seq quantification. Nat. Biotechnol. 2016, 34, 525–527. [Google Scholar] [CrossRef]
- Li, H.; Handsaker, B.; Wysoker, A.; Fennell, T.; Ruan, J.; Homer, N.; Marth, G.; Abecasis, G.; Durbin, R. The sequence alignment/map format and SAMtools. Bioinformatics 2009, 25, 2078–2079. [Google Scholar] [CrossRef] [PubMed] [Green Version]
- Huang, D.W.; Sherman, B.T.; Lempicki, R.A. Bioinformatics enrichment tools: Paths toward the comprehensive functional analysis of large gene lists. Nucleic Acids Res. 2009, 37, 1–13. [Google Scholar] [CrossRef] [Green Version]
- Li, Q.; Wang, L.; Dong, C.; Che, Y.; Jiang, L.; Liu, L.; Zhao, H.; Liao, Y.; Sheng, Y.; Dong, S.; et al. The interaction of the SARS coronavirus non-structural protein 10 with the cellular oxido-reductase system causes an extensive cytopathic effect. J. Clin. Virol. 2005, 34, 133–139. [Google Scholar] [CrossRef]
- Carbajo-Lozoya, J.; Müller, M.A.; Kallies, S.; Thiel, V.; Drosten, C.; Von Brunn, A. Replication of human coronaviruses SARS-CoV, HCoV-NL63 and HCoV-229E is inhibited by the drug FK506. Virus Res. 2012, 165, 112–117. [Google Scholar] [CrossRef]
- Wang, J.; Shi, C.; Xu, Q.; Yin, H. SARS-CoV-2 nucleocapsid protein undergoes liquid–liquid phase separation into stress granules through its N-terminal intrinsically disordered region. Cell Discov. 2021, 7, 1–5. [Google Scholar] [CrossRef]
- Fang, Y.T.; Lin, C.F.; Liao, P.C.; Kuo, Y.M.; Wang, S.; Yeh, T.M.; Shieh, C.C.K.; Su, I.J.; Lei, H.Y.; Lin, Y.S. Annexin A2 on lung epithelial cell surface is recognized by severe acute respiratory syndrome-associated coronavirus spike domain 2 antibodies. Mol. Immunol. 2010, 47, 1000–1009. [Google Scholar] [CrossRef]
- Szczepanski, A.; Owczarek, K.; Milewska, A.; Baster, Z.; Rajfur, Z.; Mitchell, J.A.; Pyrc, K. Canine respiratory coronavirus employs caveolin-1-mediated pathway for internalization to HRT-18G cells. Vet. Res. 2018, 49, 1–14. [Google Scholar] [CrossRef] [Green Version]
- Riad, A.; Aubert, Y.; Zeng, C.; Graham, T.J.; Petersson, E.J.; Capell, B.C.; Mach, R.H. Differential gene expression by RNA-Seq in Sigma-2 Receptor/TMEM97 knockout cells reveals its role in complement activation and SARS-CoV-2 viral uptake. bioRxiv 2021. [Google Scholar] [CrossRef]
- Korkmaz, B.; Lesner, A.; Marchand-Adam, S.; Moss, C.; Jenne, D.E. Lung Protection by Cathepsin C Inhibition: A New Hope for COVID-19 and ARDS? Miniperspective. J. Med. Chem. 2020, 63, 13258–13265. [Google Scholar] [CrossRef]
- Abedi, F.; Rezaee, R.; Karimi, G. Plausibility of therapeutic effects of Rho kinase inhibitors against Severe Acute Respiratory Syndrome Coronavirus 2 (COVID-19). Pharmacol. Res. 2020, 156, 104808. [Google Scholar] [CrossRef] [PubMed]
- Fukushi, M.; Yoshinaka, Y.; Matsuoka, Y.; Hatakeyama, S.; Ishizaka, Y.; Kirikae, T.; Sasazuki, T.; Miyoshi-Akiyama, T. Monitoring of S protein maturation in the endoplasmic reticulum by calnexin is important for the infectivity of severe acute respiratory syndrome coronavirus. J. Virol. 2012, 86, 11745–11753. [Google Scholar] [CrossRef] [Green Version]
- Inde, Z.; Yapp, C.; Joshi, G.N.; Spetz, J.; Fraser, C.; Deskin, B.; Ghelfi, E.; Sodhi, C.; Hackam, D.J.; Kobzik, L.; et al. Age-dependent regulation of SARS-CoV-2 cell entry genes and cell death programs correlates with COVID-19 disease severity. bioRxiv 2020. [Google Scholar] [CrossRef]
- Gassen, N.C.; Niemeyer, D.; Muth, D.; Corman, V.M.; Martinelli, S.; Gassen, A.; Hafner, K.; Papies, J.; Mösbauer, K.; Zellner, A.; et al. SKP2 attenuates autophagy through Beclin1-ubiquitination and its inhibition reduces MERS-Coronavirus infection. Nat. Commun. 2019, 10, 1–16. [Google Scholar]
- Fahmi, N.A.; Nassereddeen, H.; Chang, J.; Park, M.; Yeh, H.; Sun, J.; Fan, D.; Yong, J.; Zhang, W. As-quant: Detection and visualization of alternative splicing events with rna-seq data. Int. J. Mol. Sci. 2021, 22, 4468. [Google Scholar] [CrossRef]
- Fahmi, N.A.; Chang, J.W.; Nassereddeen, H.; Ahmed, K.T.; Fan, D.; Yong, J.; Zhang, W. APA-Scan: Detection and Visualization of 3’-UTR APA with RNA-seq and 3’-end-seq Data. bioRxiv 2020. [Google Scholar] [CrossRef] [Green Version]
- O’Leary, N.A.; Wright, M.W.; Brister, J.R.; Ciufo, S.; Haddad, D.; McVeigh, R.; Rajput, B.; Robbertse, B.; Smith-White, B.; Ako-Adjei, D.; et al. Reference sequence (RefSeq) database at NCBI: Current status, taxonomic expansion, and functional annotation. Nucleic Acids Res. 2016, 44, D733–D745. [Google Scholar] [CrossRef] [Green Version]
- Rosenbloom, K.R.; Sloan, C.A.; Malladi, V.S.; Dreszer, T.R.; Learned, K.; Kirkup, V.M.; Wong, M.C.; Maddren, M.; Fang, R.; Heitner, S.G.; et al. ENCODE data in the UCSC Genome Browser: Year 5 update. Nucleic Acids Res. 2012, 41, D56–D63. [Google Scholar] [CrossRef] [PubMed]
- Cloonan, S.M.; Choi, A.M. Mitochondria in lung disease. J. Clin. Investig. 2016, 126, 809–820. [Google Scholar] [CrossRef] [Green Version]
- Shiozawa, Y.; Malcovati, L.; Gallì, A.; Sato-Otsubo, A.; Kataoka, K.; Sato, Y.; Watatani, Y.; Suzuki, H.; Yoshizato, T.; Yoshida, K.; et al. Aberrant splicing and defective mRNA production induced by somatic spliceosome mutations in myelodysplasia. Nat. Commun. 2018, 9, 1–16. [Google Scholar] [CrossRef]
- Sheng, W.H.; Chiang, B.L.; Chang, S.C.; Ho, H.N.; Wang, J.T.; Chen, Y.C.; Hsiao, C.H.; Hseuh, P.R.; Chie, W.C.; Yang, P.C. Clinical manifestations and inflammatory cytokine responses in patients with severe acute respiratory syndrome. J. Formos. Med Assoc. 2005, 104, 715–723. [Google Scholar] [PubMed]
- Yu, S.Y.; Hu, Y.W.; Liu, X.Y.; Xiong, W.; Zhou, Z.T.; Yuan, Z.H. Gene expression profiles in peripheral blood mononuclear cells of SARS patients. World J. Gastroenterol. WJG 2005, 11, 5037. [Google Scholar] [CrossRef] [PubMed]
- Zhang, Y.; Li, J.; Zhan, Y.; Wu, L.; Yu, X.; Zhang, W.; Ye, L.; Xu, S.; Sun, R.; Wang, Y.; et al. Analysis of serum cytokines in patients with severe acute respiratory syndrome. Infect. Immun. 2004, 72, 4410–4415. [Google Scholar] [CrossRef] [PubMed] [Green Version]
- Ahmed, K.; Sun, J.; Chen, W.; Martinez, I.; Cheng, S.; Zhang, W.; Yong, J. In silico model for miRNA-mediated regulatory network in cancer. Brief. Bioinform. 2021. [Google Scholar] [CrossRef] [PubMed]
- Bouhaddou, M.; Memon, D.; Meyer, B.; White, K.M.; Rezelj, V.V.; Marrero, M.C.; Polacco, B.J.; Melnyk, J.E.; Ulferts, S.; Kaake, R.M.; et al. The global phosphorylation landscape of SARS-CoV-2 infection. Cell 2020, 182, 685–712. [Google Scholar] [CrossRef] [PubMed]
- Stukalov, A.; Girault, V.; Grass, V.; Karayel, O.; Bergant, V.; Urban, C.; Haas, D.A.; Huang, Y.; Oubraham, L.; Wang, A.; et al. Multilevel proteomics reveals host perturbations by SARS-CoV-2 and SARS-CoV. Nature 2021, 594, 246–252. [Google Scholar] [CrossRef] [PubMed]
- Fujita, P.A.; Rhead, B.; Zweig, A.S.; Hinrichs, A.S.; Karolchik, D.; Cline, M.S.; Goldman, M.; Barber, G.P.; Clawson, H.; Coelho, A.; et al. The UCSC genome browser database: Update 2011. Nucleic Acids Res. 2010, 39, D876–D882. [Google Scholar] [CrossRef] [Green Version]
- Huang, D.W.; Sherman, B.T.; Lempicki, R.A. Systematic and integrative analysis of large gene lists using DAVID bioinformatics resources. Nat. Protoc. 2009, 4, 44. [Google Scholar] [CrossRef]


| Sample | SE | RI | MXE | A3SS | A5SS |
|---|---|---|---|---|---|
| Mock | 51 | 16 | 7 | 13 | 6 |
| SARS-CoV-2 | 126 | 30 | 19 | 59 | 100 |
| Gene Name | Chr | Start | End | p-Value | FDR | Ratio Difference |
|---|---|---|---|---|---|---|
| TPT1 | chr13 | 45,914,846 | 45,914,920 | 5.81 × 10 | 7.5 × 10 | −0.074 |
| C6ORF48 | chr6 | 3,118,955 | 3,119,049 | 9.21 × 10 | 5.94 × 10 | −0.113 |
| FKBP1A | chr20 | 1,373,477 | 1,373,525 | 2.25 × 10 | 9.67 × 10 | −0.168 |
| PPIA | chr7 | 44,838,346 | 44,838,413 | 1.63 × 10 | 5.25 × 10 | 0.149 |
| HNRNPA1 | chr12 | 54,676,862 | 54,677,018 | 1.26 × 10 | 3.26 × 10 | −0.248 |
| RPS24 | chr10 | 79,799,961 | 79,799,983 | 5.25 × 10 | 1.13 × 10 | 0.122 |
| RPS9 | chr19 | 54,710,420 | 54,710,592 | 4.59 × 10 | 8.46 × 10 | 0.117 |
| SRSF2 | chr17 | 74,731,853 | 74,731,957 | 1.24 × 10 | 1.78 × 10 | 0.172 |
| CA12 | chr15 | 63,638,728 | 63,638,908 | 1.66 × 10 | 1.99 × 10 | −0.103 |
| RPLP1 | chr15 | 69,745,985 | 69,746,060 | 1.69 × 10 | 1.99 × 10 | 0.040 |
| Category | Gene | Ref. | Description |
|---|---|---|---|
| Alternative Splicing | BTF3 | [15] | Interacts with the NSP10 CoV protein, which is involved in the pathological function of SARS-CoV in cells. |
| FKBP1A | [16] | FKBP1A causes immunosuppression and is required by CoV for viral growth. | |
| G3BP1 | [17] | SARS-CoV-2 N protein undergoes liquid–liquid phase separation, which serves as a scaffold for virus replication and assembly, through its N-terminal intrinsically disordered region (IDR) with G3BP1. | |
| UTR-APA | ANXA2 | [18] | The upregulation of expression of annexin A2 (ANXA2) by SARS-associated cytokines and the cross-reactivity of anti-SARS-CoV S2 antibodies to annexin A2 may have implications in SARS disease pathogenesis. |
| CAV1 | [19] | Coronaviruses enter cells via the CAV1 dependent pathway. | |
| TMEM97 | [20] | TMEM97 forms a complex with ACE2 and modulates its ability to internalize the SARS-CoV-2. | |
| CR-APA | CTSC | [21] | CTSC activates the elastase-related neutrophil proteases mediated tissue degradation in which it diffuses the alveolar inflammation in acute respiratory distress syndrome. |
| RHOA | [22] | Activation of RhoA GTPase and its downstream effector, Rho kinase (ROCK), contributes to a burst in inflammatory features, immune cell migration, apoptosis, coagulation, contraction, and cell adhesion in pulmonary endothelial cells, leading to endothelium barrier dysfunction and edema as hallmarks of lung injury. | |
| CANX | [23] | Calnexin (CANX) strictly monitors the maturation of the CoV S protein by its direct binding. | |
| Differential Expression | BCL2A1 | [24] | Pro-survival gene mostly present in adult genes, if downregulated, promotes apoptosis in lung tissue. |
| SKP2 | [25] | SKP2 attenuates autophagy through Beclin1-ubiquitination and allowing for the replication of coronaviruses. |
| Gene Name | Chr | Position | p-Value | FDR | Ratio Difference |
|---|---|---|---|---|---|
| ACTN4 | chr19 | 38,730,184 | 6.07 × 10 | 5.71 × 10 | 0.144 |
| ALDH1A1 | chr9 | 72,900,986 | 1.34 × 10 | 6.30 × 10 | 0.054 |
| S100A6 | chr1 | 153,534,690 | 2.73 × 10 | 8.56 × 10 | 0.045 |
| HNRNPA2B1 | chr7 | 26,191,861 | 1.26 × 10 | 2.96 × 10 | 0.088 |
| PMEPA1 | chr20 | 57,651,579 | 2.10 × 10 | 3.95 × 10 | 0.153 |
| ACAT2 | chr6 | 159,779,033 | 3.11 × 10 | 4.88 × 10 | 0.273 |
| ARL4C | chr2 | 234,495,151 | 6.05 × 10 | 8.14 × 10 | 0.231 |
| H3F3A | chr1 | 226,071,775 | 8.70 × 10 | 1.02 × 10 | 0.189 |
| RPL15 | chr3 | 23,919,537 | 1.32 × 10 | 1.38 × 10 | 0.041 |
| MYH9 | chr22 | 36,281,660 | 3.29 × 10 | 2.91 × 10 | 0.177 |
| Gene | Chr | Truncated Position | p-Value | FDR | Ratio Difference |
|---|---|---|---|---|---|
| GLRX5 | chr14 | 95,544,557 | 2.76 × 10 | 6.12 × 10 | 0.361 |
| UBXN6 | chr19 | 4,445,009 | 5.98 × 10 | 1.14 × 10 | 0.020 |
| SLC3A2 | chr11 | 62,881,290 | 1.31 × 10 | 2.16 × 10 | 0.256 |
| ARIH2 | chr3 | 48,928,674 | 1.37 × 10 | 1.18 × 10 | 0.071 |
| DVL3 | chr3 | 184,164,517 | 1.50 × 10 | 2.16 × 10 | −0.269 |
| DEF8 | chr16 | 89,959,366 | 1.62 × 10 | 1.18 × 10 | −0.232 |
| SIAH2 | chr3 | 150,742,487 | 1.62 × 10 | 2.16 × 10 | −0.362 |
| SNHG7 | chr9 | 136,724,659 | 1.84 × 10 | 2.16 × 10 | 0.020 |
| LTBP2 | chr14 | 74,506,705 | 1.94 × 10 | 2.16 × 10 | −0.248 |
| S100A16 | chr1 | 153,606,974 | 2.29 × 10 | 2.35 × 10 | 0.200 |
Publisher’s Note: MDPI stays neutral with regard to jurisdictional claims in published maps and institutional affiliations. |
© 2021 by the authors. Licensee MDPI, Basel, Switzerland. This article is an open access article distributed under the terms and conditions of the Creative Commons Attribution (CC BY) license (https://creativecommons.org/licenses/by/4.0/).
Share and Cite
Sun, J.; Fahmi, N.A.; Nassereddeen, H.; Cheng, S.; Martinez, I.; Fan, D.; Yong, J.; Zhang, W. Computational Methods to Study Human Transcript Variants in COVID-19 Infected Lung Cancer Cells. Int. J. Mol. Sci. 2021, 22, 9684. https://doi.org/10.3390/ijms22189684
Sun J, Fahmi NA, Nassereddeen H, Cheng S, Martinez I, Fan D, Yong J, Zhang W. Computational Methods to Study Human Transcript Variants in COVID-19 Infected Lung Cancer Cells. International Journal of Molecular Sciences. 2021; 22(18):9684. https://doi.org/10.3390/ijms22189684
Chicago/Turabian StyleSun, Jiao, Naima Ahmed Fahmi, Heba Nassereddeen, Sze Cheng, Irene Martinez, Deliang Fan, Jeongsik Yong, and Wei Zhang. 2021. "Computational Methods to Study Human Transcript Variants in COVID-19 Infected Lung Cancer Cells" International Journal of Molecular Sciences 22, no. 18: 9684. https://doi.org/10.3390/ijms22189684
APA StyleSun, J., Fahmi, N. A., Nassereddeen, H., Cheng, S., Martinez, I., Fan, D., Yong, J., & Zhang, W. (2021). Computational Methods to Study Human Transcript Variants in COVID-19 Infected Lung Cancer Cells. International Journal of Molecular Sciences, 22(18), 9684. https://doi.org/10.3390/ijms22189684