
SARS-CoV-2 Impairs Dendritic Cells and Regulates DC-SIGN Gene Expression in Tissues

 , , , , ,
  , , and
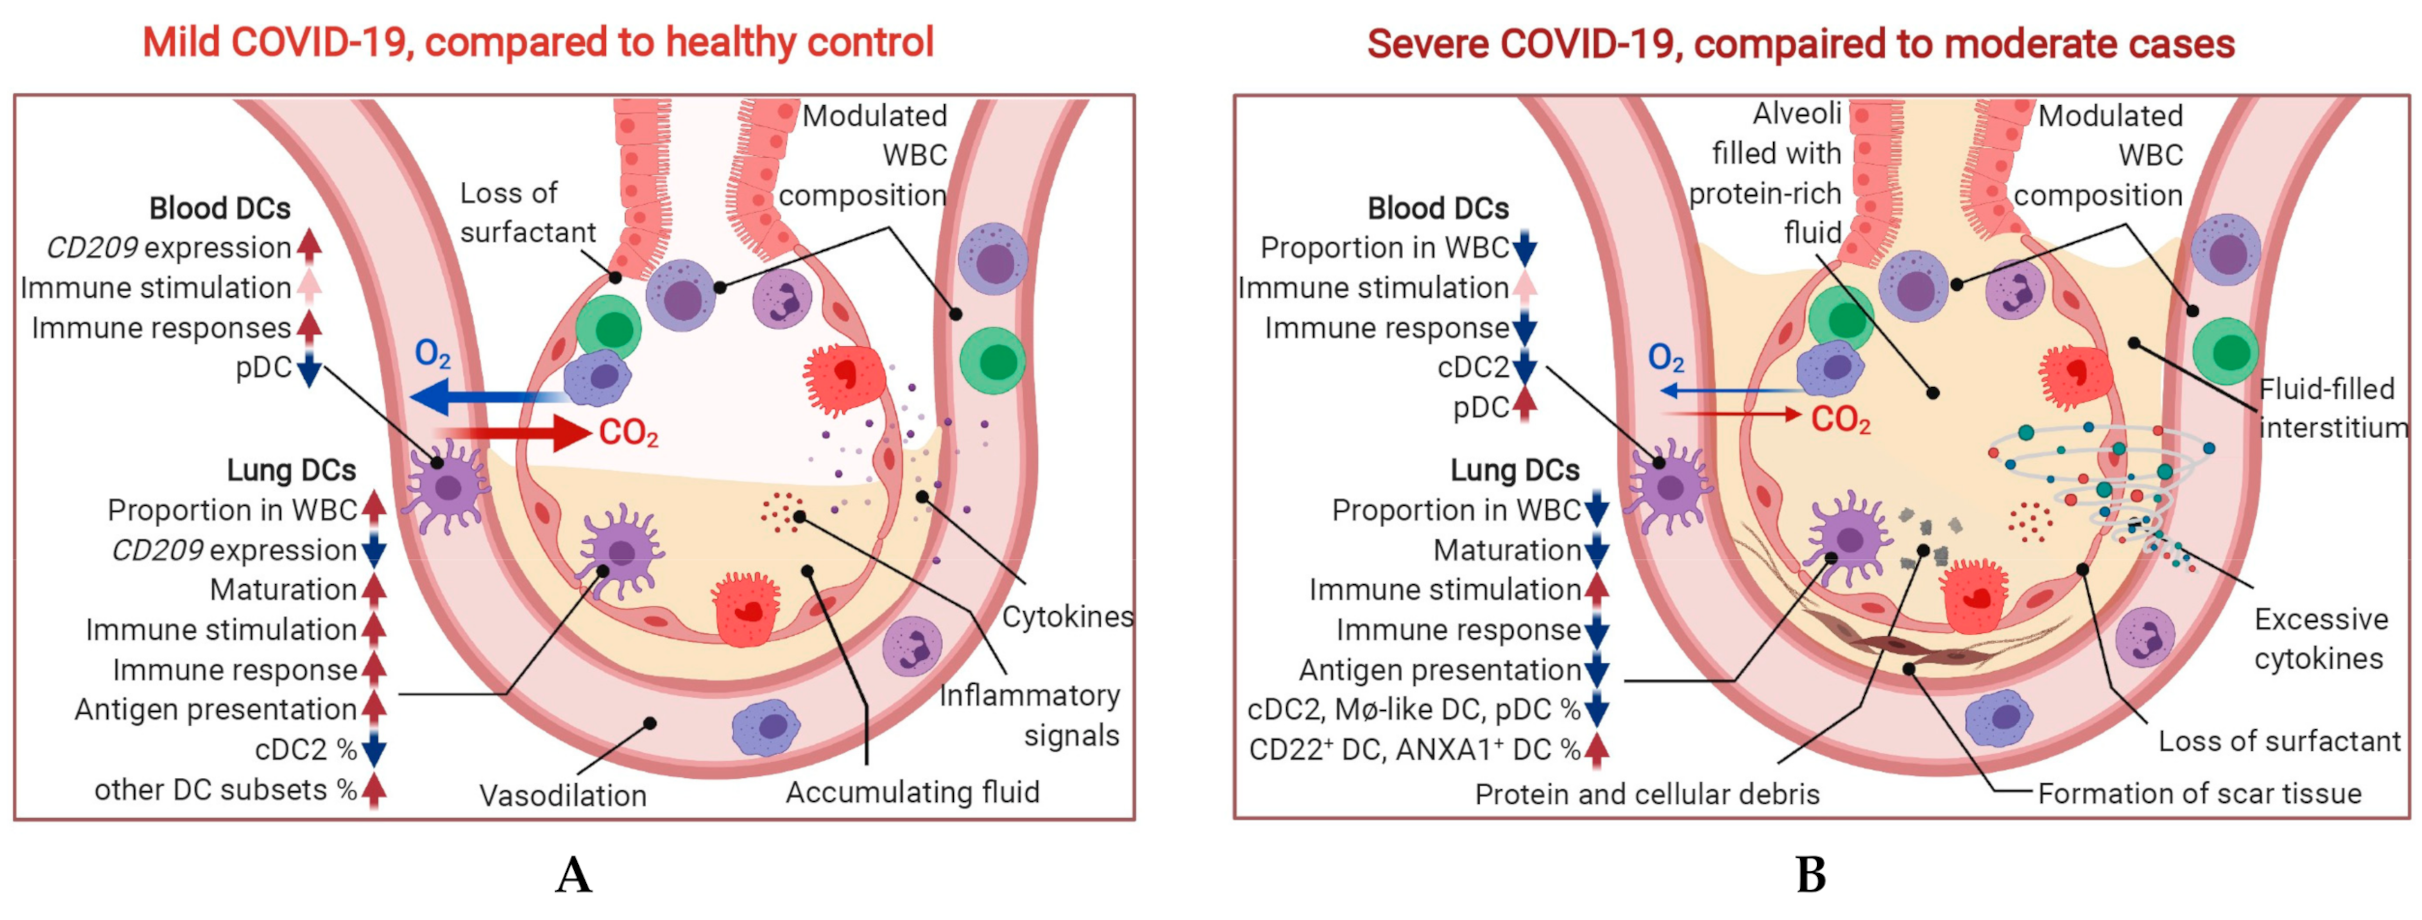
Abstract
1. Introduction
2. Results
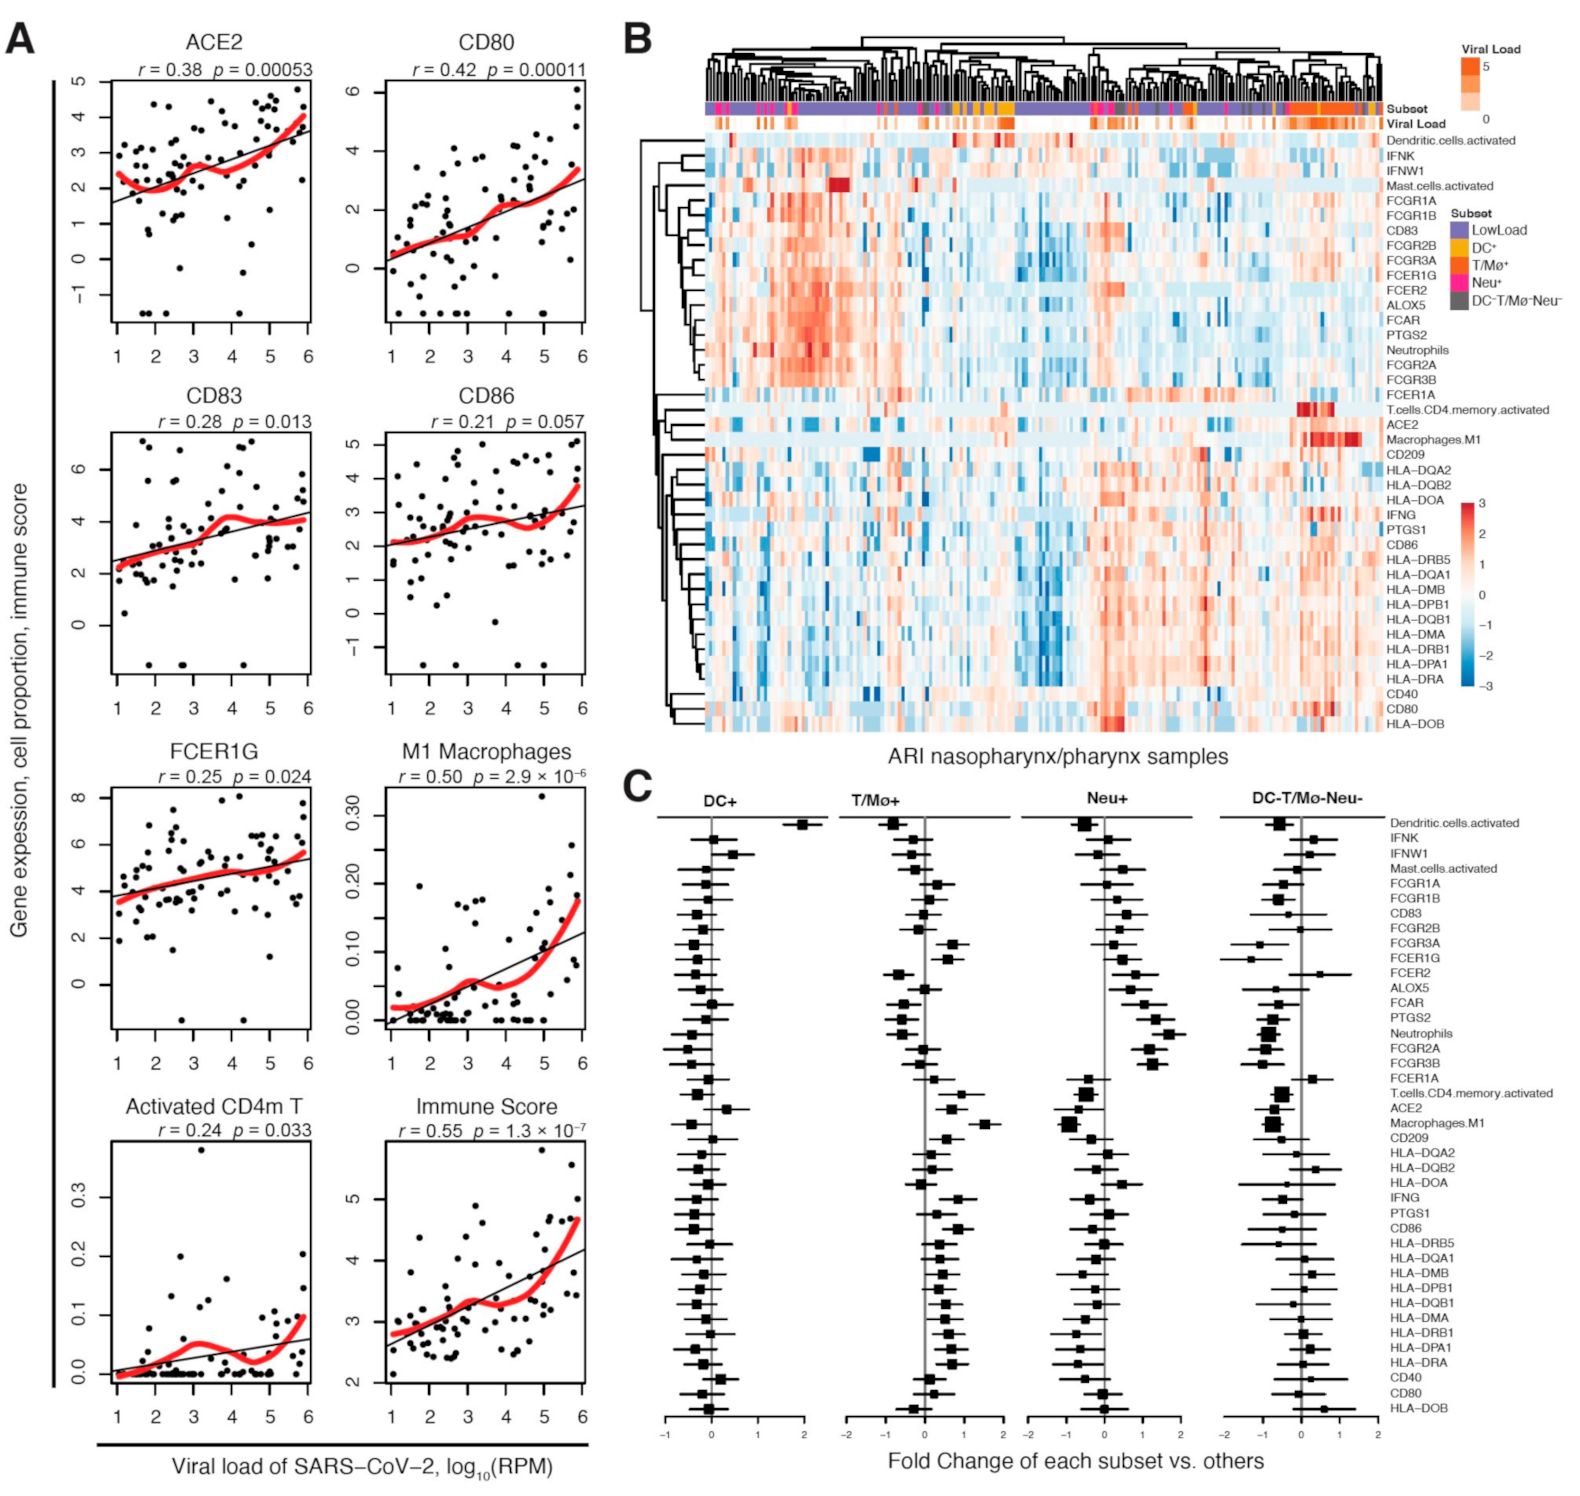
2.1. DC-SIGN Is Associated with SARS-CoV-2 Infection and Immune Cell Activation
2.2. DC-SIGN Is Associated with COVID-19 Severity, Immune- and Neural-Related Phenotypes and Respiratory Diseases
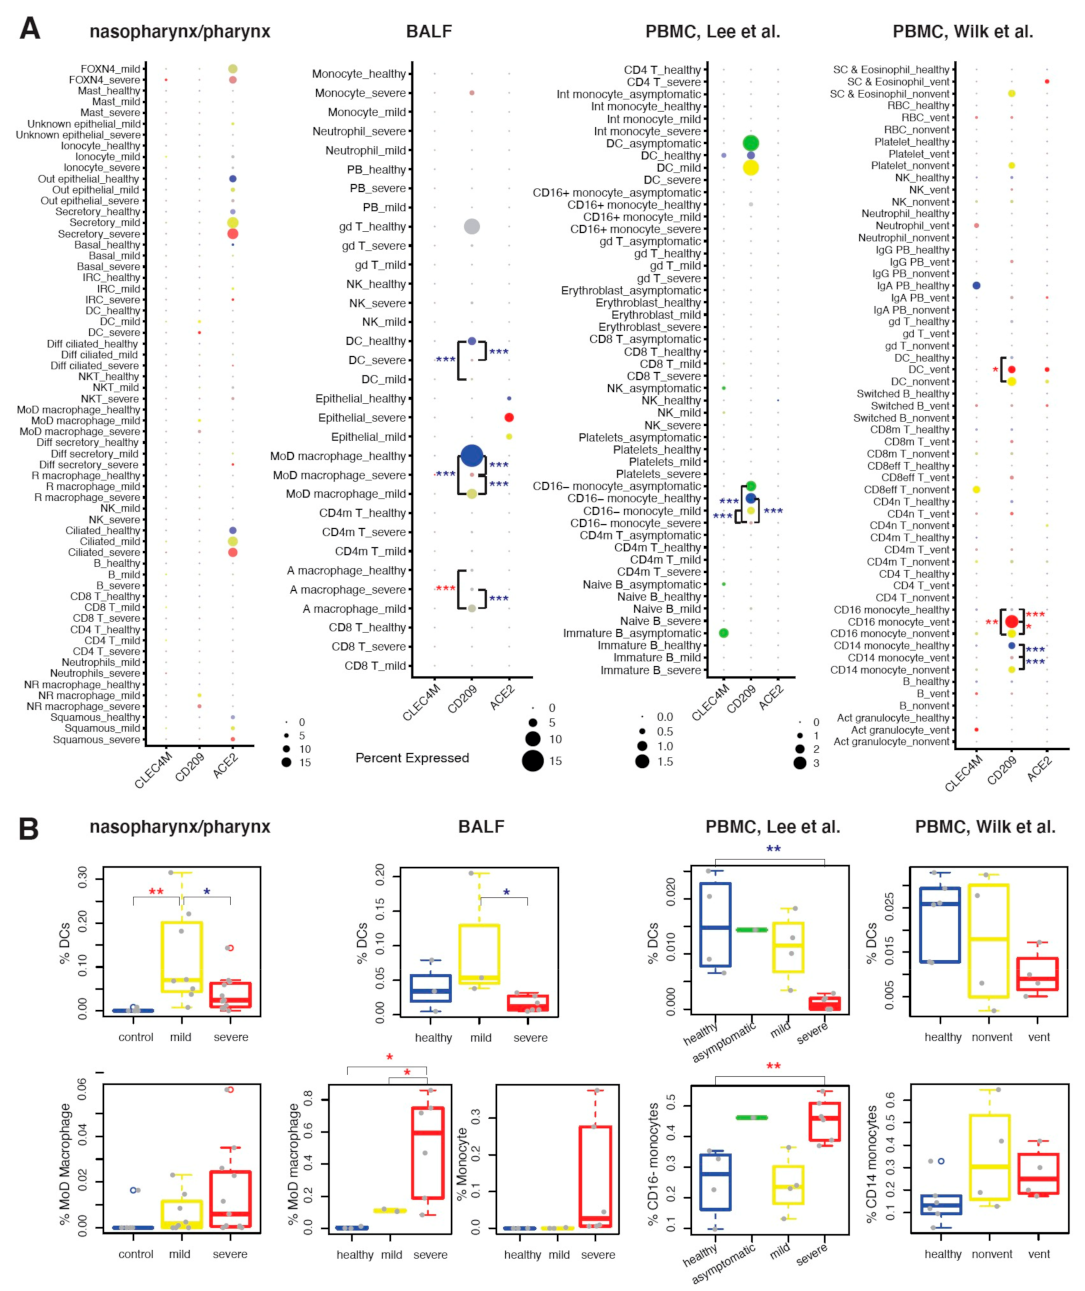
2.3. CD209 Expression in DCs and Mø Is Associated with COVID-19 Severity
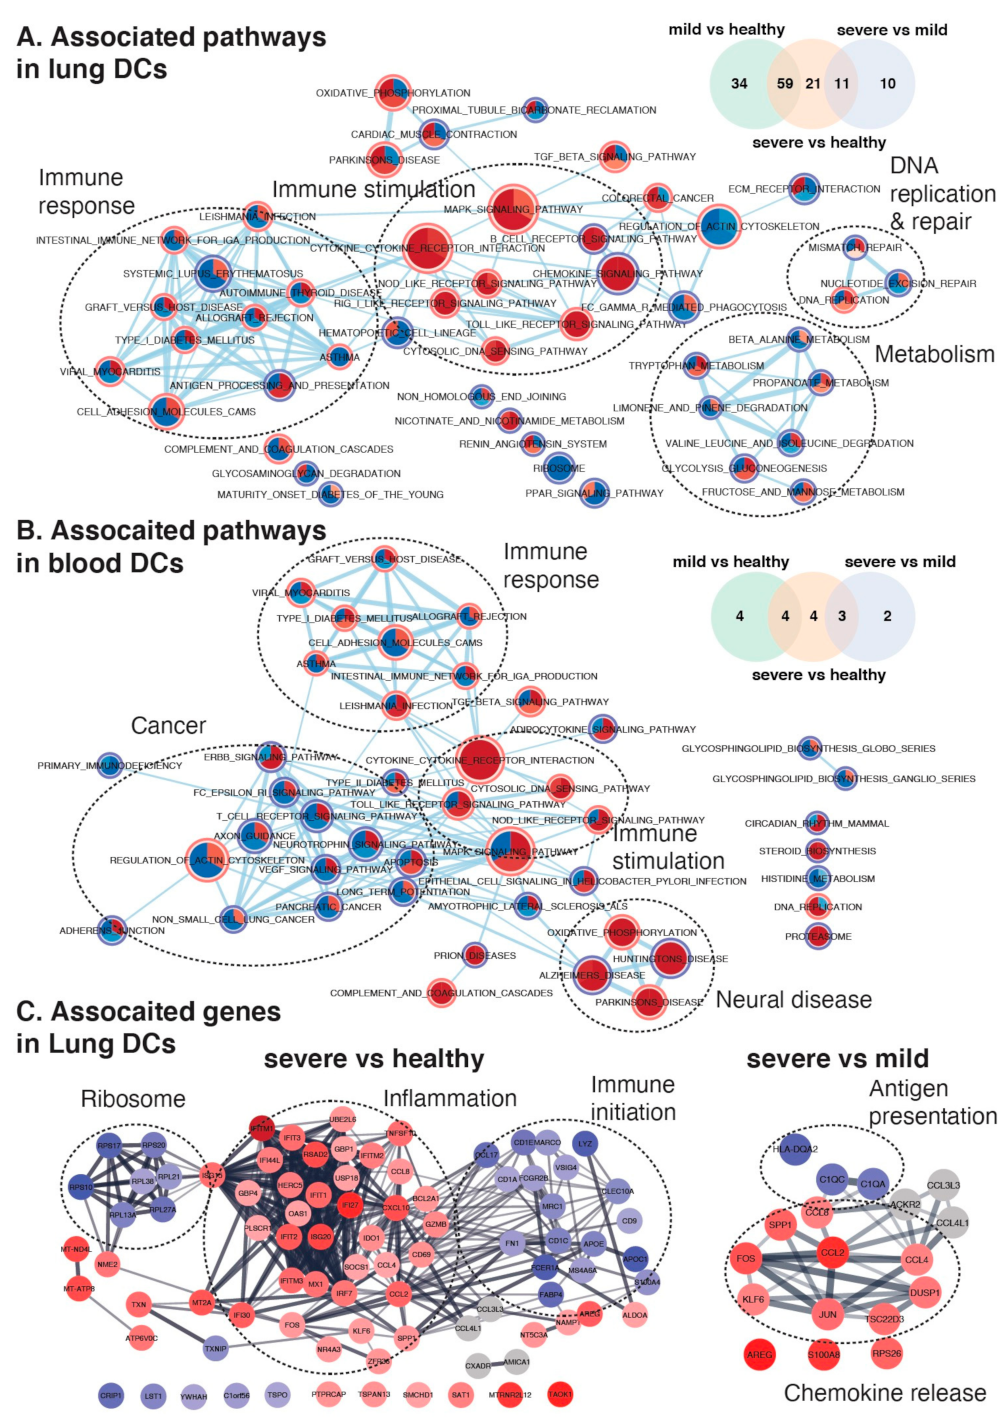
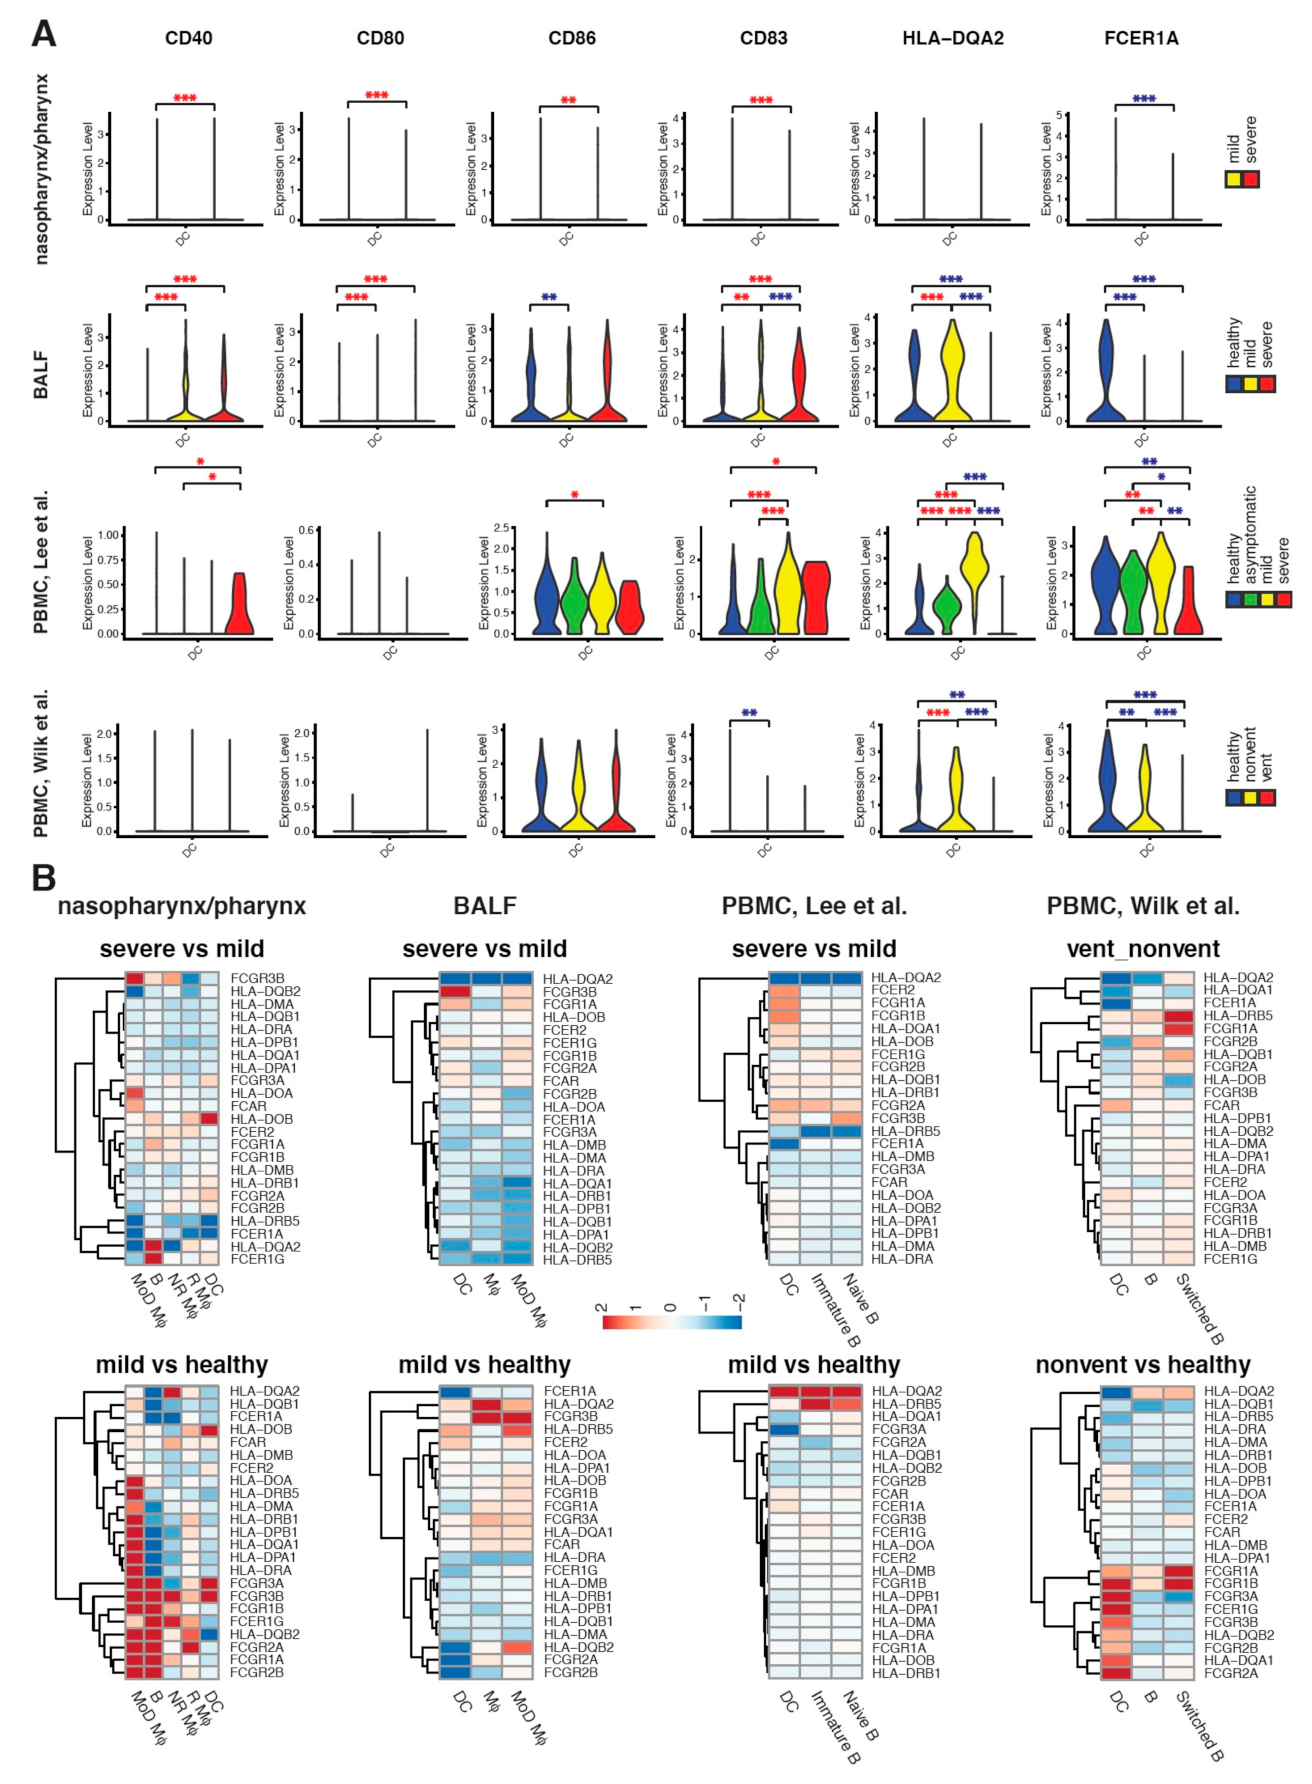
2.4. Maturation and Antigen Presentation Ability of DCs Are Inhibited in Both Lung and Blood of Severe COVID-19
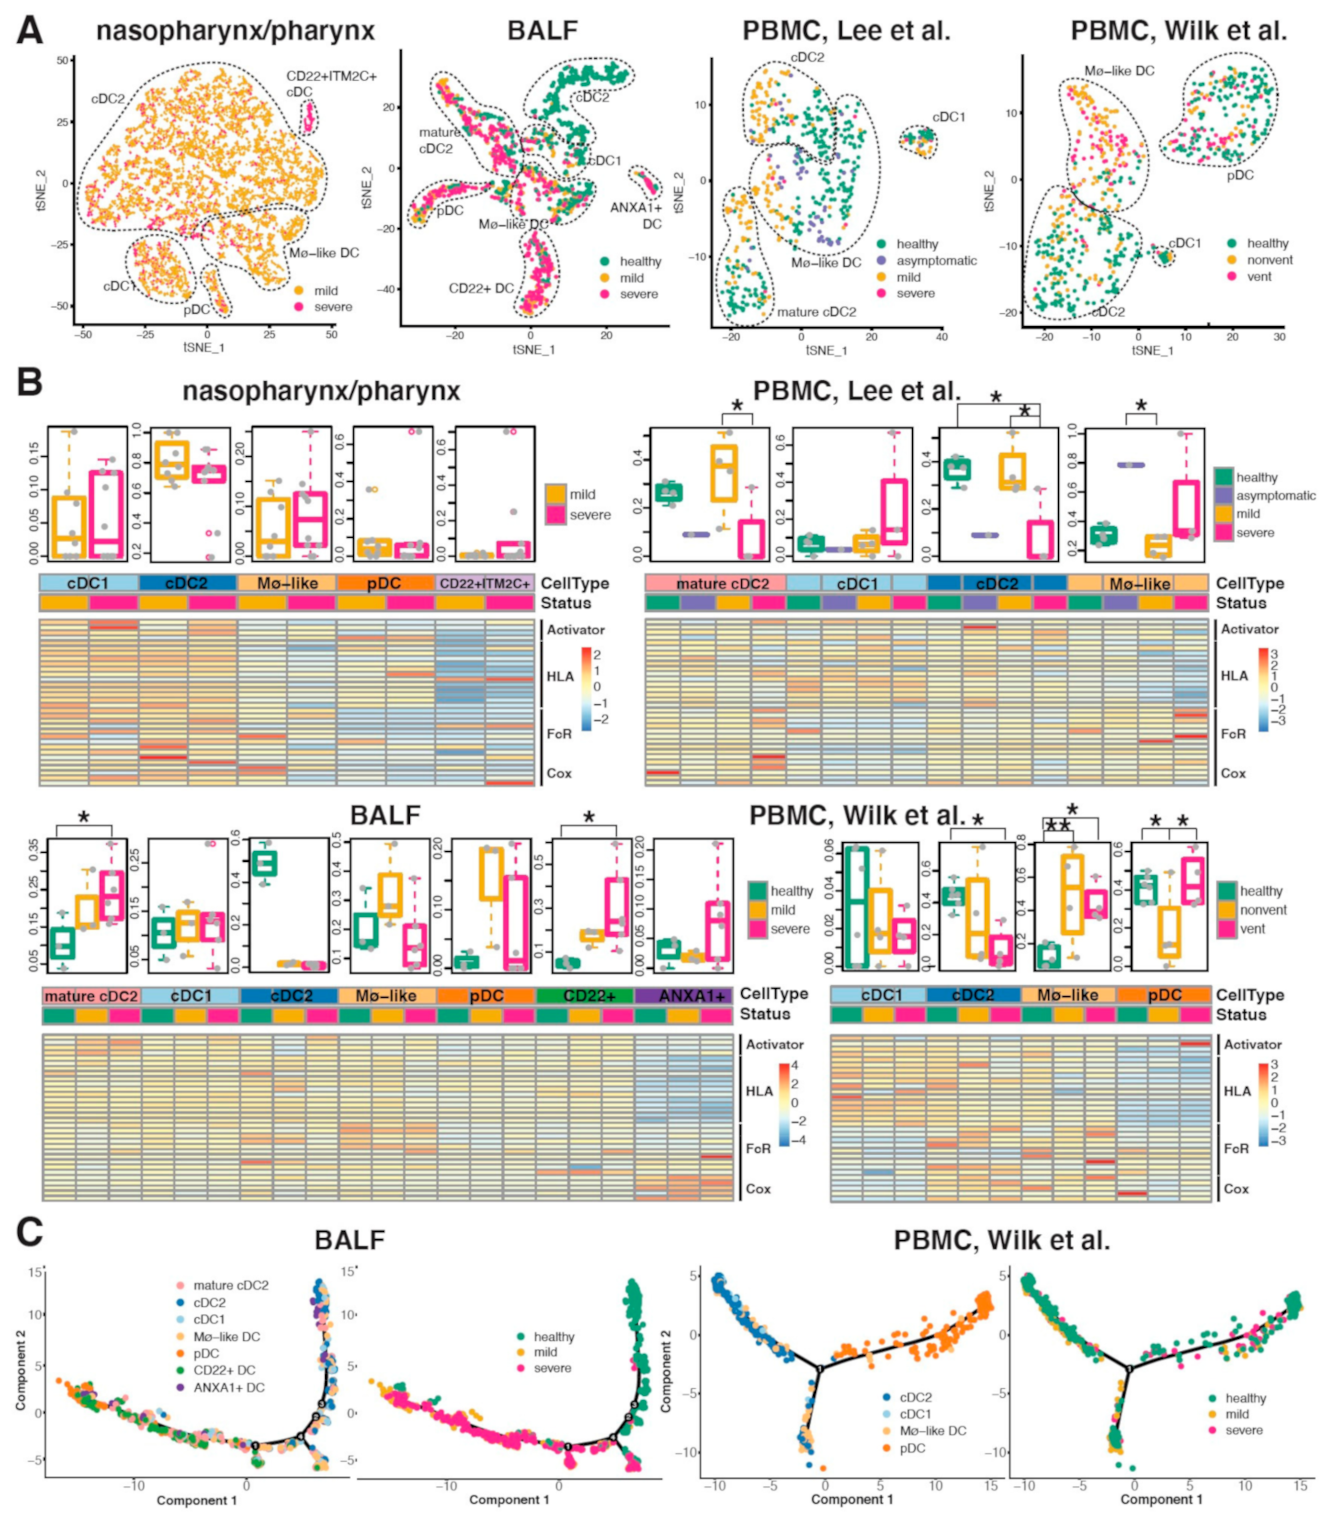
2.5. Conventional DC Subsets Were Depleted and New Immature DC Subsets Were Accumulated in Both Lung and Blood of Severe COVID-19
3. Discussion
4. Materials and Methods
4.1. Bulk Transcriptomics
4.1.1. Upper Airway Samples from COVID-19 Patients and Controls
4.1.2. Blood Samples from ARDS Cases and Controls
4.1.3. TCGA Lung Adenocarcinoma Tumors
4.2. Single-Cell Transcriptomics
4.3. Group Comparison and Association Testing
4.4. Pathway and Network Analyses
4.5. Inference and Comparison of Transcriptional Bursting Kinetics between DC Subsets
4.6. Transcriptome-Based Phenome-Wide Association Study
4.7. Mendelian Randomization Analysis
4.8. Software
Supplementary Materials
Author Contributions
Funding
Institutional Review Board Statement
Informed Consent Statement
Data Availability Statement
Conflicts of Interest
References
- Chan, J.F.-W.; Yuan, S.; Kok, K.-H.; To, K.K.-W.; Chu, H.; Yang, J.; Xing, F.; Liu, J.; Yip, C.C.-Y.; Poon, R.W.-S.; et al. A familial cluster of pneumonia associated with the 2019 novel coronavirus indicating person-to-person transmission: A study of a family cluster. Lancet 2020, 395, 514–523. [Google Scholar] [CrossRef]
- Zhou, P.; Yang, X.-L.; Wang, X.-G.; Hu, B.; Zhang, L.; Zhang, W.; Si, H.-R.; Zhu, Y.; Li, B.; Huang, C.-L.; et al. A pneumonia outbreak associated with a new coronavirus of probable bat origin. Nature 2020, 579, 270–273. [Google Scholar] [CrossRef] [PubMed]
- Wan, Y.; Shang, J.; Graham, R.; Baric, R.S.; Li, F. Receptor recognition by novel coronavirus from Wuhan: An analysis based on decade-long structural studies of SARS. J. Virol. 2020, 94, e00127-20. [Google Scholar] [CrossRef] [PubMed]
- Huang, C.; Wang, Y.; Li, X.; Ren, L.; Zhao, J.; Hu, Y.; Zhang, L.; Fan, G.; Xu, J.; Gu, X.; et al. Clinical features of patients infected with 2019 novel coronavirus in Wuhan, China. Lancet 2020, 395, 497–506. [Google Scholar] [CrossRef]
- Li, W.; Moore, M.J.; Vasilieva, N.; Sui, J.; Wong, S.K.; Berne, M.A.; Somasundaran, M.; Sullivan, J.L.; Luzuriaga, K.; Greenough, T.C.; et al. Angiotensin-converting enzyme 2 is a functional receptor for the SARS coronavirus. Nature 2003, 426, 450–454. [Google Scholar] [CrossRef] [PubMed]
- Yang, Z.-Y.; Huang, Y.; Ganesh, L.; Leung, K.; Kong, W.-P.; Schwartz, O.; Subbarao, K.; Nabel, G.J. pH-dependent entry of severe acute respiratory syndrome coronavirus is mediated by the spike glycoprotein and enhanced by dendritic cell transfer through DC-SIGN. J. Virol. 2004, 78, 5642–5650. [Google Scholar] [CrossRef]
- Jeffers, S.A.; Tusell, S.M.; Gillim-Ross, L.; Hemmila, E.M.; Achenbach, J.E.; Babcock, G.J.; Thomas, W.D., Jr.; Thackray, L.B.; Young, M.D.; Mason, R.J.; et al. CD209L (L-SIGN) is a receptor for severe acute respiratory syndrome coronavirus. Proc. Natl. Acad. Sci. USA 2004, 101, 15748–15753. [Google Scholar] [CrossRef]
- Amraie, R.; Napoleon, M.A.; Yin, W.; Berrigan, J.; Suder, E.; Zhao, G.; Olejnik, J.; Gummuluru, S.; Muhlberger, E.; Chitalia, V.; et al. CD209L/L-SIGN and CD209/DC-SIGN act as receptors for SARS-CoV-2 and are differentially expressed in lung and kidney epithelial and endothelial cells. bioRxiv 2020, 10, 1. [Google Scholar]
- Brufsky, A.; Lotze, M.T. DC/L-SIGNs of hope in the COVID-19 pandemic. J. Med. Virol. 2020, 92, 1396–1398. [Google Scholar] [CrossRef]
- Gardner, J.P.; Durso, R.J.; Arrigale, R.R.; Donovan, G.P.; Maddon, P.J.; Dragic, T.; Olson, W.C. L-SIGN (CD 209L) is a liver-specific capture receptor for hepatitis C virus. Proc. Natl. Acad. Sci. USA 2003, 100, 4498–4503. [Google Scholar] [CrossRef]
- Tay, M.Z.; Poh, C.M.; Rénia, L.; Macary, P.A.; Ng, L.F.P. The trinity of COVID-19: Immunity, inflammation and intervention. Nat. Rev. Immunol. 2020, 20, 363–374. [Google Scholar] [CrossRef]
- Khoo, U.-S.; Chan, K.Y.K.; Chan, V.S.F.; Lin, C.L.S. DC-SIGN and L-SIGN: The SIGNs for infection. J. Mol. Med. 2008, 86, 861–874. [Google Scholar] [CrossRef] [PubMed]
- da Silva, R.C.; Segat, L.; Crovella, S. Role of DC-SIGN and L-SIGN receptors in HIV-1 vertical transmission. Hum. Immunol. 2011, 72, 305–311. [Google Scholar] [CrossRef] [PubMed]
- Liao, M.; Liu, Y.; Yuan, J.; Wen, Y.; Xu, G.; Zhao, J.; Cheng, L.; Li, J.; Wang, X.; Wang, F.; et al. Single-cell landscape of bronchoalveolar immune cells in patients with COVID-19. Nat. Med. 2020, 26, 842–844. [Google Scholar] [CrossRef]
- Wilk, A.J.; Rustagi, A.; Zhao, N.Q.; Roque, J.; Martínez-Colón, G.J.; McKechnie, J.L.; Ivison, G.T.; Ranganath, T.; Vergara, R.; Hollis, T.; et al. A single-cell atlas of the peripheral immune response in patients with severe COVID-19. Nat. Med. 2020, 26, 1070–1076. [Google Scholar] [CrossRef] [PubMed]
- Lee, J.S.; Park, S.; Jeong, H.W.; Ahn, J.Y.; Choi, S.J.; Lee, H.; Choi, B.; Nam, S.K.; Sa, M.; Kwon, J.S.; et al. Immunophenotyping of COVID-19 and influenza highlights the role of type I interferons in development of severe COVID-19. Sci. Immunol. 2020, 5, 49. [Google Scholar] [CrossRef]
- Subramanian, A.; Tamayo, P.; Mootha, V.K.; Mukherjee, S.; Ebert, B.L.; Gillette, M.A.; Paulovich, A.; Pomeroy, S.L.; Golub, T.R.; Lander, E.S.; et al. Gene set enrichment analysis: A knowledge-based approach for interpreting genome-wide expression profiles. Proc. Natl. Acad. Sci. USA 2005, 102, 15545–15550. [Google Scholar] [CrossRef] [PubMed]
- Sharma, S.; Stolina, M.; Yang, S.-C.; Baratelli, F.; Lin, J.F.; Atianzar, K.; Luo, J.; Zhu, L.; Lin, Y.; Huang, M.; et al. Tumor cyclooxygenase 2-dependent suppression of dendritic cell function. Clin. Cancer Res. 2003, 9, 961–968. [Google Scholar]
- Huggins, A.; Paschalidis, N.; Flower, R.J.; Perretti, M.; D’Acquisto, F. Annexin-1-deficient dendritic cells acquire a mature phenotype during differentiation. FASEB J. 2009, 23, 985–996. [Google Scholar] [CrossRef]
- Engering, A.; Geijtenbeek, T.B.H.; Van Vliet, S.J.; Wijers, M.; Van Liempt, E.; Demaurex, N.; Lanzavecchia, A.; Fransen, J.; Figdor, C.; Piguet, V.; et al. The Dendritic Cell-Specific Adhesion Receptor DC-SIGN Internalizes Antigen for Presentation to T Cells. J. Immunol. 2002, 168, 2118–2126. [Google Scholar] [CrossRef]
- van Gisbergen, K.P.; Sanchez-Hernandez, M.; Geijtenbeek, T.B.; van Kooyk, Y. Neutrophils mediate immune modulation of dendritic cells through glycosylation-dependent interactions between Mac-1 and DC-SIGN. J. Exp. Med. 2005, 201, 1281–1292. [Google Scholar] [CrossRef]
- Liu, J.; Liu, Y.; Xiang, P.; Pu, L.; Xiong, H.; Li, C.; Zhang, M.; Tan, J.; Xu, Y.; Song, R.; et al. Neutrophil-to-lymphocyte ratio predicts critical illness patients with 2019 coronavirus disease in the early stage. J. Transl. Med. 2020, 18, 206. [Google Scholar] [CrossRef]
- Templeton, A.J.; Mcnamara, M.G.; Šeruga, B.; Vera-Badillo, F.E.; Aneja, P.; Ocaña, A.; Leibowitz-Amit, R.; Sonpavde, G.; Knox, J.J.; Tran, B.; et al. Prognostic Role of Neutrophil-to-Lymphocyte Ratio in Solid Tumors: A Systematic Review and Meta-Analysis. J. Natl. Cancer Inst. 2014, 106, dju124. [Google Scholar] [CrossRef] [PubMed]
- Kuppalli, K.; Rasmussen, A.L. A glimpse into the eye of the COVID-19 cytokine storm. EBioMedicine 2020, 55, 102789. [Google Scholar] [CrossRef] [PubMed]
- van Kooyk, Y.; Geijtenbeek, T.B. DC-SIGN: Escape mechanism for pathogens. Nat. Rev. Immunol. 2003, 3, 697–709. [Google Scholar] [CrossRef]
- Milinski, M.; Croy, I.; Hummel, T.; Boehm, T. Major histocompatibility complex peptide ligands as olfactory cues in human body odour assessment. Proc. Biol. Sci. 2013, 280, 20122889. [Google Scholar]
- Schulte-Schrepping, J.; Reusch, N.; Paclik, D.; Bassler, K.; Schlickeiser, S.; Zhang, B.; Kramer, B.; Krammer, T.; Brumhard, S.; Bonaguro, L.; et al. Severe COVID-19 Is Marked by a Dysregulated Myeloid Cell Compartment. Cell 2020, 182, 1419–1440. [Google Scholar] [CrossRef] [PubMed]
- Silvin, A.; Chapuis, N.; Dunsmore, G.; Goubet, A.G.; Dubuisson, A.; Derosa, L.; Almire, C.; Henon, C.; Kosmider, O.; Droin, N.; et al. Elevated Calprotectin and Abnormal Myeloid Cell Subsets Discriminate Severe from Mild COVID-19. Cell 2020, 182, 1401–1418. [Google Scholar] [CrossRef] [PubMed]
- Kaneko, N.; Kuo, H.H.; Boucau, J.; Farmer, J.R.; Allard-Chamard, H.; Mahajan, V.S.; Piechocka-Trocha, A.; Lefteri, K.; Osborn, M.; Bals, J.; et al. The Loss of Bcl-6 Expressing T Follicular Helper Cells and the Absence of Germinal Centers in COVID-19. Cell 2020, 183, 143–157. [Google Scholar] [CrossRef] [PubMed]
- Mick, E.; Kamm, J.; Pisco, A.O.; Ratnasiri, K.; Babik, J.M.; Calfee, C.S.; Castaneda, G.; DeRisi, J.L.; Detweiler, A.M.; Hao, S.; et al. Upper airway gene expression differentiates COVID-19 from other acute respiratory illnesses and reveals suppression of innate immune responses by SARS-CoV-2. medRxiv 2020. [Google Scholar] [CrossRef]
- Robinson, M.D.; McCarthy, D.J.; Smyth, G.K. edgeR: A Bioconductor package for differential expression analysis of digital gene expression data. Bioinformatics 2010, 26, 139–140. [Google Scholar] [CrossRef]
- Newman, A.M.; Steen, C.B.; Liu, C.L.; Gentles, A.J.; Chaudhuri, A.A.; Scherer, F.; Khodadoust, M.S.; Esfahani, M.S.; Luca, B.A.; Steiner, D.; et al. Determining cell type abundance and expression from bulk tissues with digital cytometry. Nat. Biotechnol. 2019, 37, 773–782. [Google Scholar] [CrossRef] [PubMed]
- Wang, X.; Park, J.; Susztak, K.; Zhang, N.R.; Li, M. Bulk tissue cell type deconvolution with multi-subject single-cell expression reference. Nat. Commun. 2019, 10, 380. [Google Scholar] [CrossRef] [PubMed]
- Zhang, R.; Wang, Z.; Tejera, P.; Frank, A.J.; Wei, Y.; Su, L.; Zhu, Z.; Guo, Y.; Chen, F.; Bajwa, E.K.; et al. Late-onset moderate to severe acute respiratory distress syndrome is associated with shorter survival and higher mortality: A two-stage association study. Intensive Care Med. 2017, 43, 399–407. [Google Scholar] [CrossRef]
- Du, M.; Garcia, J.G.N.; Christie, J.D.; Xin, J.; Cai, G.; Meyer, N.J.; Zhu, Z.; Yuan, Q.; Zhang, Z.; Su, L.; et al. Integrative omics provide biological and clinical insights into acute respiratory distress syndrome. Intensive Care Med. 2021, 47, 761–771. [Google Scholar] [CrossRef] [PubMed]
- Dobin, A.; Davis, C.A.; Schlesinger, F.; Drenkow, J.; Zaleski, C.; Jha, S.; Batut, P.; Chaisson, M.; Gingeras, T.R. STAR: Ultrafast universal RNA-seq aligner. Bioinformatics 2013, 29, 15–21. [Google Scholar] [CrossRef] [PubMed]
- Liao, Y.; Smyth, G.K.; Shi, W. featureCounts: An efficient general purpose program for assigning sequence reads to genomic features. Bioinformatics 2014, 30, 923–930. [Google Scholar] [CrossRef] [PubMed]
- Law, C.W.; Chen, Y.; Shi, W.; Smyth, G.K. voom: Precision weights unlock linear model analysis tools for RNA-seq read counts. Genome. Biol. 2014, 15, R29. [Google Scholar] [CrossRef] [PubMed]
- Cai, G.; Xiao, F.; Cheng, C.; Li, Y.; Amos, C.I.; Whitfield, M.L. Population effect model identifies gene expression predictors of survival outcomes in lung adenocarcinoma for both Caucasian and Asian patients. PLoS ONE 2017, 12, e0175850. [Google Scholar] [CrossRef] [PubMed]
- Chua, R.L.; Lukassen, S.; Trump, S.; Hennig, B.P.; Wendisch, D.; Pott, F.; Debnath, O.; Thürmann, L.; Kurth, F.; Völker, M.T.; et al. COVID-19 severity correlates with airway epithelium–immune cell interactions identified by single-cell analysis. Nat. Biotechnol. 2020, 38, 970–979. [Google Scholar] [CrossRef]
- Stuart, T.; Butler, A.; Hoffman, P.; Hafemeister, C.; Papalexi, E.; Mauck, W.M., 3rd; Hao, Y.; Stoeckius, M.; Smibert, P.; Satija, R. Comprehensive Integration of Single-Cell Data. Cell 2019, 177, 1888–1902. [Google Scholar] [CrossRef]
- Aran, D.; Looney, A.P.; Liu, L.; Wu, E.; Fong, V.; Hsu, A.; Chak, S.; Naikawadi, R.P.; Wolters, P.J.; Abate, A.R.; et al. Reference-based analysis of lung single-cell sequencing reveals a transitional profibrotic macrophage. Nat. Immunol. 2019, 20, 163–172. [Google Scholar] [CrossRef] [PubMed]
- Trapnell, C.; Cacchiarelli, D.; Grimsby, J.; Pokharel, P.; Li, S.; Morse, M.; Lennon, N.J.; Livak, K.J.; Mikkelsen, T.S.; Rinn, J.L. The dynamics and regulators of cell fate decisions are revealed by pseudotemporal ordering of single cells. Nat. Biotechnol. 2014, 32, 381–386. [Google Scholar] [CrossRef]
- Ji, Z.; Ji, H. TSCAN: Pseudo-time reconstruction and evaluation in single-cell RNA-seq analysis. Nucleic. Acids Res. 2016, 44, e117. [Google Scholar] [CrossRef]
- Kanehisa, M.; Sato, Y.; Kawashima, M.; Furumichi, M.; Tanabe, M. KEGG as a reference resource for gene and protein annotation. Nucleic Acids Res. 2016, 44, D457–D462. [Google Scholar] [CrossRef]
- Shannon, P.; Markiel, A.; Ozier, O.; Baliga, N.S.; Wang, J.T.; Ramage, D.; Amin, N.; Schwikowski, B.; Ideker, T. Cytoscape: A software environment for integrated models of biomolecular interaction networks. Genome Res. 2003, 13, 2498–2504. [Google Scholar] [CrossRef] [PubMed]
- Doncheva, N.T.; Morris, J.H.; Gorodkin, J.; Jensen, L.J. Cytoscape StringApp: Network Analysis and Visualization of Proteomics Data. J. Proteome Res. 2019, 18, 623–632. [Google Scholar] [CrossRef] [PubMed]
- Vu, T.N.; Wills, Q.F.; Kalari, K.R.; Niu, N.; Wang, L.; Rantalainen, M.; Pawitan, Y. Beta-Poisson model for single-cell RNA-seq data analyses. Bioinformatics 2016, 32, 2128–2135. [Google Scholar] [CrossRef]
- Cai, G.; Liang, S.; Zheng, X.; Xiao, F. Local sequence and sequencing depth dependent accuracy of RNA-seq reads. BMC Bioinform. 2017, 18, 364. [Google Scholar] [CrossRef]
- Kim, J.K.; Kolodziejczyk, A.A.; Ilicic, T.; Teichmann, S.A.; Marioni, J.C. Characterizing noise structure in single-cell RNA-seq distinguishes genuine from technical stochastic allelic expression. Nat. Commun. 2015, 6, 8687. [Google Scholar] [CrossRef]
- Li, J.; Witten, D.M.; Johnstone, I.M.; Tibshirani, R. Normalization, testing, and false discovery rate estimation for RNA-sequencing data. Biostatistics 2012, 13, 523–538. [Google Scholar] [CrossRef] [PubMed]
- Kruschke, J.K. Bayesian estimation supersedes the t test. J. Exp. Psychol Gen. 2013, 142, 573–603. [Google Scholar] [CrossRef] [PubMed]
- Kamat, M.A.; Blackshaw, J.A.; Young, R.; Surendran, P.; Burgess, S.; Danesh, J.; Butterworth, A.S.; Staley, J.R. PhenoScanner V2: An expanded tool for searching human genotype-phenotype associations. Bioinformatics 2019, 35, 4851–4853. [Google Scholar] [CrossRef]
- Pividori, M.; Rajagopal, P.S.; Barbeira, A.; Liang, Y.; Melia, O.; Bastarache, L.; Park, Y.; Consortium, G.; Wen, X.; Im, H.K. PhenomeXcan: Mapping the genome to the phenome through the transcriptome. Sci. Adv. 2020, 6, eaba2083. [Google Scholar] [CrossRef] [PubMed]
- Keen, J.C.; Moore, H.M. The Consortium, The Genotype-Tissue Expression (GTEx) project. Nat. Genet. 2013, 45, 580–585. [Google Scholar]
- Hemani, G.; Zheng, J.; Elsworth, B.; Wade, K.H.; Haberland, V.; Baird, D.; Laurin, C.; Burgess, S.; Bowden, J.; Langdon, R.; et al. The MR-Base platform supports systematic causal inference across the human phenome. eLife 2018, 7, e34480. [Google Scholar] [CrossRef] [PubMed]
- Sun, B.B.; Maranville, J.C.; Peters, J.E.; Stacey, D.; Staley, J.R.; Blackshaw, J.; Burgess, S.; Jiang, T.; Paige, E.; Surendran, P.; et al. Genomic atlas of the human plasma proteome. Nature 2018, 558, 73–79. [Google Scholar] [CrossRef] [PubMed]
- Ellinghaus, D.; Degenhardt, F.; Bujanda, L.; Buti, M.; Albillos, A.; Invernizzi, P.; Fernandez, J.; Prati, D.; Baselli, G.; Asselta, R.; et al. Genomewide Association Study of Severe Covid-19 with Respiratory Failure. N. Engl. J. Med. 2020, 383, 1522–1524. [Google Scholar]
- Cai, G.; Xiao, F. SCANNER: A Web Resource for Annotation, Visualization and Sharing of Single Cell RNA-seq Data. bioRxiv 2020. [Google Scholar] [CrossRef]


Publisher’s Note: MDPI stays neutral with regard to jurisdictional claims in published maps and institutional affiliations. |
© 2021 by the authors. Licensee MDPI, Basel, Switzerland. This article is an open access article distributed under the terms and conditions of the Creative Commons Attribution (CC BY) license (https://creativecommons.org/licenses/by/4.0/).
Share and Cite
Cai, G.; Du, M.; Bossé, Y.; Albrecht, H.; Qin, F.; Luo, X.; Androulakis, X.M.; Cheng, C.; Nagarkatti, M.; Nagarkatti, P.; et al. SARS-CoV-2 Impairs Dendritic Cells and Regulates DC-SIGN Gene Expression in Tissues. Int. J. Mol. Sci. 2021, 22, 9228. https://doi.org/10.3390/ijms22179228
Cai G, Du M, Bossé Y, Albrecht H, Qin F, Luo X, Androulakis XM, Cheng C, Nagarkatti M, Nagarkatti P, et al. SARS-CoV-2 Impairs Dendritic Cells and Regulates DC-SIGN Gene Expression in Tissues. International Journal of Molecular Sciences. 2021; 22(17):9228. https://doi.org/10.3390/ijms22179228
Chicago/Turabian StyleCai, Guoshuai, Mulong Du, Yohan Bossé, Helmut Albrecht, Fei Qin, Xizhi Luo, Xiao Michelle Androulakis, Chao Cheng, Mitzi Nagarkatti, Prakash Nagarkatti, and et al. 2021. "SARS-CoV-2 Impairs Dendritic Cells and Regulates DC-SIGN Gene Expression in Tissues" International Journal of Molecular Sciences 22, no. 17: 9228. https://doi.org/10.3390/ijms22179228
APA StyleCai, G., Du, M., Bossé, Y., Albrecht, H., Qin, F., Luo, X., Androulakis, X. M., Cheng, C., Nagarkatti, M., Nagarkatti, P., Christiani, D. C., Whitfield, M. L., Amos, C. I., & Xiao, F. (2021). SARS-CoV-2 Impairs Dendritic Cells and Regulates DC-SIGN Gene Expression in Tissues. International Journal of Molecular Sciences, 22(17), 9228. https://doi.org/10.3390/ijms22179228