
PGS/HAp Microporous Composite Scaffold Obtained in the TIPS-TCL-SL Method: An Innovation for Bone Tissue Engineering

 ,
,  , , , , , , ,
  ,
,  and
and 
Abstract
:1. Introduction
2. Results and Discussion
2.1. pPGS Chemical and Structural Analysis
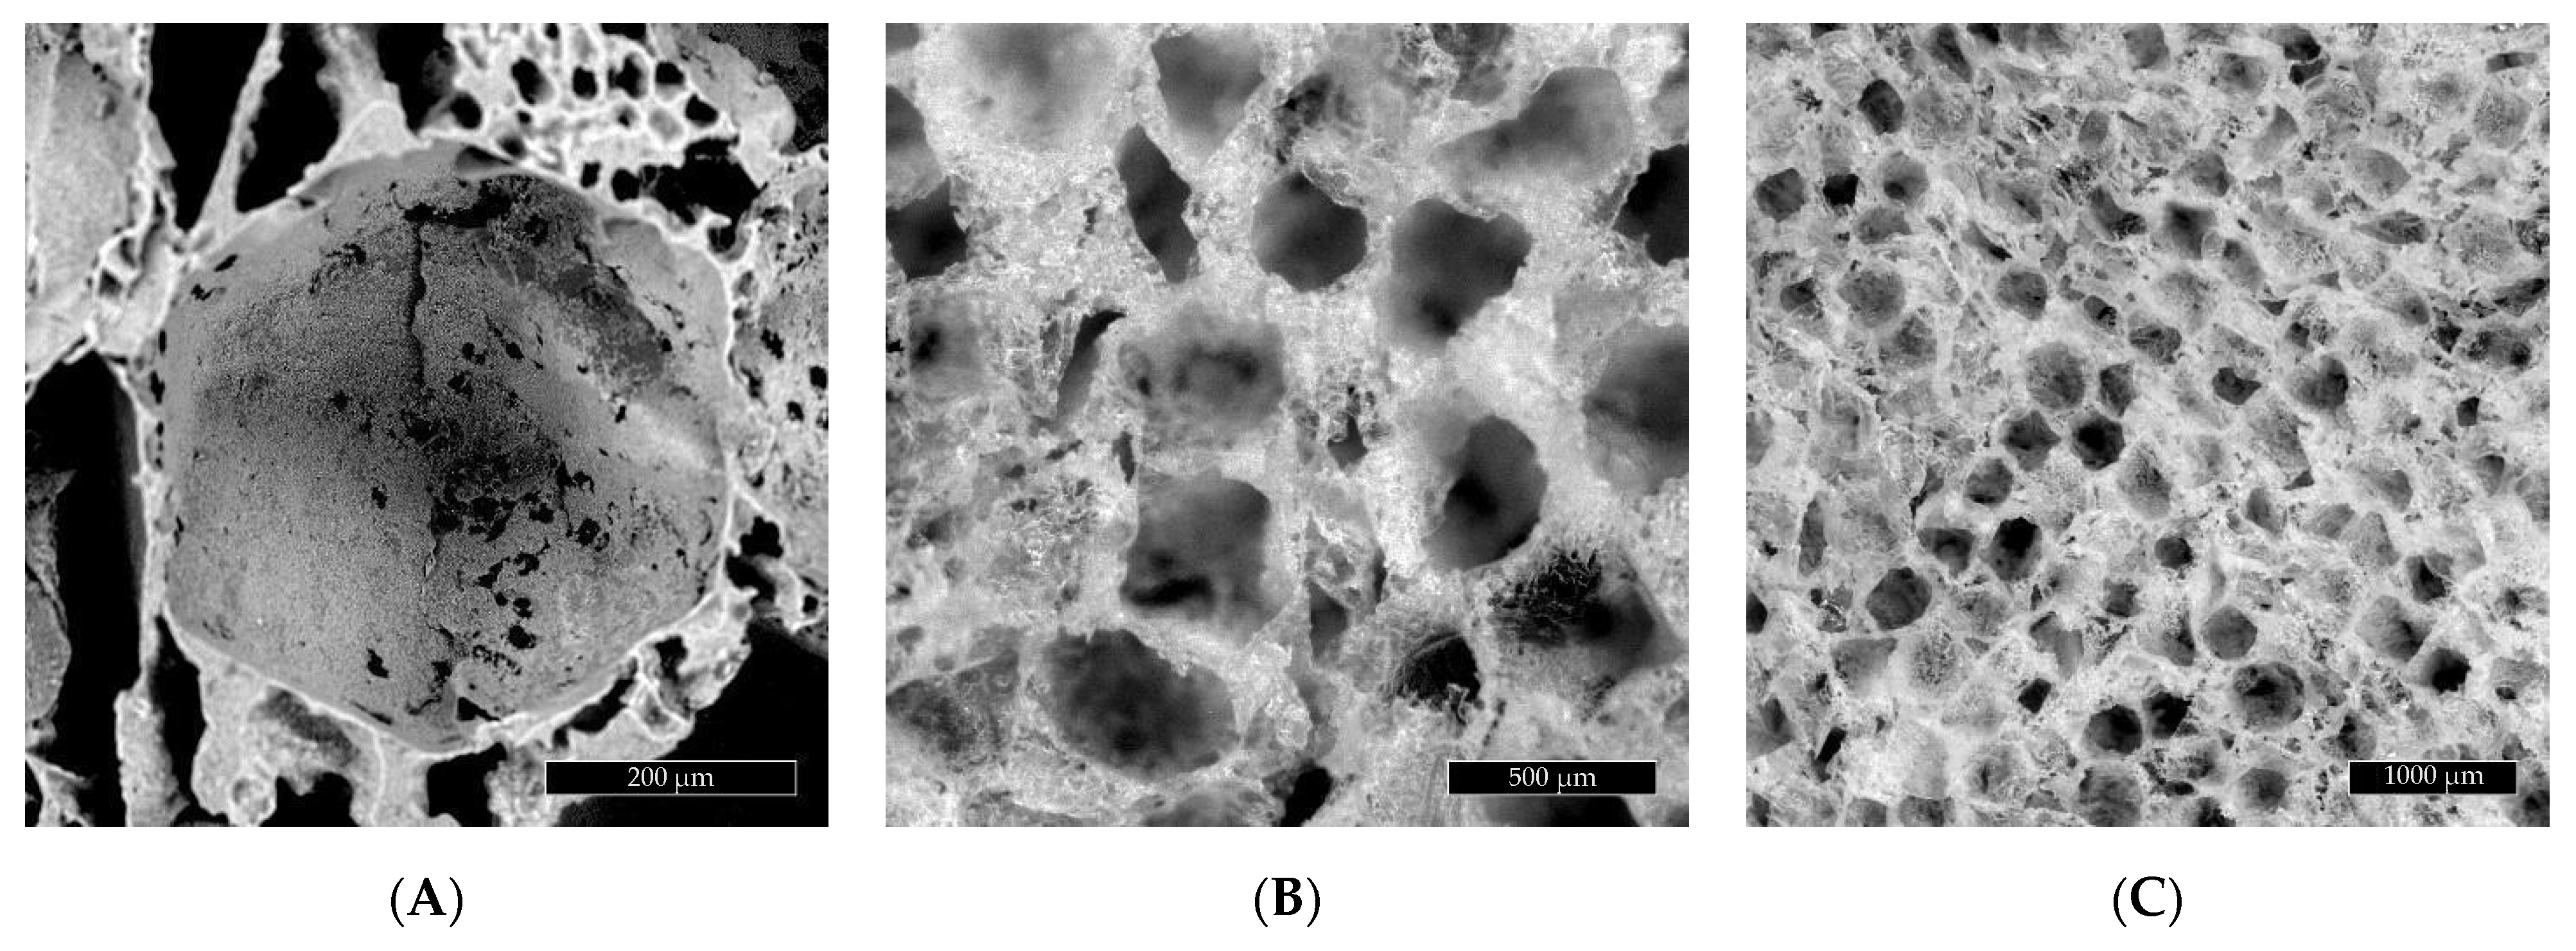
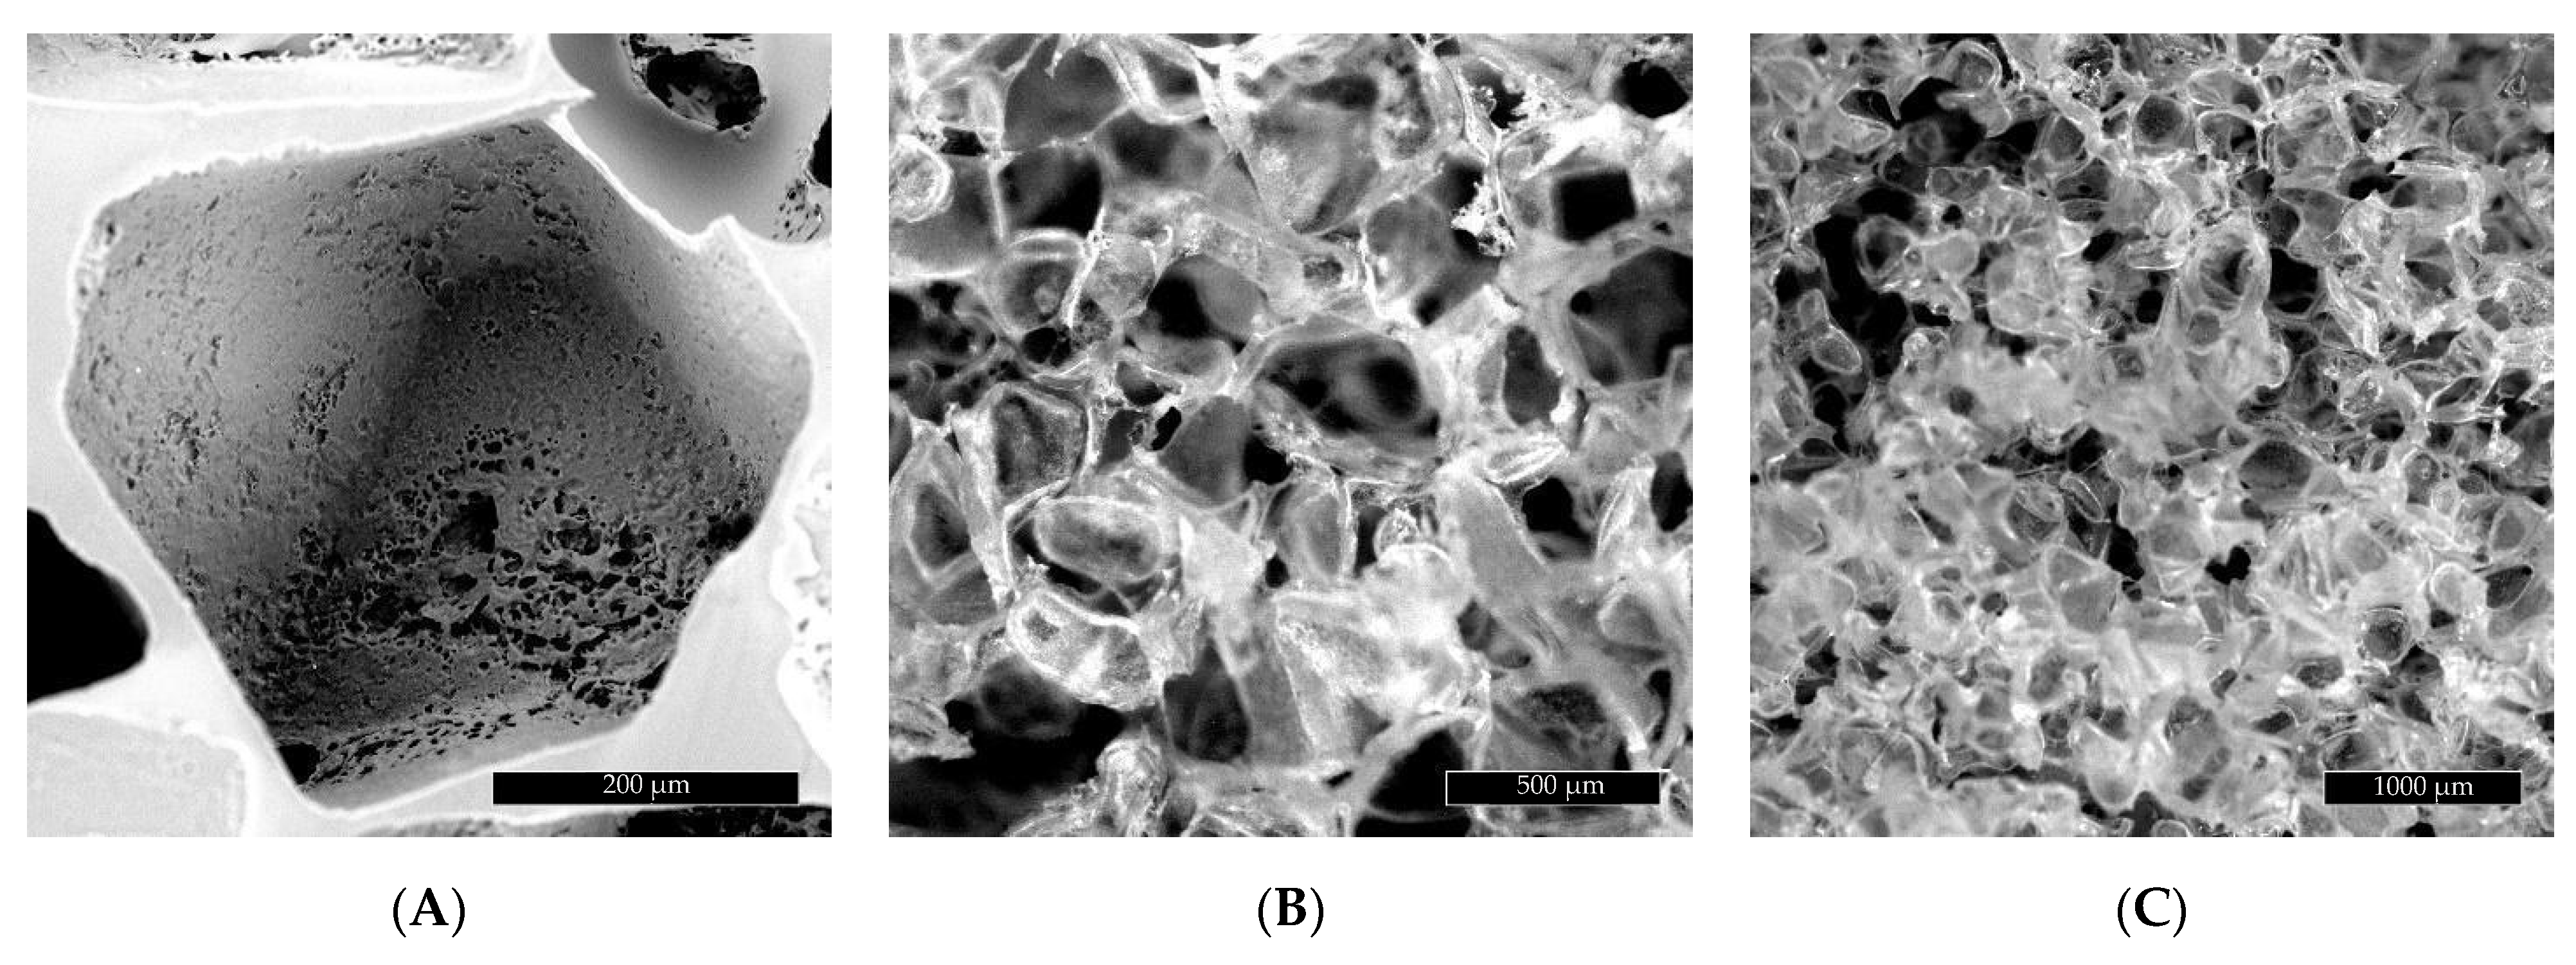
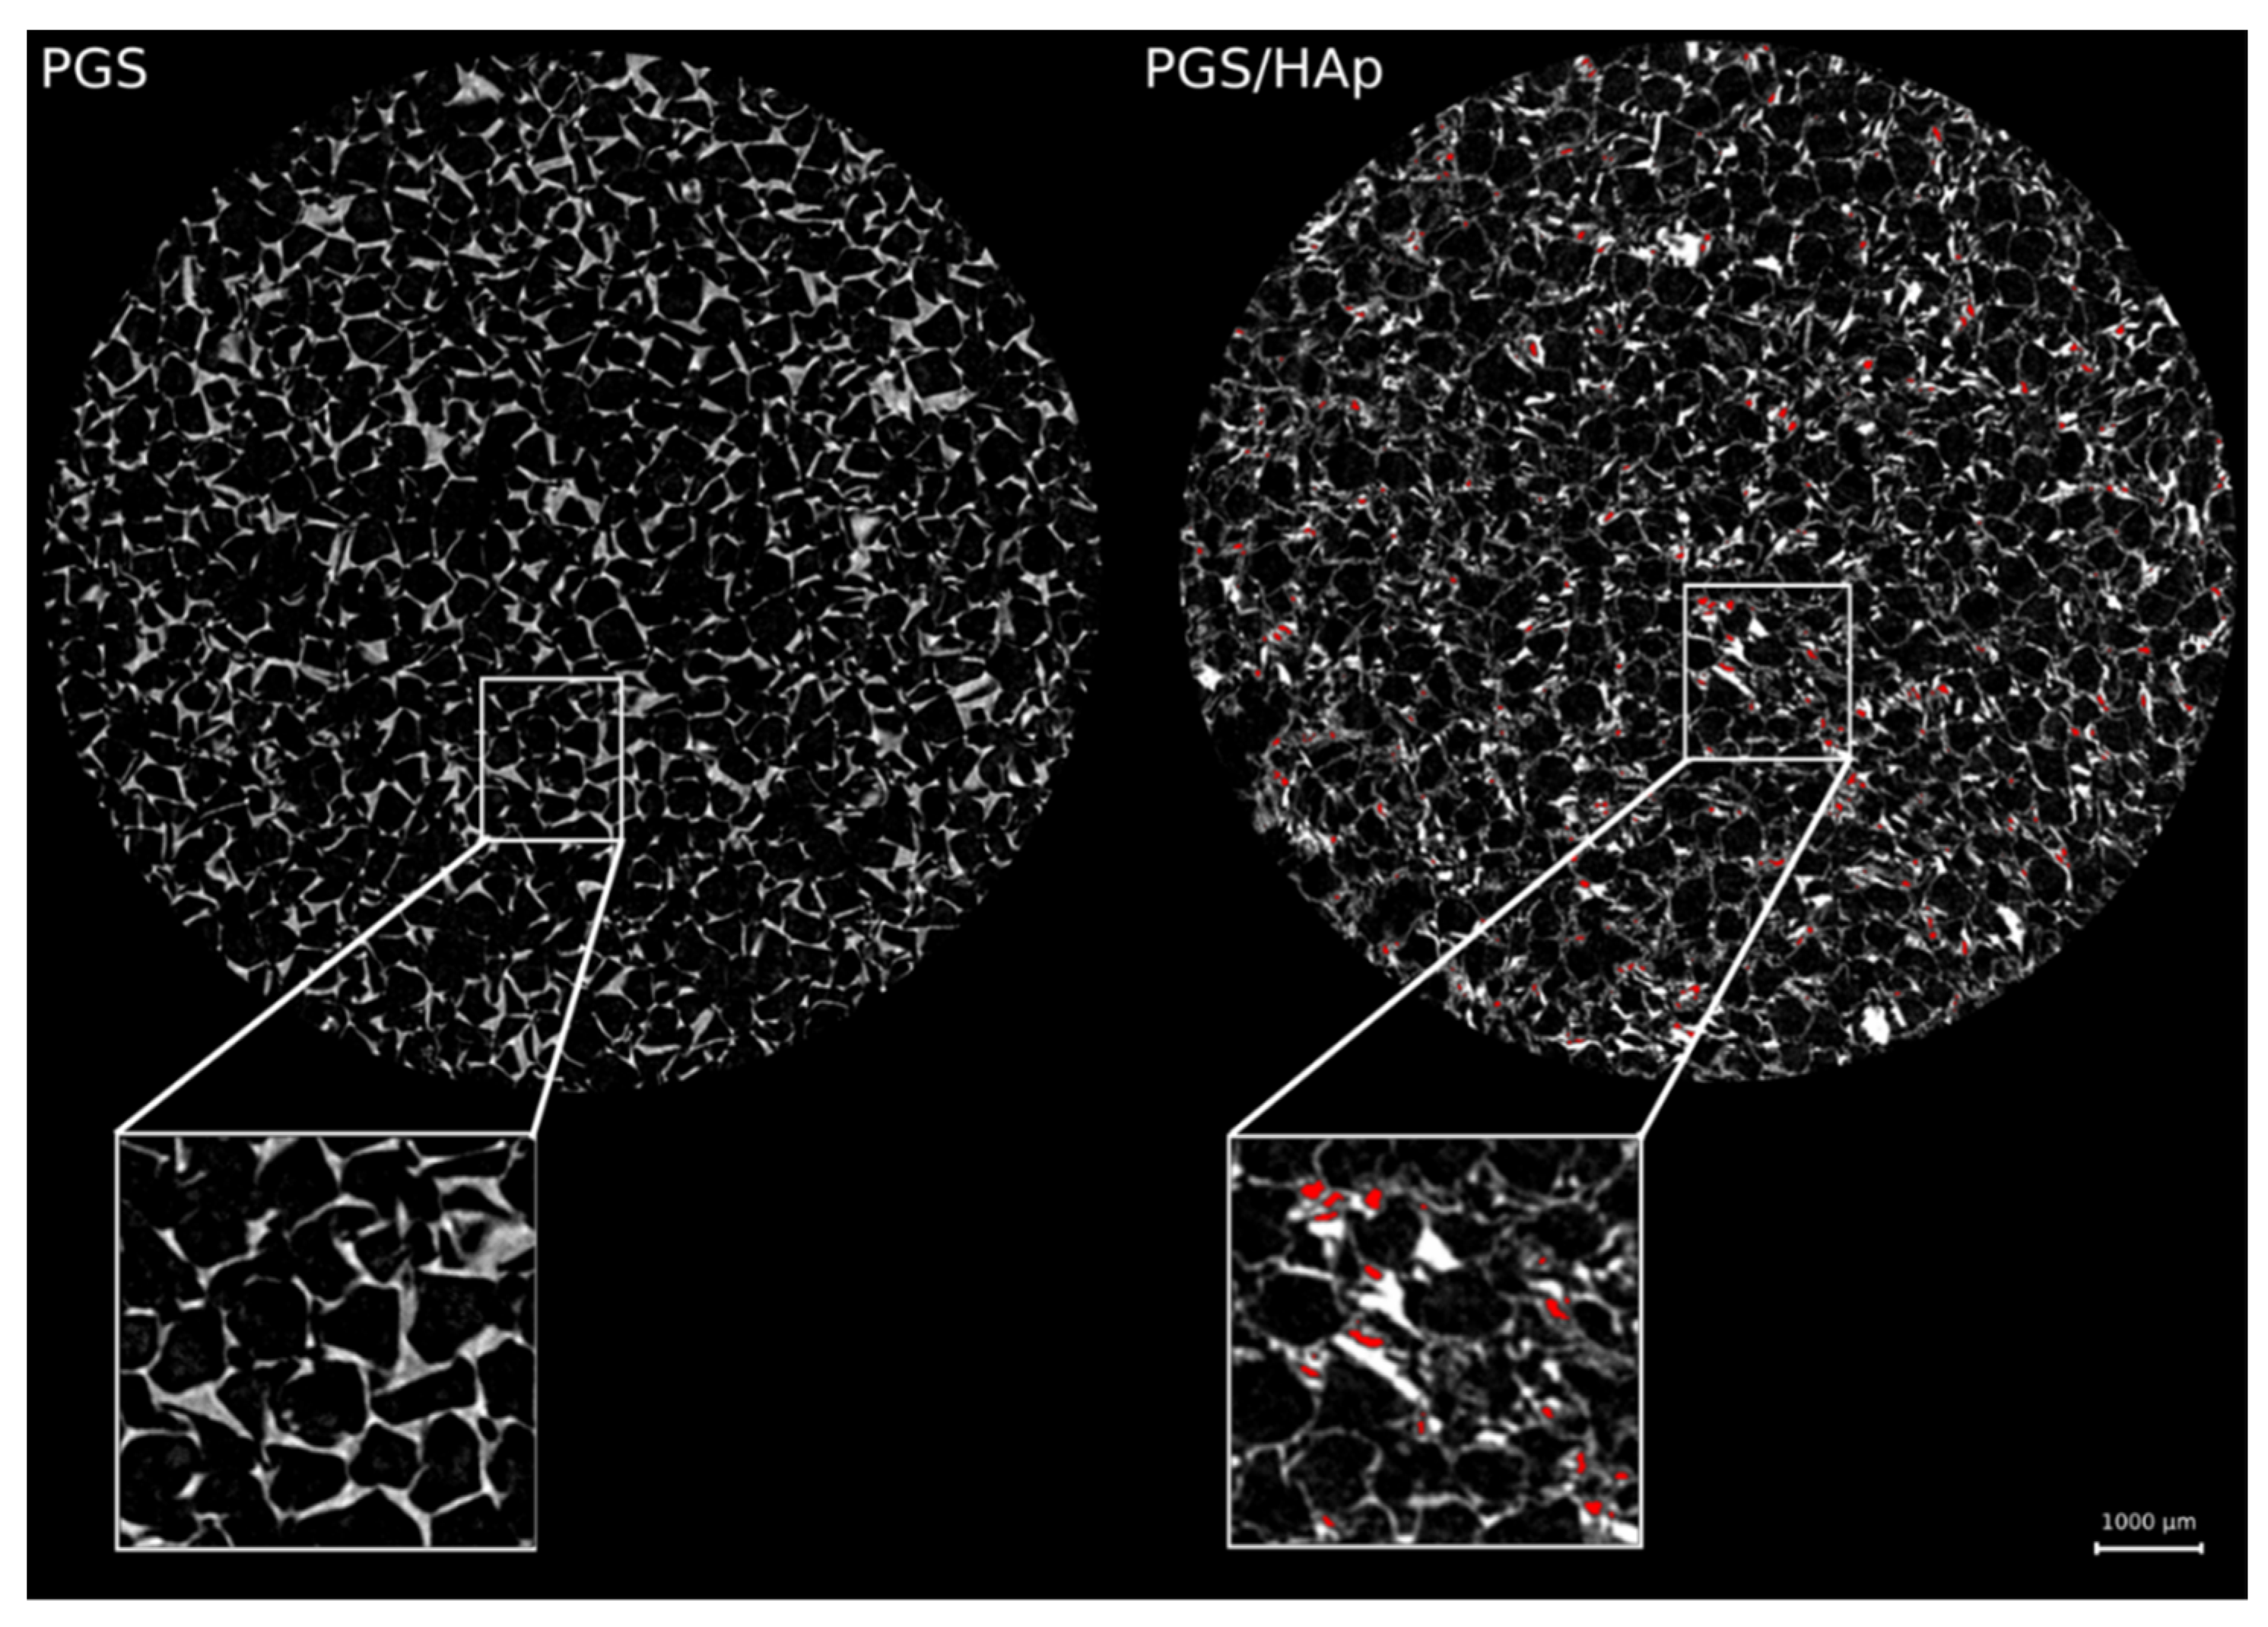
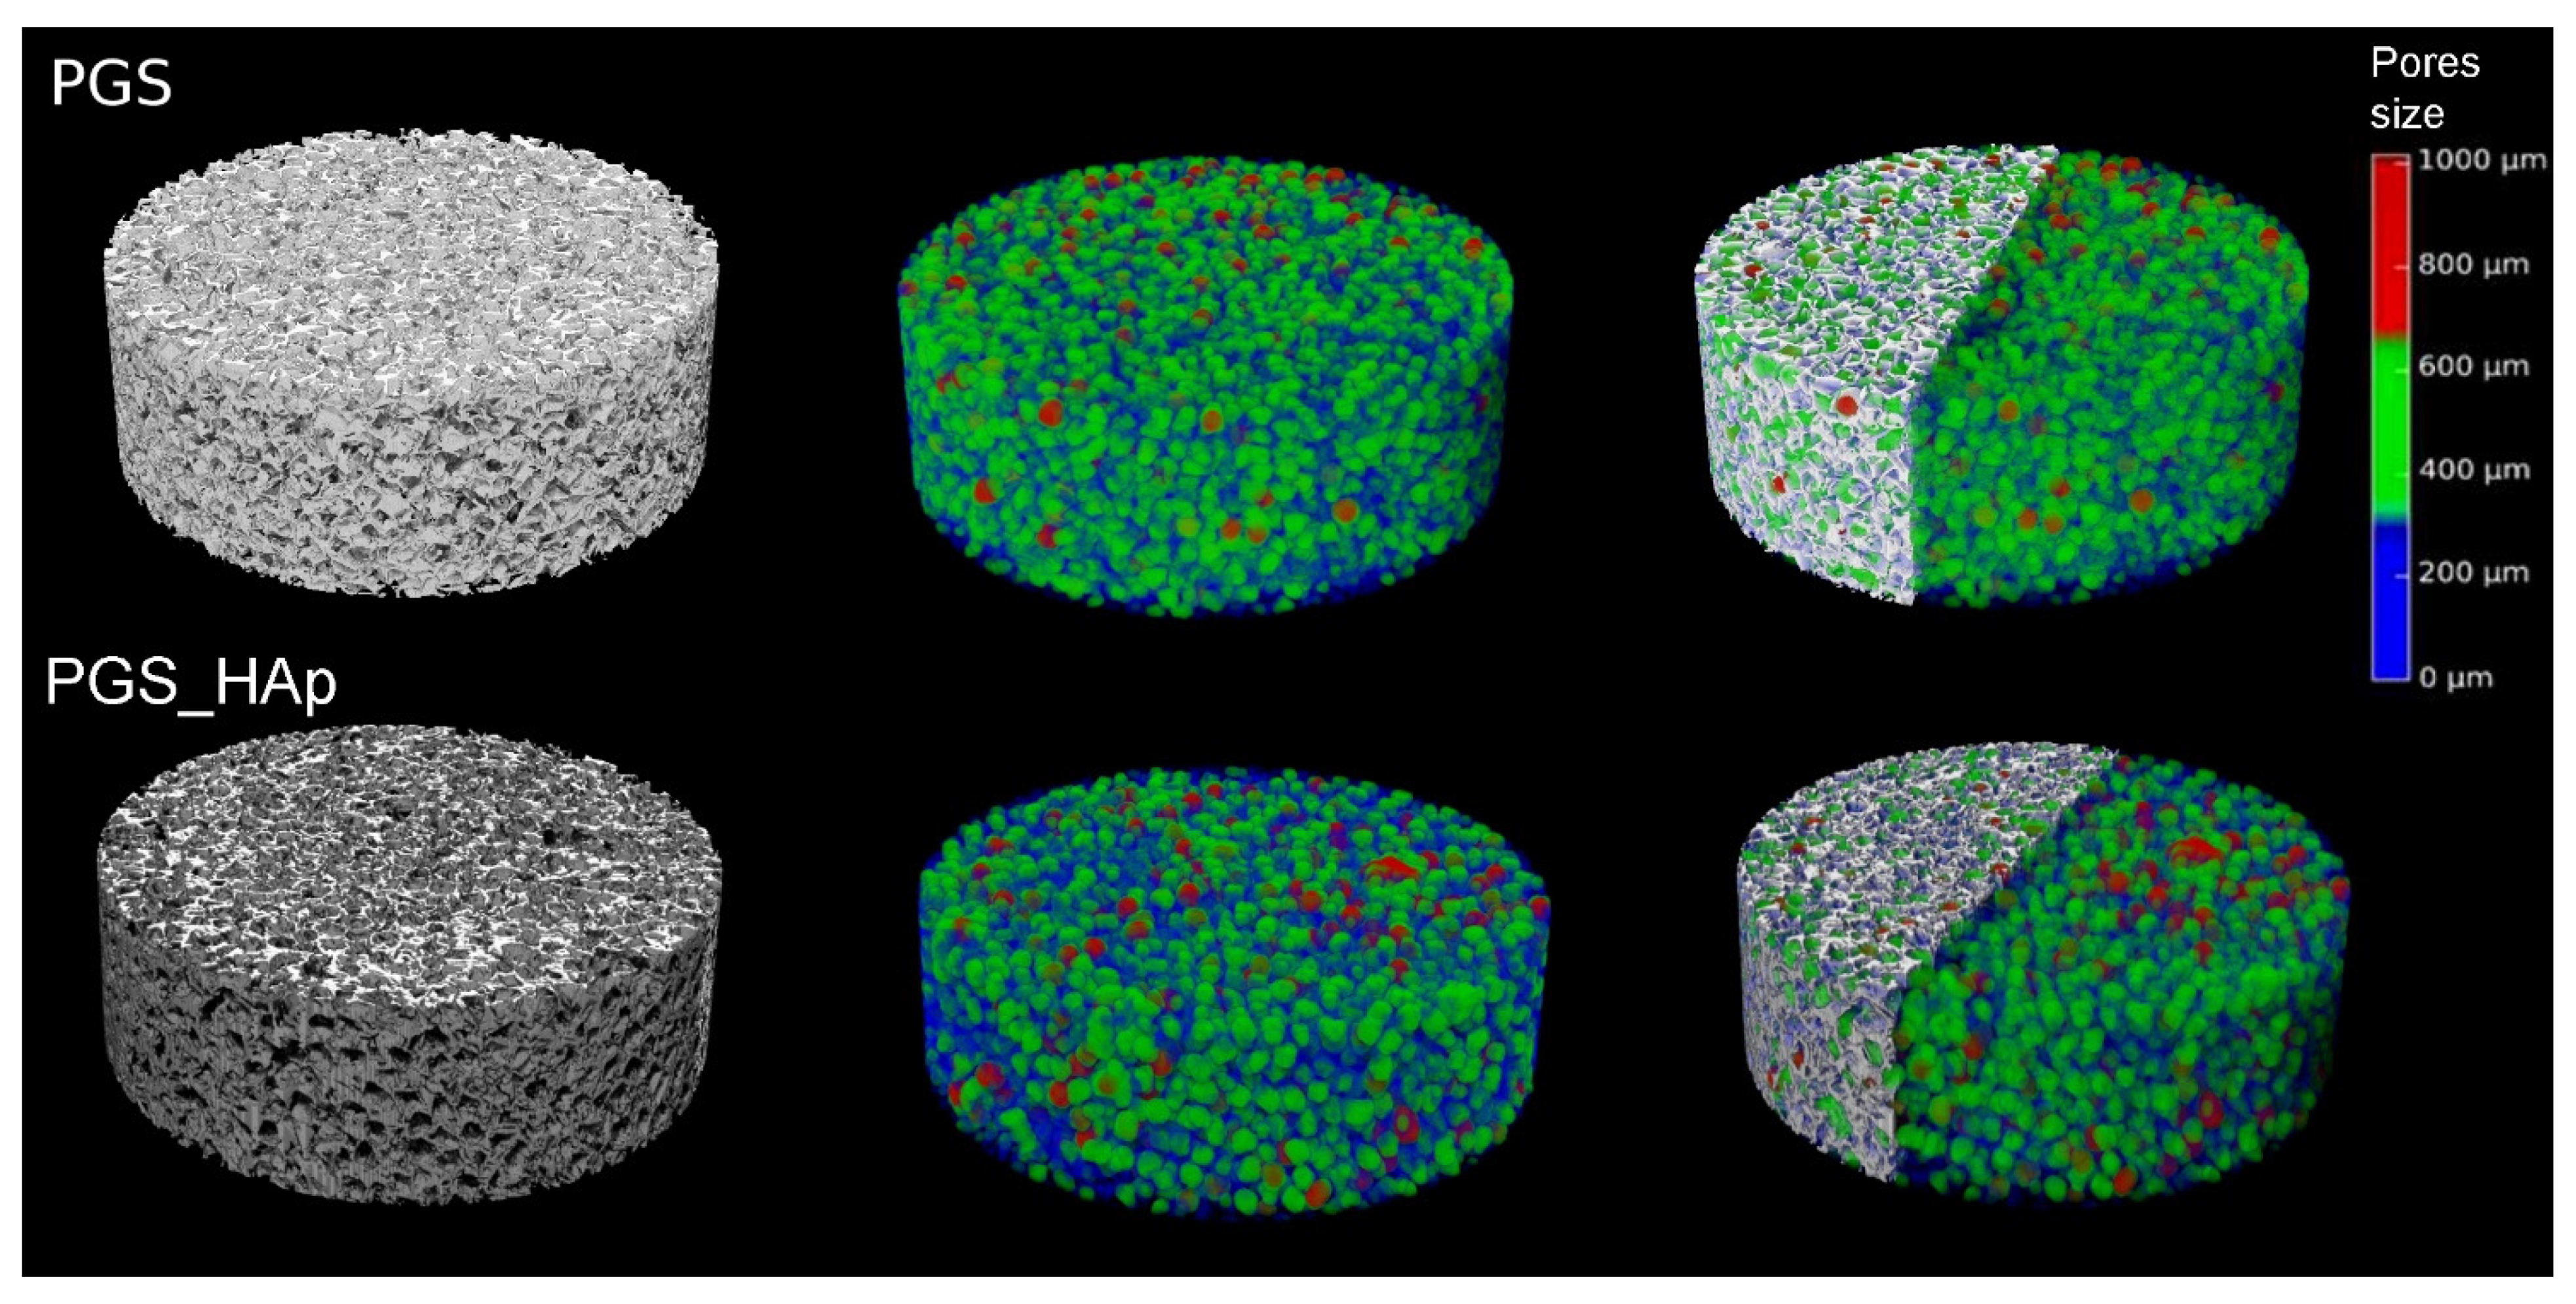
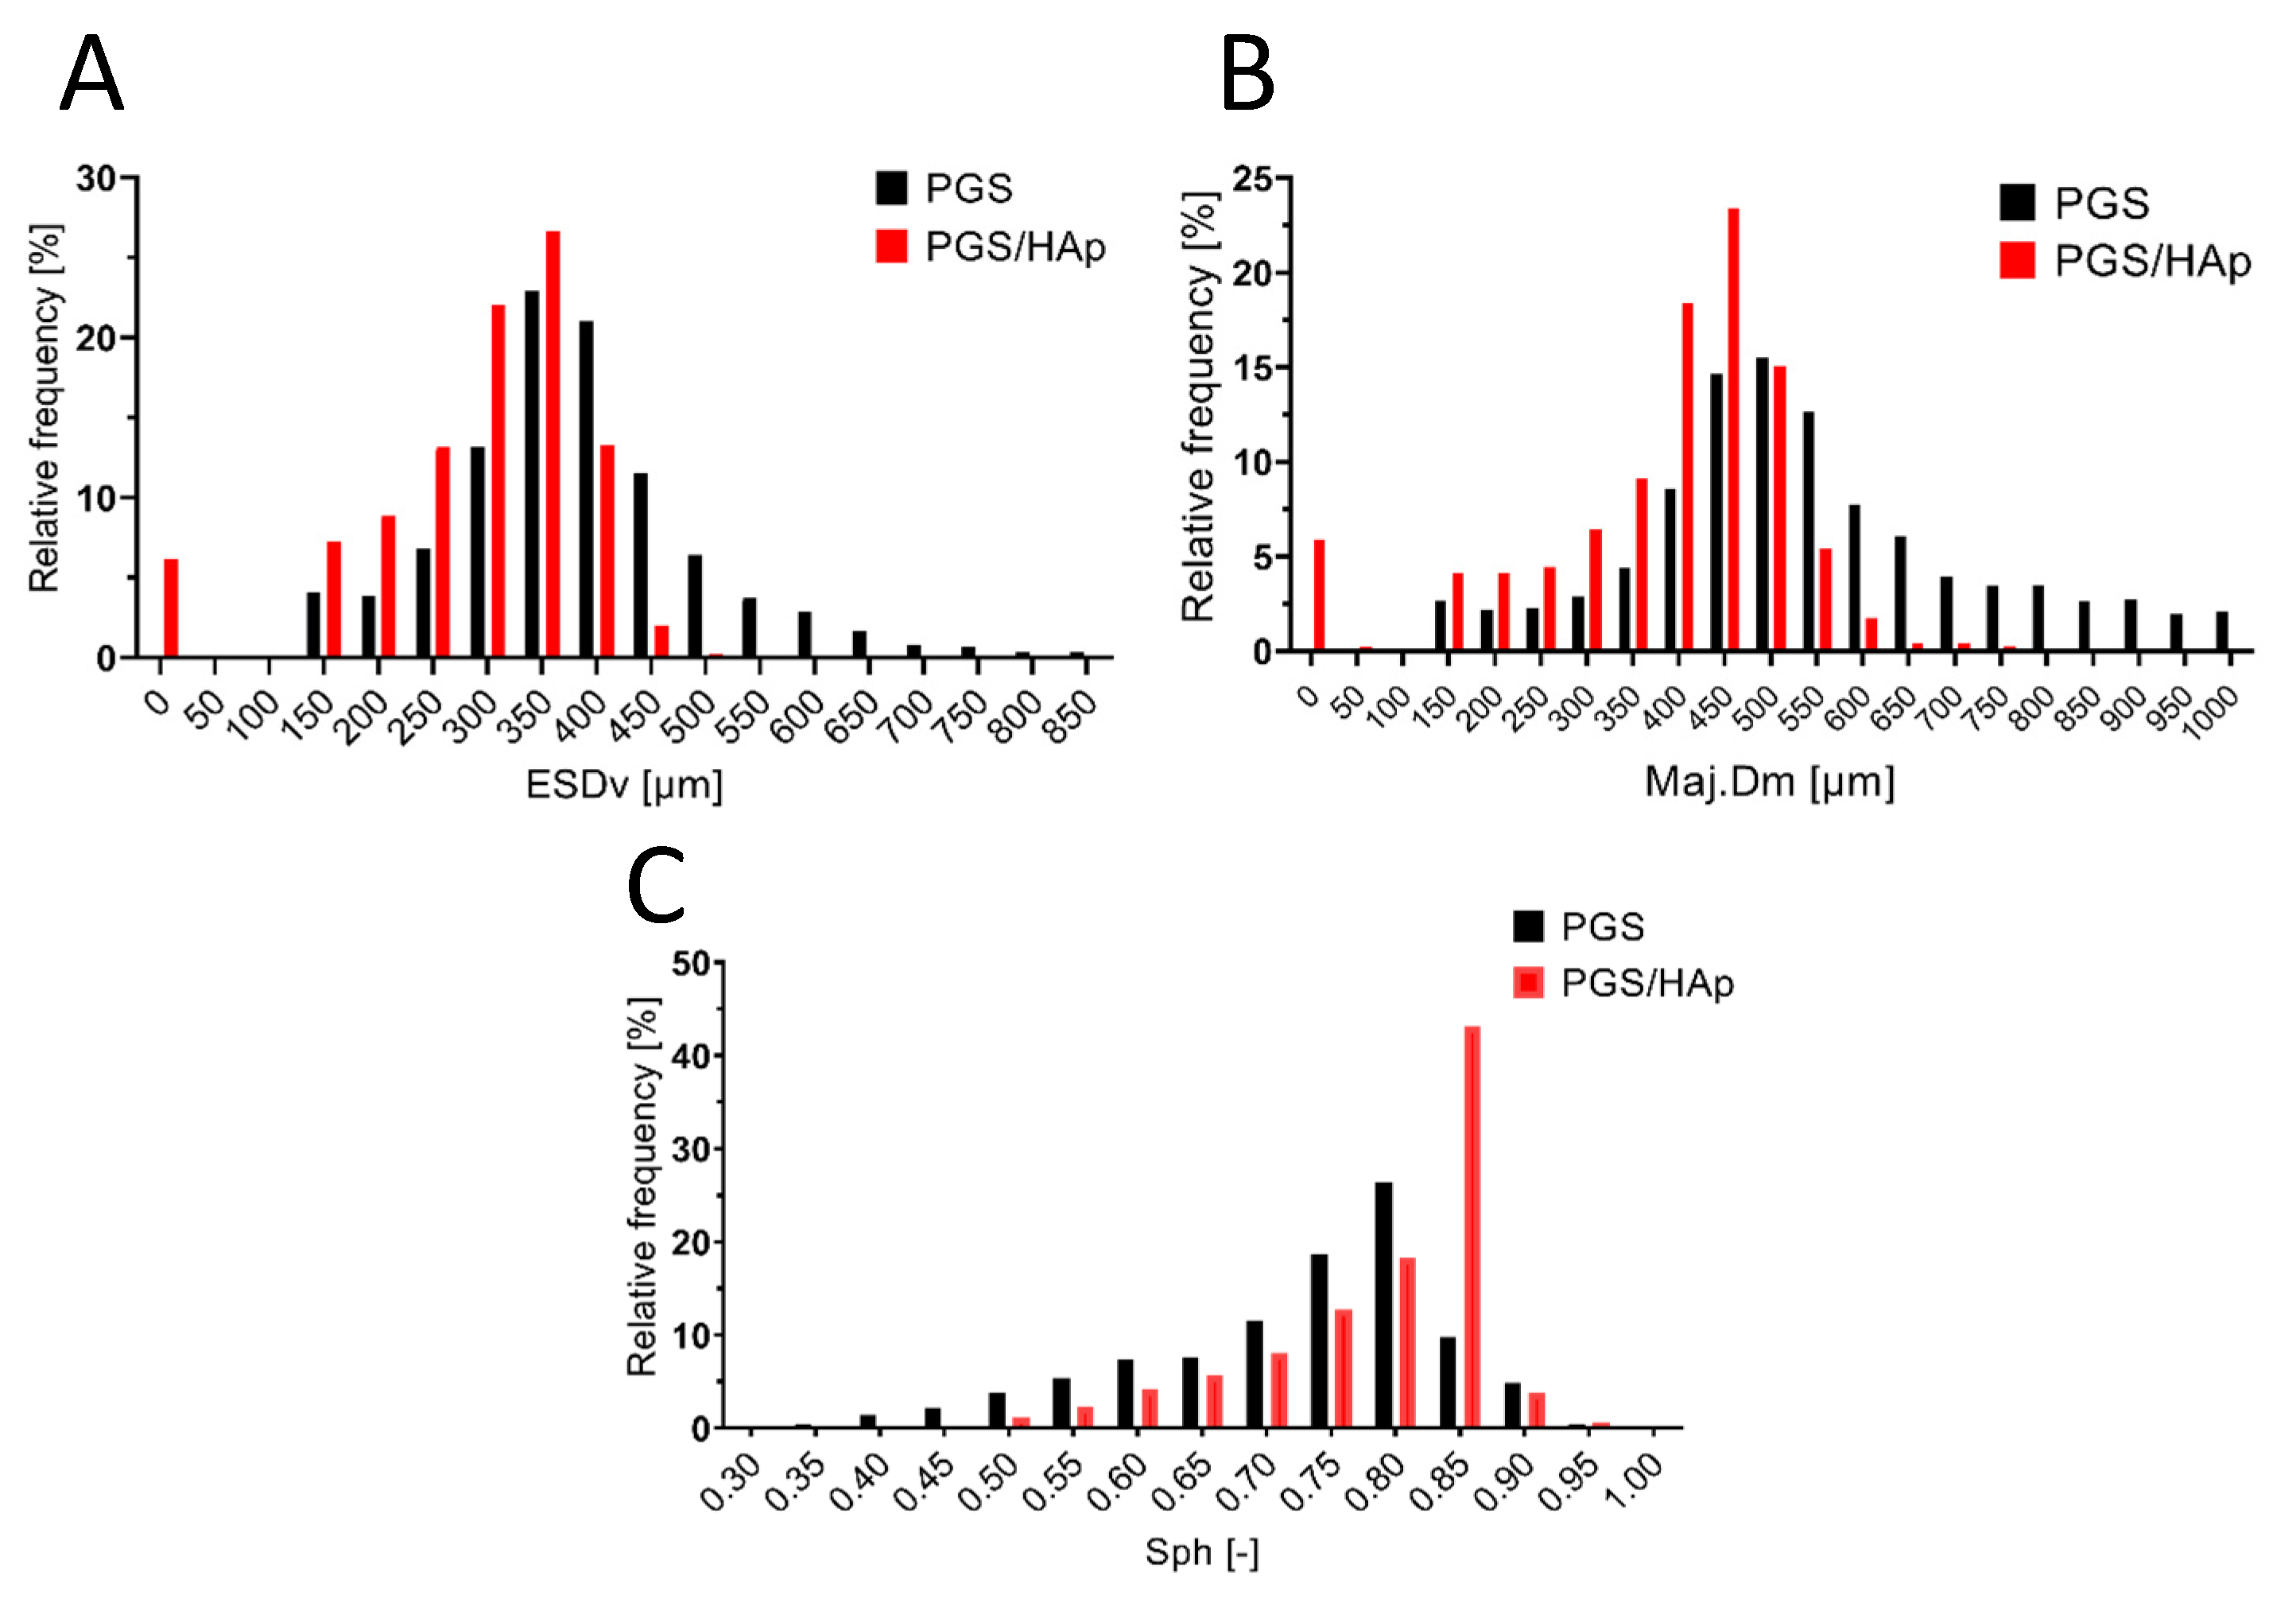
2.2. PGS/HAp Scaffold Structure and Morphology
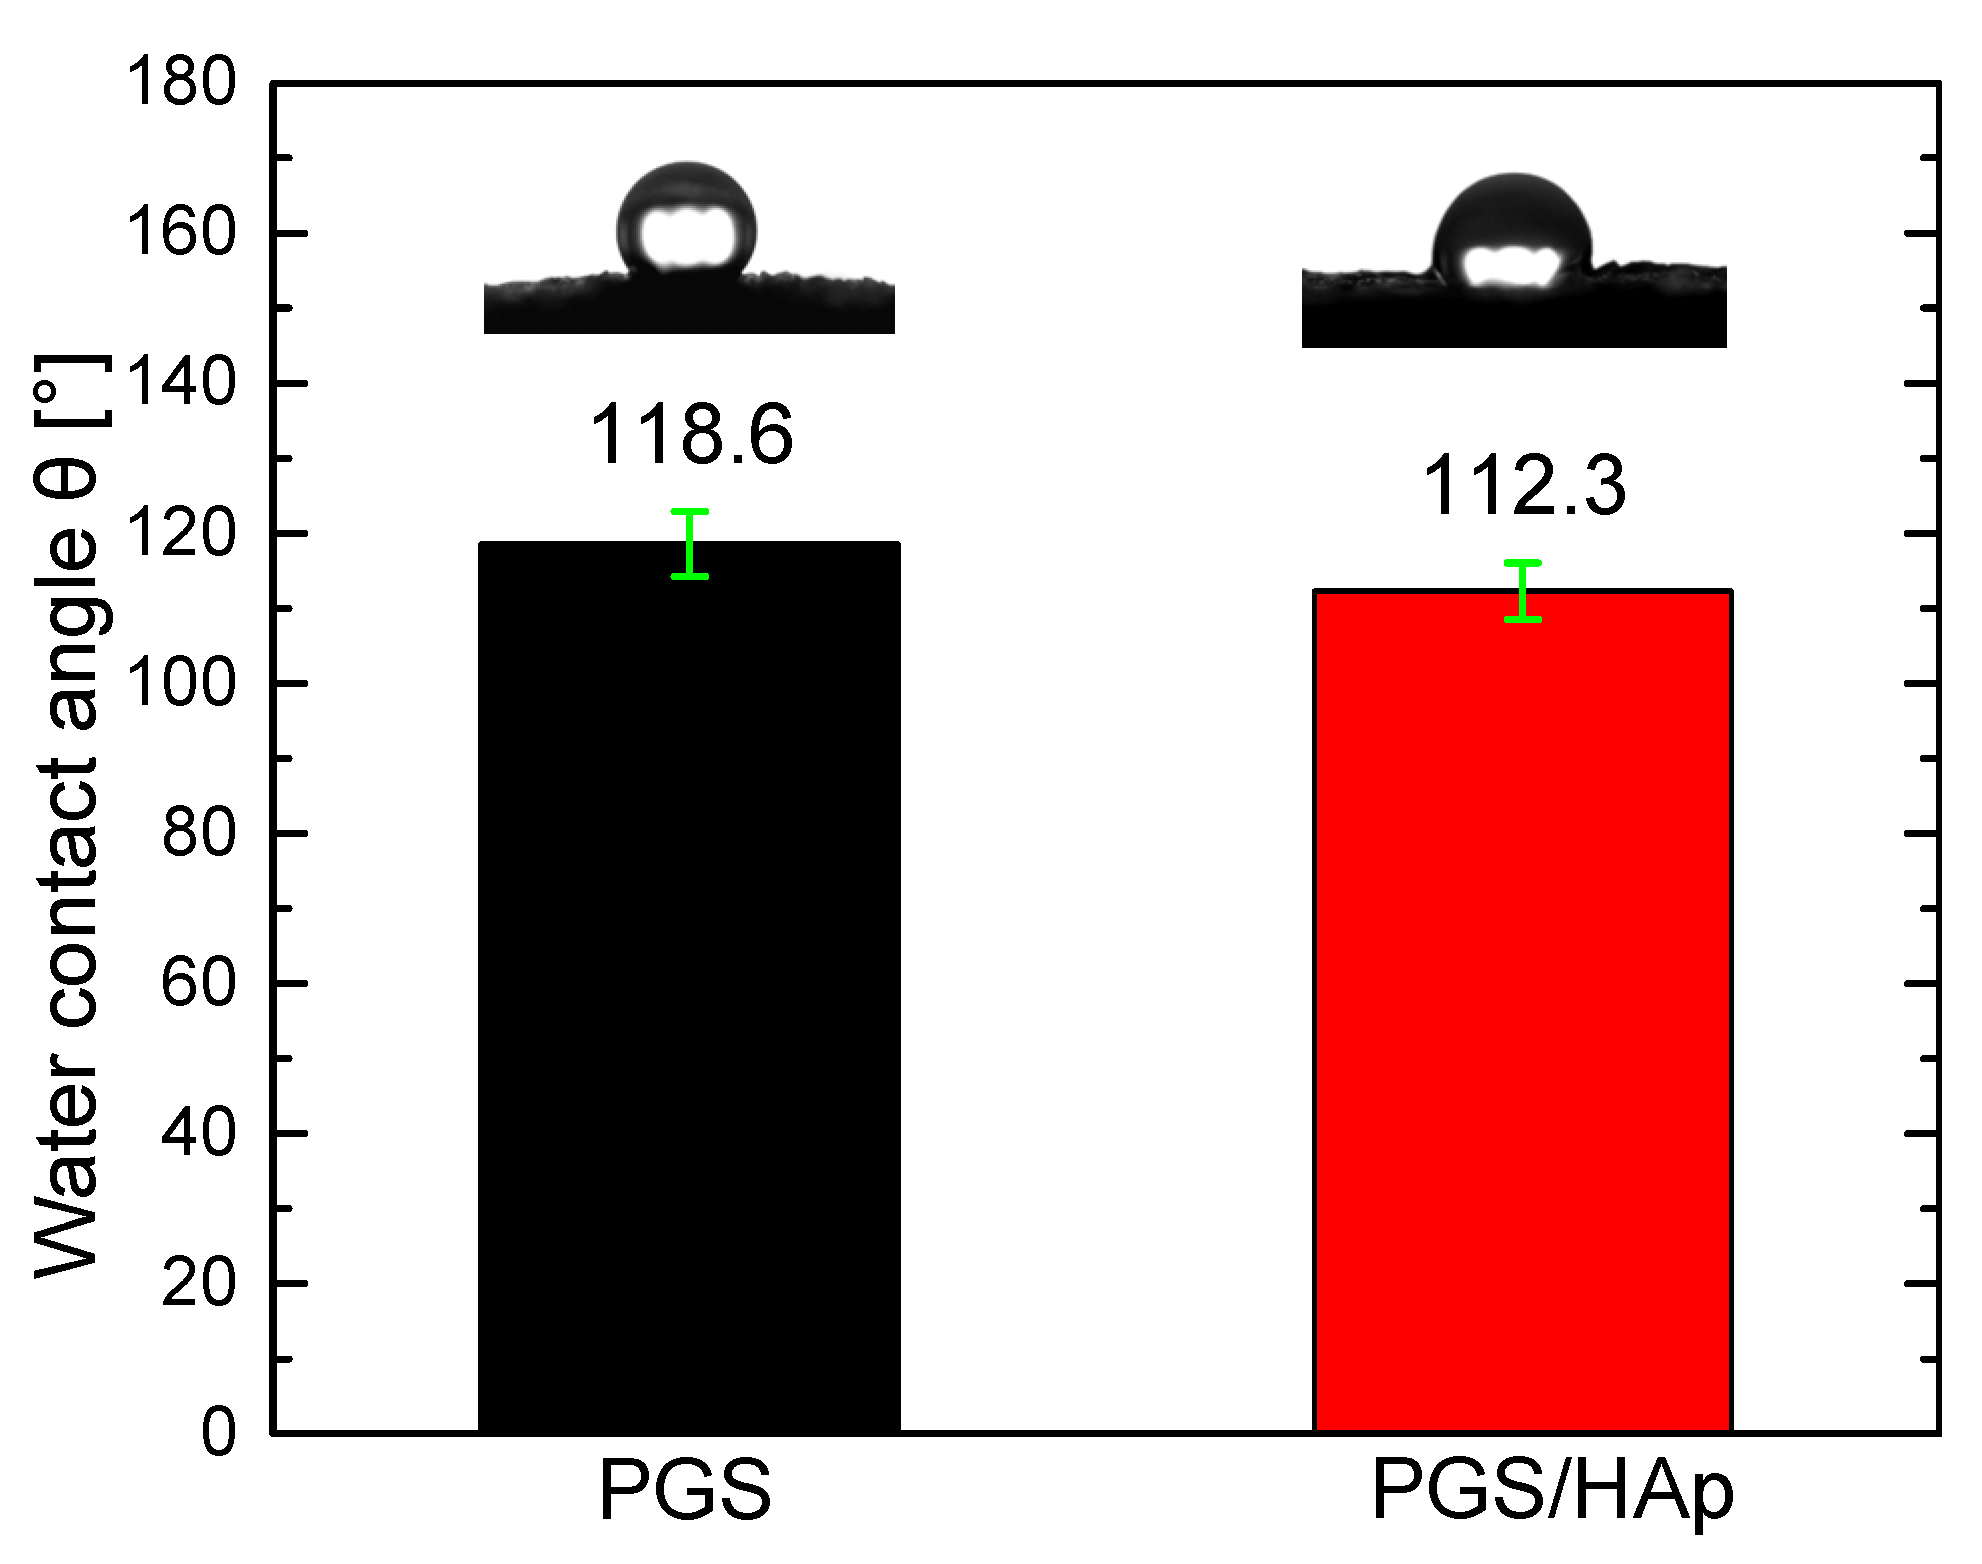
2.3. Scaffolds Contact Angle
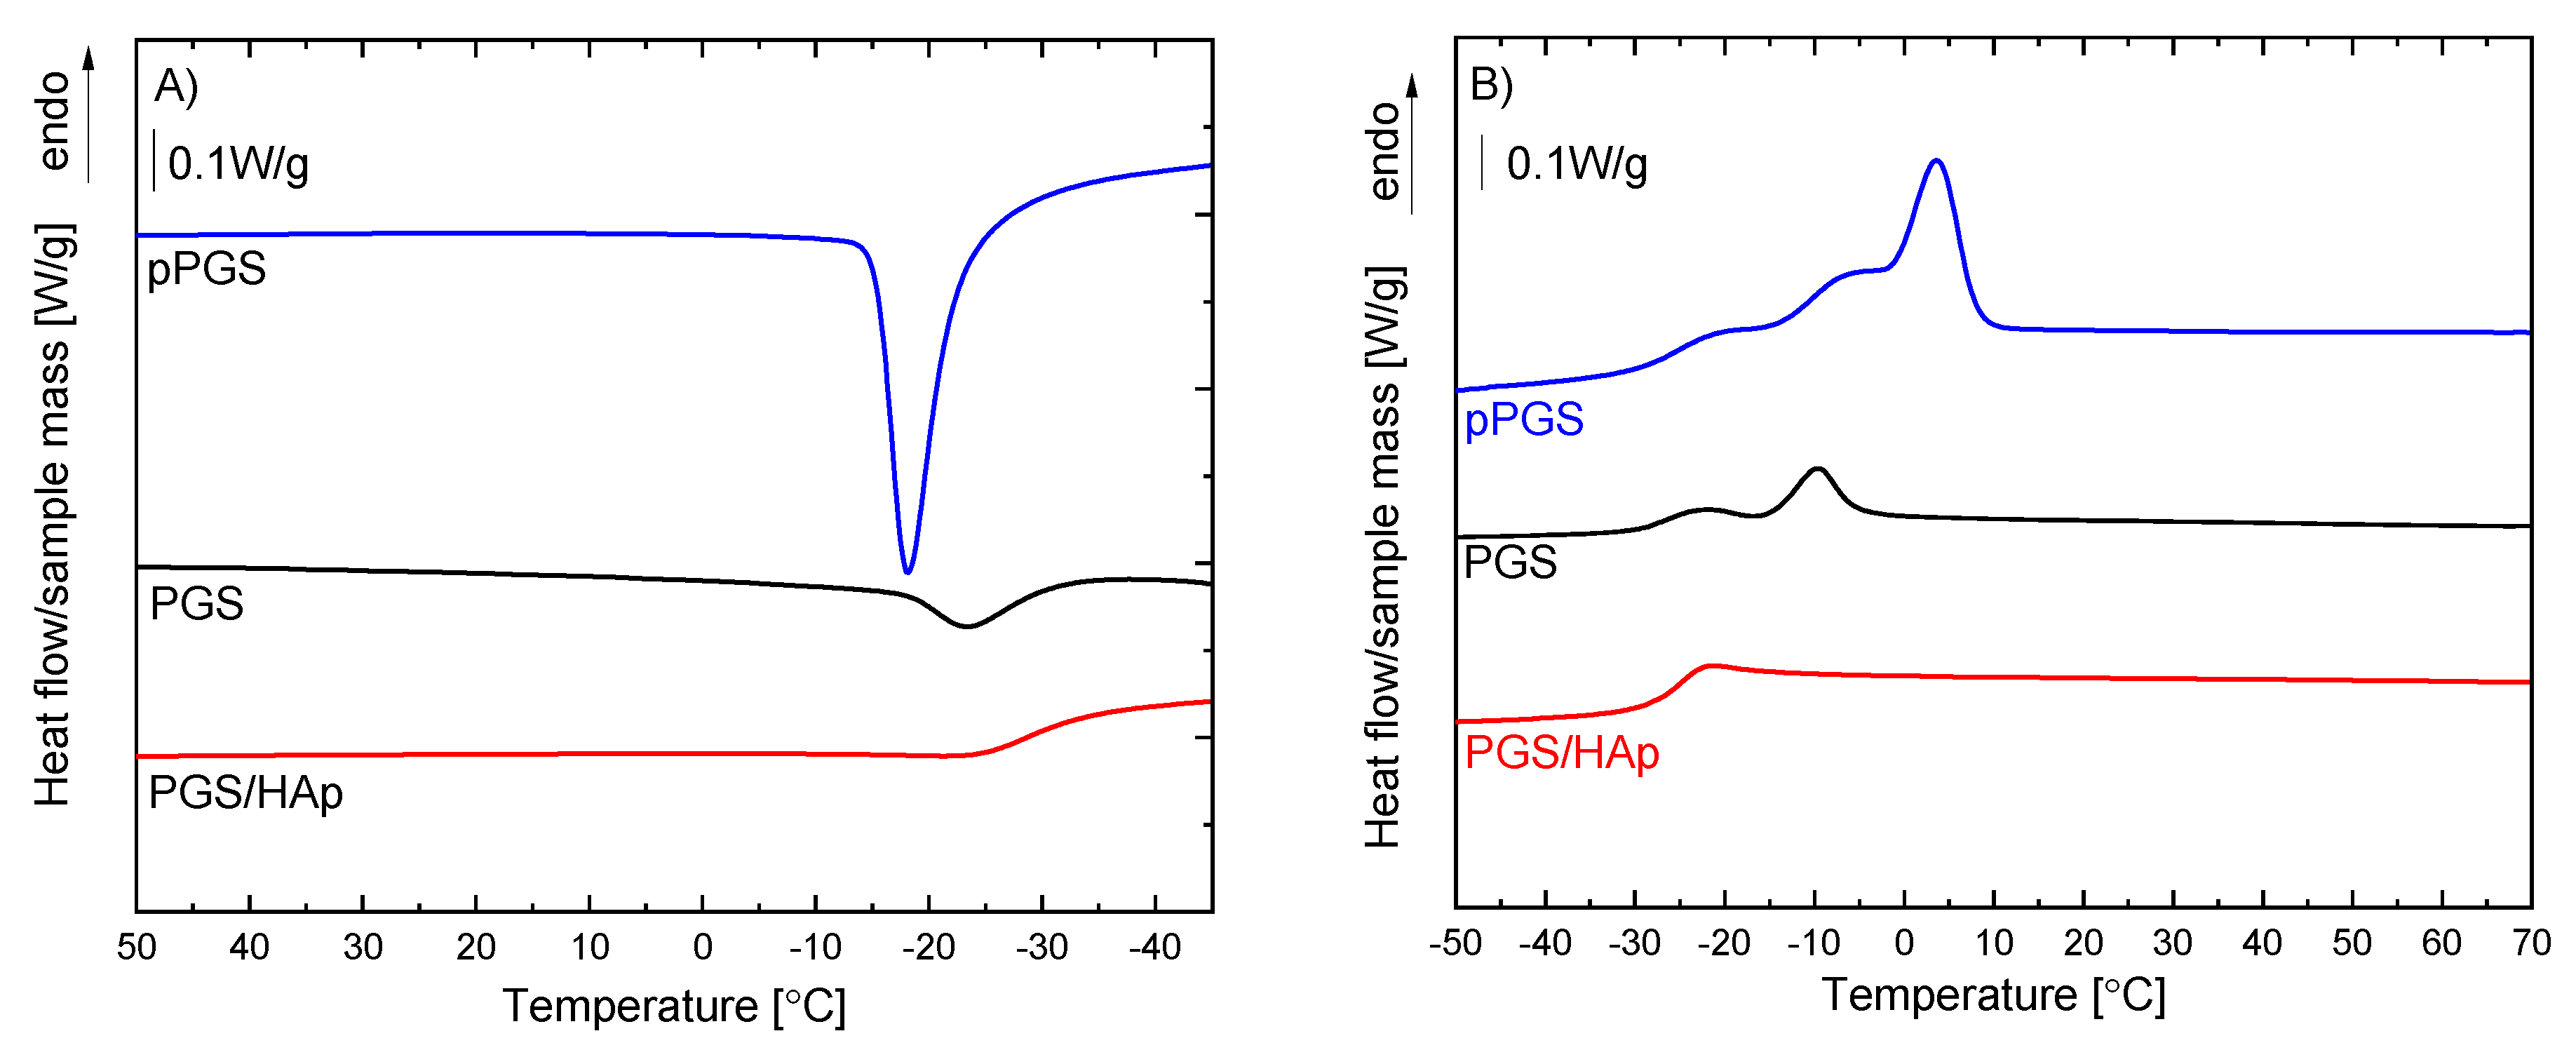
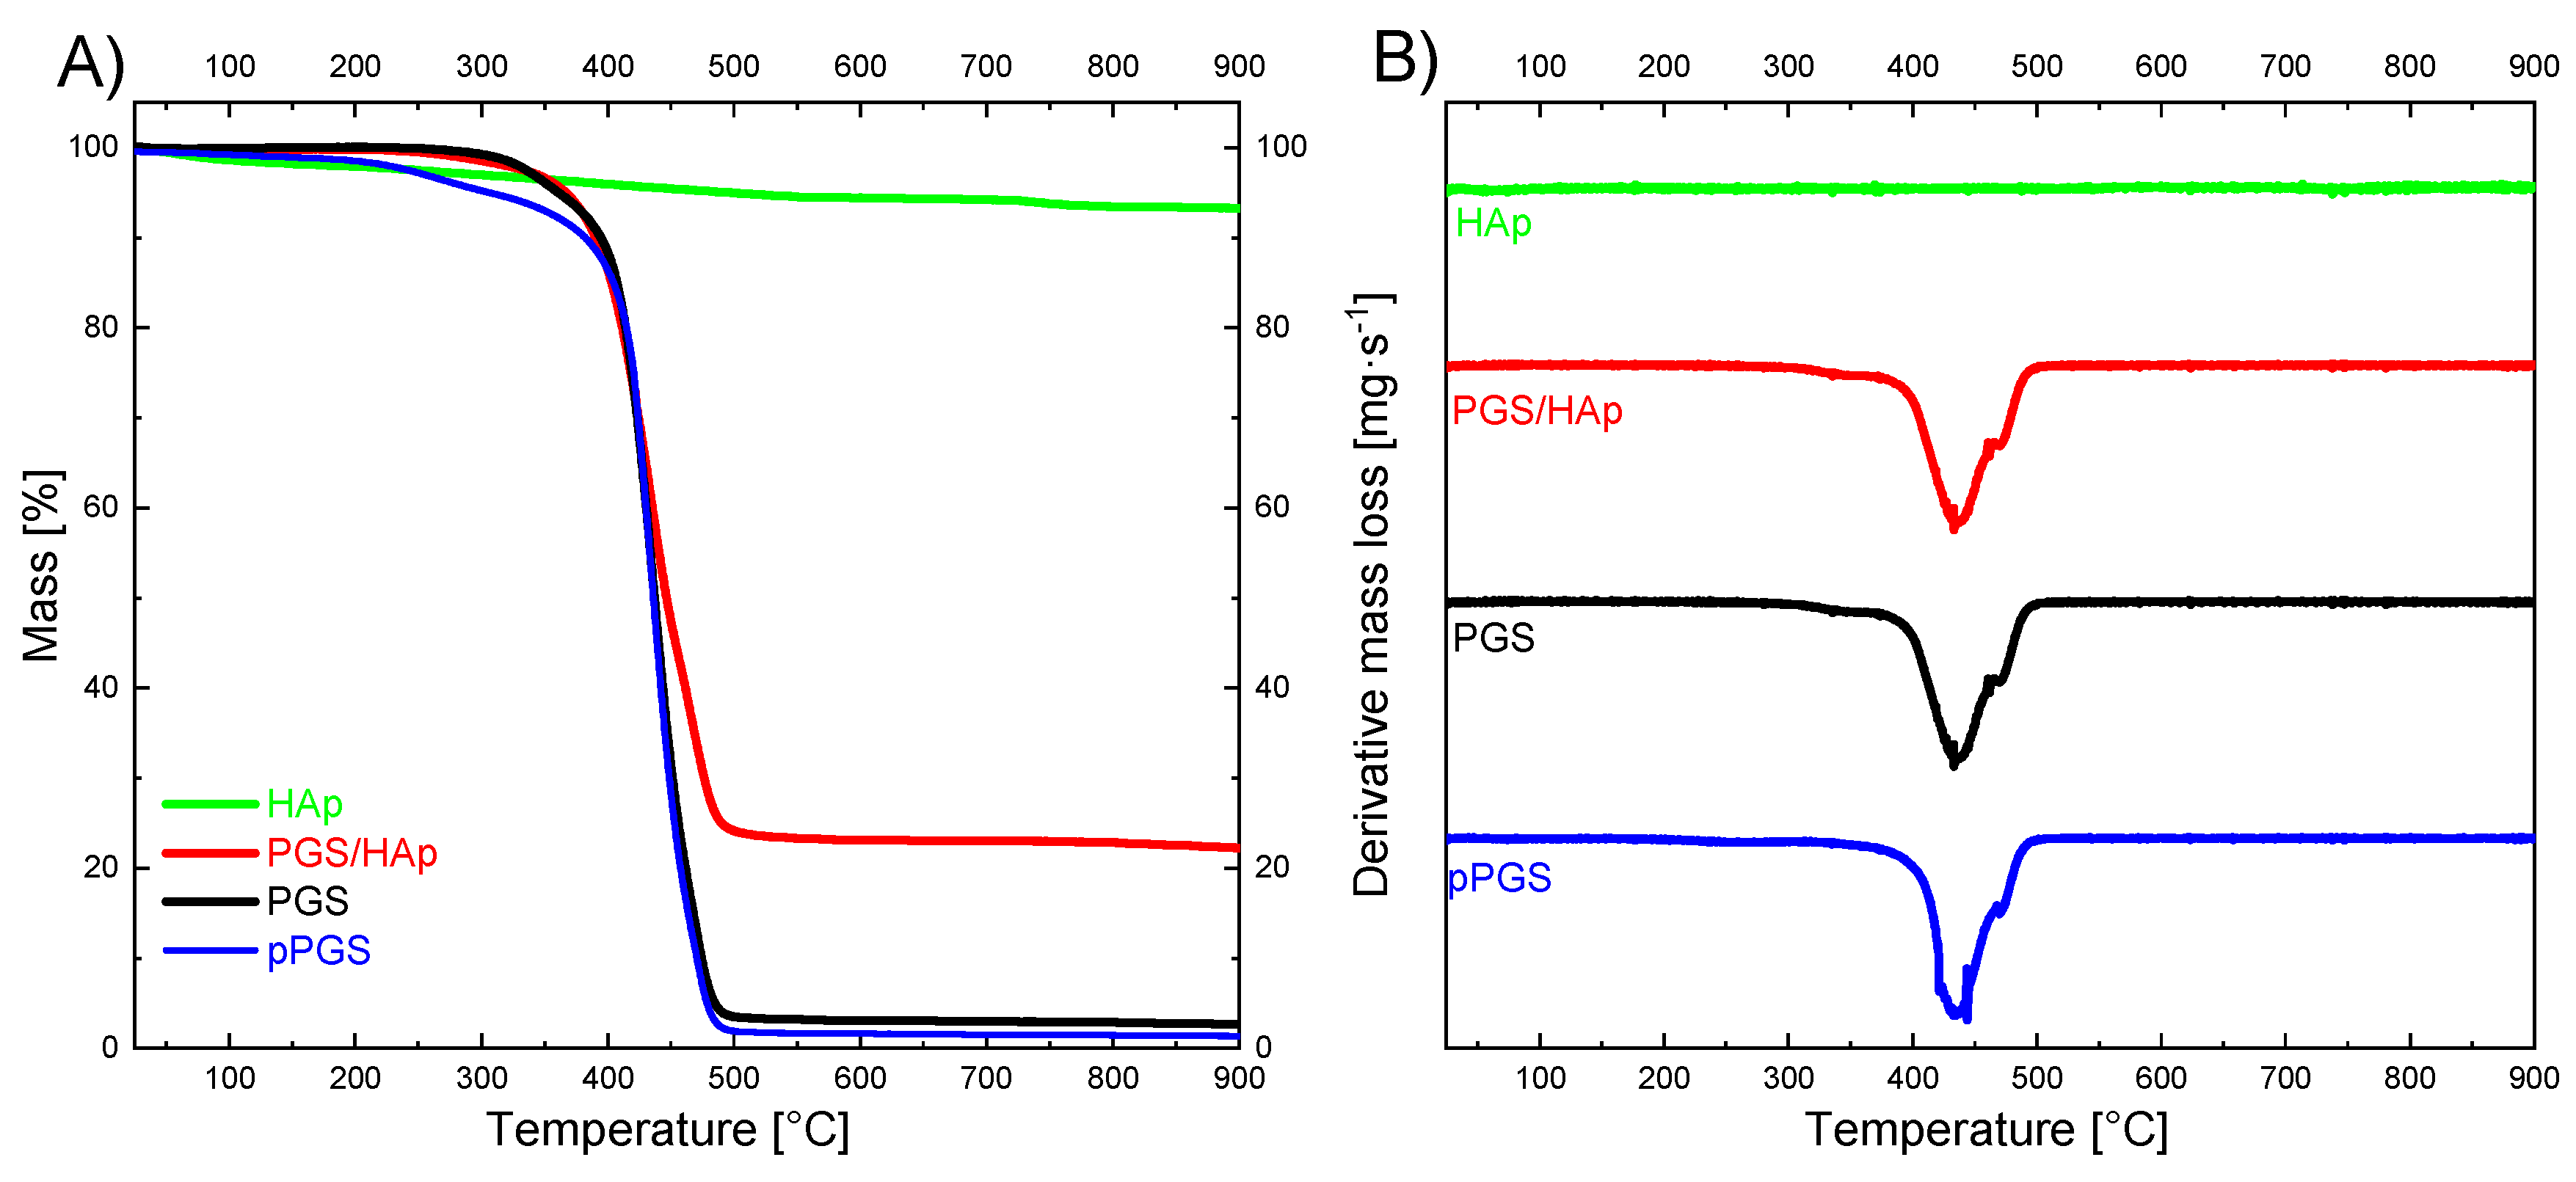
2.4. Scaffolds Thermal Analysis
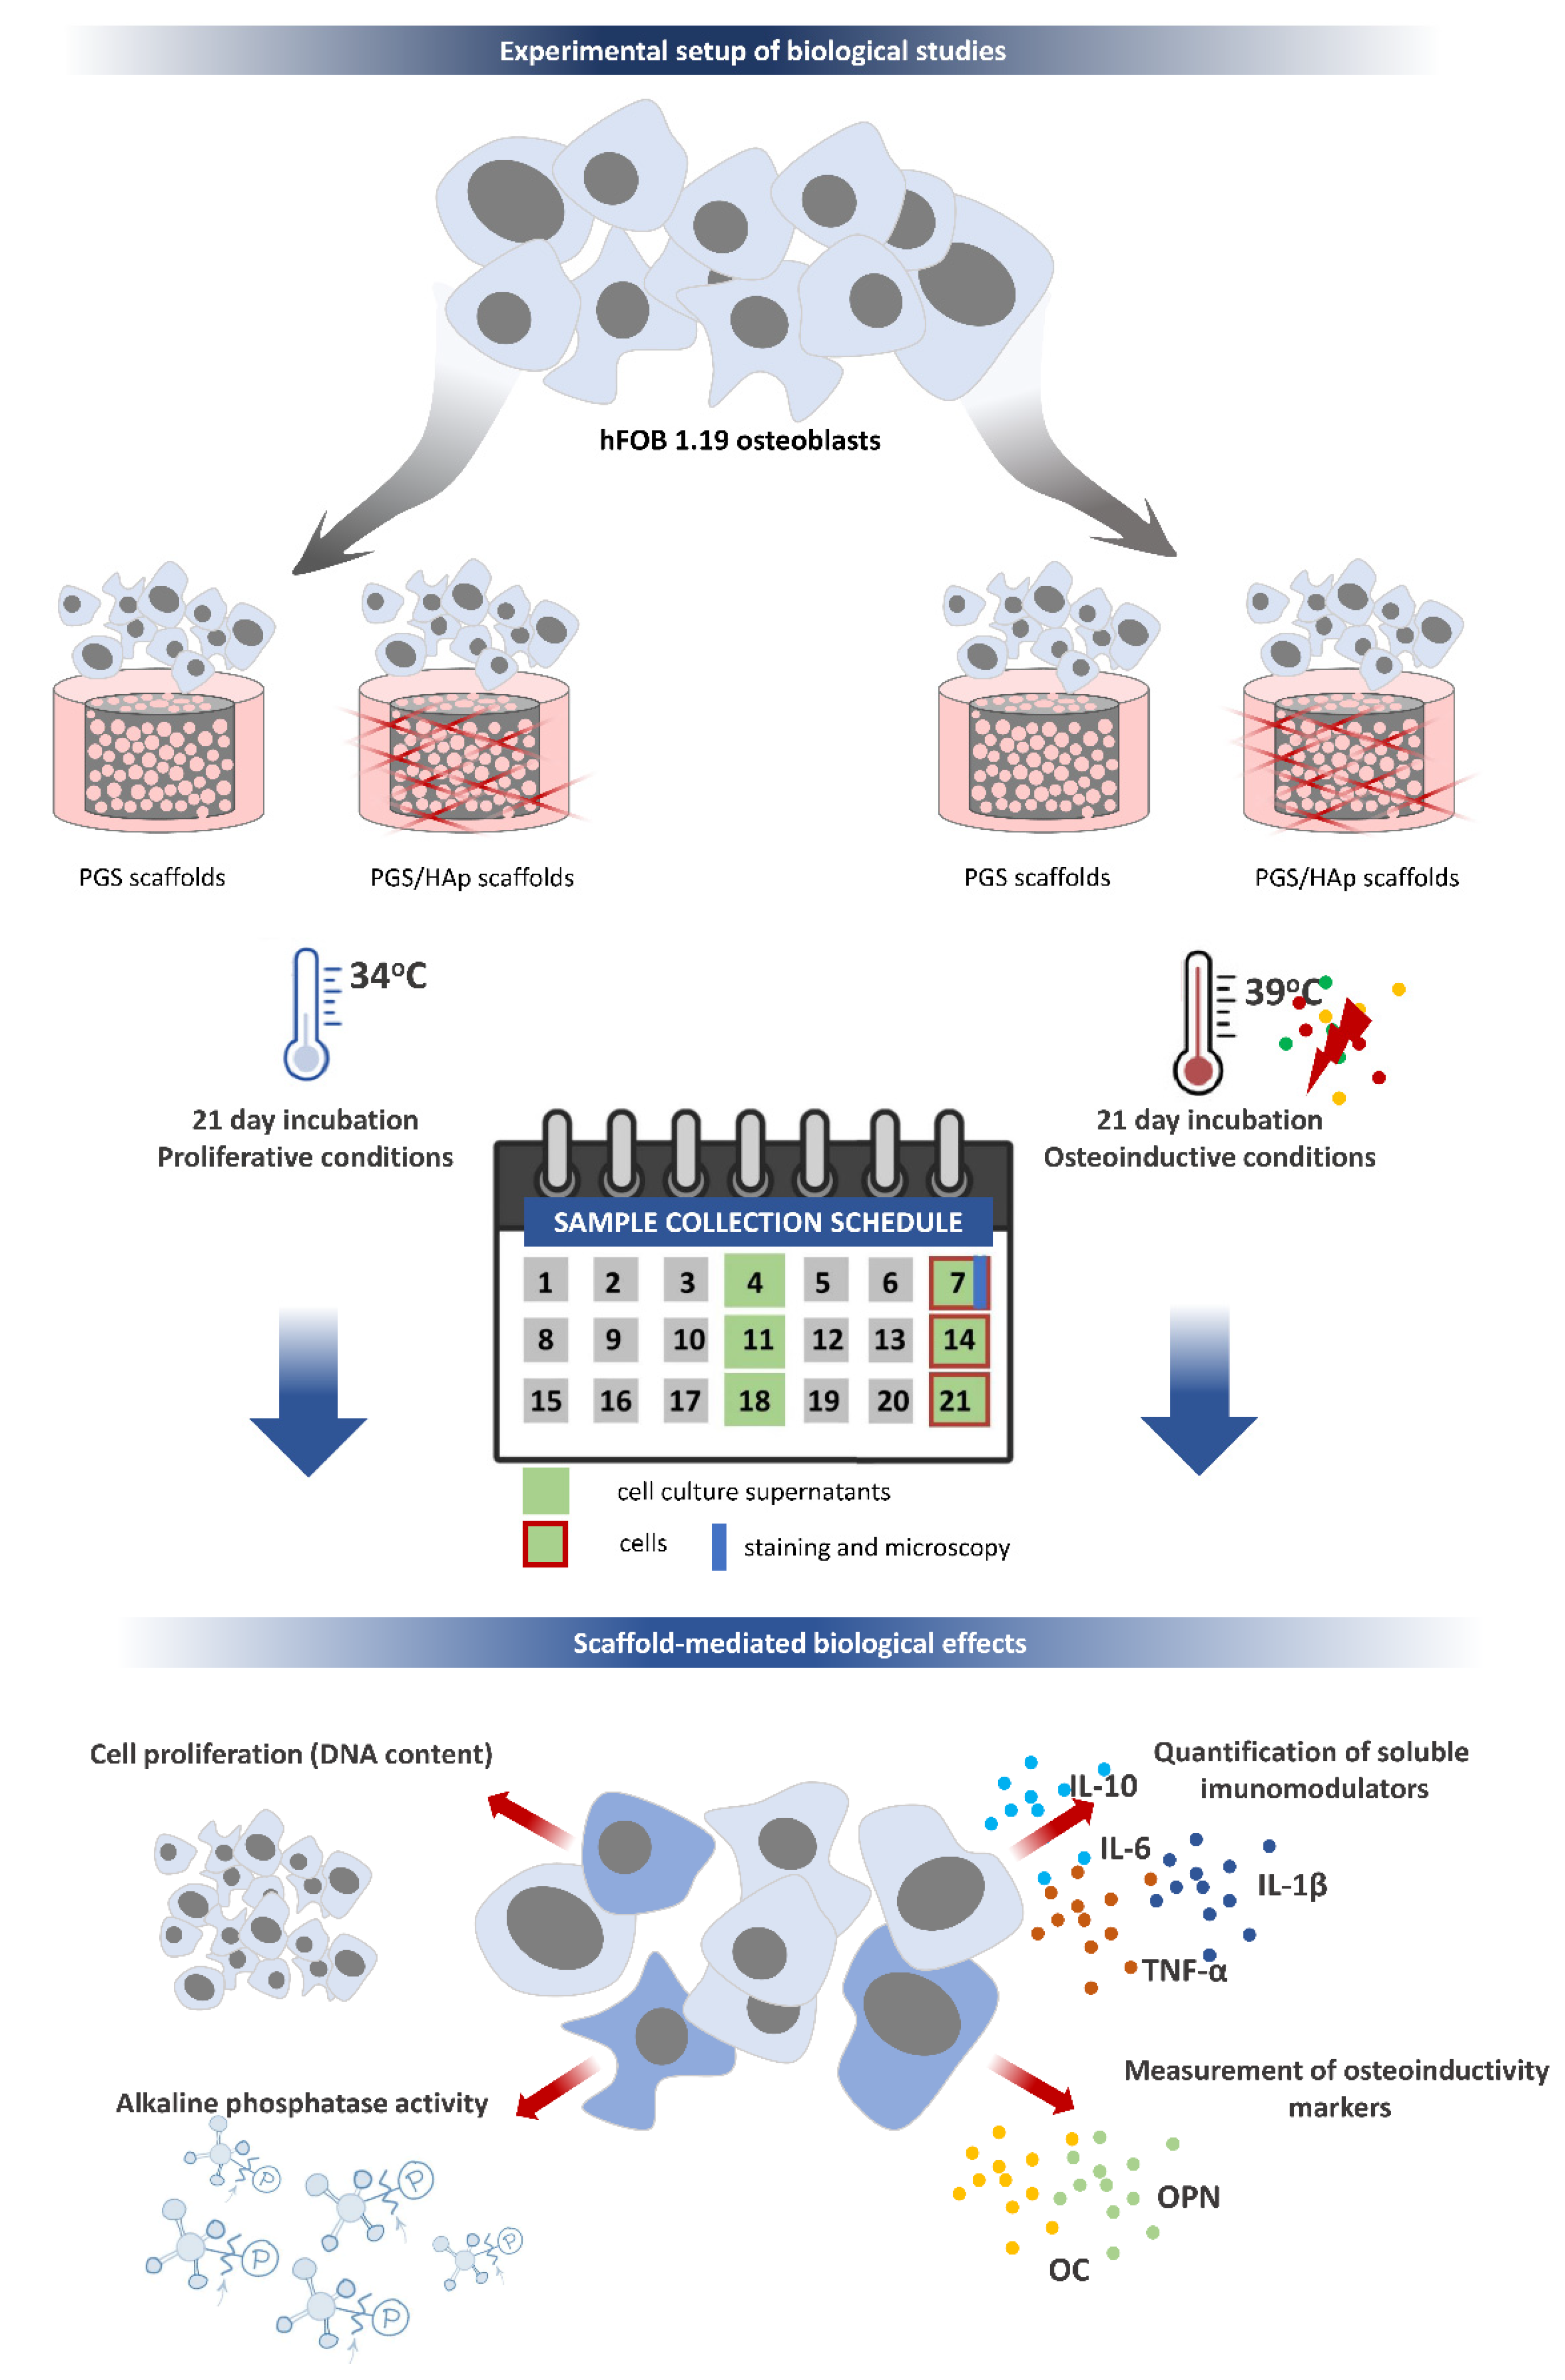
2.5. Cytocompatibility and Osteoconductivity
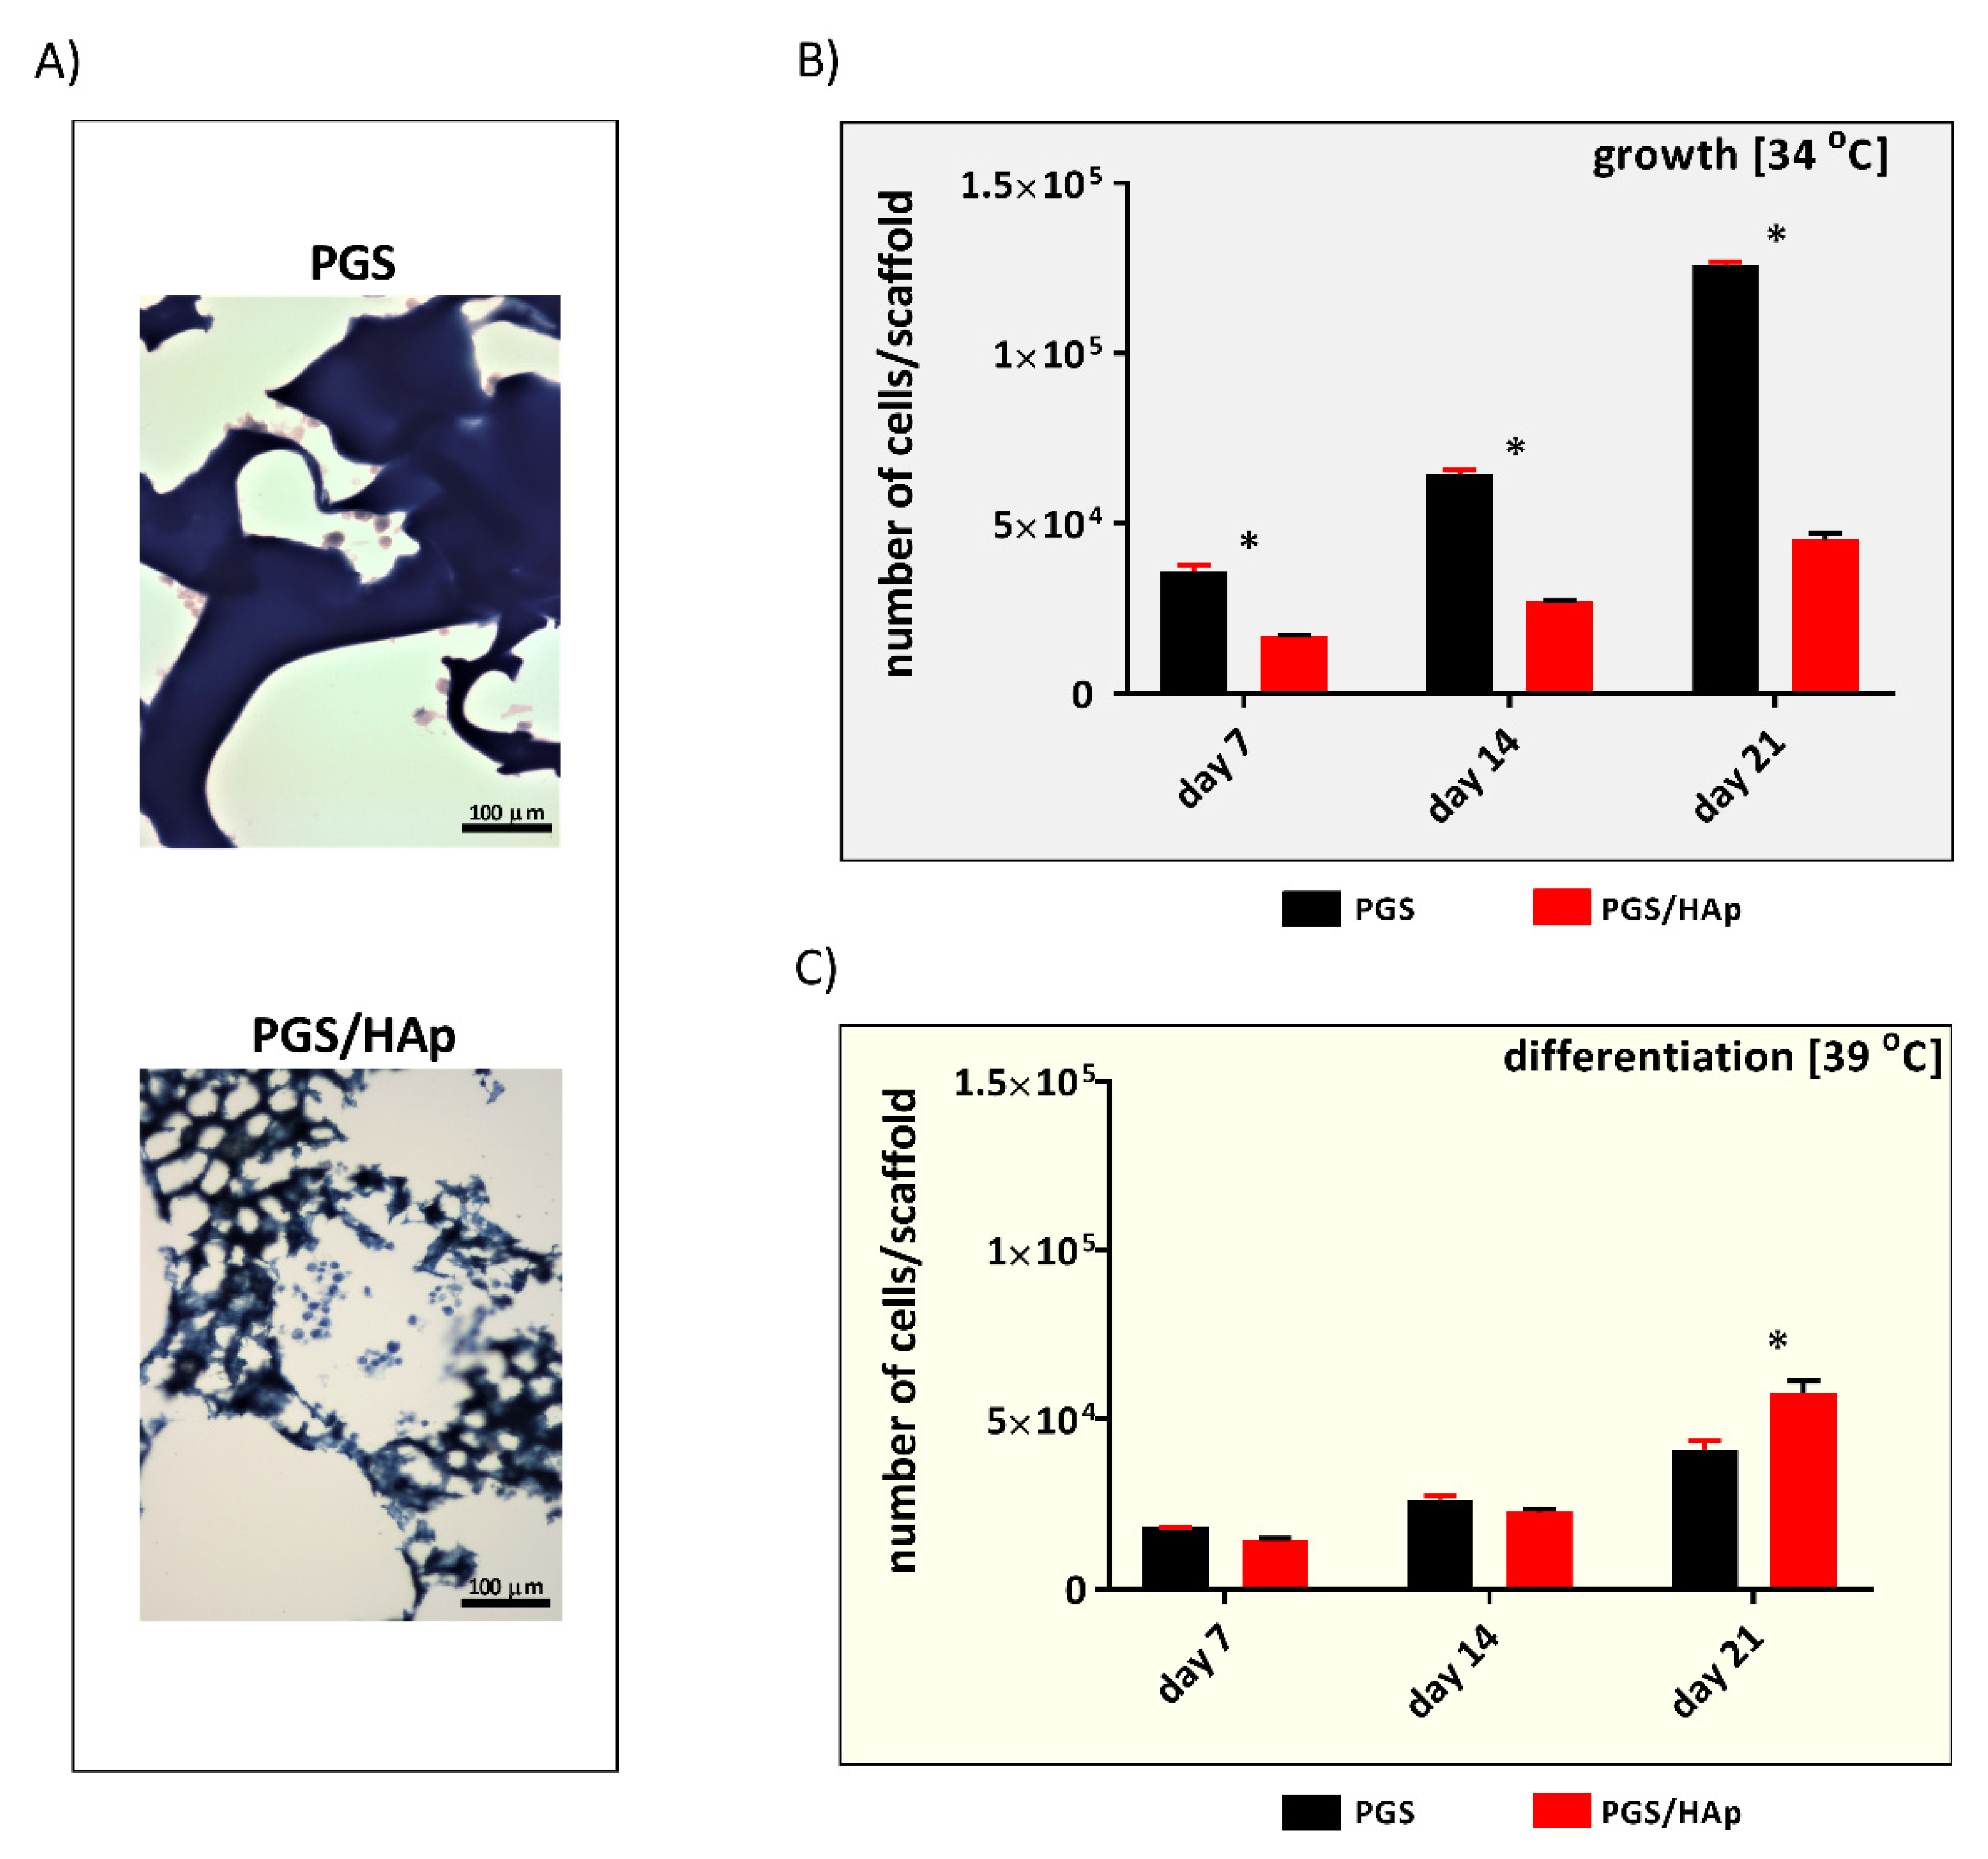
2.5.1. Colonization of Scaffolds
2.5.2. hFOB 1.19 Proliferation
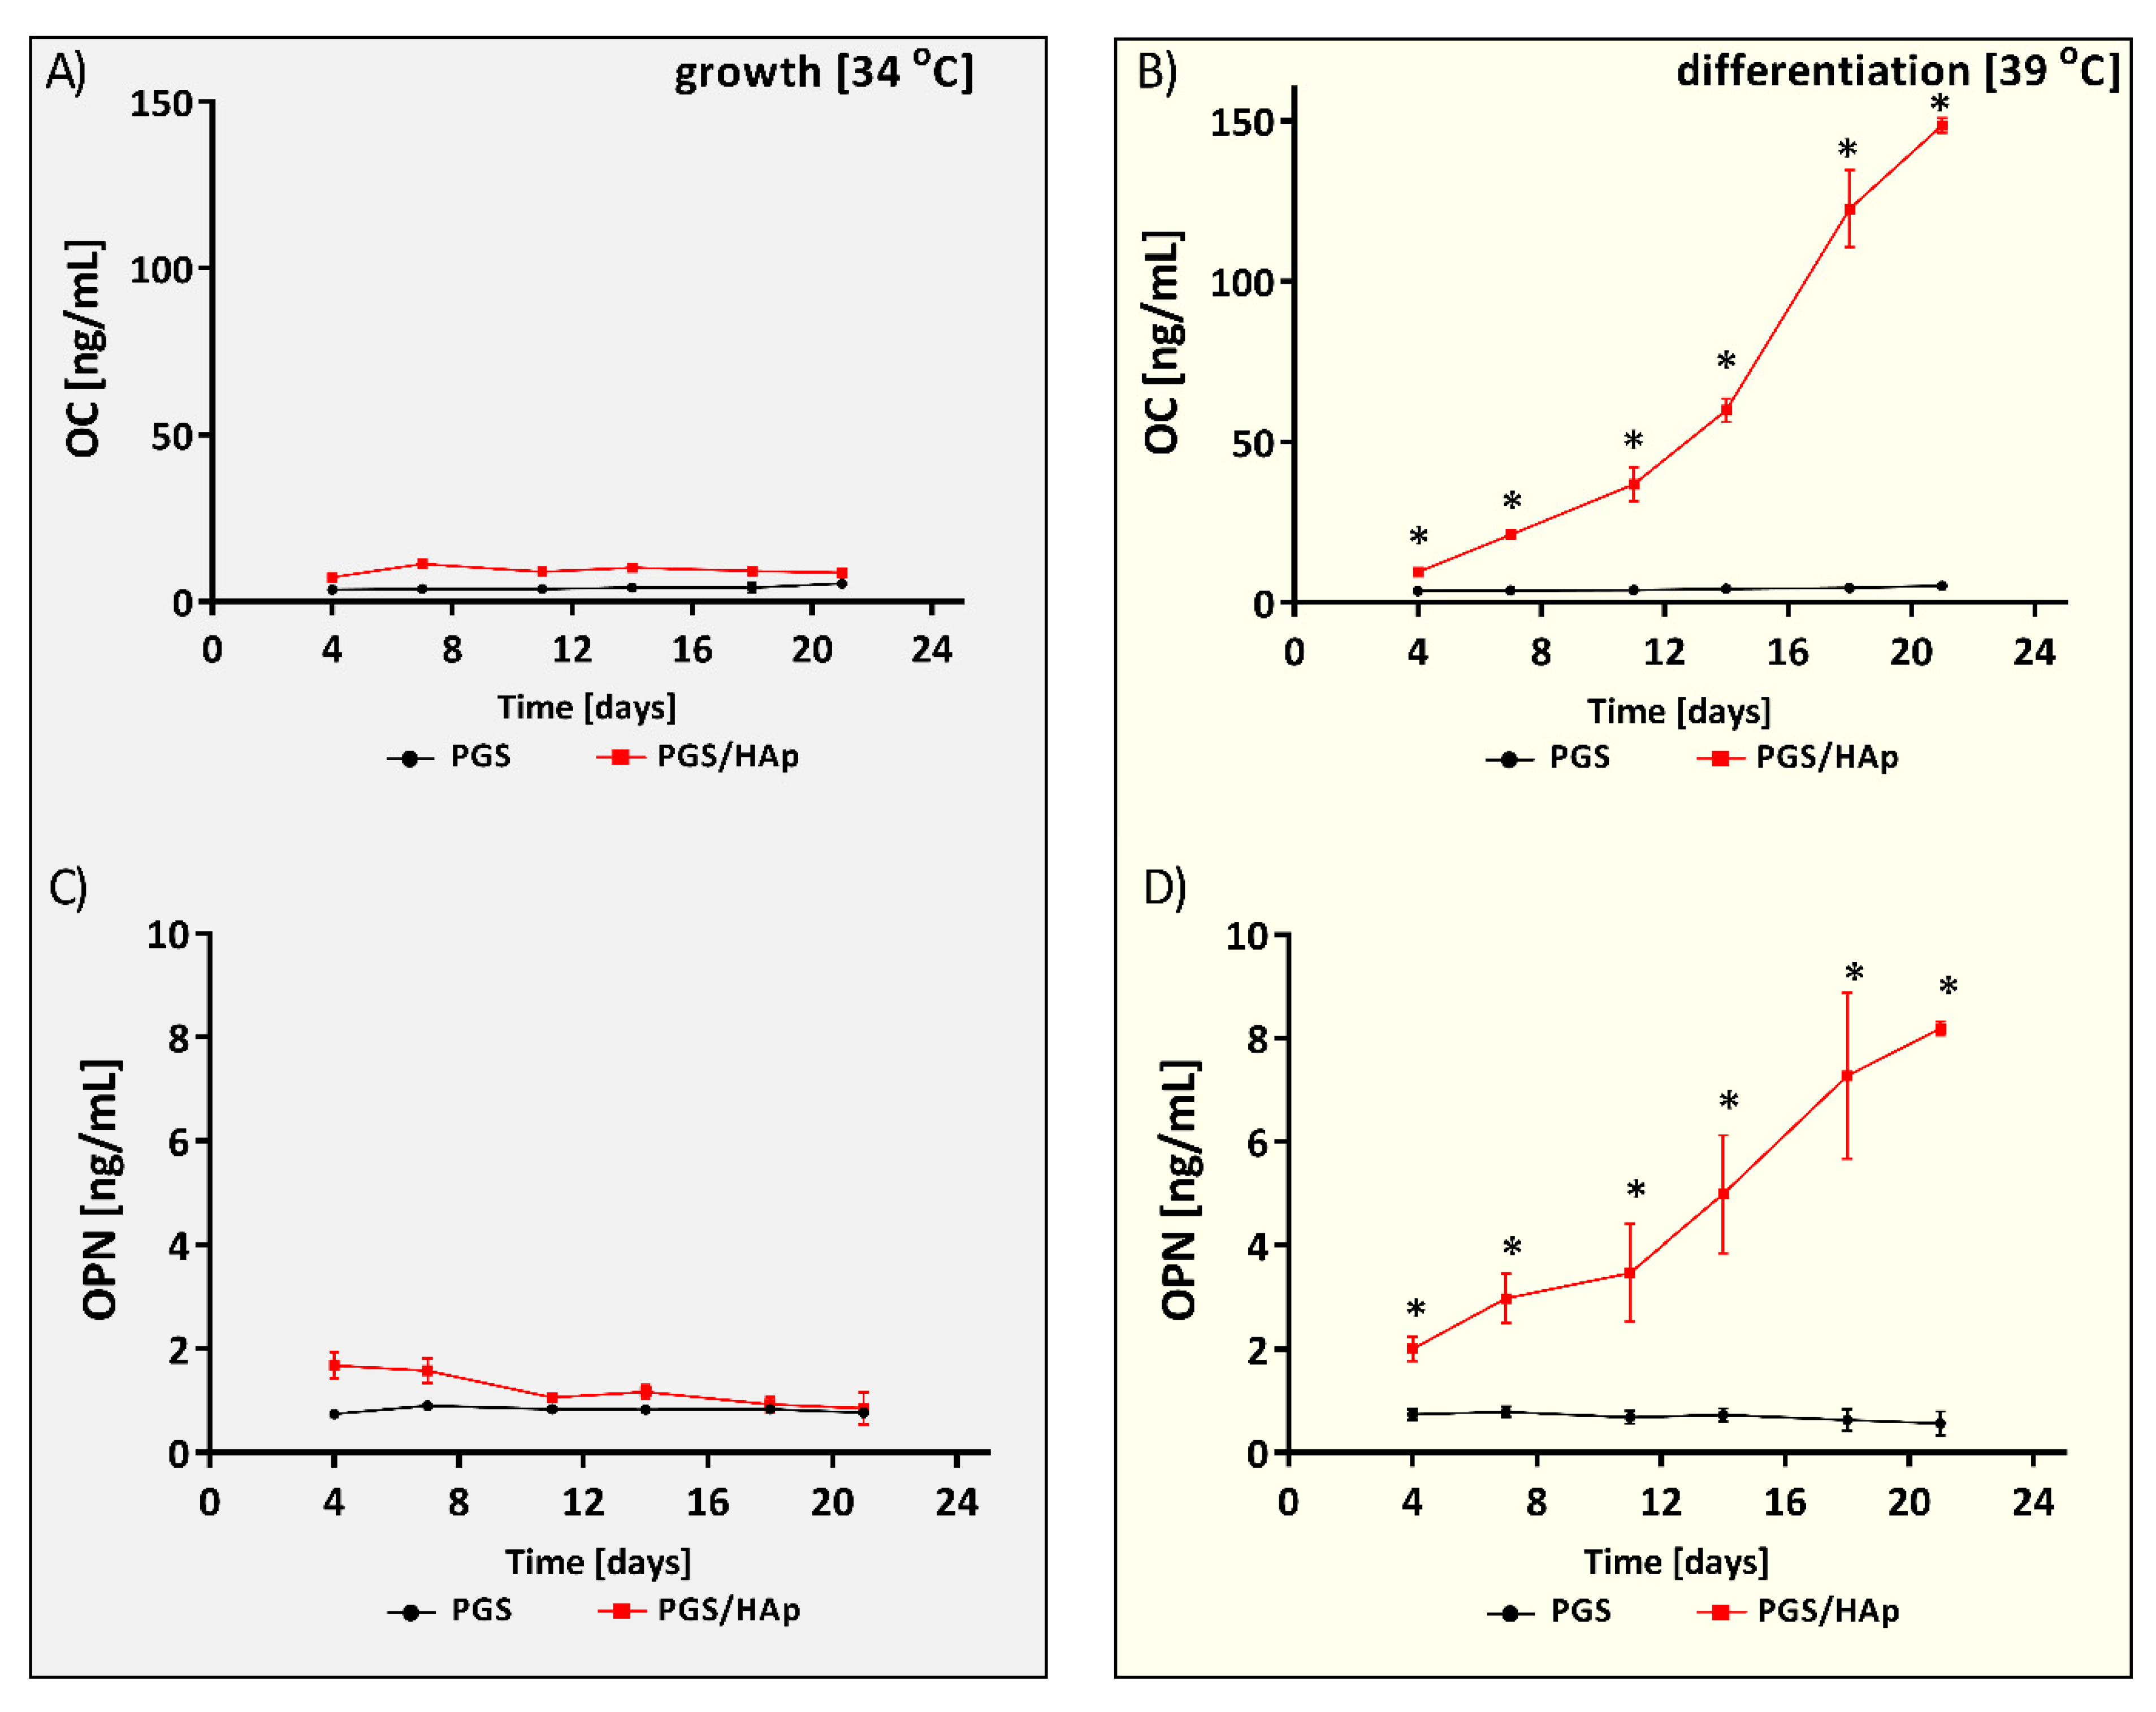
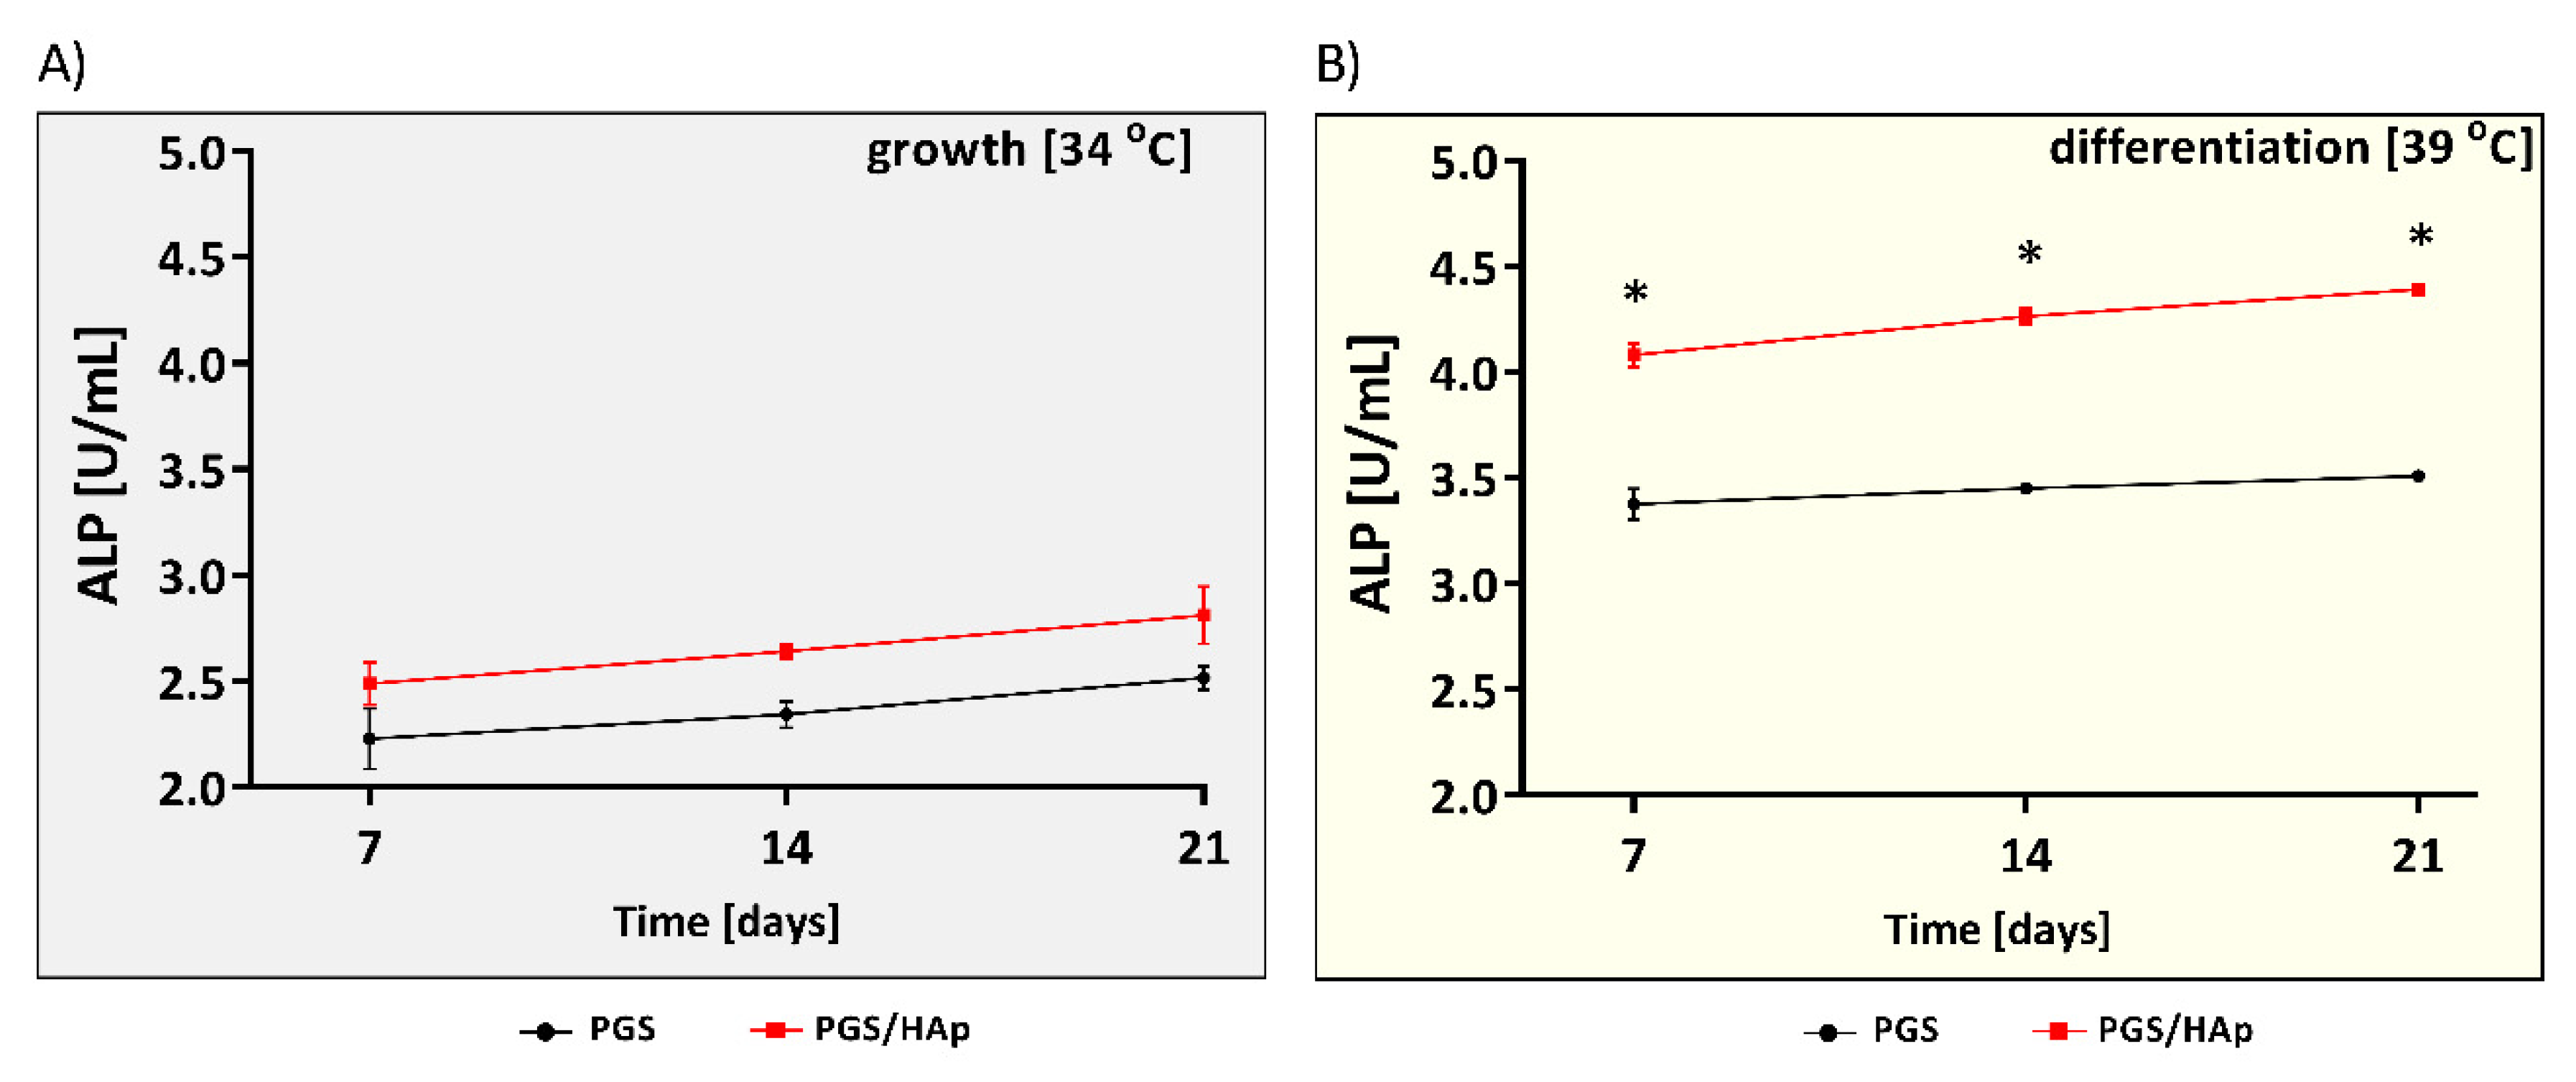
2.5.3. Osteogenic Differentiation of hFOB 1.19
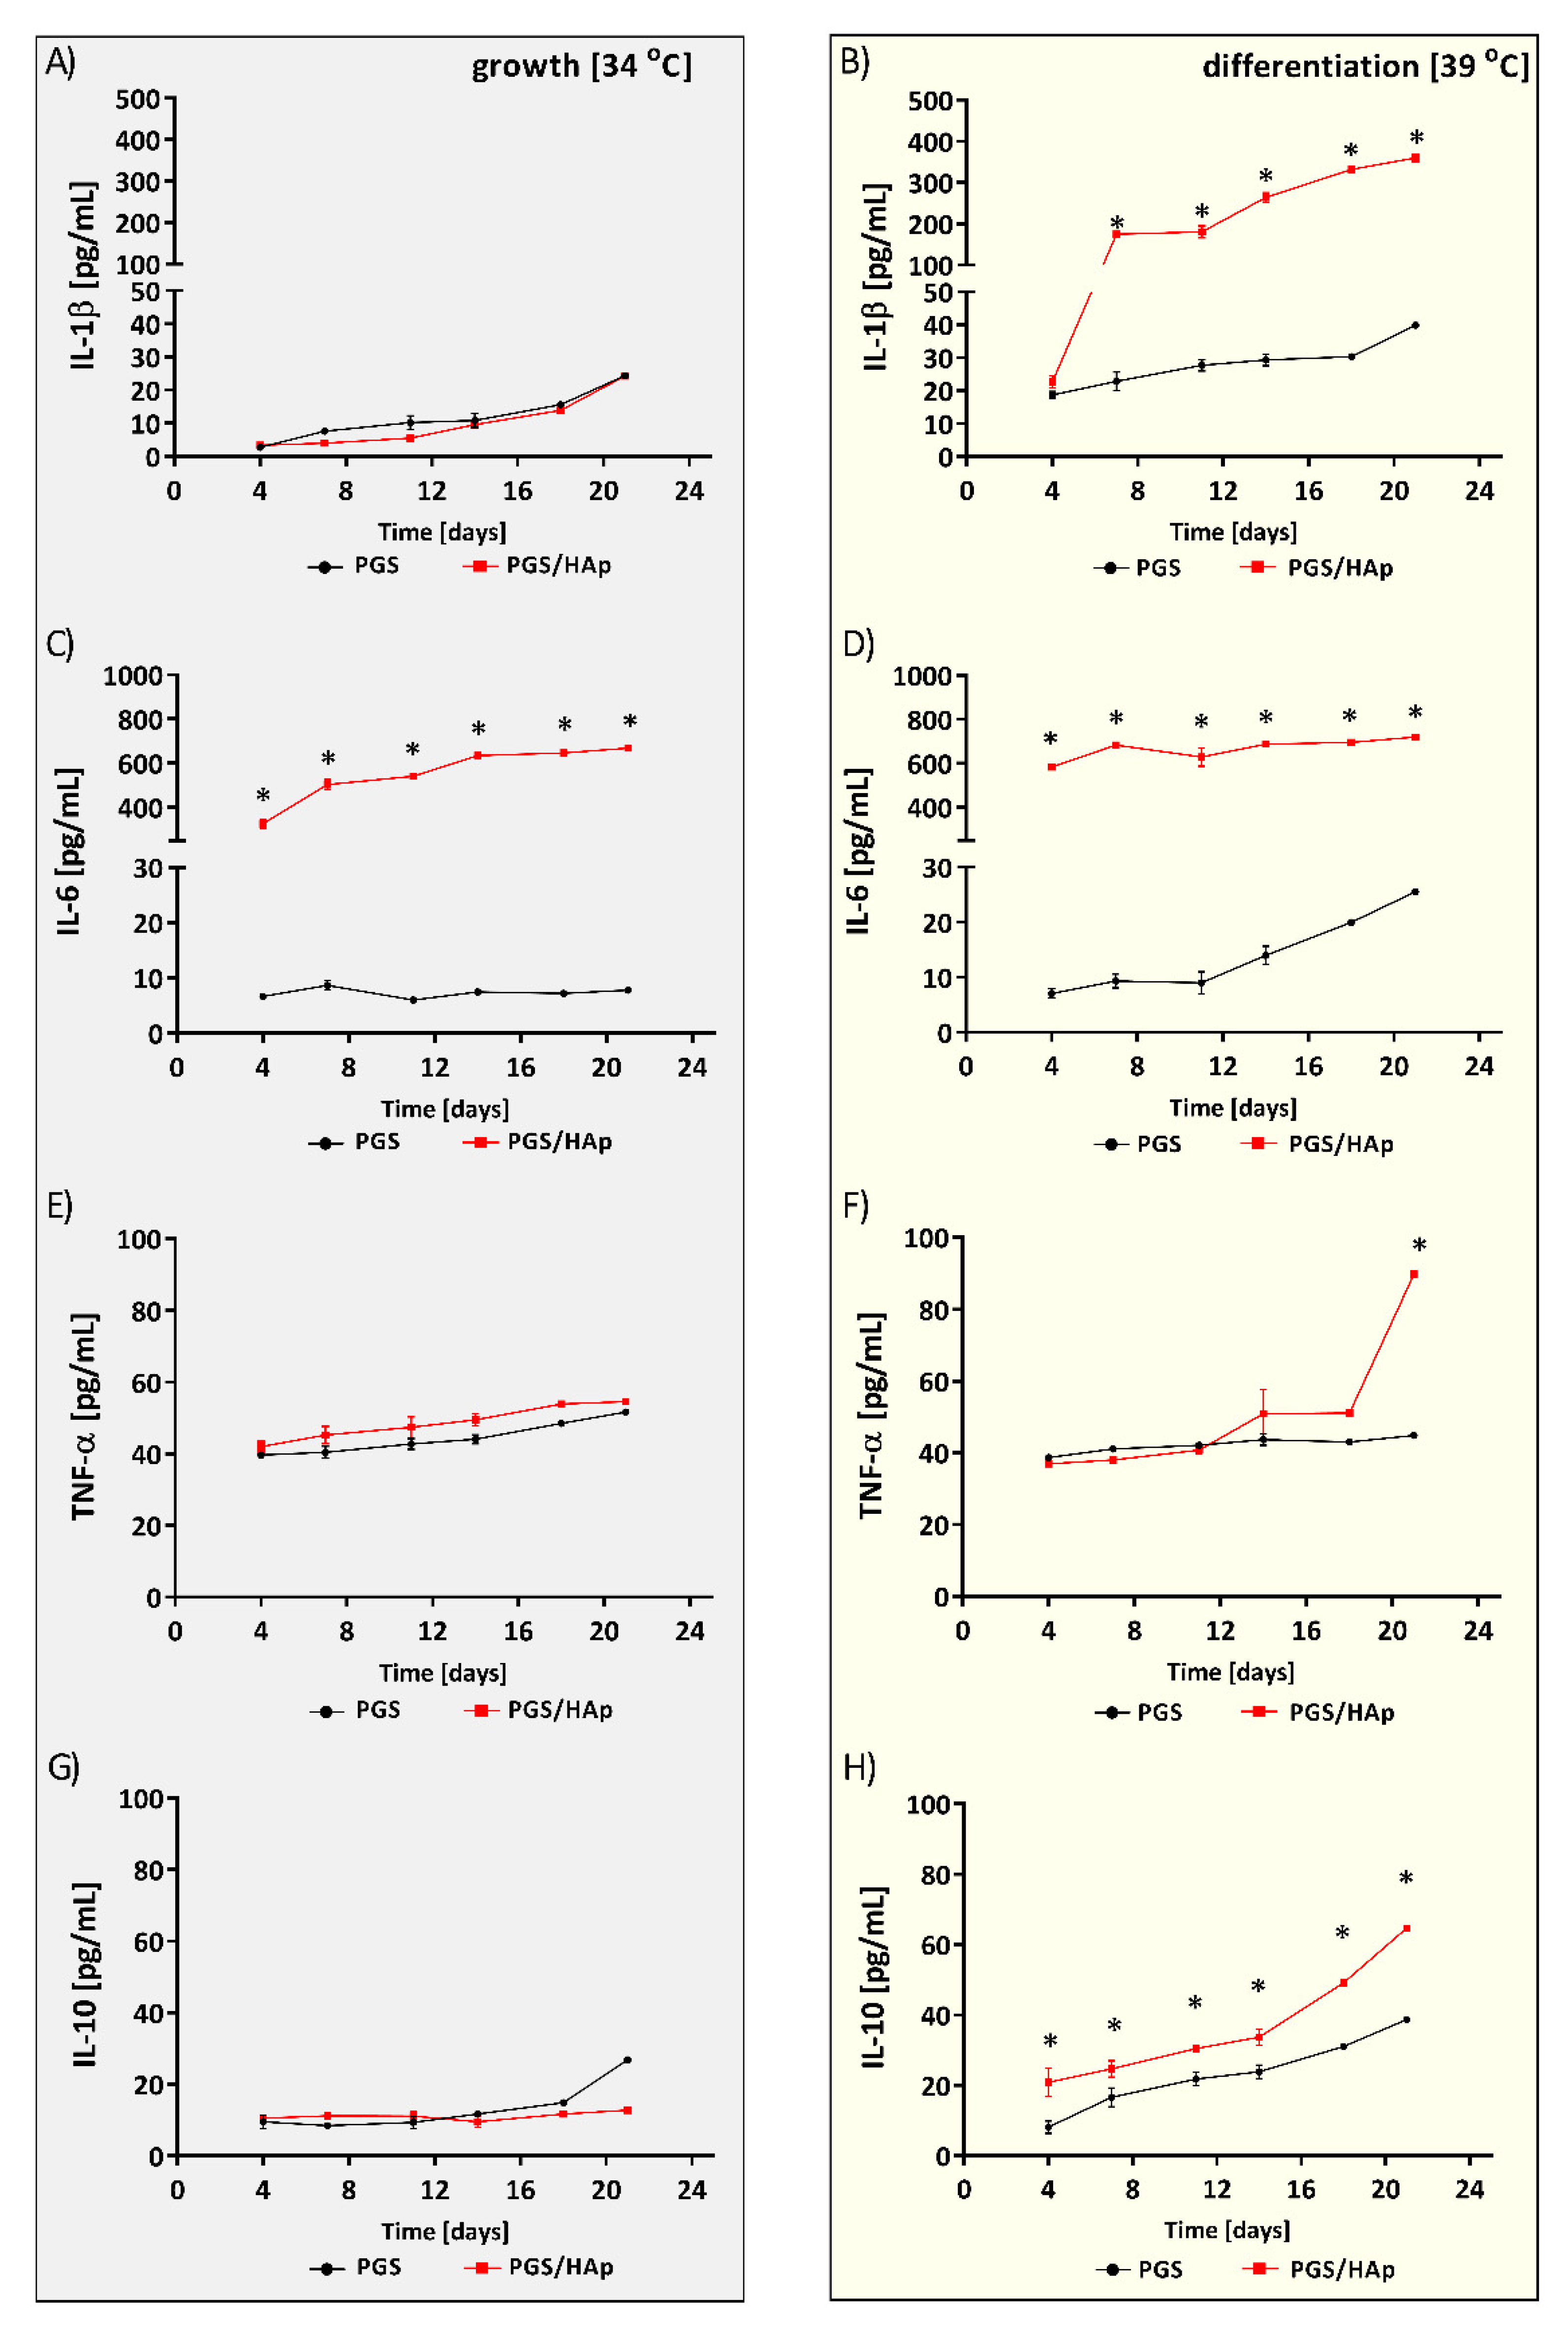
2.5.4. Production of Immunomodulatory Cytokines
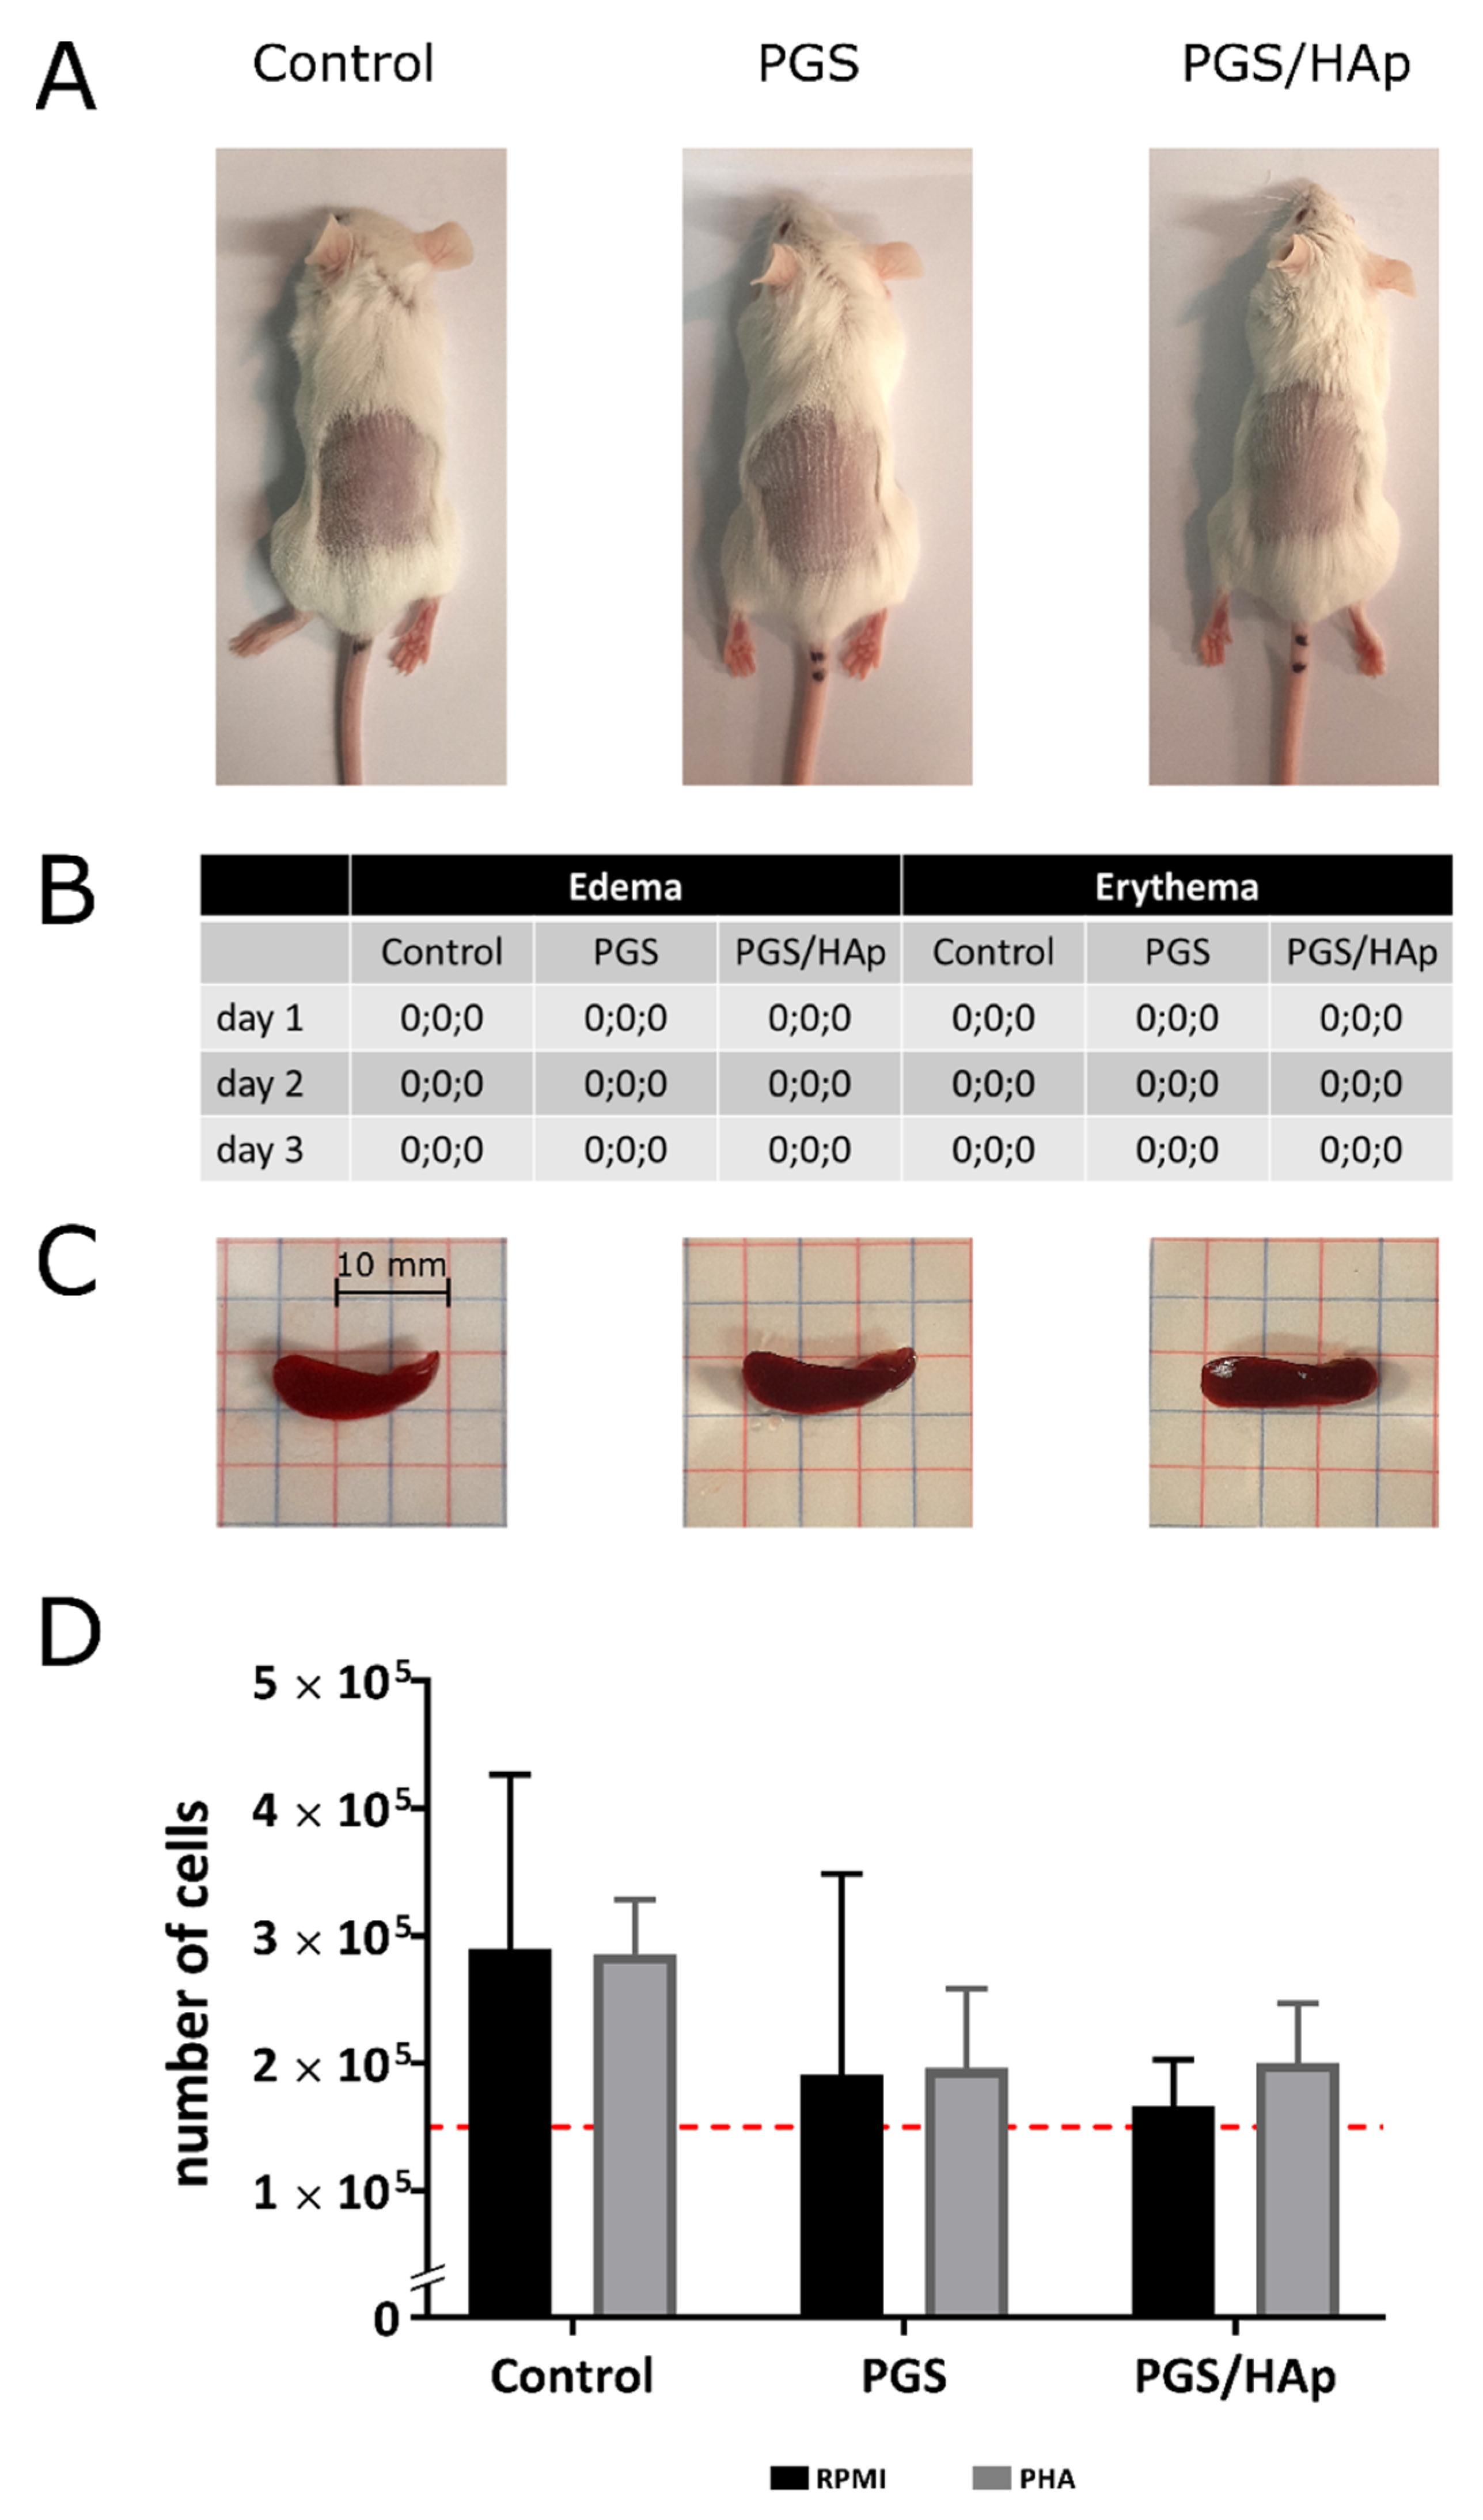
2.6. In Vivo Biocompatibility Study
3. Materials and Methods
3.1. Materials
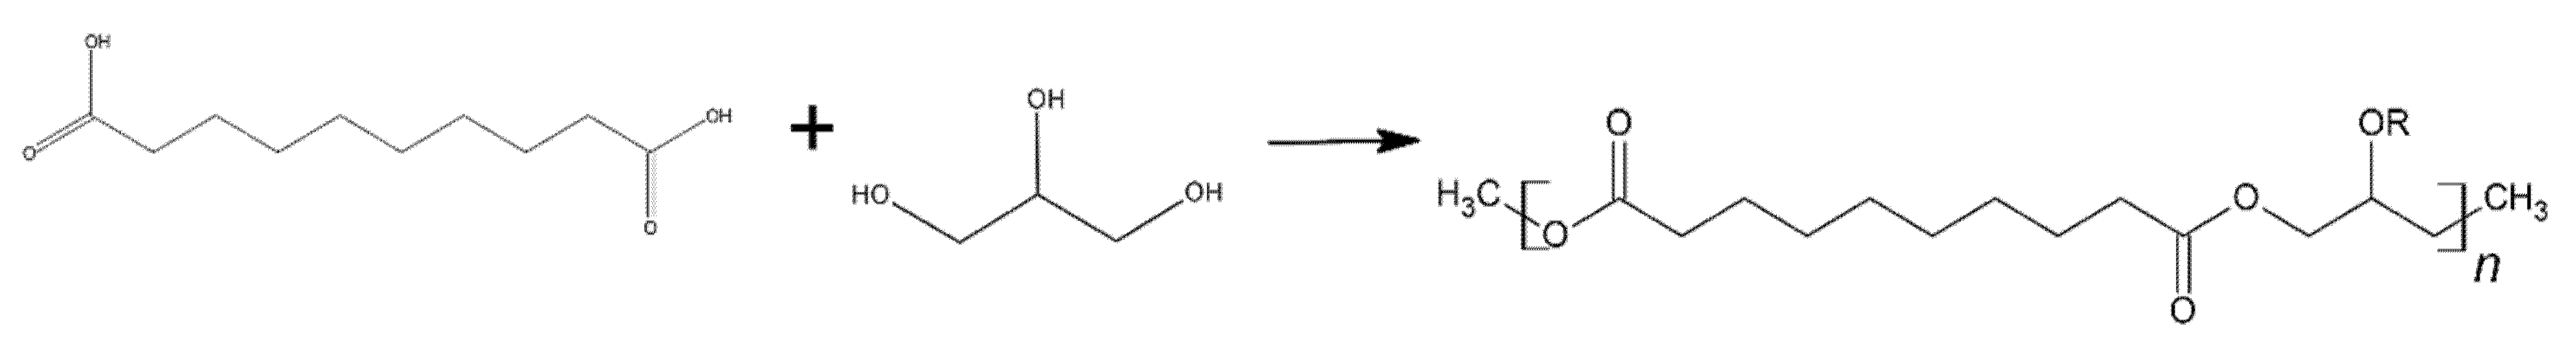
3.2. pPGS Synthesis
3.3. Hydroxyapatite Synthesis
3.4. PGS and PGS/HAp Porous Scaffold Preparation (TIPS-TCL-SL Process)
3.5. Physicochemical Properties of the Scaffolds
3.5.1. Chemical Structure Identification (NMR)
3.5.2. Attenuated Total Reflectance-Fourier Transform Infrared Spectroscopy
3.5.3. Gel Permeation Chromatography (GPC)
3.5.4. Thermogravimetry (TGA)
3.5.5. Differential Scanning Calorimetry (DSC)
3.5.6. Scaffold Micro-Imaging
3.5.7. Microtomography (µCT)
3.6. Sterilization of the PGS and PGS/HAp Scaffolds
3.7. Biological Properties of the Scaffolds
3.7.1. Cell Culture
3.7.2. hFOB 1.19 Osteoblast Growth and Differentiation
3.7.3. Cell Proliferation Assay
3.7.4. Quantification of Osteocalcin and Osteopontin
3.7.5. Alkaline Phosphatase Activity
3.7.6. Determination of the Cytokine Release Profile
3.7.7. Determination of the Cytokine Release Profile
3.7.8. In Vivo Biocompatibility Assessment
3.7.9. Statistical Analysis
4. Conclusions
Supplementary Materials
Author Contributions
Funding
Institutional Review Board Statement
Informed Consent Statement
Data Availability Statement
Conflicts of Interest
References
- Xiao, L.; Wang, B.; Yang, G.; Gauthier, M. Poly(Lactic Acid)-Based Biomaterials: Synthesis, Modification and Applications. In Biomedical Science, Engineering and Technology; Itech Open: London, UK, 2012. [Google Scholar]
- Astete, C.E.; Sabliov, C.M. Synthesis and characterization of PLGA nanoparticles. J. Biomater. Sci. Polym. Ed. 2006, 17, 247–289. [Google Scholar] [CrossRef]
- Mozafari, H.; Dong, P.; Ren, K.; Han, X.; Gu, L. Micromechanical analysis of bioresorbable PLLA/Mg composites coated with MgO: Effects of particle weight fraction, particle/matrix interface bonding strength and interphase. Compos. Part B Eng. 2019, 162, 129–133. [Google Scholar] [CrossRef]
- Sadeghi-Avalshahr, A.; Khorsand-Ghayeni, M.; Nokhasteh, S.; Mahdavi Shahri, M.; Molavi, A.M.; Sadeghi-Avalshahr, M. Effects of hydroxyapatite (HA) particles on the PLLA polymeric matrix for fabrication of absorbable interference screws. Polym. Bull. 2018, 75, 2559–2574. [Google Scholar] [CrossRef]
- Liu, K.; Li, W.; Chen, S.; Wen, W.; Lu, L.; Liu, M.; Zhou, C.; Luo, B. The design, fabrication and evaluation of 3D printed gHNTs/gMgO whiskers/PLLA composite scaffold with honeycomb microstructure for bone tissue engineering. Compos. Part B Eng. 2020, 192, 108001. [Google Scholar] [CrossRef]
- Yin, G.; Zhao, D.; Zhang, L.; Ren, Y.; Ji, S.; Tang, H.; Zhou, Z.; Li, Q. Highly porous 3D PLLA materials composed of nanosheets, fibrous nanosheets, or nanofibrous networks: Preparation and the potential application in oil-water separation. Chem. Eng. J. 2016, 302, 38. [Google Scholar] [CrossRef]
- Szustakiewicz, K.; Gazińska, M.; Kryszak, B.; Grzymajło, M.; Pigłowski, J.; Wiglusz, R.J.; Okamoto, M. The influence of hydroxyapatite content on properties of poly(L-lactide)/hydroxyapatite porous scaffolds obtained using thermal induced phase separation technique. Eur. Polym. J. 2019, 113, 313–320. [Google Scholar] [CrossRef]
- Razak, S.I.A.; Sharif, N.F.A.; Rahman, W.A.A. Biodegradable Polymers and their Bone Applications: A Review. Int. J. Eng. Sci. 2012, 12, 31–49. [Google Scholar] [CrossRef]
- Iwata, T.; Doi, Y. Morphology and enzymatic degradation of poly(L-lactic acid) single crystals. Macromolecules 1998, 31, 2461–2467. [Google Scholar] [CrossRef]
- Gandolfi, M.G.; Zamparini, F.; Degli Esposti, M.; Chiellini, F.; Fava, F.; Fabbri, P.; Taddei, P.; Prati, C. Highly porous polycaprolactone scaffolds doped with calcium silicate and dicalcium phosphate dihydrate designed for bone regeneration. Mater. Sci. Eng. C 2019, 102, 341–361. [Google Scholar] [CrossRef]
- Salifu, A.A.; Obayemi, J.D.; Uzonwanne, V.O.; Soboyejo, W.O. Mechanical stimulation improves osteogenesis and the mechanical properties of osteoblast-laden RGD-functionalized polycaprolactone/hydroxyapatite scaffolds. J. Biomed. Mater. Res. Part A 2020, 108, 2421–2434. [Google Scholar] [CrossRef]
- Ye, G.; Wang, W.; Fan, D.; He, P. Effects of femtosecond laser micromachining on the surface and substrate properties of Poly-lactic acid (PLA). Appl. Surf. Sci. 2020, 538, 148117. [Google Scholar] [CrossRef]
- Gazińska, M.; Krokos, A.; Kobielarz, M.; Włodarczyk, M.; Skibińska, P.; Stępak, B.; Antończak, A.; Morawiak, M.; Płociński, P.; Rudnicka, K. Influence of hydroxyapatite surface functionalization on thermal and biological properties of poly(L-lactide)-and poly(l-lactide-co-glycolide)-based composites. Int. J. Mol. Sci. 2020, 21, 6711. [Google Scholar] [CrossRef]
- Piszko, P.; Kryszak, B.; Piszko, A.; Szustakiewicz, K. Brief review on poly(glycerol sebacate) as an emerging polyester in biomedical application: Structure, properties and modifications. Polym. Med. 2021, 51. [Google Scholar] [CrossRef]
- Vogt, L.; Rivera, L.R.; Liverani, L.; Piegat, A.; El Fray, M.; Boccaccini, A.R. Poly(ε-caprolactone)/poly(glycerol sebacate) electrospun scaffolds for cardiac tissue engineering using benign solvents. Mater. Sci. Eng. C 2019, 103, 109712. [Google Scholar] [CrossRef] [PubMed]
- Wang, Y.; Ameer, G.A.; Sheppard, B.J.; Langer, R. A tough biodegradable elastomer. Nat. Biotechnol. 2002, 20, 602–606. [Google Scholar] [CrossRef] [PubMed]
- Gao, J.; Crapo, P.M.; Wang, Y. Macroporous elastomeric scaffolds with extensive micropores for soft tissue engineering. Tissue Eng. 2006, 12, 917–925. [Google Scholar] [CrossRef]
- Pomerantseva, I.; Krebs, N.; Hart, A.; Neville, C.M.; Huang, A.Y.; Sundback, C.A. Degradation behavior of poly(glycerol sebacate). J. Biomed. Mater. Res. Part A 2009, 91, 1038–1047. [Google Scholar] [CrossRef]
- Gaharwar, A.K.; Patel, A.; Dolatshahi-Pirouz, A.; Zhang, H.; Rangarajan, K.; Iviglia, G.; Shin, S.R.; Hussain, M.A.; Khademhosseini, A. Elastomeric nanocomposite scaffolds made from poly(glycerol sebacate) chemically crosslinked with carbon nanotubes. Biomater. Sci. 2015, 3, 46–58. [Google Scholar] [CrossRef] [Green Version]
- Godinho, B.; Gama, N.; Barros-Timmons, A.; Ferreira, A. Enzymatic synthesis of poly(glycerol sebacate) pre-polymer with crude glycerol, by-product from biodiesel prodution. In Proceedings of the AIP Conference Proceedings; American Institute of Physics Inc.: Melville, NY, USA, 2018; Volume 1981. [Google Scholar]
- Perin, G.B.; Felisberti, M.I. Enzymatic Synthesis of Poly(glycerol sebacate): Kinetics, Chain Growth, and Branching Behavior. Macromolecules 2020, 53, 7925–7935. [Google Scholar] [CrossRef] [PubMed]
- Aydin, H.M.; Salimi, K.; Rzayev, Z.M.O.; Pişkin, E. Microwave-assisted rapid synthesis of poly(glycerol-sebacate) elastomers. Biomater. Sci. 2013, 1, 503–509. [Google Scholar] [CrossRef]
- Nijst, C.L.E.; Bruggeman, J.P.; Karp, J.M.; Ferreira, L.; Zumbuehl, A.; Bettinger, C.J.; Langer, R. Synthesis and characterization of photocurable elastomers from poly(glycerol-co-sebacate). Biomacromolecules 2007, 8, 3067–3073. [Google Scholar] [CrossRef]
- Sundback, C.A.; Shyu, J.Y.; Wang, Y.; Faquin, W.C.; Langer, R.S.; Vacanti, J.P.; Hadlock, T.A. Biocompatibility analysis of poly(glycerol sebacate) as a nerve guide material. Biomaterials 2005, 26, 5454–5464. [Google Scholar] [CrossRef]
- Lau, C.C.; Bayazit, M.K.; Knowles, J.C.; Tang, J. Tailoring degree of esterification and branching of poly(glycerol sebacate) by energy efficient microwave irradiation. Polym. Chem. 2017, 8, 3937–3947. [Google Scholar] [CrossRef] [Green Version]
- Tallá Ferrer, C.; Vilariño-Feltrer, G.; Rizk, M.; Sydow, H.G.; Vallés-Lluch, A. Nanocomposites based on poly(glycerol sebacate) with silica nanoparticles with potential application in dental tissue engineering. Int. J. Polym. Mater. Polym. Biomater. 2020, 69, 761–772. [Google Scholar] [CrossRef]
- Singh, D.; Harding, A.J.; Albadawi, E.; Boissonade, F.M.; Haycock, J.W.; Claeyssens, F. Additive manufactured biodegradable poly(glycerol sebacate methacrylate) nerve guidance conduits. Acta Biomater. 2018, 78, 48–63. [Google Scholar] [CrossRef]
- Li, X.; Hong, A.T.L.; Naskar, N.; Chung, H.J. Criteria for quick and consistent synthesis of poly(glycerol sebacate) for tailored mechanical properties. Biomacromolecules 2015, 16, 1525–1533. [Google Scholar] [CrossRef] [PubMed]
- Wang, Y.; Kim, Y.M.; Langer, R. In vivo degradation characteristics of poly(glycerol sebacate). J. Biomed. Mater. Res. Part A 2003, 66, 192–197. [Google Scholar] [CrossRef]
- Castro, A. Methods for Making Microporous Products. U.S. Patent 4,247,498, 27 January 1981. [Google Scholar]
- Schugens, C.; Maquet, V.; Grandfils, C.; Jerome, R.; Teyssie, P. Biodegradable and macroporous polylactide implants for cell transplantation: 1. Preparation of macroporous polylactide supports by solid-liquid phase separation. Polymer 1996, 37, 1027–1038. [Google Scholar] [CrossRef] [Green Version]
- Lou, T.; Wang, X.; Yan, X.; Miao, Y.; Long, Y.Z.; Yin, H.L.; Sun, B.; Song, G. Fabrication and biocompatibility of poly(l-lactic acid) and chitosan composite scaffolds with hierarchical microstructures. Mater. Sci. Eng. C 2016, 64, 341–345. [Google Scholar] [CrossRef]
- Yang, S.; Leong, K.F.; Du, Z.; Chua, C.K. The design of scaffolds for use in tissue engineering. Part I. Traditional factors. Tissue Eng. 2001, 7, 679–689. [Google Scholar] [CrossRef] [Green Version]
- Ma, P.X. Biomimetic materials for tissue engineering. Adv. Drug Deliv. Rev. 2008, 60, 184–198. [Google Scholar] [CrossRef] [Green Version]
- Stevens, B.; Yang, Y.; Mohandas, A.; Stucker, B.; Nguyen, K.T. A review of materials, fabrication methods, and strategies used to enhance bone regeneration in engineered bone tissues. J. Biomed. Mater. Res. Part B Appl. Biomater. 2008, 85, 573–582. [Google Scholar] [CrossRef]
- Fu, J.; Ding, X.; Stowell, C.E.T.; Wu, Y.L.; Wang, Y. Slow degrading poly(glycerol sebacate) derivatives improve vascular graft remodeling in a rat carotid artery interposition model. Biomaterials 2020, 257, 142–9612. [Google Scholar] [CrossRef]
- Sun, Z.J.; Chen, C.; Sun, M.Z.; Ai, C.H.; Lu, X.L.; Zheng, Y.F.; Yang, B.F.; Dong, D.L. The application of poly (glycerol-sebacate) as biodegradable drug carrier. Biomaterials 2009, 30, 5209–5214. [Google Scholar] [CrossRef]
- Gultekinoglu, M.; Öztürk, Ş.; Chen, B.; Edirisinghe, M.; Ulubayram, K. Preparation of poly(glycerol sebacate) fibers for tissue engineering applications. Eur. Polym. J. 2019, 121, 109297. [Google Scholar] [CrossRef]
- Xuan, H.; Hu, H.; Geng, C.; Song, J.; Shen, Y.; Lei, D.; Guan, Q.; Zhao, S.; You, Z. Biofunctionalized chondrogenic shape-memory ternary scaffolds for efficient cell-free cartilage regeneration. Acta Biomater. 2020, 105, 97–110. [Google Scholar] [CrossRef]
- Flaig, F.; Ragot, H.; Simon, A.; Revet, G.; Kitsara, M.; Kitasato, L.; Hébraud, A.; Agbulut, O.; Schlatter, G. Design of Functional Electrospun Scaffolds Based on Poly(glycerol sebacate) Elastomer and Poly(lactic acid) for Cardiac Tissue Engineering. ACS Biomater. Sci. Eng. 2020, 6, 2388–2400. [Google Scholar] [CrossRef]
- Ajdary, R.; Ezazi, N.Z.; Correia, A.; Kemell, M.; Huan, S.; Ruskoaho, H.J.; Hirvonen, J.; Santos, H.A.; Rojas, O.J. Multifunctional 3D-Printed Patches for Long-Term Drug Release Therapies after Myocardial Infarction. Adv. Funct. Mater. 2020, 30, 2003440. [Google Scholar] [CrossRef]
- Rai, R.; Tallawi, M.; Barbani, N.; Frati, C.; Madeddu, D.; Cavalli, S.; Graiani, G.; Quaini, F.; Roether, J.A.; Schubert, D.W.; et al. Biomimetic poly(glycerol sebacate) (PGS) membranes for cardiac patch application. Mater. Sci. Eng. C 2013, 33, 3677–3687. [Google Scholar] [CrossRef]
- Saudi, A.; Rafienia, M.; Zargar Kharazi, A.; Salehi, H.; Zarrabi, A.; Karevan, M. Design and fabrication of poly (glycerol sebacate)-based fibers for neural tissue engineering: Synthesis, electrospinning, and characterization. Polym. Adv. Technol. 2019, 30, 1427–1440. [Google Scholar] [CrossRef]
- Wang, Y.; Wu, H.; Wang, Z.; Zhang, J.; Zhu, J.; Ma, Y.; Yang, Z.; Yuan, Y. Optimized Synthesis of Biodegradable Elastomer PEGylated Poly(glycerol sebacate) and Their Biomedical Application. Polymers 2019, 11, 965. [Google Scholar] [CrossRef] [PubMed] [Green Version]
- Jia, Y.; Wang, W.; Zhou, X.; Nie, W.; Chen, L.; He, C. Synthesis and characterization of poly(glycerol sebacate)-based elastomeric copolyesters for tissue engineering applications. Polym. Chem. 2016, 7, 2553–2564. [Google Scholar] [CrossRef]
- Frydrych, M.; Román, S.; Green, N.H.; MacNeil, S.; Chen, B. Thermoresponsive, stretchable, biodegradable and biocompatible poly(glycerol sebacate)-based polyurethane hydrogels. Polym. Chem. 2015, 6, 7974–7987. [Google Scholar] [CrossRef] [Green Version]
- Michelot, A.; Sarda, S.; Audin, C.; Deydier, E.; Manoury, E.; Poli, R.; Rey, C. Spectroscopic characterisation of hydroxyapatite and nanocrystalline apatite with grafted aminopropyltriethoxysilane: Nature of silane–surface interaction. J. Mater. Sci. 2015, 50, 5746–5757. [Google Scholar] [CrossRef] [Green Version]
- Markovic, M.; Fowler, B.O.; Tung, M.S. Preparation and Comprehensive Characterization of a Calcium Hydroxyapatite Reference Material. J. Res. Natl. Inst. Stand. Technol. 2004, 109, 553–568. [Google Scholar] [CrossRef] [PubMed]
- Rostamian, M.; Kalaee, M.R.; Dehkordi, S.R.; Panahi-Sarmad, M.; Tirgar, M.; Goodarzi, V. Design and characterization of poly(glycerol-sebacate)-co-poly(caprolactone) (PGS-co-PCL) and its nanocomposites as novel biomaterials: The promising candidate for soft tissue engineering. Eur. Polym. J. 2020, 138, 109985. [Google Scholar] [CrossRef]
- Aghajan, M.H.; Panahi-Sarmad, M.; Alikarami, N.; Shojaei, S.; Saeidi, A.; Khonakdar, H.A.; Shahrousvan, M.; Goodarzi, V. Using solvent-free approach for preparing innovative biopolymer nanocomposites based on PGS/gelatin. Eur. Polym. J. 2020, 131, 109720. [Google Scholar] [CrossRef]
- Lau, C.C.; Al Qaysi, M.; Owji, N.; Bayazit, M.K.; Xie, J.; Knowles, J.C.; Tang, J. Advanced biocomposites of poly(glycerol sebacate) and β-tricalcium phosphate by in situ microwave synthesis for bioapplication. Mater. Today Adv. 2020, 5, 100023. [Google Scholar] [CrossRef]
- Theerathanagorn, T.; Thavornyutikarn, B.; Janvikul, W. Preparation and characterization of plasma-treated porous poly(glycerol sebacate) scaffolds. In Advanced Materials Research; Trans Tech Publications Ltd.: Stafa-Zurich, Switzerland, 2013; Volume 747, pp. 182–185. [Google Scholar]
- Cai, W.; Liu, L. Shape-memory effect of poly (glycerol-sebacate) elastomer. Mater. Lett. 2008, 62, 2171–2173. [Google Scholar] [CrossRef]
- Kuo, T.R.; Chen, C.H. Bone biomarker for the clinical assessment of osteoporosis: Recent developments and future perspectives. Biomark. Res. 2017, 5, 18. [Google Scholar] [CrossRef] [Green Version]
- Jain, S.; Camacho, P. Use of bone turnover markers in the management of osteoporosis. Curr. Opin. Endocrinol. Diabetes Obes. 2018, 25, 366–372. [Google Scholar] [CrossRef]
- Vimalraj, S. Alkaline phosphatase: Structure, expression and its function in bone mineralization. Gene 2020, 754, 144855. [Google Scholar] [CrossRef]
- Galliera, E.; Locati, M.; Mantovani, A.; Corsi, M.M. Chemokines and bone remodeling. Int. J. Immunopathol. Pharmacol. 2008, 21, 485–491. [Google Scholar] [CrossRef]
- Amarasekara, D.S.; Yun, H.; Kim, S.; Lee, N.; Kim, H.; Rho, J. Regulation of osteoclast differentiation by cytokine networks. Immune Netw. 2018, 18, e8. [Google Scholar] [CrossRef]
- Lee, Y.M.; Fujikado, N.; Manaka, H.; Yasuda, H.; Iwakura, Y. IL-1 plays an important role in the bone metabolism under physiological conditions. Int. Immunol. 2010, 22, 805–816. [Google Scholar] [CrossRef] [Green Version]
- Wu, Q.; Zhou, X.; Huang, D.; JI, Y.; Kang, F. IL-6 Enhances Osteocyte-Mediated Osteoclastogenesis by Promoting JAK2 and RANKL Activity In Vitro. Cell. Physiol. Biochem. 2017, 41, 1360–1369. [Google Scholar] [CrossRef]
- Interface Oral Health Science 2007; Springer: Tokyo, Japan, 2007.
- Wong, M.; Ziring, D.; Korin, Y.; Desai, S.; Kim, S.; Lin, J.; Gjertson, D.; Braun, J.; Reed, E.; Singh, R.R. TNFα blockade in human diseases: Mechanisms and future directions. Clin. Immunol. 2008, 126, 121–136. [Google Scholar] [CrossRef] [Green Version]
- Zhang, Q.; Chen, B.; Yan, F.; Guo, J.; Zhu, X.; Ma, S.; Yang, W. Interleukin-10 inhibits bone resorption: A potential therapeutic strategy in periodontitis and other bone loss diseases. Biomed. Res. Int. 2014, 2014, 284836. [Google Scholar] [CrossRef] [PubMed]
- Lulekal, E.; Tesfaye, S.; Gebrechristos, S.; Dires, K.; Zenebe, T.; Zegeye, N.; Feleke, G.; Kassahun, A.; Shiferaw, Y.; Mekonnen, A. Phytochemical analysis and evaluation of skin irritation, acute and sub-acute toxicity of Cymbopogon citratus essential oil in mice and rabbits. Toxicol. Rep. 2019, 6, 1289–1294. [Google Scholar] [CrossRef] [PubMed]
- Miszczyk, E.; Walencka, M.; Rudnicka, K.; Matusiak, A.; Rudnicka, W.; Chmiela, M. Antigen-specific lymphocyte proliferation as a marker of immune response in guinea pigs with sustained helicobacter pylori infection. Acta Biochim. Pol. 2014, 61, 295–303. [Google Scholar] [CrossRef] [PubMed]


| Parameter | PGS | PSG/HAp |
|---|---|---|
| Po(tot) a [%] | 78 | 69.8 |
| Po(op) a [%] | 78 | 69.6 |
| Po(cl) a [%] | >0.001 | 0.02 |
| Po.V a [mm3] | 216.01 | 193.39 |
| ESDv [µm] | 383 ± 120 | 286 ± 103 304 ± 77 * |
| Maj.Dm [µm] | 596 ± 271 | 385 ± 147 410 ± 115 * |
| Sph [-] | 0.81 ± 0.05 | 0.72 ± 0.12 |
| Sample | T-5% [°C] | Mass Loss at 700 °C [%] |
|---|---|---|
| HAp | 513 | 5.79 |
| pPGS | 305 | 76.99 |
| PGS | 360 | 97.02 |
| PGS/HAp | 367 | 98.47 |
| Sample | Cooling | 2nd Heating | ||||
|---|---|---|---|---|---|---|
| Tg [°C] | Tc [°C] | ΔHc [J/g] | Tg [°C] | Tm [°C] | -ΔHc [J/g] | |
| pPGS | - | −17.8 | 18.5 | −25.1 | 3.3 | 18.6 |
| PGS | - | −23.6 | 7.7 | −25.8 | −9.4 | 3.7 |
| PGS/HAp | −28.6 | - | - | −24.9 | - | - |
| PGS Content [wt.%] | PGS Content [wt.%] | |
|---|---|---|
| PGS | 100 | - |
| PGS/HAp | 75 | 25 |
Publisher’s Note: MDPI stays neutral with regard to jurisdictional claims in published maps and institutional affiliations. |
© 2021 by the authors. Licensee MDPI, Basel, Switzerland. This article is an open access article distributed under the terms and conditions of the Creative Commons Attribution (CC BY) license (https://creativecommons.org/licenses/by/4.0/).
Share and Cite
Piszko, P.; Włodarczyk, M.; Zielińska, S.; Gazińska, M.; Płociński, P.; Rudnicka, K.; Szwed, A.; Krupa, A.; Grzymajło, M.; Sobczak-Kupiec, A.; et al. PGS/HAp Microporous Composite Scaffold Obtained in the TIPS-TCL-SL Method: An Innovation for Bone Tissue Engineering. Int. J. Mol. Sci. 2021, 22, 8587. https://doi.org/10.3390/ijms22168587
Piszko P, Włodarczyk M, Zielińska S, Gazińska M, Płociński P, Rudnicka K, Szwed A, Krupa A, Grzymajło M, Sobczak-Kupiec A, et al. PGS/HAp Microporous Composite Scaffold Obtained in the TIPS-TCL-SL Method: An Innovation for Bone Tissue Engineering. International Journal of Molecular Sciences. 2021; 22(16):8587. https://doi.org/10.3390/ijms22168587
Chicago/Turabian StylePiszko, Paweł, Marcin Włodarczyk, Sonia Zielińska, Małgorzata Gazińska, Przemysław Płociński, Karolina Rudnicka, Aleksandra Szwed, Agnieszka Krupa, Michał Grzymajło, Agnieszka Sobczak-Kupiec, and et al. 2021. "PGS/HAp Microporous Composite Scaffold Obtained in the TIPS-TCL-SL Method: An Innovation for Bone Tissue Engineering" International Journal of Molecular Sciences 22, no. 16: 8587. https://doi.org/10.3390/ijms22168587
APA StylePiszko, P., Włodarczyk, M., Zielińska, S., Gazińska, M., Płociński, P., Rudnicka, K., Szwed, A., Krupa, A., Grzymajło, M., Sobczak-Kupiec, A., Słota, D., Kobielarz, M., Wojtków, M., & Szustakiewicz, K. (2021). PGS/HAp Microporous Composite Scaffold Obtained in the TIPS-TCL-SL Method: An Innovation for Bone Tissue Engineering. International Journal of Molecular Sciences, 22(16), 8587. https://doi.org/10.3390/ijms22168587