
Performance Comparisons of AlexNet and GoogLeNet in Cell Growth Inhibition IC50 Prediction


Abstract
:1. Introduction
2. Results
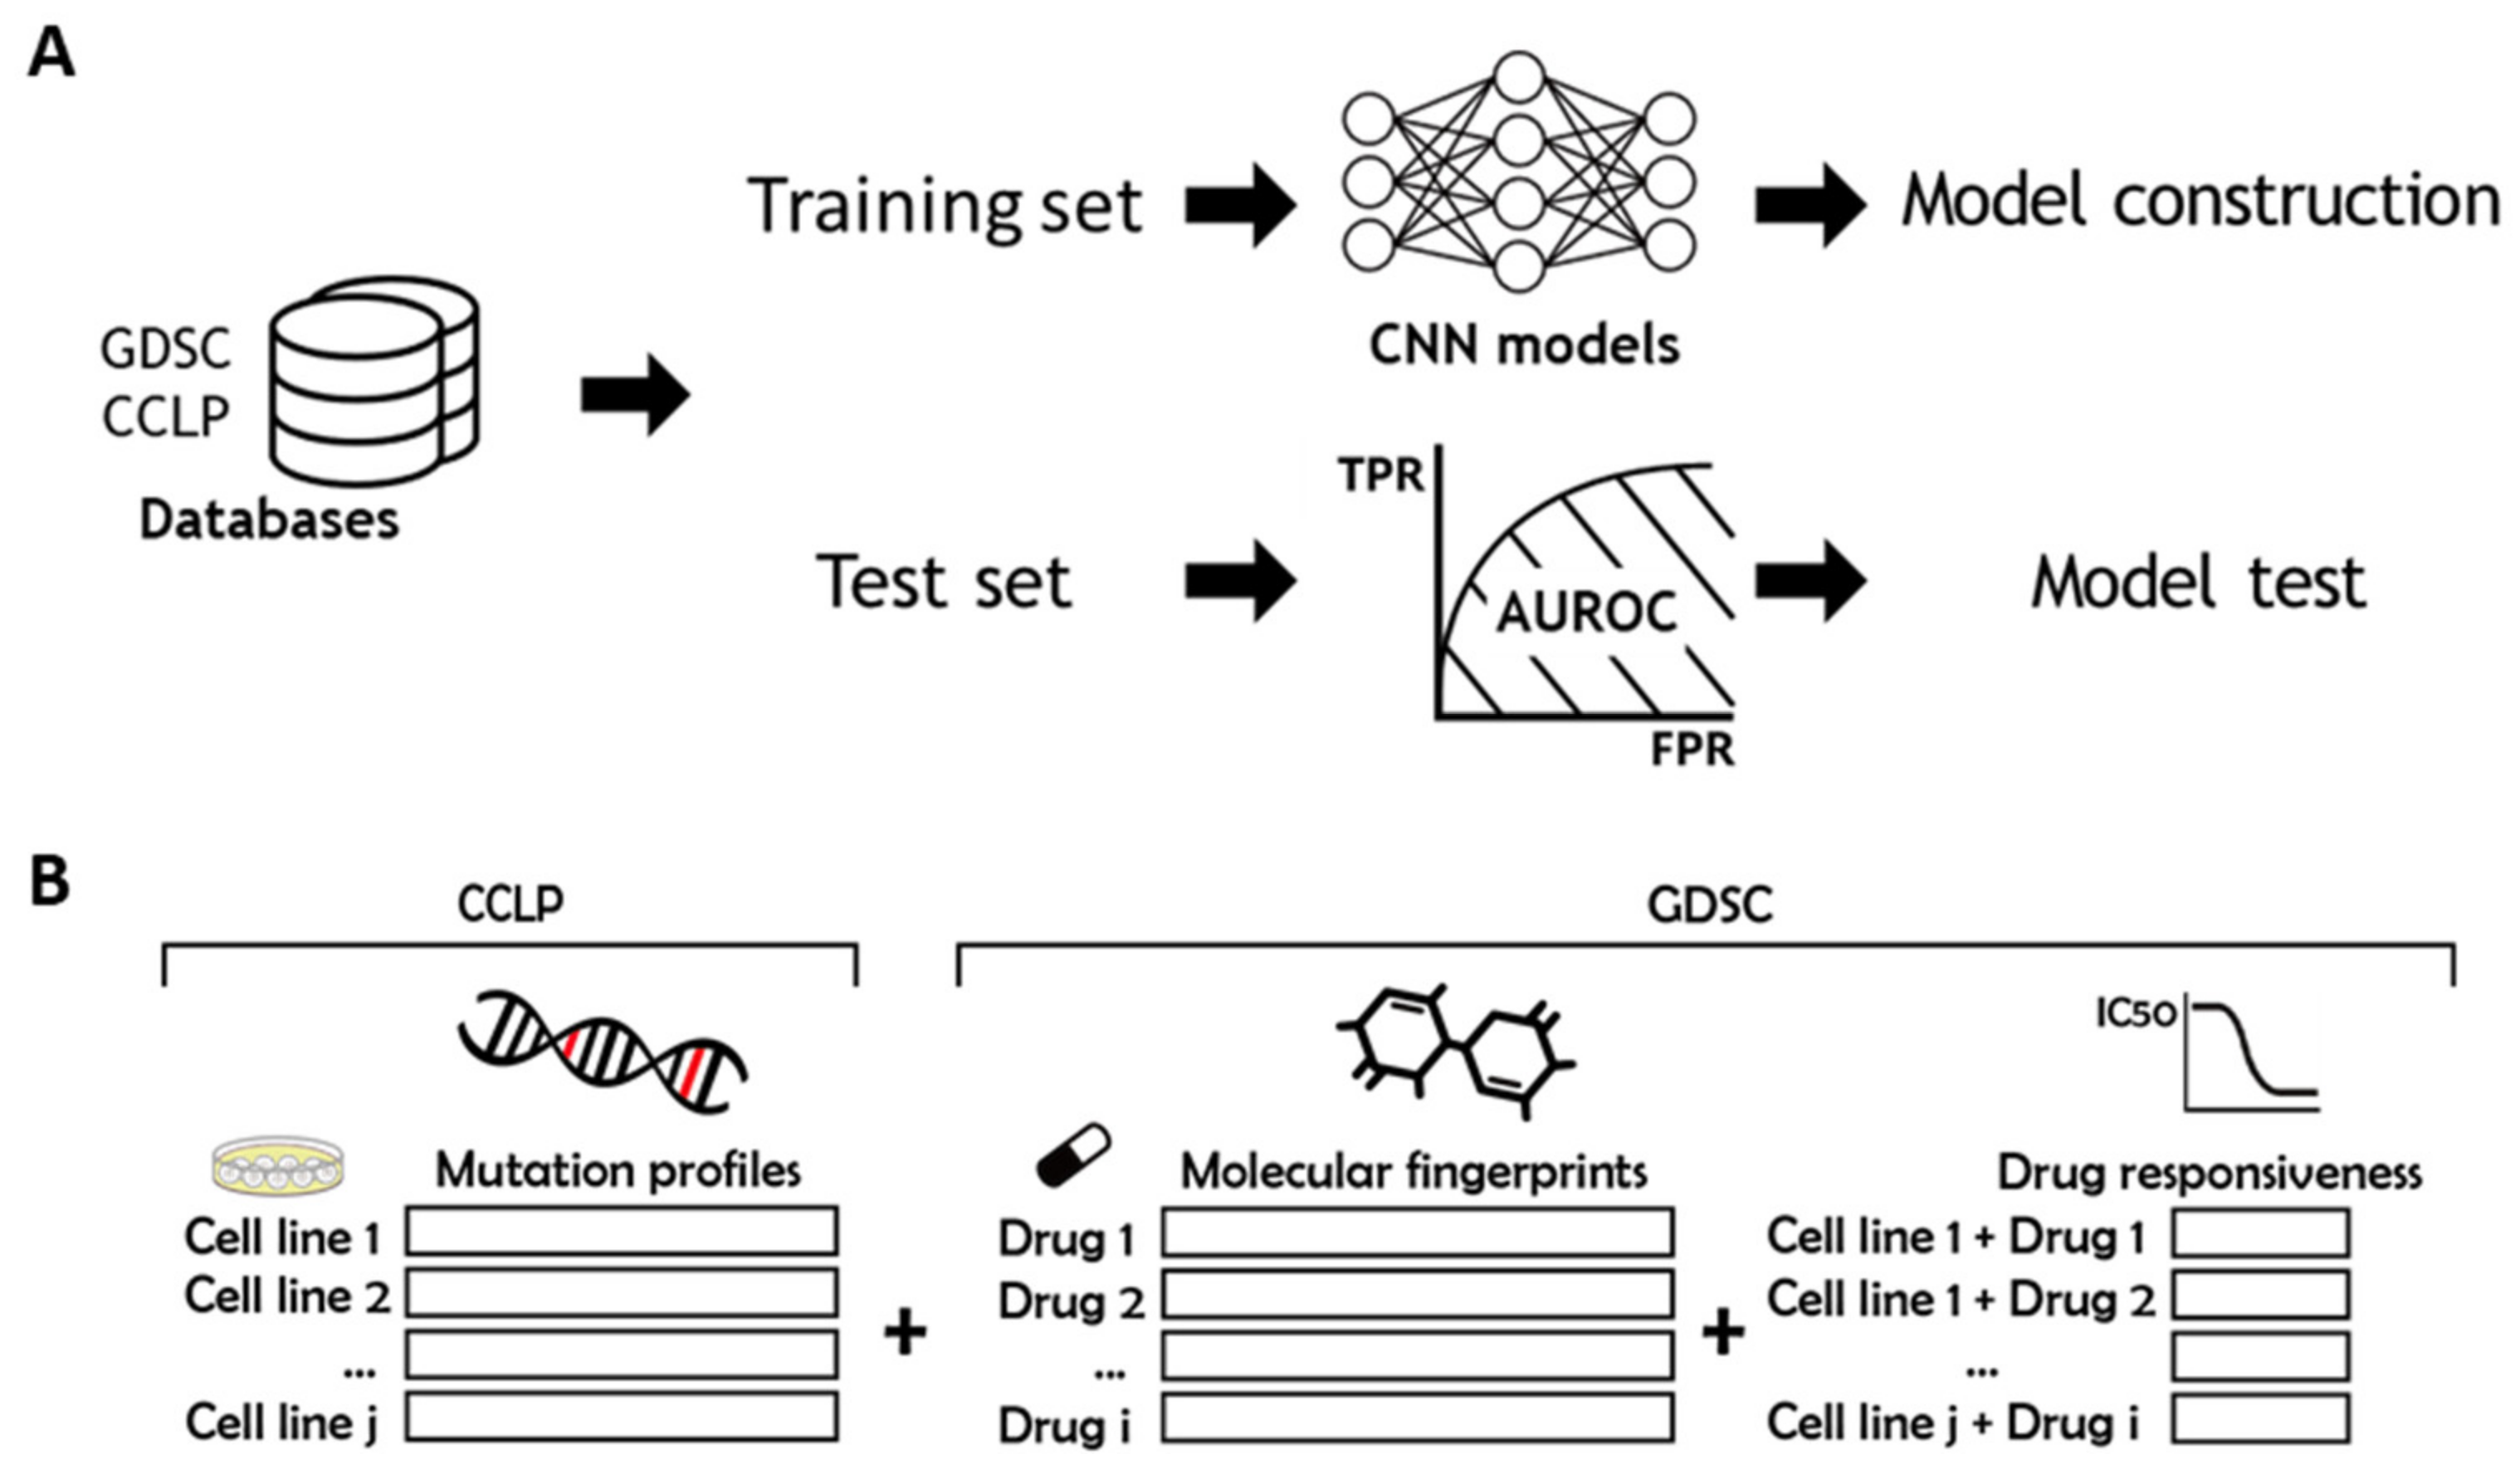
2.1. Overview
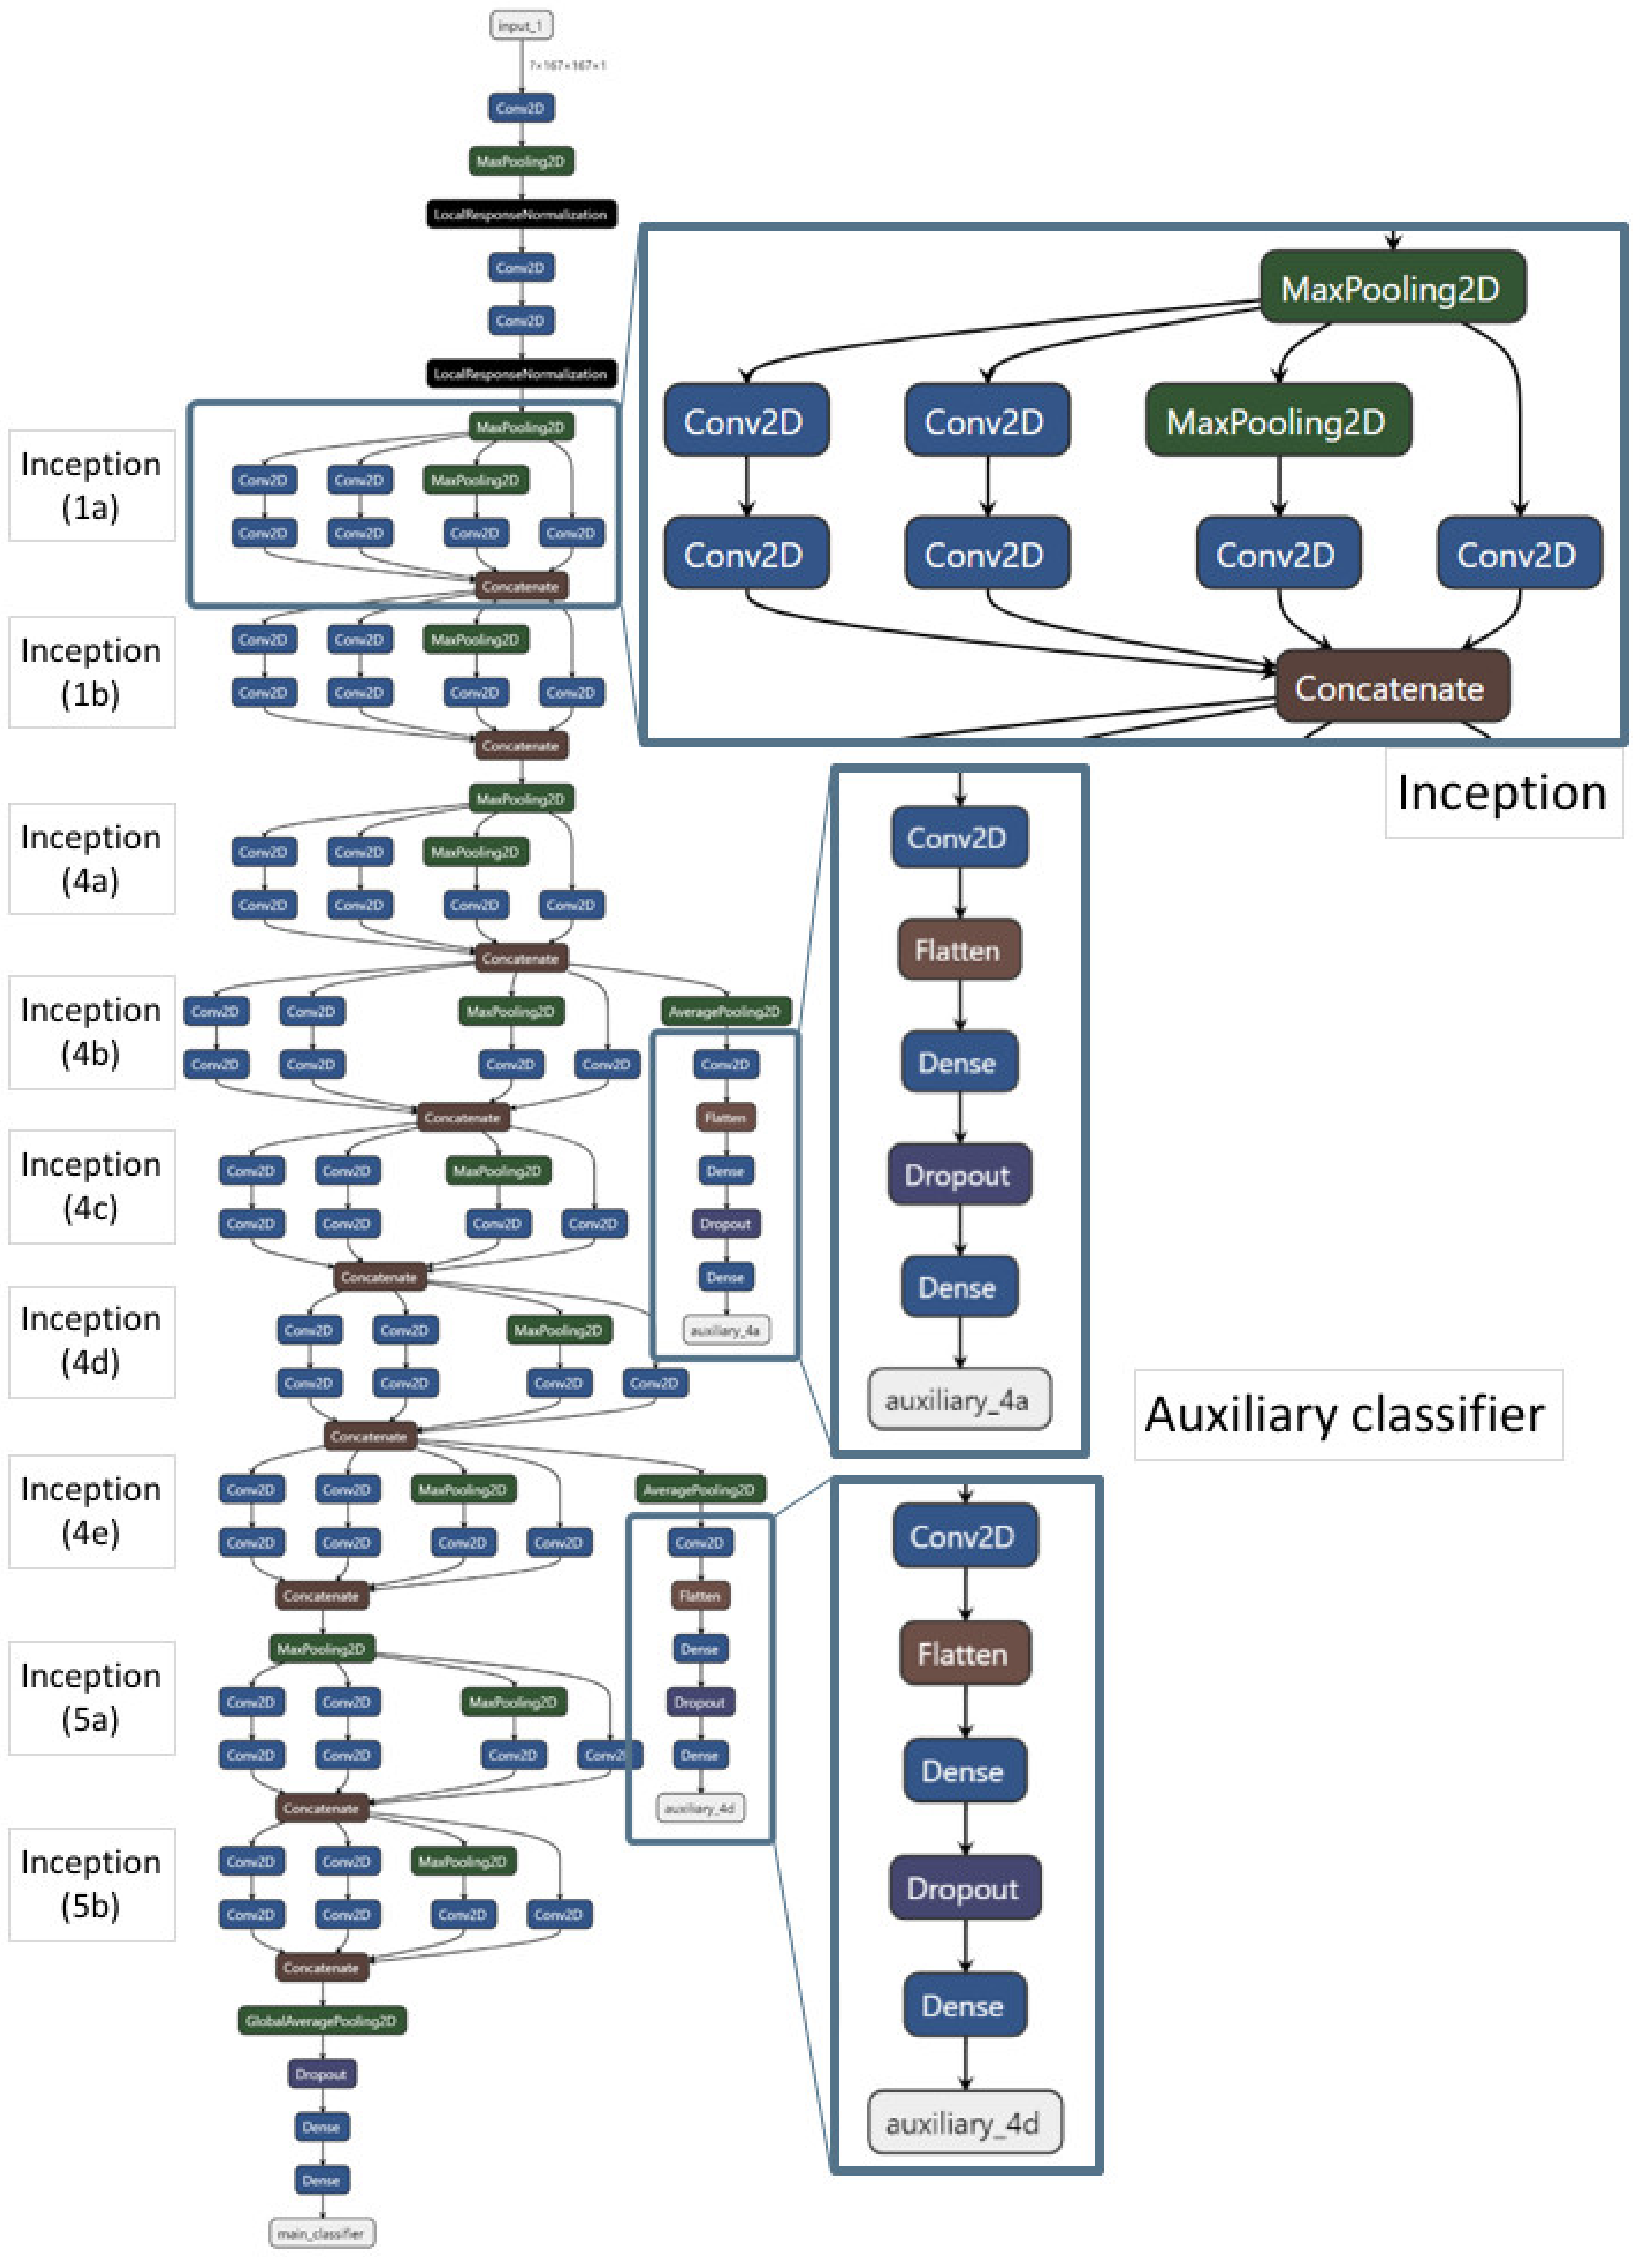
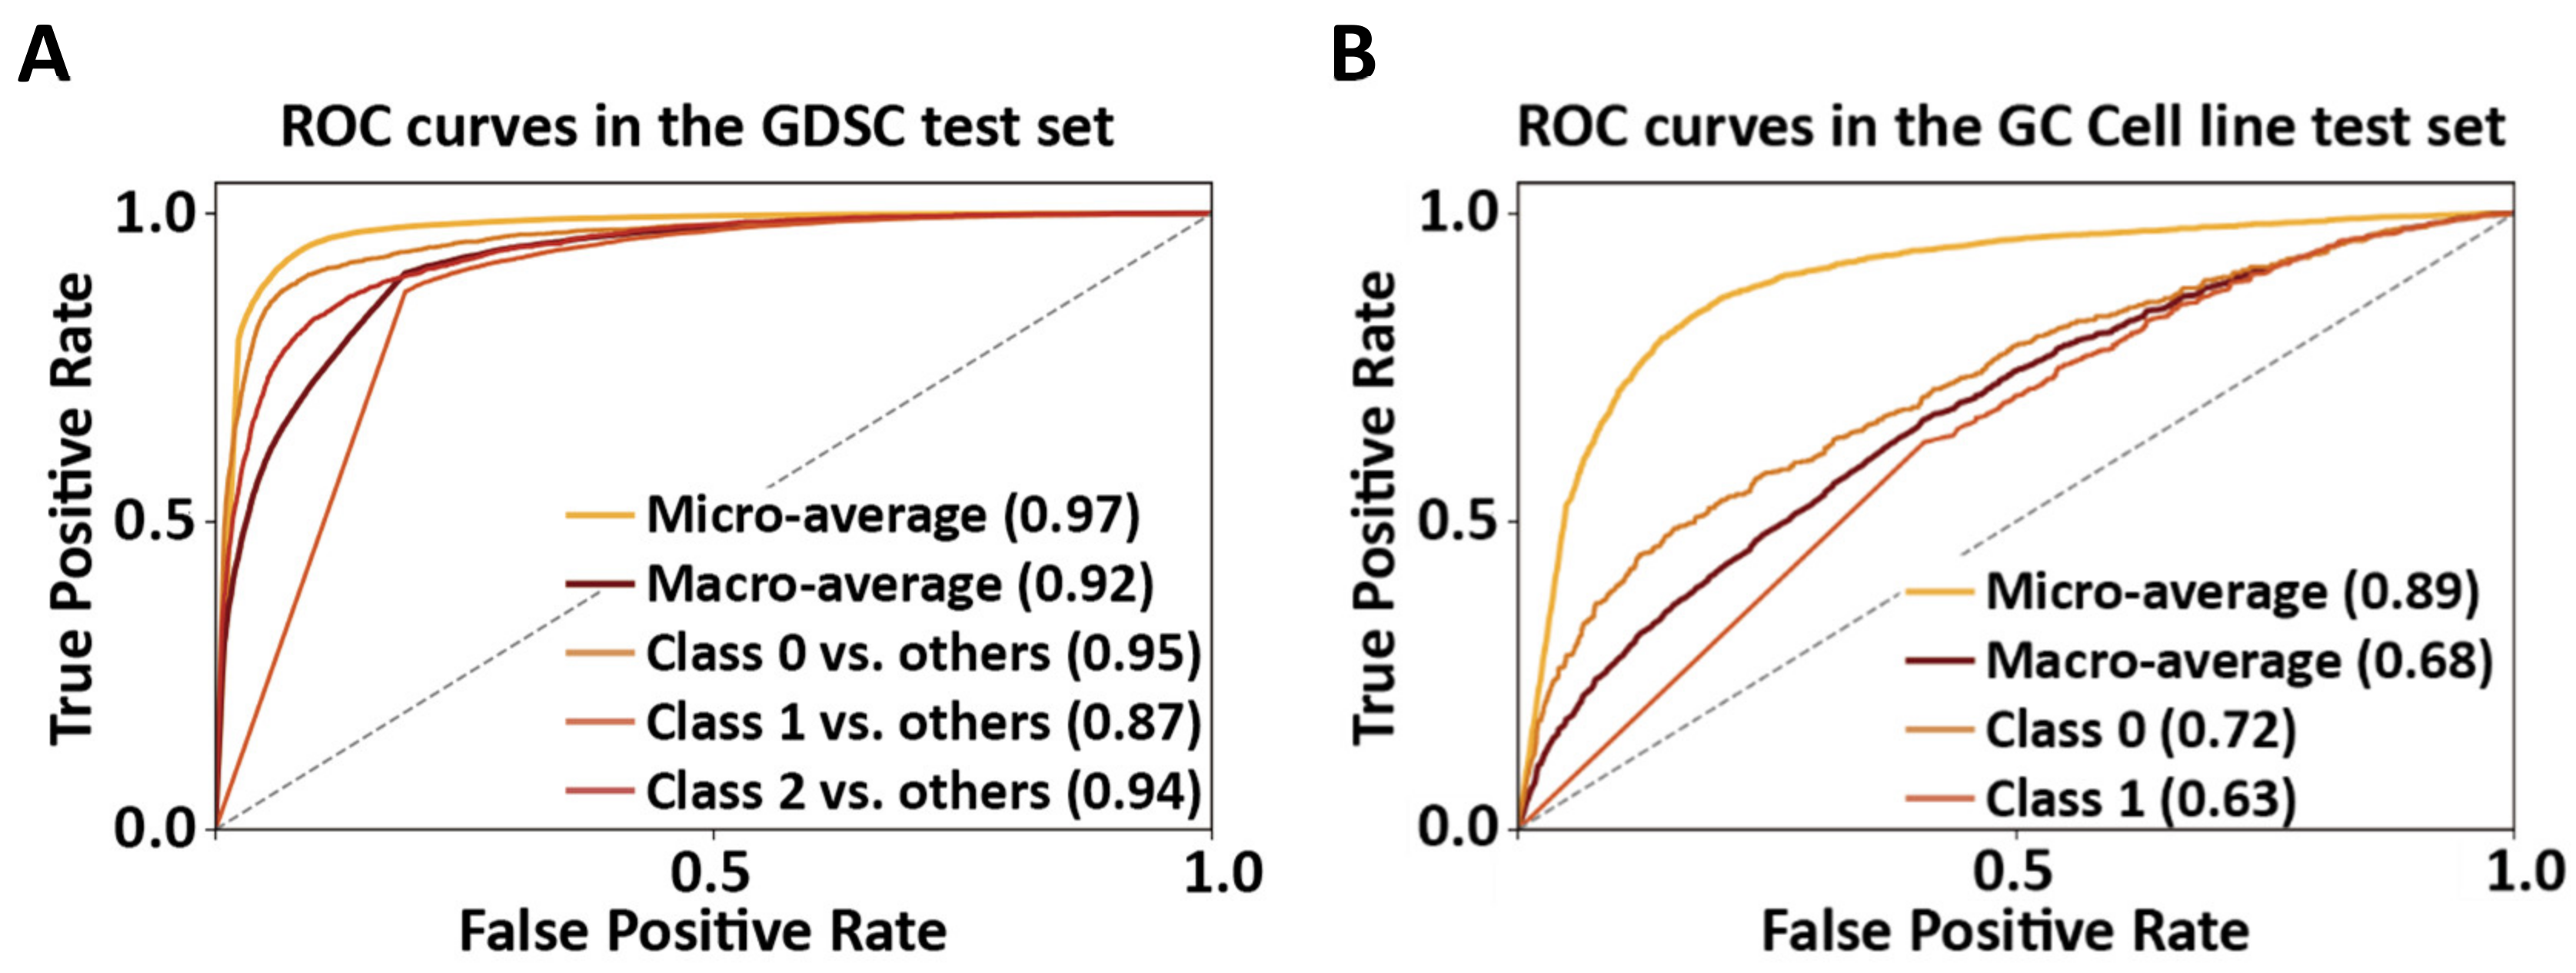
2.2. Model Construction and Performance of GoogLeNet
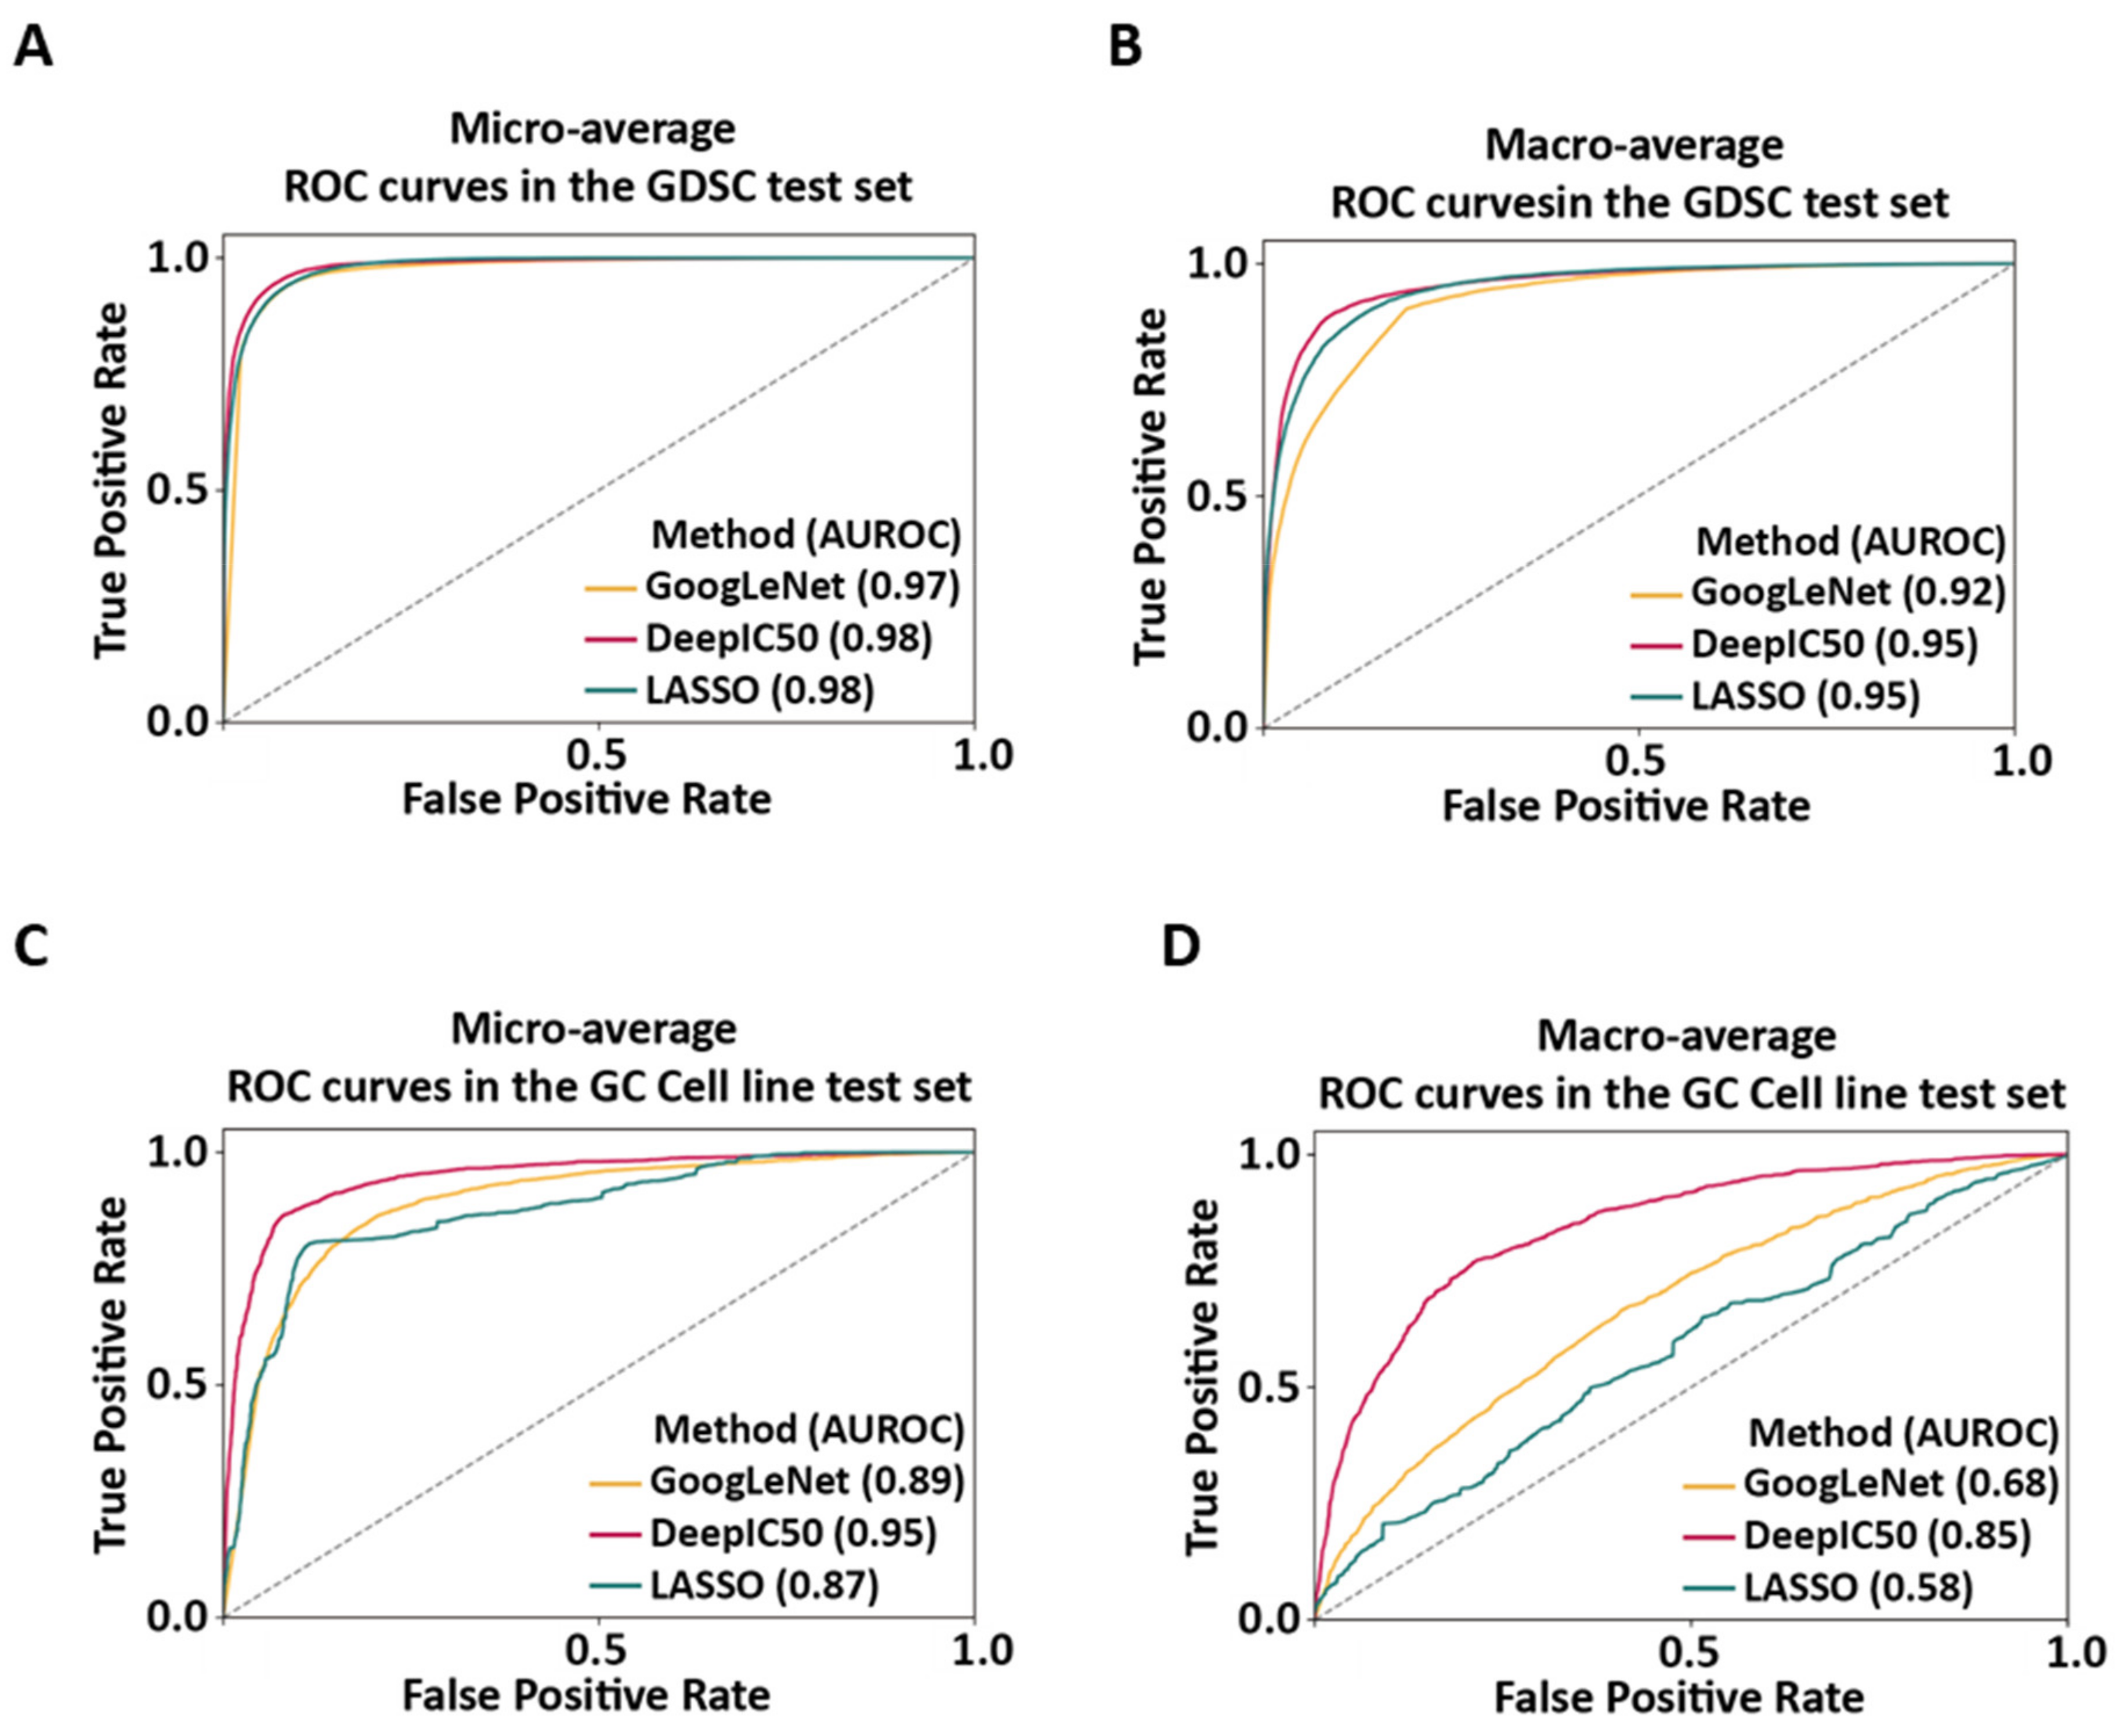
2.3. Performance Comparisons of GoogLeNet, DeepIC50, and LASSO
2.4. Application of GoogLeNet, DeepIC50, and LASSO to the TCGA-BRCA Patient Dataset
3. Discussion
4. Materials and Methods
4.1. Training and Test Datasets, and Molecular Fingerprints
4.2. An Independent Dataset for Clinical Follow-Up in Breast Cancer Patients
4.3. GoogLeNet Model Construction
4.4. Performance Comparisons of GoogLeNet, DeepIC50, and LASSO
4.5. Application of the Local Interpretable Model-Agnostic Explanation (LIME) to the TCGA-BRCA Dataset
Supplementary Materials
Author Contributions
Funding
Institutional Review Board Statement
Informed Consent Statement
Data Availability Statement
Acknowledgments
Conflicts of Interest
References
- Ashley, E.A. Towards precision medicine. Nat. Rev. Genet. 2016, 17, 507–522. [Google Scholar] [CrossRef]
- Garraway, L.A.; Verweij, J.; Ballman, K.V. Precision Oncology: An Overview. J. Clin. Oncol. 2013, 31, 1803–1805. [Google Scholar] [CrossRef] [Green Version]
- Hodson, R. Precision medicine. Nature 2016, 537, S49. [Google Scholar] [CrossRef] [Green Version]
- Chambliss, A.B.; Chan, D.W. Precision medicine: From pharmacogenomics to pharmacoproteomics. Clin. Proteom. 2016, 13, 25. [Google Scholar] [CrossRef] [PubMed] [Green Version]
- Filipp, F.V. Precision medicine driven by cancer systems biology. Cancer Metastasis Rev. 2017, 36, 91–108. [Google Scholar] [CrossRef] [Green Version]
- Ghasemi, M.; Nabipour, I.; Omrani, A.; Alipour, Z.; Assadi, M. Precision medicine and molecular imaging: New targeted approaches toward cancer therapeutic and diagnosis. Am. J. Nucl. Med. Mol. Imaging 2016, 6, 310–327. [Google Scholar] [PubMed]
- Shoemaker, R.H. The NCI60 human tumour cell line anticancer drug screen. Nat. Rev. Cancer 2006, 6, 813–823. [Google Scholar] [CrossRef]
- Weinshilboum, R.M.; Wang, L. Pharmacogenomics: Precision Medicine and Drug Response. Mayo Clin. Proc. 2017, 92, 1711–1722. [Google Scholar] [CrossRef] [PubMed]
- Curtis, C.; Shah, S.P.; Chin, S.-F.; Turashvili, G.; Rueda, O.M.; Dunning, M.J.; Speed, D.; Lynch, A.G.; Samarajiwa, S.; Yuan, Y.; et al. The genomic and transcriptomic architecture of 2000 breast tumours reveals novel subgroups. Nature 2012, 486, 346–352. [Google Scholar] [CrossRef] [PubMed]
- Muzny, D.M.; Bainbridge, M.N.; Chang, K.; Dinh, H.H.; Drummond, J.A.; Fowler, G.; Kovar, C.L.; Lewis, L.R.; Morgan, M.B.; Newsham, I.F.; et al. Comprehensive molecular characterization of human colon and rectal cancer. Nature 2012, 487, 330–337. [Google Scholar] [CrossRef] [Green Version]
- Shah, S.P.; Roth, A.; Goya, R.; Oloumi, A.; Ha, G.; Zhao, Y.; Turashvili, G.; Ding, J.; Tse, K.; Haffari, G.; et al. The clonal and mutational evolution spectrum of primary triple-negative breast cancers. Nature 2012, 486, 395–399. [Google Scholar] [CrossRef] [PubMed]
- Yuan, R.; Chen, S.; Wang, Y. Computational Prediction of Drug Responses in Cancer Cell Lines From Cancer Omics and Detection of Drug Effectiveness Related Methylation Sites. Front. Genet. 2020, 11. [Google Scholar] [CrossRef] [PubMed]
- Falzone, L.; Salomone, S.; Libra, M. Evolution of Cancer Pharmacological Treatments at the Turn of the Third Millennium. Front. Pharm. 2018, 9. [Google Scholar] [CrossRef] [PubMed] [Green Version]
- Jackson, A.L.; Loeb, L.A. The contribution of endogenous sources of DNA damage to the multiple mutations in cancer. Mutat. Res./Fundam. Mol. Mech. Mutagenesis 2001, 477, 7–21. [Google Scholar] [CrossRef]
- Lawrence, M.S.; Stojanov, P.; Polak, P.; Kryukov, G.V.; Cibulskis, K.; Sivachenko, A.; Carter, S.L.; Stewart, C.; Mermel, C.H.; Roberts, S.A.; et al. Mutational heterogeneity in cancer and the search for new cancer-associated genes. Nature 2013, 499, 214–218. [Google Scholar] [CrossRef]
- Loeb, L.A.; Loeb, K.R.; Anderson, J.P. Multiple mutations and cancer. Proc. Natl. Acad. Sci. USA 2003, 100, 776–781. [Google Scholar] [CrossRef] [PubMed] [Green Version]
- Stephens, P.J.; Tarpey, P.S.; Davies, H.; Van Loo, P.; Greenman, C.; Wedge, D.C.; Nik-Zainal, S.; Martin, S.; Varela, I.; Bignell, G.R.; et al. The landscape of cancer genes and mutational processes in breast cancer. Nature 2012, 486, 400–404. [Google Scholar] [CrossRef]
- Dagogo-Jack, I.; Shaw, A.T. Tumour heterogeneity and resistance to cancer therapies. Nat. Rev. Clin. Oncol. 2018, 15, 81–94. [Google Scholar] [CrossRef]
- Seyhan, A.A.; Carini, C. Are innovation and new technologies in precision medicine paving a new era in patients centric care? J. Transl. Med. 2019, 17, 114. [Google Scholar] [CrossRef] [Green Version]
- Geeleher, P.; Cox, N.J.; Huang, R.S. Clinical drug response can be predicted using baseline gene expression levels and in vitrodrug sensitivity in cell lines. Genome Biol. 2014, 15, R47. [Google Scholar] [CrossRef] [Green Version]
- Li, M.; Wang, Y.; Zheng, R.; Shi, X.; Li, Y.; Wu, F.X.; Wang, J. DeepDSC: A Deep Learning Method to Predict Drug Sensitivity of Cancer Cell Lines. IEEE/ACM Trans. Comput. Biol. Bioinform. 2021, 18, 575–582. [Google Scholar] [CrossRef]
- Preuer, K.; Lewis, R.P.I.; Hochreiter, S.; Bender, A.; Bulusu, K.C.; Klambauer, G. DeepSynergy: Predicting anti-cancer drug synergy with Deep Learning. Bioinformatics 2017, 34, 1538–1546. [Google Scholar] [CrossRef] [PubMed] [Green Version]
- Rampášek, L.; Hidru, D.; Smirnov, P.; Haibe-Kains, B.; Goldenberg, A. Dr.VAE: Improving drug response prediction via modeling of drug perturbation effects. Bioinformatics 2019, 35, 3743–3751. [Google Scholar] [CrossRef] [Green Version]
- Sharifi-Noghabi, H.; Zolotareva, O.; Collins, C.C.; Ester, M. MOLI: Multi-omics late integration with deep neural networks for drug response prediction. Bioinformatics 2019, 35, i501–i509. [Google Scholar] [CrossRef] [PubMed] [Green Version]
- Ding, M.Q.; Chen, L.; Cooper, G.F.; Young, J.D.; Lu, X. Precision Oncology beyond Targeted Therapy: Combining Omics Data with Machine Learning Matches the Majority of Cancer Cells to Effective Therapeutics. Mol. Cancer Res. 2018, 16, 269–278. [Google Scholar] [CrossRef] [Green Version]
- Baptista, D.; Ferreira, P.G.; Rocha, M. Deep learning for drug response prediction in cancer. Brief. Bioinform. 2020, 22, 360–379. [Google Scholar] [CrossRef] [PubMed]
- Adam, G.; Rampášek, L.; Safikhani, Z.; Smirnov, P.; Haibe-Kains, B.; Goldenberg, A. Machine learning approaches to drug response prediction: Challenges and recent progress. NPJ Precis. Oncol. 2020, 4, 19. [Google Scholar] [CrossRef]
- Joo, M.; Park, A.; Kim, K.; Son, W.-J.; Lee, H.S.; Lim, G.; Lee, J.; Lee, D.H.; An, J.; Kim, J.H.; et al. A Deep Learning Model for Cell Growth Inhibition IC50 Prediction and Its Application for Gastric Cancer Patients. Int. J. Mol. Sci. 2019, 20, 6276. [Google Scholar] [CrossRef] [PubMed] [Green Version]
- Liu, P.; Li, H.; Li, S.; Leung, K.-S. Improving prediction of phenotypic drug response on cancer cell lines using deep convolutional network. BMC Bioinform. 2019, 20, 408. [Google Scholar] [CrossRef]
- Cortés-Ciriano, I.; Bender, A. KekuleScope: Prediction of cancer cell line sensitivity and compound potency using convolutional neural networks trained on compound images. J. Cheminform. 2019, 11, 41. [Google Scholar] [CrossRef] [Green Version]
- Chang, Y.; Park, H.; Yang, H.-J.; Lee, S.; Lee, K.-Y.; Kim, T.S.; Jung, J.; Shin, J.-M. Cancer Drug Response Profile scan (CDRscan): A Deep Learning Model That Predicts Drug Effectiveness from Cancer Genomic Signature. Sci. Rep. 2018, 8, 8857. [Google Scholar] [CrossRef]
- Lamb, J.; Crawford, E.D.; Peck, D.; Modell, J.W.; Blat, I.C.; Wrobel, M.J.; Lerner, J.; Brunet, J.-P.; Subramanian, A.; Ross, K.N.; et al. The Connectivity Map: Using Gene-Expression Signatures to Connect Small Molecules, Genes, and Disease. Science 2006, 313, 1929–1935. [Google Scholar] [CrossRef] [Green Version]
- Barretina, J.; Caponigro, G.; Stransky, N.; Venkatesan, K.; Margolin, A.A.; Kim, S.; Wilson, C.J.; Lehár, J.; Kryukov, G.V.; Sonkin, D.; et al. The Cancer Cell Line Encyclopedia enables predictive modelling of anticancer drug sensitivity. Nature 2012, 483, 603–607. [Google Scholar] [CrossRef] [PubMed]
- Yang, W.; Soares, J.; Greninger, P.; Edelman, E.J.; Lightfoot, H.; Forbes, S.; Bindal, N.; Beare, D.; Smith, J.A.; Thompson, I.R.; et al. Genomics of Drug Sensitivity in Cancer (GDSC): A resource for therapeutic biomarker discovery in cancer cells. Nucleic Acids Res. 2012, 41, D955–D961. [Google Scholar] [CrossRef] [PubMed] [Green Version]
- Forbes, S.A.; Beare, D.; Boutselakis, H.; Bamford, S.; Bindal, N.; Tate, J.; Cole, C.G.; Ward, S.; Dawson, E.; Ponting, L.; et al. COSMIC: Somatic cancer genetics at high-resolution. Nucleic Acids Res. 2016, 45, D777–D783. [Google Scholar] [CrossRef]
- Grossman, R.L.; Heath, A.P.; Ferretti, V.; Varmus, H.E.; Lowy, D.R.; Kibbe, W.A.; Staudt, L.M. Toward a Shared Vision for Cancer Genomic Data. N. Engl. J. Med. 2016, 375, 1109–1112. [Google Scholar] [CrossRef] [PubMed]
- Shinde, P.P.; Shah, S. A Review of Machine Learning and Deep Learning Applications. In Proceedings of the 2018 Fourth International Conference on Computing Communication Control and Automation (ICCUBEA), Pune, India, 16–18 August 2018; pp. 1–6. [Google Scholar]
- Vaz, J.M.; Balaji, S. Convolutional neural networks (CNNs): Concepts and applications in pharmacogenomics. Mol. Divers. 2021. [Google Scholar] [CrossRef] [PubMed]
- Lecun, Y.; Bottou, L.; Bengio, Y.; Haffner, P. Gradient-based learning applied to document recognition. Proc. IEEE 1998, 86, 2278–2324. [Google Scholar] [CrossRef] [Green Version]
- Véstias, M.P. A Survey of Convolutional Neural Networks on Edge with Reconfigurable Computing. Algorithms 2019, 12, 154. [Google Scholar] [CrossRef] [Green Version]
- Szegedy, C.; Wei, L.; Yangqing, J.; Sermanet, P.; Reed, S.; Anguelov, D.; Erhan, D.; Vanhoucke, V.; Rabinovich, A. Going deeper with convolutions. Proceedings of 2015 IEEE Conference on Computer Vision and Pattern Recognition (CVPR), Boston, MA, USA, 7–12 June 2015; pp. 1–9. [Google Scholar]
- Williams, A.M.; Liu, Y.; Regner, K.R.; Jotterand, F.; Liu, P.; Liang, M. Artificial intelligence, physiological genomics, and precision medicine. Physiol. Genom. 2018, 50, 237–243. [Google Scholar] [CrossRef] [Green Version]
- Sheng, J.; Li, F.; Wong, S.T.C. Optimal Drug Prediction From Personal Genomics Profiles. IEEE J. Biomed. Health Inform. 2015, 19, 1264–1270. [Google Scholar] [CrossRef] [PubMed]
- Johnson, K.B.; Wei, W.-Q.; Weeraratne, D.; Frisse, M.E.; Misulis, K.; Rhee, K.; Zhao, J.; Snowdon, J.L. Precision Medicine, AI, and the Future of Personalized Health Care. Clin. Transl. Sci. 2021, 14, 86–93. [Google Scholar] [CrossRef]
- Chiu, Y.-C.; Chen, H.-I.H.; Zhang, T.; Zhang, S.; Gorthi, A.; Wang, L.-J.; Huang, Y.; Chen, Y. Predicting drug response of tumors from integrated genomic profiles by deep neural networks. BMC Med. Genom. 2019, 12, 18. [Google Scholar] [CrossRef]
- Sokolova, M.; Lapalme, G. A systematic analysis of performance measures for classification tasks. Inf. Process. Manag. 2009, 45, 427–437. [Google Scholar] [CrossRef]
- Kautz, T.; Eskofier, B.M.; Pasluosta, C.F. Generic performance measure for multiclass-classifiers. Pattern Recognit. 2017, 68, 111–125. [Google Scholar] [CrossRef]
- Hand, D.J.; Till, R.J. A Simple Generalisation of the Area Under the ROC Curve for Multiple Class Classification Problems. Mach. Learn. 2001, 45, 171–186. [Google Scholar] [CrossRef]
- Jin, H.; Ling, C.X. Using AUC and accuracy in evaluating learning algorithms. IEEE Trans. Knowl. Data Eng. 2005, 17, 299–310. [Google Scholar] [CrossRef] [Green Version]
- Ribeiro, M.T.; Singh, S.; Guestrin, C. “Why Should I Trust You?”: Explaining the Predictions of Any Classifier. In Proceedings of the 22nd ACM SIGKDD International Conference on Knowledge Discovery and Data Mining, New York, NY, USA, 13 August 2016; pp. 1135–1144. [Google Scholar] [CrossRef]
- Lüönd, F.; Tiede, S.; Christofori, G. Breast cancer as an example of tumour heterogeneity and tumour cell plasticity during malignant progression. Br. J. Cancer 2021. [Google Scholar] [CrossRef] [PubMed]
- Turashvili, G.; Brogi, E. Tumor Heterogeneity in Breast Cancer. Front. Med. 2017, 4, 227. [Google Scholar] [CrossRef] [Green Version]
- Gary, W.C.; Zhengyin, Y.; Wensheng, L.; John, A.M. The IC50 Concept Revisited. Curr. Top. Med. Chem. 2012, 12, 1282–1290. [Google Scholar] [CrossRef]
- Yap, C.W. PaDEL-descriptor: An open source software to calculate molecular descriptors and fingerprints. J. Comput. Chem. 2011, 32, 1466–1474. [Google Scholar] [CrossRef]
- Fernández-de Gortari, E.; García-Jacas, C.R.; Martinez-Mayorga, K.; Medina-Franco, J.L. Database fingerprint (DFP): An approach to represent molecular databases. J. Cheminform. 2017, 9, 1–9. [Google Scholar] [CrossRef] [Green Version]
- Subbiah, V.; Chuang, H.H.; Gambhire, D.; Kairemo, K. Defining Clinical Response Criteria and Early Response Criteria for Precision Oncology: Current State-of-the-Art and Future Perspectives. Diagnostics (Basel) 2017, 7, 10. [Google Scholar] [CrossRef] [Green Version]
- Qian, Z.; Hayes, T.L.; Kafle, K.; Kanan, C. Do We Need Fully Connected Output Layers in Convolutional Networks? arXiv 2020, arXiv:2004.13587. [Google Scholar]
- You, J.; McLeod, R.D.; Hu, P. Predicting drug-target interaction network using deep learning model. Comput. Biol. Chem. 2019, 80, 90–101. [Google Scholar] [CrossRef] [PubMed]
- Krawczyk, B.; Galar, M.; Woźniak, M.; Bustince, H.; Herrera, F. Dynamic ensemble selection for multi-class classification with one-class classifiers. Pattern Recognit. 2018, 83, 34–51. [Google Scholar] [CrossRef]
- Fawcett, T. An introduction to ROC analysis. Pattern Recognit. Lett. 2006, 27, 861–874. [Google Scholar] [CrossRef]
Publisher’s Note: MDPI stays neutral with regard to jurisdictional claims in published maps and institutional affiliations. |
© 2021 by the authors. Licensee MDPI, Basel, Switzerland. This article is an open access article distributed under the terms and conditions of the Creative Commons Attribution (CC BY) license (https://creativecommons.org/licenses/by/4.0/).
Share and Cite
Lee, Y.; Nam, S. Performance Comparisons of AlexNet and GoogLeNet in Cell Growth Inhibition IC50 Prediction. Int. J. Mol. Sci. 2021, 22, 7721. https://doi.org/10.3390/ijms22147721
Lee Y, Nam S. Performance Comparisons of AlexNet and GoogLeNet in Cell Growth Inhibition IC50 Prediction. International Journal of Molecular Sciences. 2021; 22(14):7721. https://doi.org/10.3390/ijms22147721
Chicago/Turabian StyleLee, Yeeun, and Seungyoon Nam. 2021. "Performance Comparisons of AlexNet and GoogLeNet in Cell Growth Inhibition IC50 Prediction" International Journal of Molecular Sciences 22, no. 14: 7721. https://doi.org/10.3390/ijms22147721
APA StyleLee, Y., & Nam, S. (2021). Performance Comparisons of AlexNet and GoogLeNet in Cell Growth Inhibition IC50 Prediction. International Journal of Molecular Sciences, 22(14), 7721. https://doi.org/10.3390/ijms22147721