
Evidence for Non-Cancer-Specific T Cell Exhaustion in the Tcl1 Mouse Model for Chronic Lymphocytic Leukemia

 , , , , and
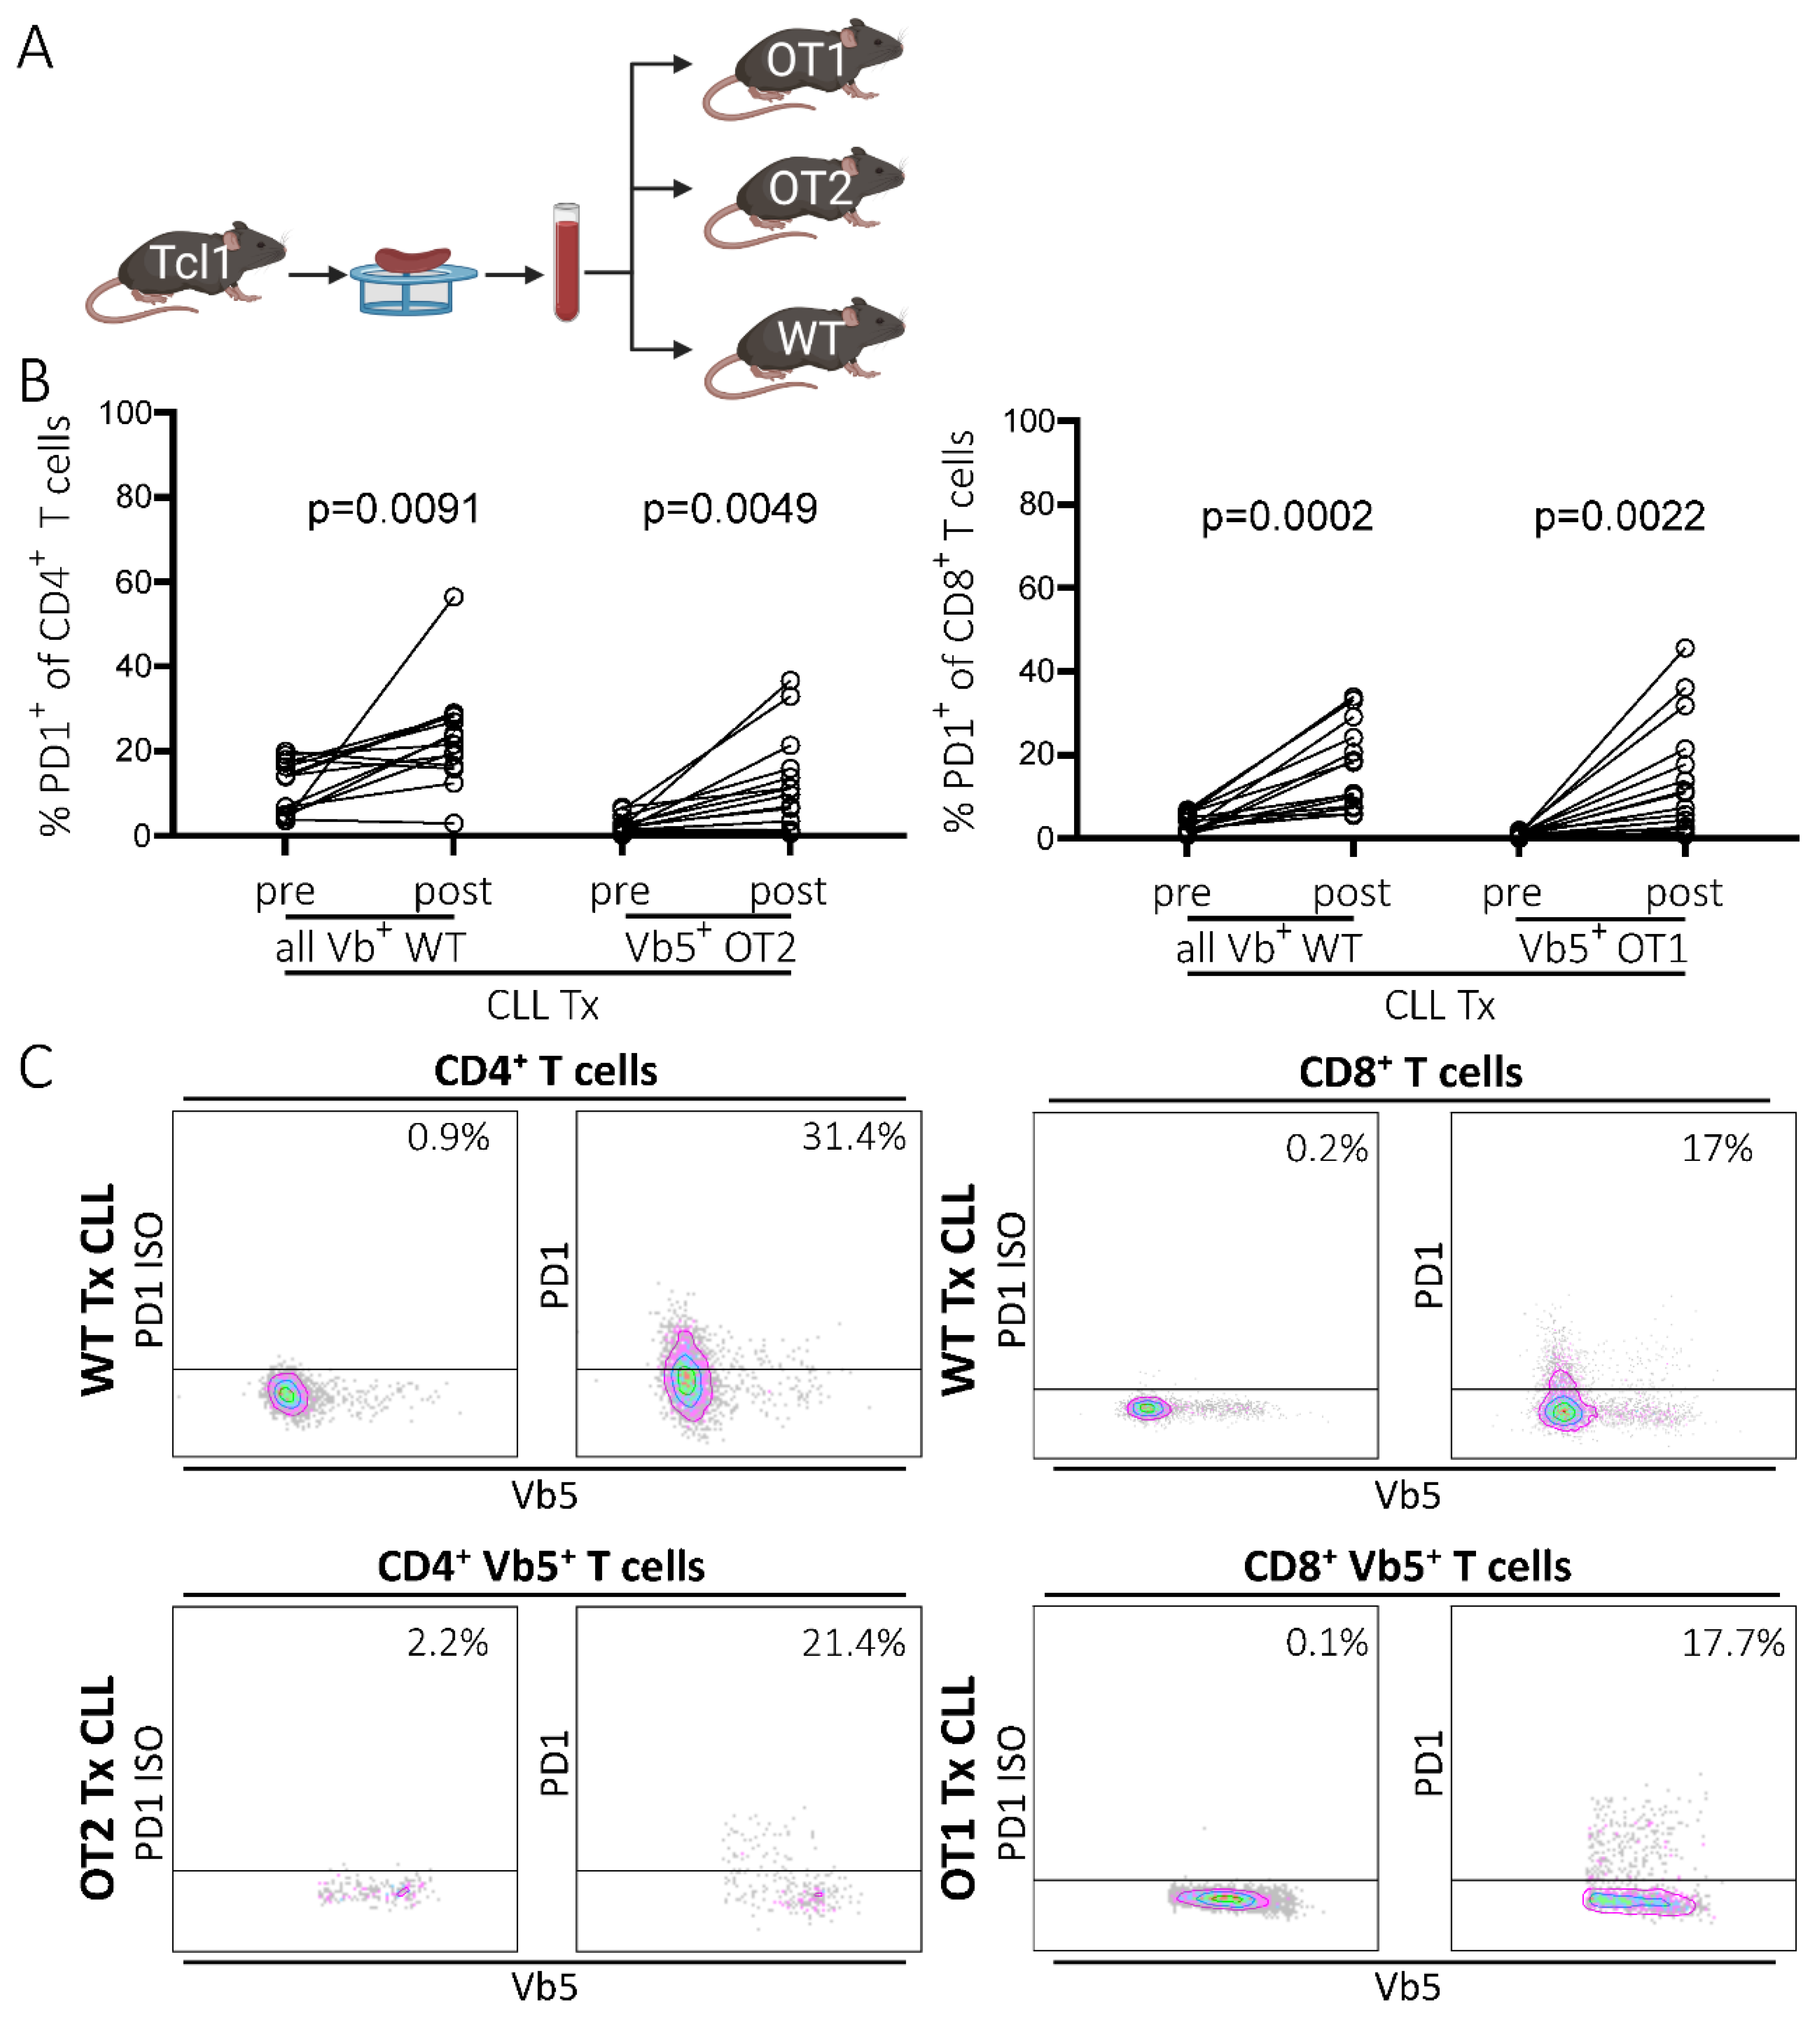
Abstract
1. Introduction
2. Results
2.1. PD1 Expression Is Upregulated in Non-CLL-Specific T Cells upon Leukemia Development
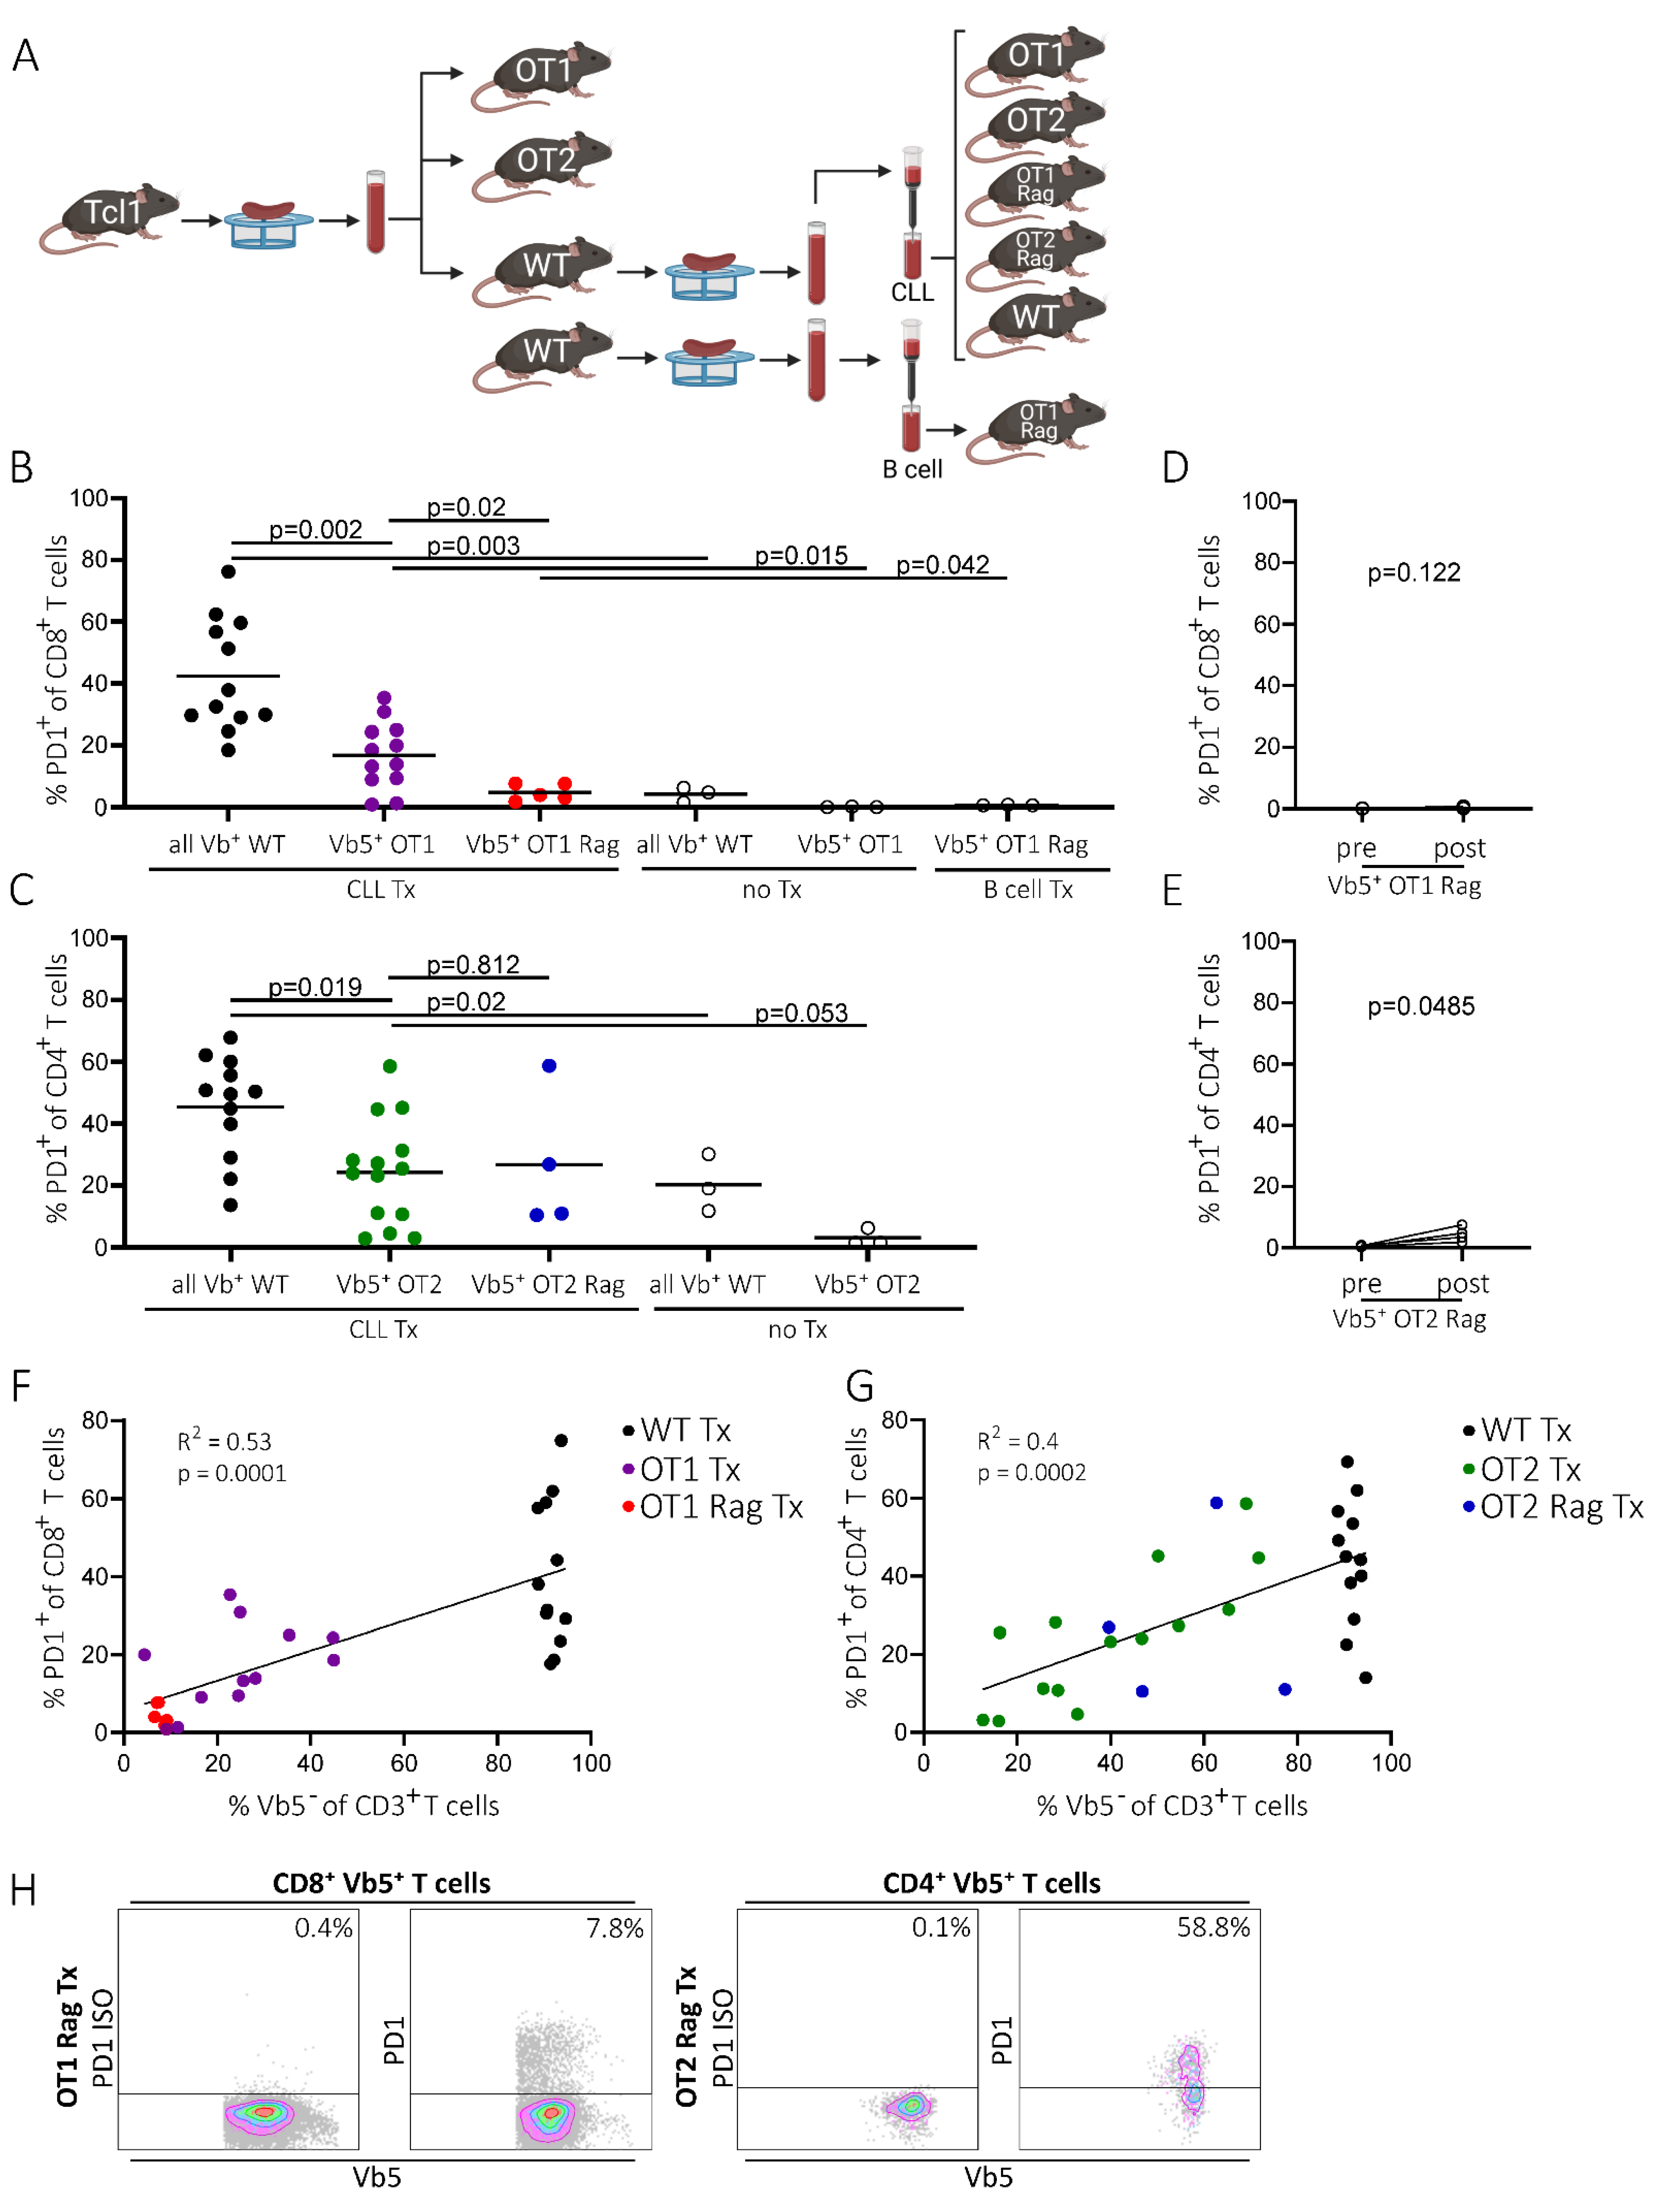
2.2. PD1 Upregulation on Non-CLL-Specific T Cells Is Independent of Endogenous TCR Expression and Correlates with PD1 Levels of Endogenous T Cells
2.3. PD1 Expression of Non-CLL-Specific T Cells Is Dependent on the Presence of Potentially Tumor-Specific T Cells
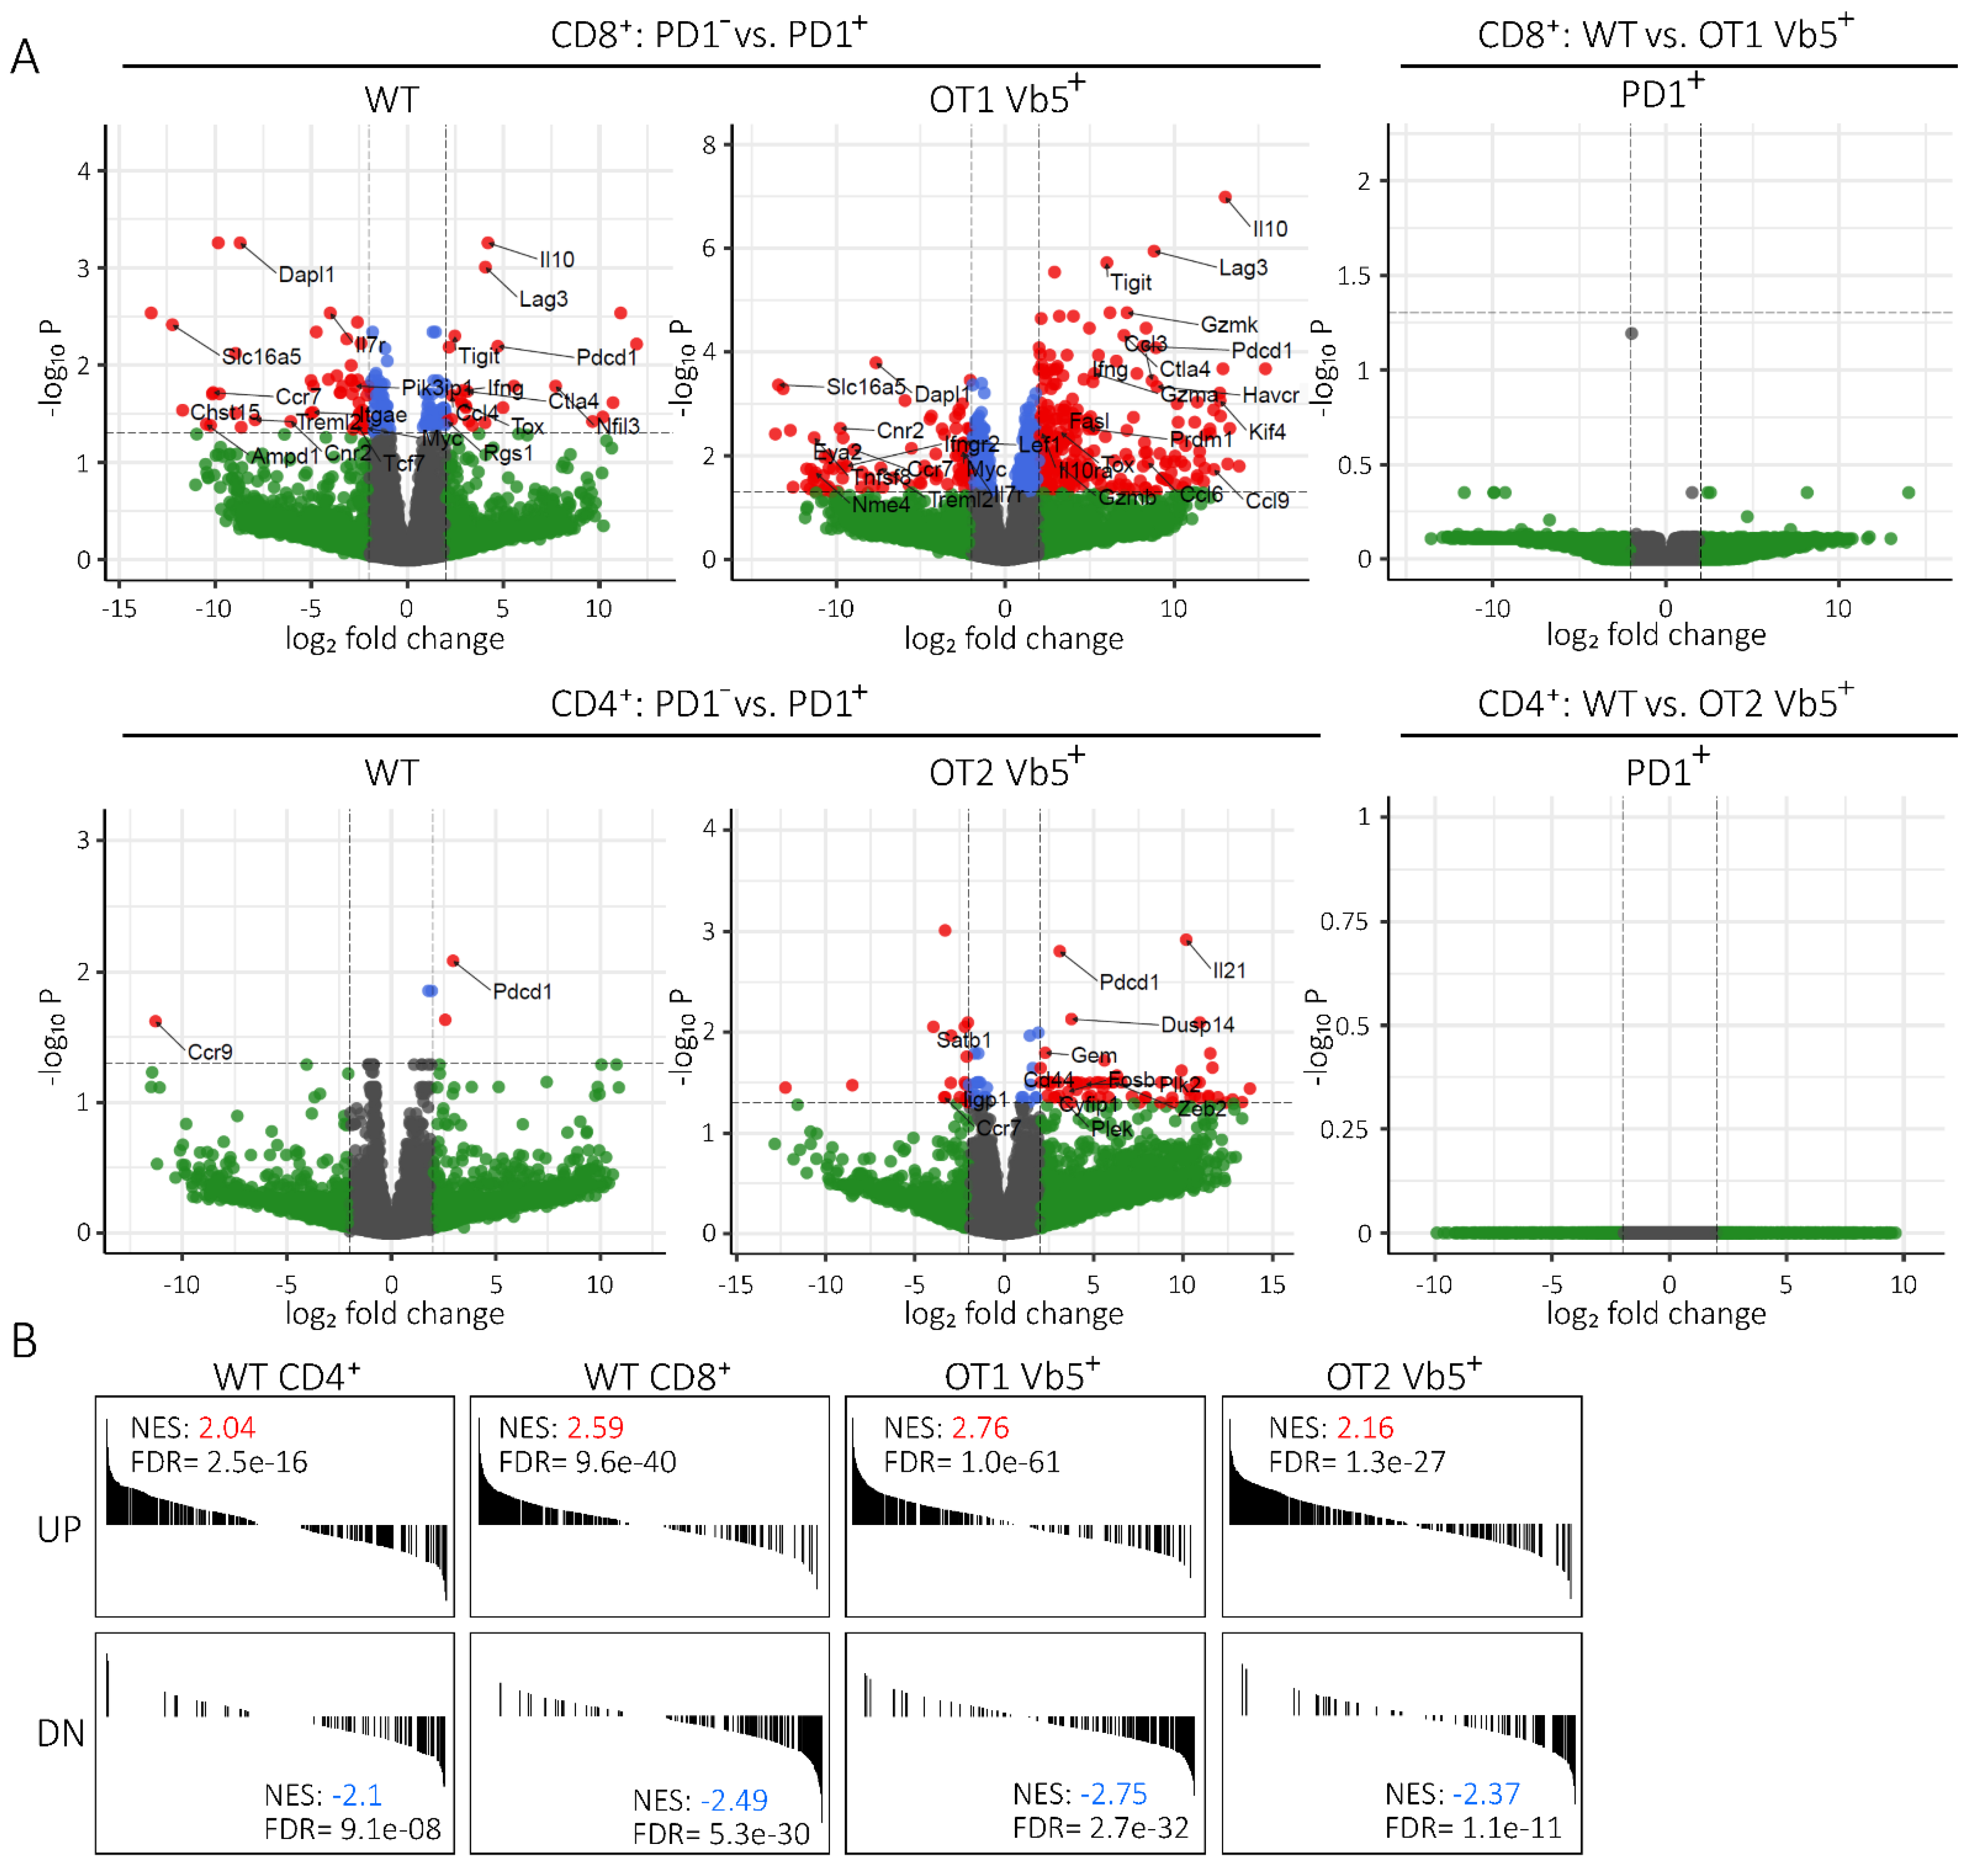
2.4. Transcriptome of PD1pos Non-CLL-Specific T Cells Mimics Expression Signature of Functionally Exhausted T Cells
3. Discussion
4. Materials and Methods
4.1. Mice
4.2. Flow Cytometry
4.3. BCR Analysis
4.4. Cell Sorting
4.5. RNA-Seq Analysis
4.6. Statistical Analysis
5. Conclusions
Supplementary Materials
Author Contributions
Funding
Institutional Review Board Statement
Informed Consent Statement
Data Availability Statement
Conflicts of Interest
References
- Feola, S.; Chiaro, J.; Martins, B.; Cerullo, V. Uncovering the Tumor Antigen Landscape: What to Know about the Discovery Process. Cancers 2020, 12, 1660. [Google Scholar] [CrossRef] [PubMed]
- Bräunlein, E.; Krackhardt, A.M. Identification and Characterization of Neoantigens as Well as Respective Immune Responses in Cancer Patients. Front. Immunol. 2017, 8, 1702. [Google Scholar] [CrossRef] [PubMed]
- Aaes, T.L.; Vandenabeele, P. The intrinsic immunogenic properties of cancer cell lines, immunogenic cell death, and how these influence host antitumor immune responses. Cell Death Differ. 2021, 28, 843–860. [Google Scholar] [CrossRef] [PubMed]
- Tormoen, G.W.; Crittenden, M.R.; Gough, M. Role of the immunosuppressive microenvironment in immunotherapy. Adv. Radiat. Oncol. 2018, 3, 520–526. [Google Scholar] [CrossRef]
- Catakovic, K.; Klieser, E.; Neureiter, D.; Geisberger, R. T cell exhaustion: From pathophysiological basics to tumor immuno-therapy. Cell Commun. Signal. 2017, 15, 1. [Google Scholar] [CrossRef] [PubMed]
- Wherry, E.J.; Blattman, J.N.; Murali-Krishna, K.; van der Most, R.; Ahmed, R. Viral Persistence Alters CD8 T-Cell Immunodominance and Tissue Distribution and Results in Distinct Stages of Functional Impairment. J. Virol. 2003, 77, 4911–4927. [Google Scholar] [CrossRef]
- Wherry, E.J.; Kurachi, M. Molecular and cellular insights into T cell exhaustion. Nat. Rev. Immunol. 2015, 15, 486–499. [Google Scholar] [CrossRef]
- Wherry, E.J.; Ha, S.J.; Kaech, S.M.; Haining, W.N.; Sarkar, S.; Kalia, V.; Subramaniam, S.; Blattman, J.N.; Barber, D.L.; Ahmed, R. Molecular signature of CD8+ T cell exhaustion during chronic viral infection. Immunity 2007, 27, 670–684. [Google Scholar] [CrossRef]
- Huemer, F.; Leisch, M.; Geisberger, R.; Melchardt, T.; Rinnerthaler, G.; Zaborsky, N.; Greil, R. Combination Strategies for Im-mune-Checkpoint Blockade and Response Prediction by Artificial Intelligence. Int. J. Mol. Sci. 2020, 21, 2856. [Google Scholar] [CrossRef] [PubMed]
- Xu-Monette, Z.Y.; Zhou, J.; Young, K.H. PD-1 expression and clinical PD-1 blockade in B-cell lymphomas. Blood 2018, 131, 68–83. [Google Scholar] [CrossRef]
- Gassner, F.J.; Zaborsky, N.; Catakovic, K.; Rebhandl, S.; Huemer, M.; Egle, A.; Hartmann, T.N.; Greil, R.; Geisberger, R. Chronic lymphocytic leukaemia induces an exhausted T cell phenotype in the TCL 1 transgenic mouse model. Br. J. Haematol. 2015, 170, 515–522. [Google Scholar] [CrossRef] [PubMed]
- Gassner, F.J.; Zaborsky, N.; Neureiter, D.; Huemer, M.; Melchardt, T.; Egle, A.; Rebhandl, S.; Catakovic, K.; Hartmann, T.N.; Greil, R.; et al. Chemotherapy-induced augmentation of T cells expressing inhibitory receptors is reversed by treatment with lenalidomide in chronic lymphocytic leukemia. Haematologica 2014, 99, 67–69. [Google Scholar] [CrossRef]
- Hofbauer, J.P.; Heyder, C.; Denk, U.; Kocher, T.; Holler, C.; Trapin, D.; Asslaber, D.; Tinhofer, I.; Greil, R.; Egle, A. Development of CLL in the TCL1 transgenic mouse model is associated with severe skewing of the T-cell compartment homologous to human CLL. Leukemia 2011, 25, 1452–1458. [Google Scholar] [CrossRef] [PubMed]
- Barnden, M.J.; Allison, J.; Heath, W.R.; Carbone, F.R. Defective TCR expression in transgenic mice constructed using cDNA-based alpha- and beta-chain genes under the control of heterologous regulatory elements. Immunol. Cell Biol. 1998, 76, 34–40. [Google Scholar] [CrossRef]
- Hogquist, K.A.; Jameson, S.; Heath, W.R.; Howard, J.L.; Bevan, M.J.; Carbone, F.R. T cell receptor antagonist peptides induce positive selection. Cell 1994, 76, 17–27. [Google Scholar] [CrossRef]
- Schatz, D.G.; Oettinger, M.A.; Baltimore, D. The V(D)J recombination activating gene, RAG-1. Cell 1989, 59, 1035–1048. [Google Scholar] [CrossRef]
- Oettinger, M.A.; Schatz, D.G.; Gorka, C.; Baltimore, D. RAG-1 and RAG-2, adjacent genes that synergistically activate V(D)J re-combination. Science 1990, 248, 1517–1523. [Google Scholar] [CrossRef]
- Zaborsky, N.; Gassner, F.J.; Asslaber, D.; Reinthaler, P.; Denk, U.; Flenady, S.; Hofbauer, J.P.; Danner, B.; Rebhandl, S.; Harrer, A.; et al. CD1d expression on chronic lymphocytic leukemia B cells affects disease progression and induces T cell skewing in CD8 positive and CD4CD8 double negative T cells. Oncotarget 2016, 7, 49459–49469. [Google Scholar] [CrossRef] [PubMed][Green Version]
- Crawford, A.; Angelosanto, J.M.; Kao, C.; Doering, T.A.; Odorizzi, P.M.; Barnett, B.E.; Wherry, E.J. Molecular and Transcriptional Basis of CD4+ T Cell Dysfunction during Chronic Infection. Immunity 2014, 40, 289–302. [Google Scholar] [CrossRef] [PubMed]
- Ding, W.; LaPlant, B.R.; Call, T.G.; Parikh, S.A.; Leis, J.F.; He, R.; Shanafelt, T.D.; Sinha, S.; Le-Rademacher, J.; Feldman, A.L.; et al. Pembrolizumab in patients with CLL and Richter transformation or with relapsed CLL. Blood 2017, 129, 3419–3427. [Google Scholar] [CrossRef]
- Pogorelyy, M.; Shugay, M. A Framework for Annotation of Antigen Specificities in High-Throughput T-Cell Repertoire Sequencing Studies. Front. Immunol. 2019, 10, 2159. [Google Scholar] [CrossRef] [PubMed]
- Catakovic, K.; Gassner, F.J.; Ratswohl, C.; Zaborsky, N.; Rebhandl, S.; Schubert, M.; Steiner, M.; Gutjahr, J.C.; Pleyer, L.; Egle, A.; et al. TIGIT expressing CD4+T cells represent a tumor-supportive T cell subset in chronic lymphocytic leukemia. OncoImmunology 2017, 7, e1371399. [Google Scholar] [CrossRef]
- Zaborsky, N.; Holler, C.; Geisberger, R.; Asslaber, D.; Gassner, F.J.; Egger, V.; Piñón-Hofbauer, J.; Kocher, T.; Hartmann, T.N.; Greil, R.; et al. B cell receptor usage correlates with the sensitivity to CD40 stimulation and the occurrence of CD4+ T cell clonality in chronic lymphocytic leukemia. Haematologica 2015, 100, e307. [Google Scholar] [CrossRef] [PubMed][Green Version]
- Tinhofer, I.; Weiss, L.; Gassner, F.; Rubenzer, G.; Holler, C.; Greil, R. Difference in the relative distribution of CD4+ T-cell subsets in B-CLL with mutated and unmutated immunoglobulin (Ig) VH genes: Implication for the course of disease. J. Immunother. 2009, 32, 302–309. [Google Scholar] [CrossRef] [PubMed]
- Crespo, J.; Sun, H.; Welling, T.H.; Tian, Z.; Zou, W. T cell anergy, exhaustion, senescence, and stemness in the tumor microenvi-ronment. Curr. Opin. Immunol. 2013, 25, 214–221. [Google Scholar] [CrossRef]
- Weiss, L.; Melchardt, T.; Egle, A.; Grabmer, C.; Greil, R.; Tinhofer, I. Regulatory T cells predict the time to initial treatment in early stage chronic lymphocytic leukemia. Cancer 2010, 117, 2163–2169. [Google Scholar] [CrossRef] [PubMed]
- Tsiodras, S.; Samonis, G.; Keating, M.J.; Kontoyiannis, D.P. Infection and Immunity in Chronic Lymphocytic Leukemia. Mayo Clin. Proc. 2000, 75, 1039–1054. [Google Scholar] [CrossRef]
- Murphy, K.; Heimberger, A.; Loh, D. Induction by antigen of intrathymic apoptosis of CD4+CD8+TCRlo thymocytes in vivo. Science 1990, 250, 1720–1723. [Google Scholar] [CrossRef]
- Zaborsky, N.; Gassner, F.J.; Höpner, J.P.; Schubert, M.; Hebenstreit, D.; Stark, R.; Asslaber, D.; Steiner, M.; Geisberger, R.; Greil, R.; et al. Exome sequencing of the TCL1 mouse model for CLL reveals genetic heterogeneity and dynamics during disease development. Leukemia 2019, 33, 957–968. [Google Scholar] [CrossRef] [PubMed]
- Andrews, S. A Quality Control Tool for High throughput Sequence Data; ScienceOpen: Berlin, Germany, 2010. [Google Scholar]
- Bolger, A.M.; Lohse, M.; Usadel, B. Trimmomatic: A flexible trimmer for Illumina sequence data. Bioinformatics 2014, 30, 2114–2120. [Google Scholar] [CrossRef]
- Dobin, A.; Davis, C.A.; Schlesinger, F.; Drenkow, J.; Zaleski, C.; Jha, S.; Batut, P.; Chaisson, M.; Gingeras, T.R. STAR: Ultrafast universal RNA-seq aligner. Bioinformatics 2013, 29, 15–21. [Google Scholar] [CrossRef] [PubMed]
- Liao, Y.; Smyth, G.K.; Shi, W. featureCounts: An efficient general purpose program for assigning sequence reads to genomic features. Bioinformatics 2013, 30, 923–930. [Google Scholar] [CrossRef] [PubMed]
- Robinson, M.D.; McCarthy, D.J.; Smyth, G.K. edgeR: A Bioconductor package for differential expression analysis of digital gene expression data. Bioinformatics 2010, 26, 139–140. [Google Scholar] [CrossRef]
- Blighe, K. Publication-Ready Volcano Plots with Enhanced Colouring and Labeling. 2018. Available online: https://github.com/kevinblighe/EnhancedVolcano (accessed on 15 May 2021).
- Sergushichev, A.A. An algorithm for fast preranked gene set enrichment analysis using cumulative statistic calculation. BioRvix 2016, 060012. [Google Scholar] [CrossRef]


Publisher’s Note: MDPI stays neutral with regard to jurisdictional claims in published maps and institutional affiliations. |
© 2021 by the authors. Licensee MDPI, Basel, Switzerland. This article is an open access article distributed under the terms and conditions of the Creative Commons Attribution (CC BY) license (https://creativecommons.org/licenses/by/4.0/).
Share and Cite
Parigger, T.; Gassner, F.J.; Scherhäufl, C.; Bakar, A.A.; Höpner, J.P.; Hödlmoser, A.; Steiner, M.; Catakovic, K.; Geisberger, R.; Greil, R.; et al. Evidence for Non-Cancer-Specific T Cell Exhaustion in the Tcl1 Mouse Model for Chronic Lymphocytic Leukemia. Int. J. Mol. Sci. 2021, 22, 6648. https://doi.org/10.3390/ijms22136648
Parigger T, Gassner FJ, Scherhäufl C, Bakar AA, Höpner JP, Hödlmoser A, Steiner M, Catakovic K, Geisberger R, Greil R, et al. Evidence for Non-Cancer-Specific T Cell Exhaustion in the Tcl1 Mouse Model for Chronic Lymphocytic Leukemia. International Journal of Molecular Sciences. 2021; 22(13):6648. https://doi.org/10.3390/ijms22136648
Chicago/Turabian StyleParigger, Thomas, Franz Josef Gassner, Christian Scherhäufl, Aryunni Abu Bakar, Jan Philip Höpner, Alexandra Hödlmoser, Markus Steiner, Kemal Catakovic, Roland Geisberger, Richard Greil, and et al. 2021. "Evidence for Non-Cancer-Specific T Cell Exhaustion in the Tcl1 Mouse Model for Chronic Lymphocytic Leukemia" International Journal of Molecular Sciences 22, no. 13: 6648. https://doi.org/10.3390/ijms22136648
APA StyleParigger, T., Gassner, F. J., Scherhäufl, C., Bakar, A. A., Höpner, J. P., Hödlmoser, A., Steiner, M., Catakovic, K., Geisberger, R., Greil, R., & Zaborsky, N. (2021). Evidence for Non-Cancer-Specific T Cell Exhaustion in the Tcl1 Mouse Model for Chronic Lymphocytic Leukemia. International Journal of Molecular Sciences, 22(13), 6648. https://doi.org/10.3390/ijms22136648