
In Vitro Inhibition of Renal OCT2 and MATE1 Secretion by Antiemetic Drugs


Abstract
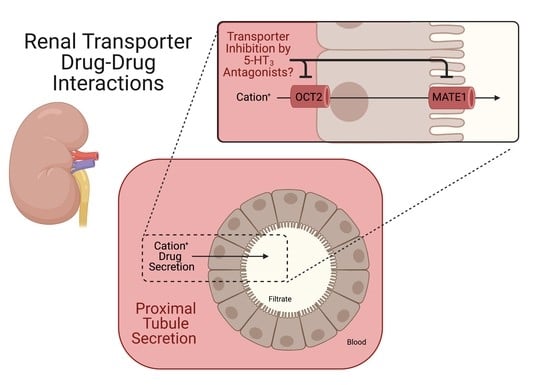
1. Introduction
2. Results
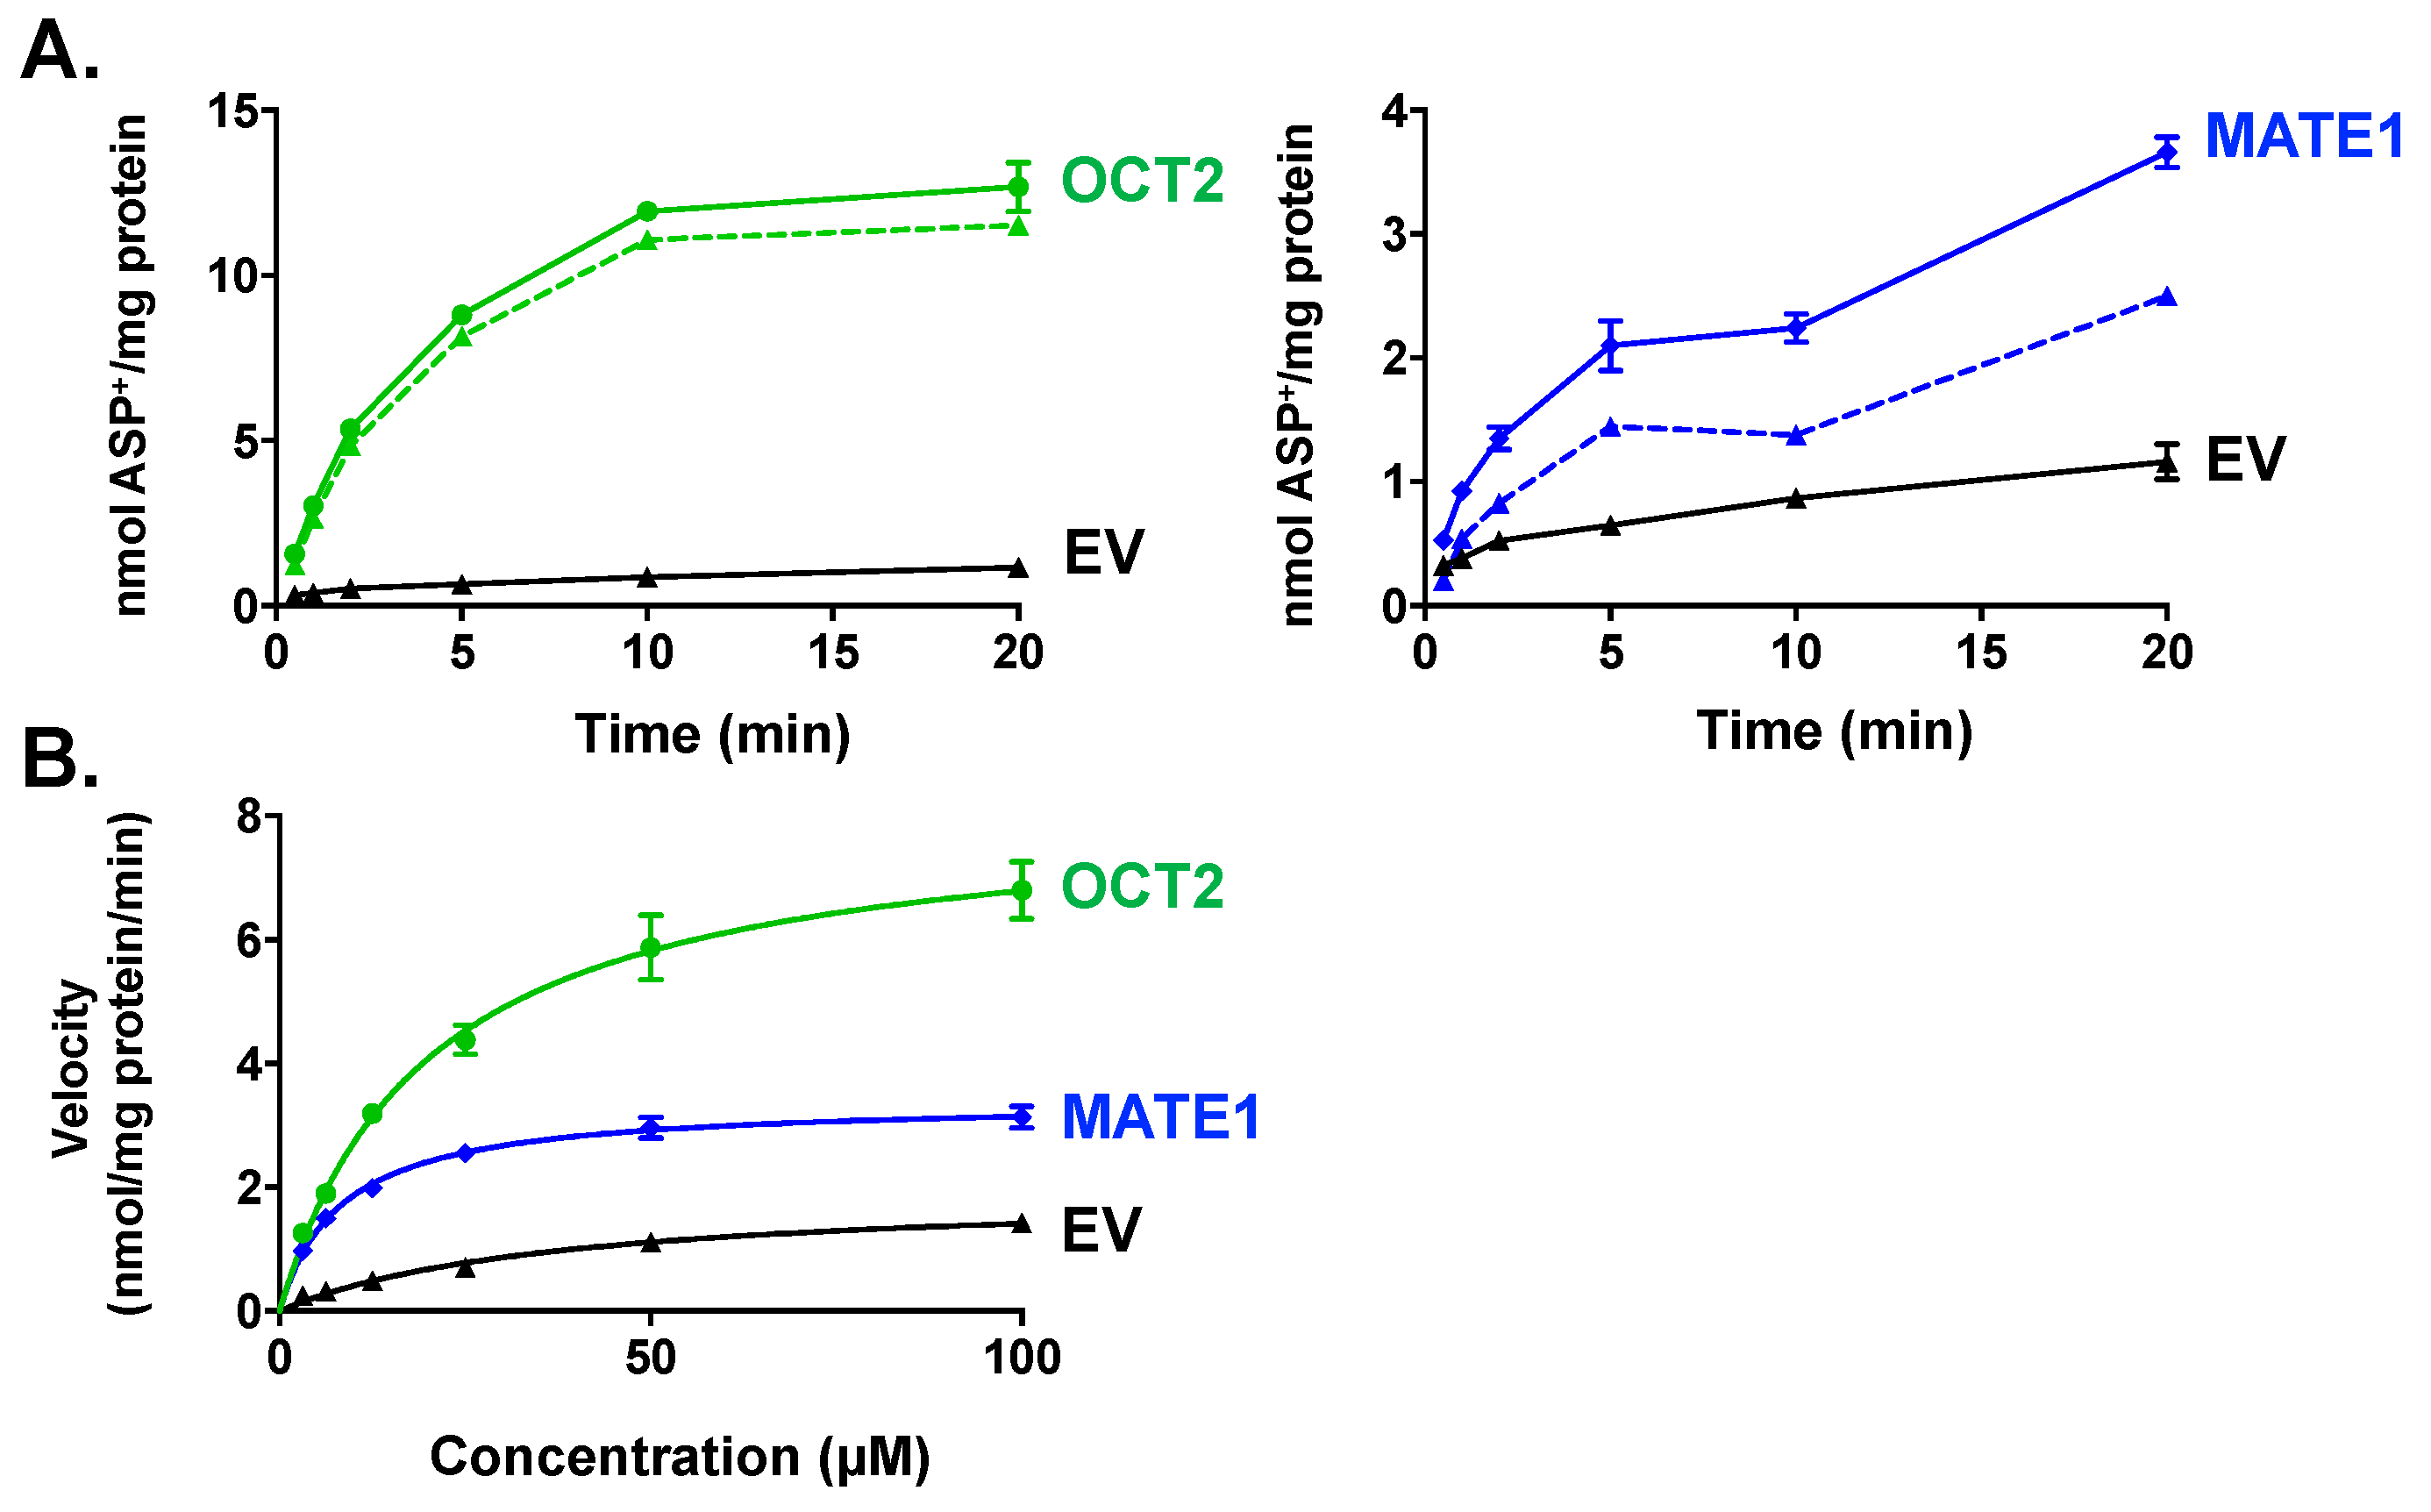
2.1. Characterization of ASP+ as a Fluorescent Substrate in HEK293 Cells Overexpressing OCT2 and MATE1
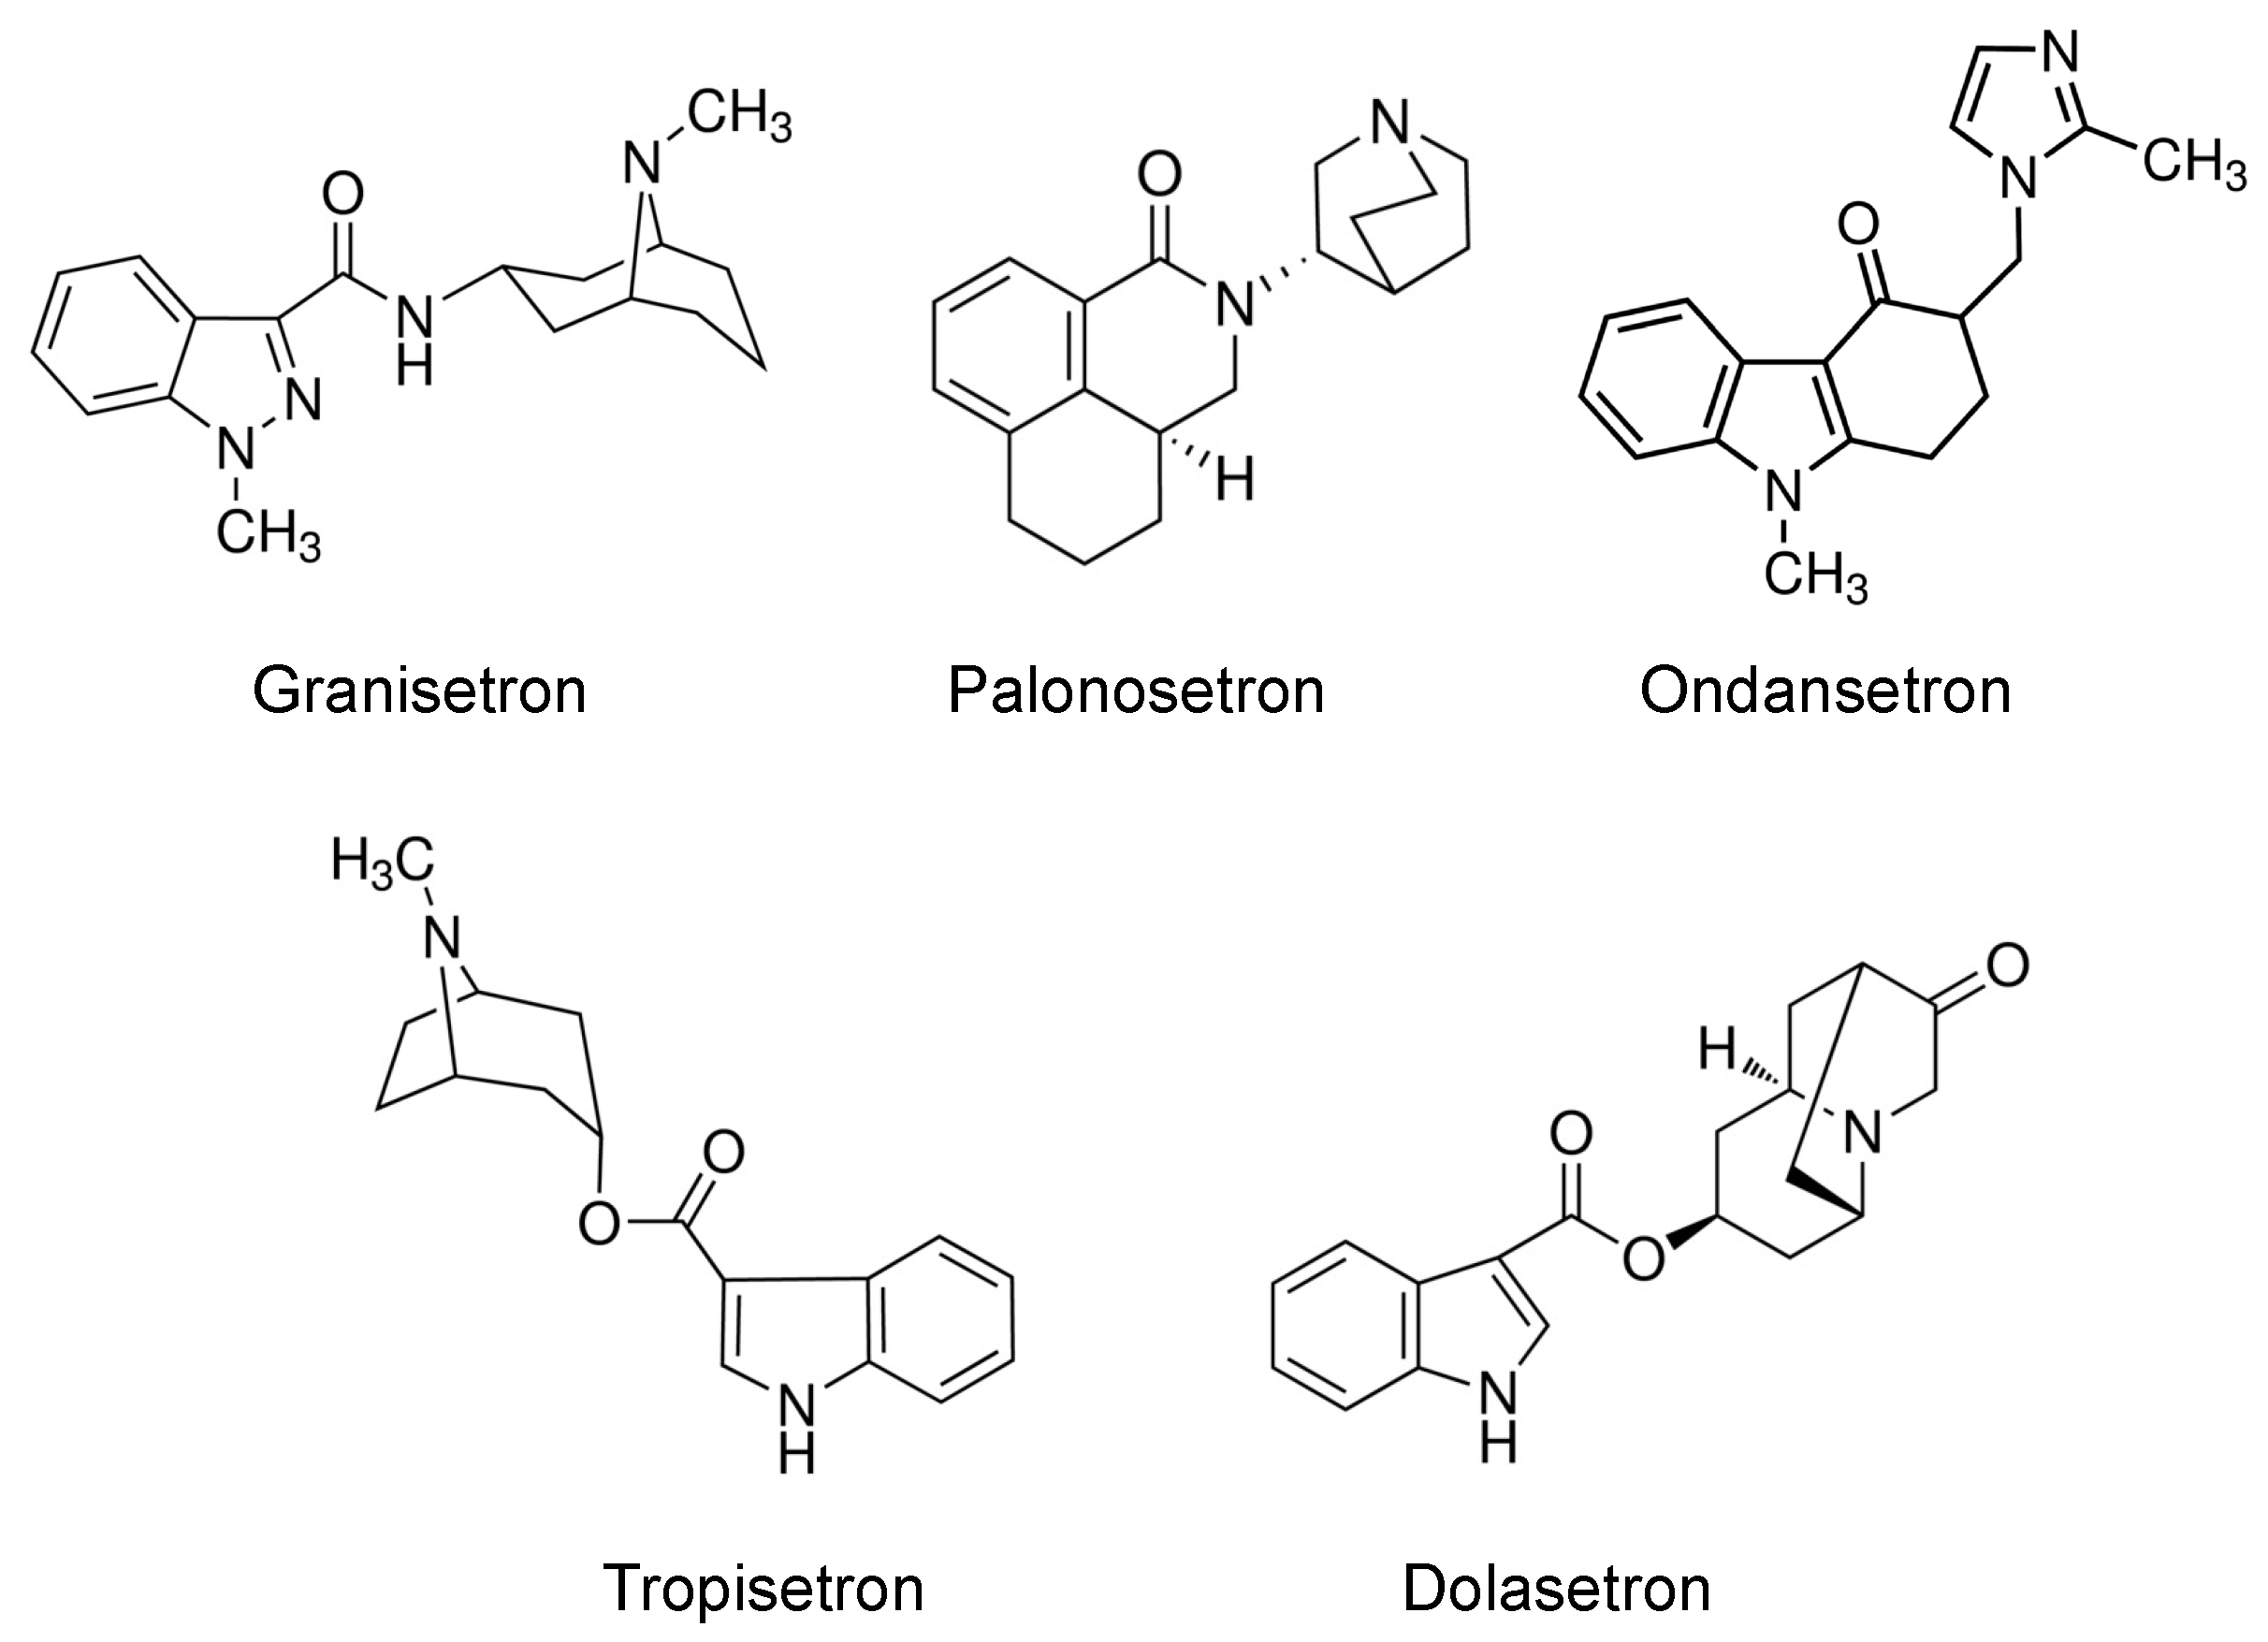
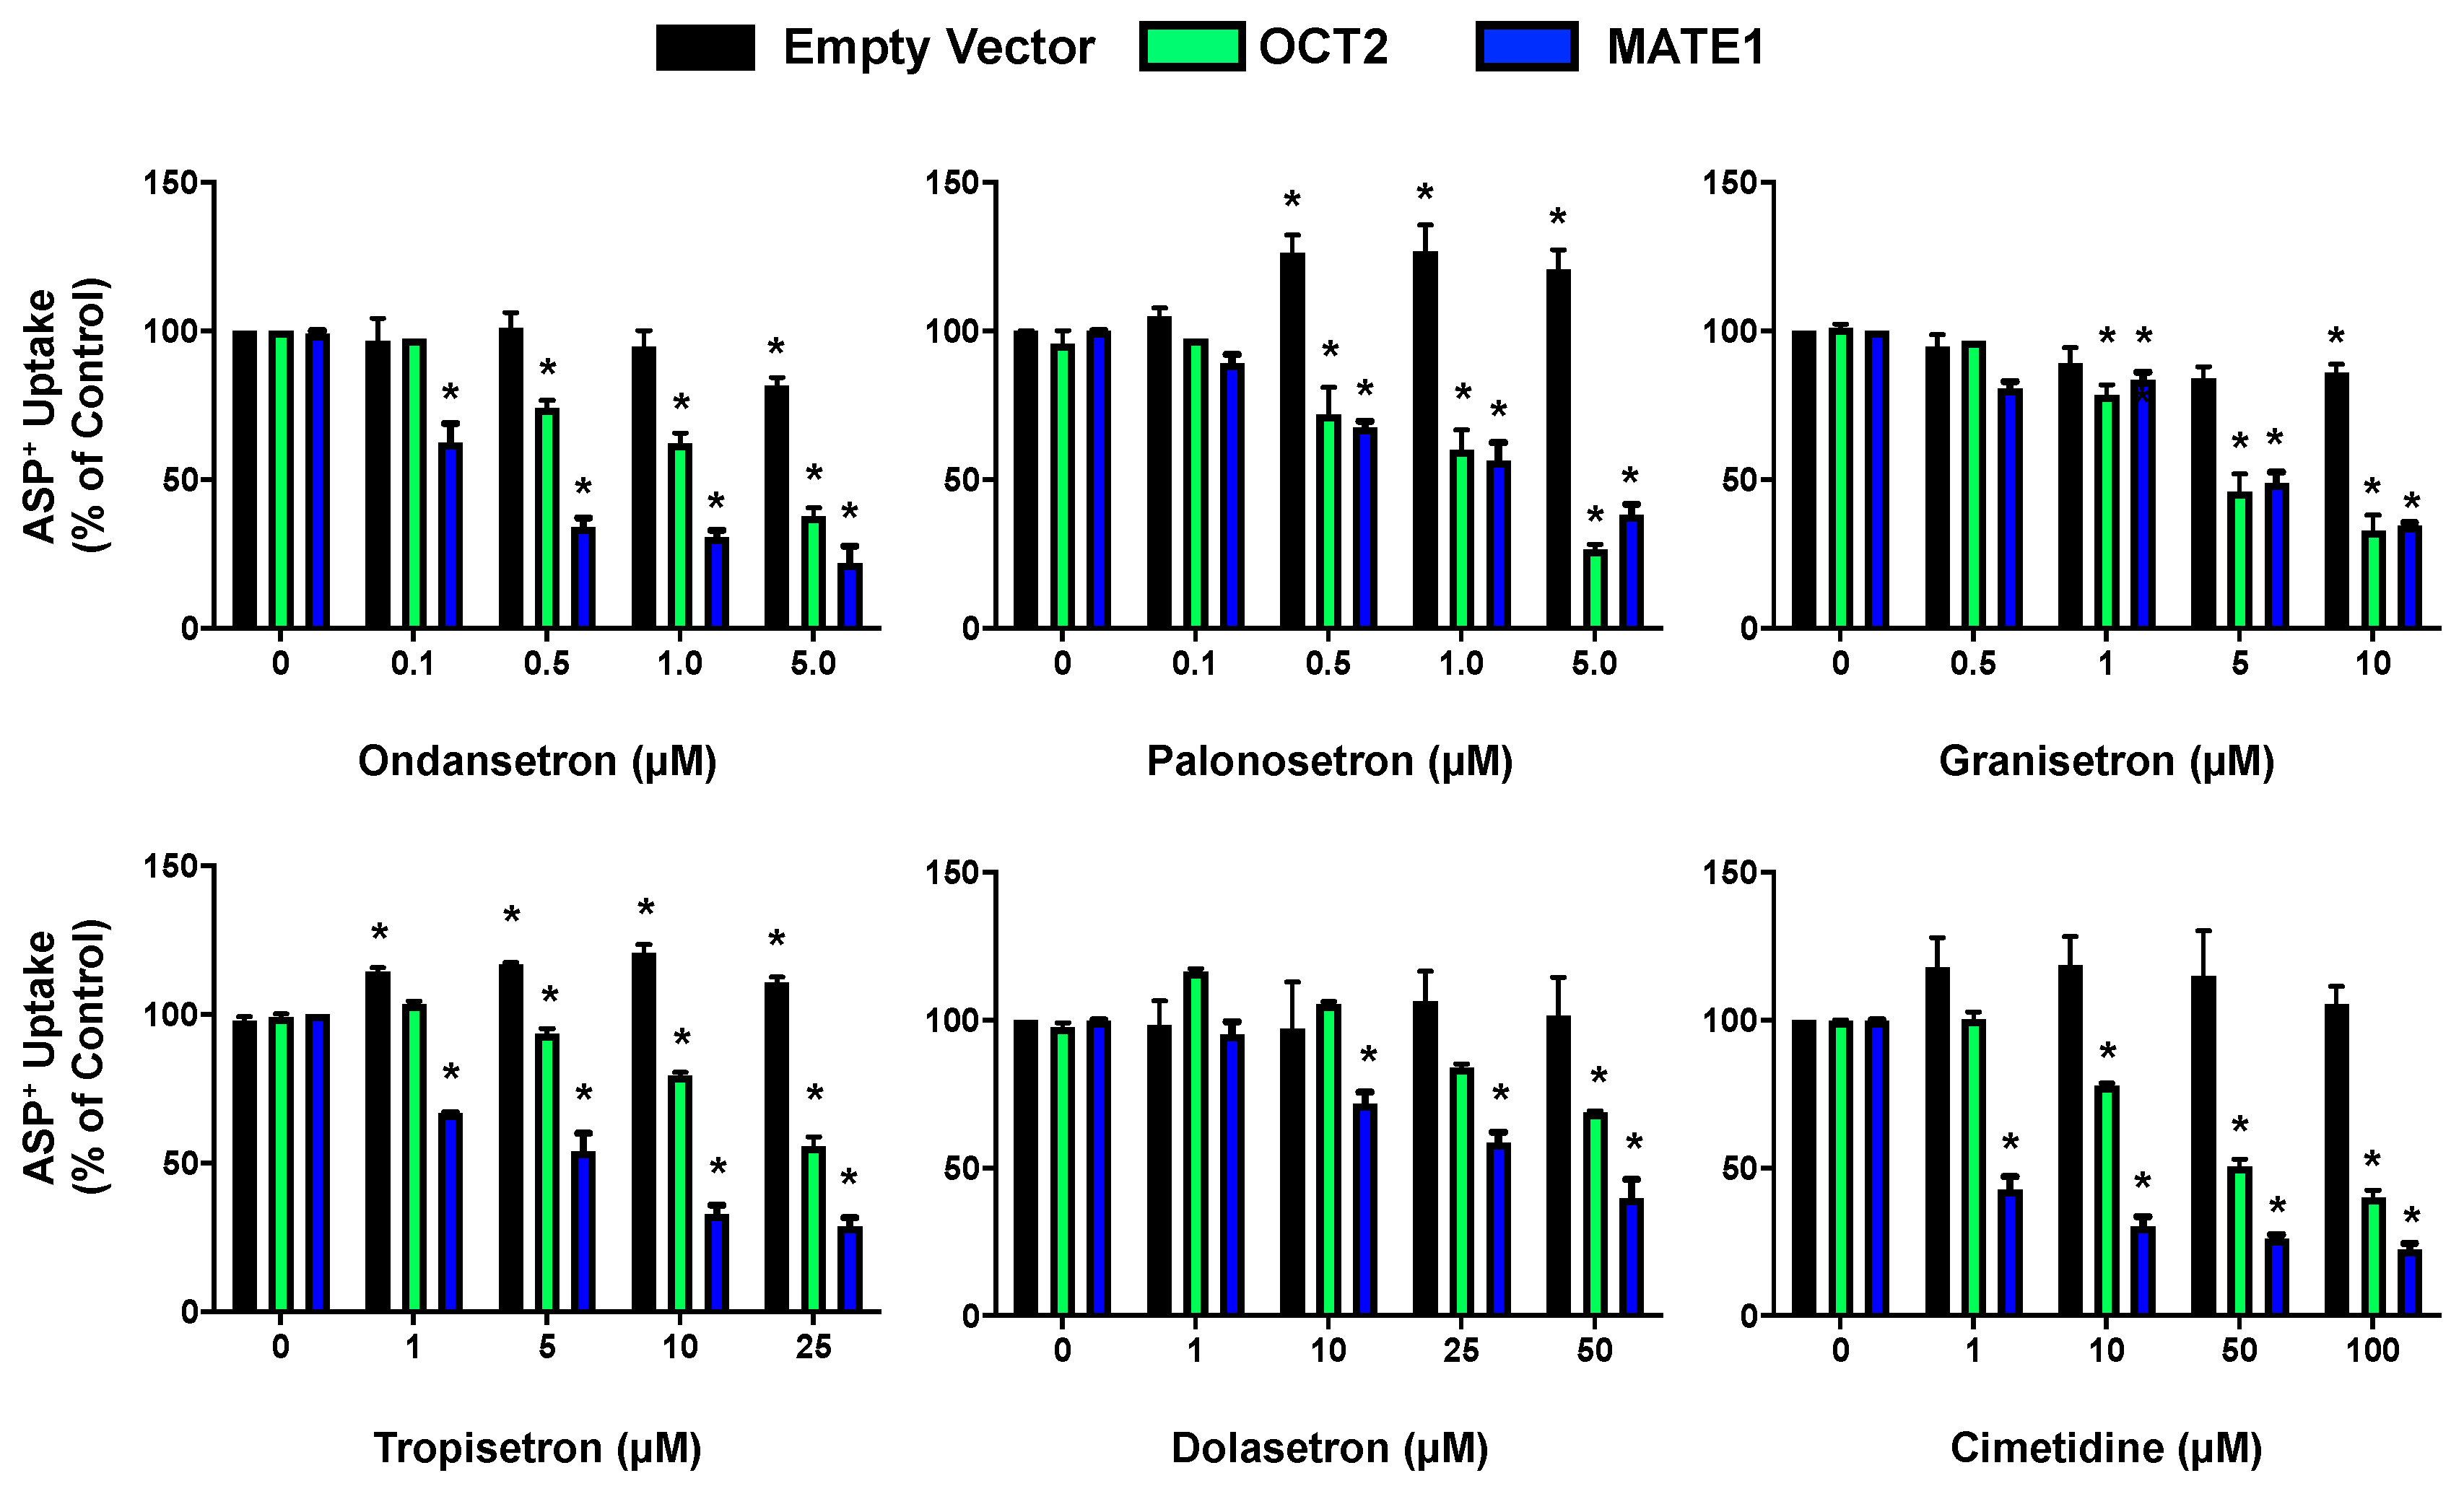
2.2. Inhibition of OCT2- and MATE1-Mediated Transport by Antiemetic Drug in HEK293 Cells
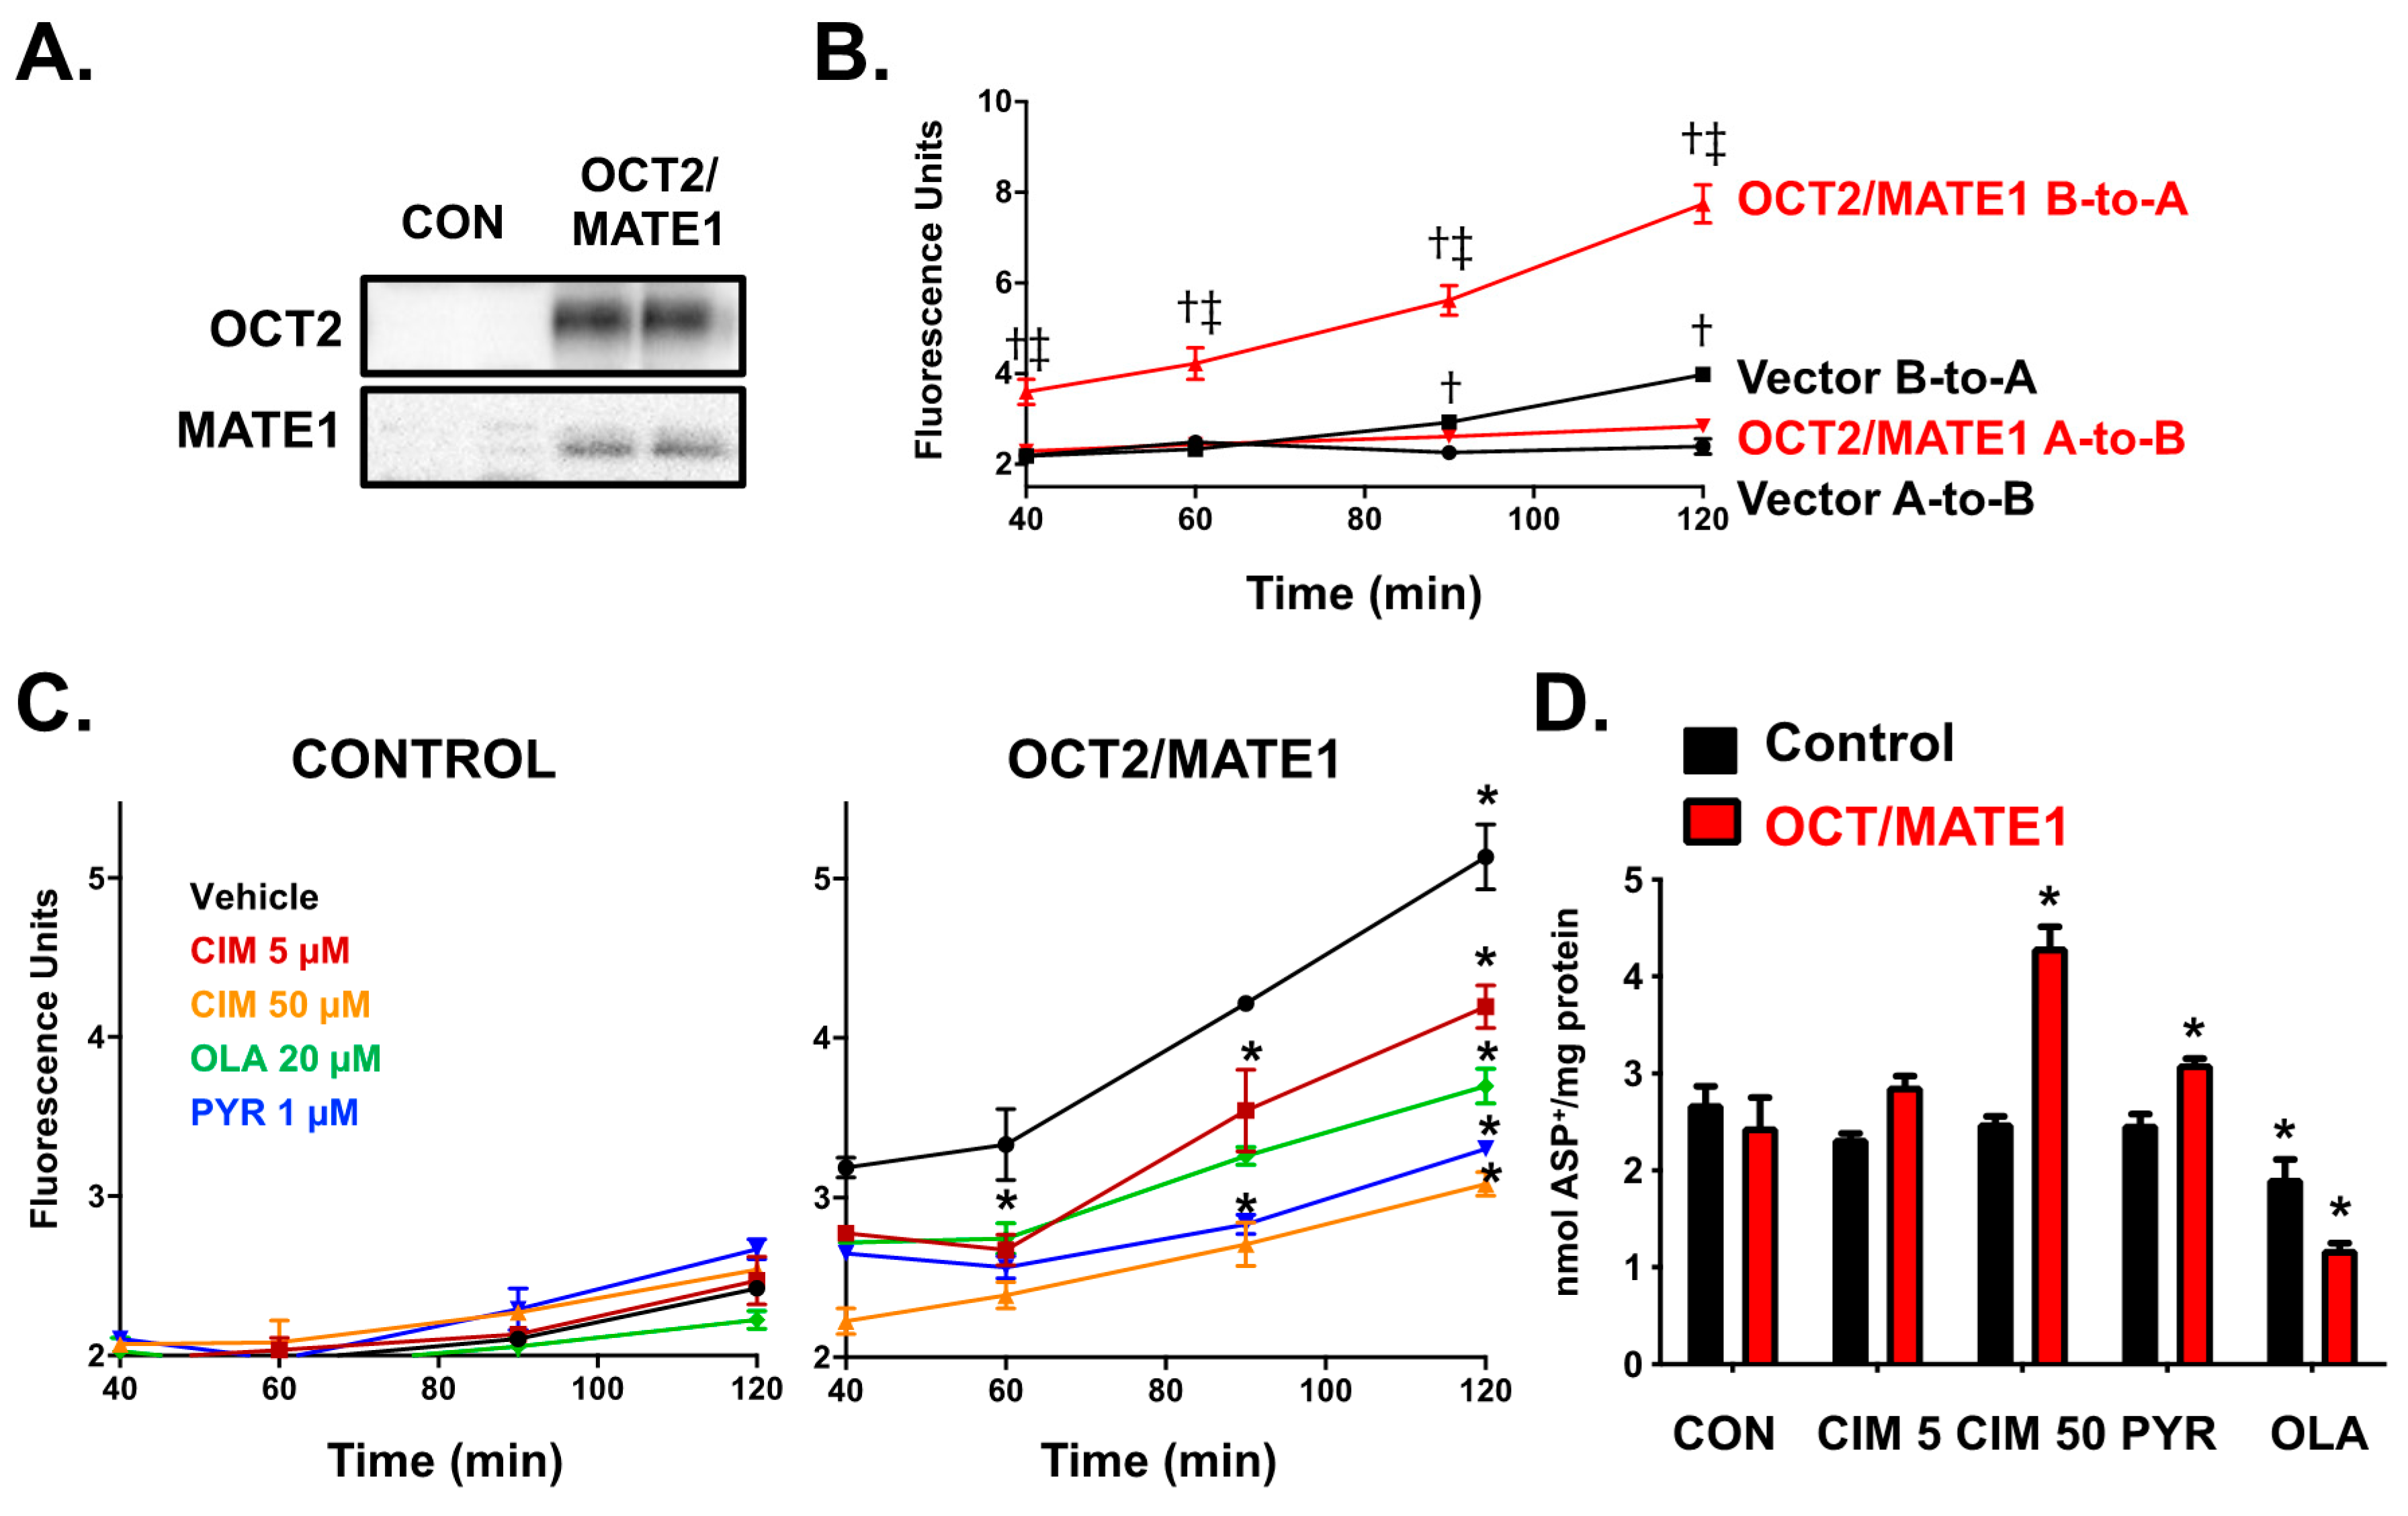
2.3. Characterization of the Transcellular Transport and Intracellular Accumulation of ASP+ in OCT2/MATE1-Expressing MDCK Cells
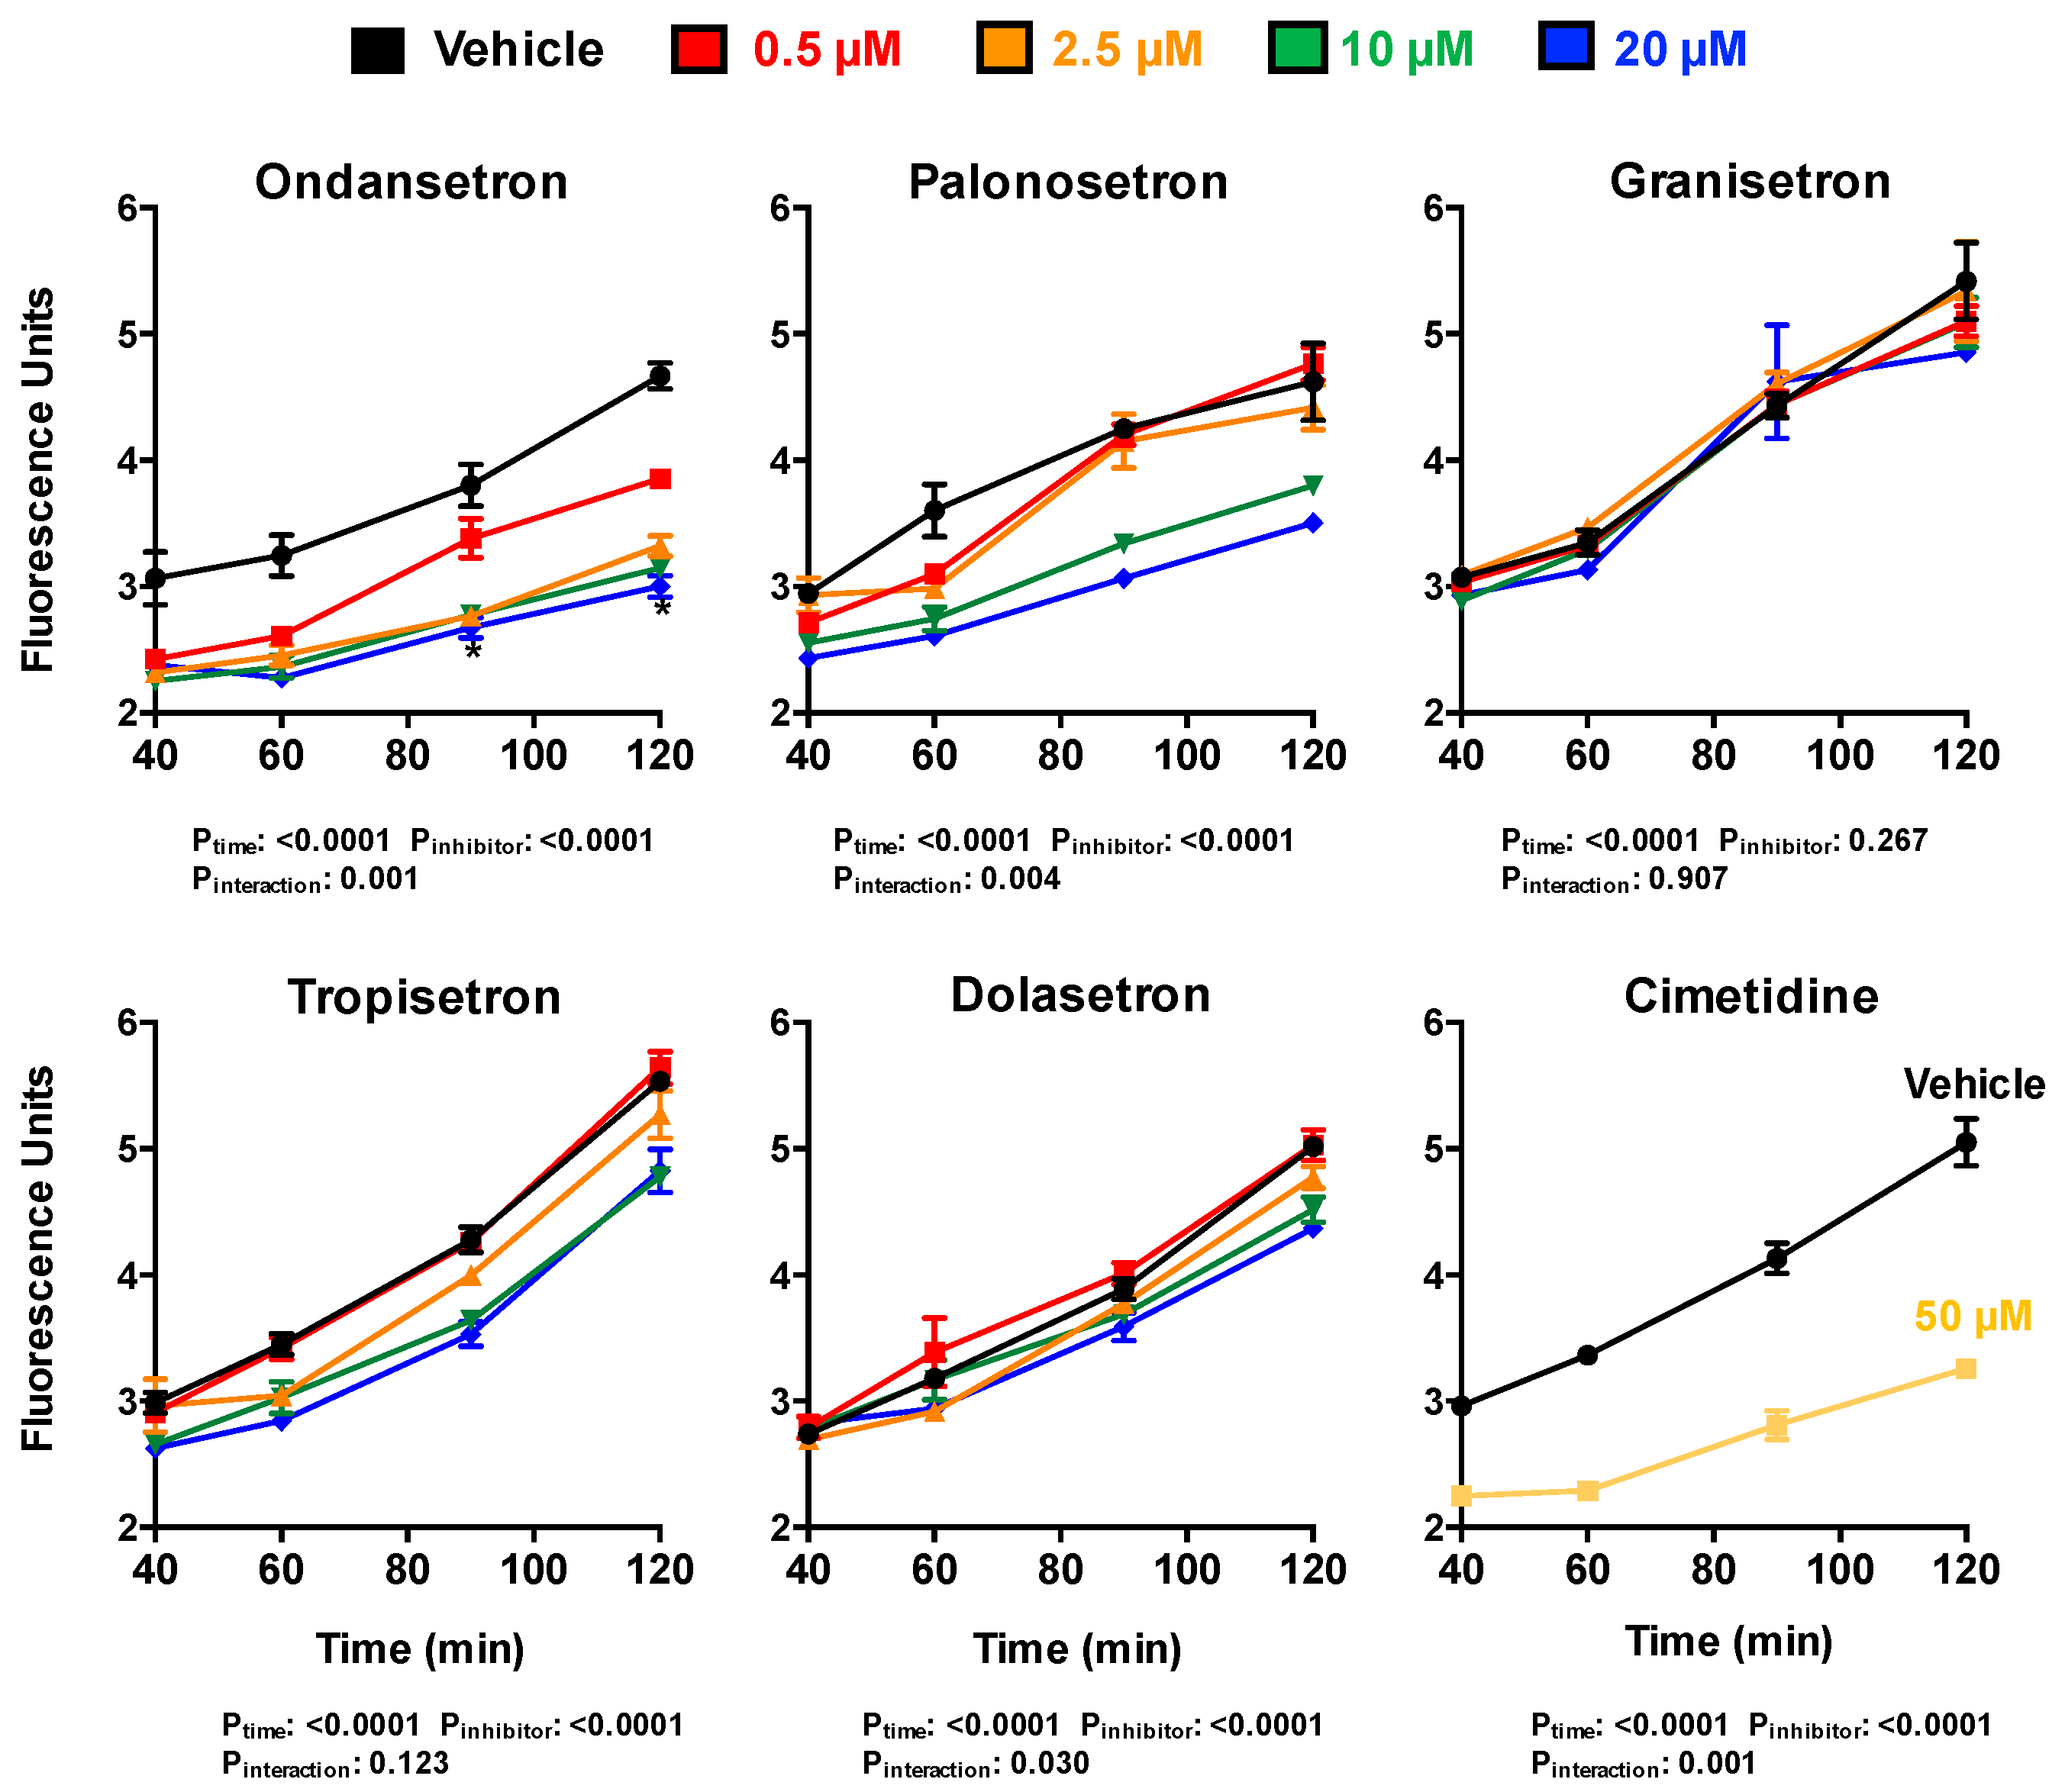
2.4. Inhibition of the Transcellular Transport of ASP+ by 5-HT3 Antagonists in OCT2/MATE1-Expressing MDCK Cells
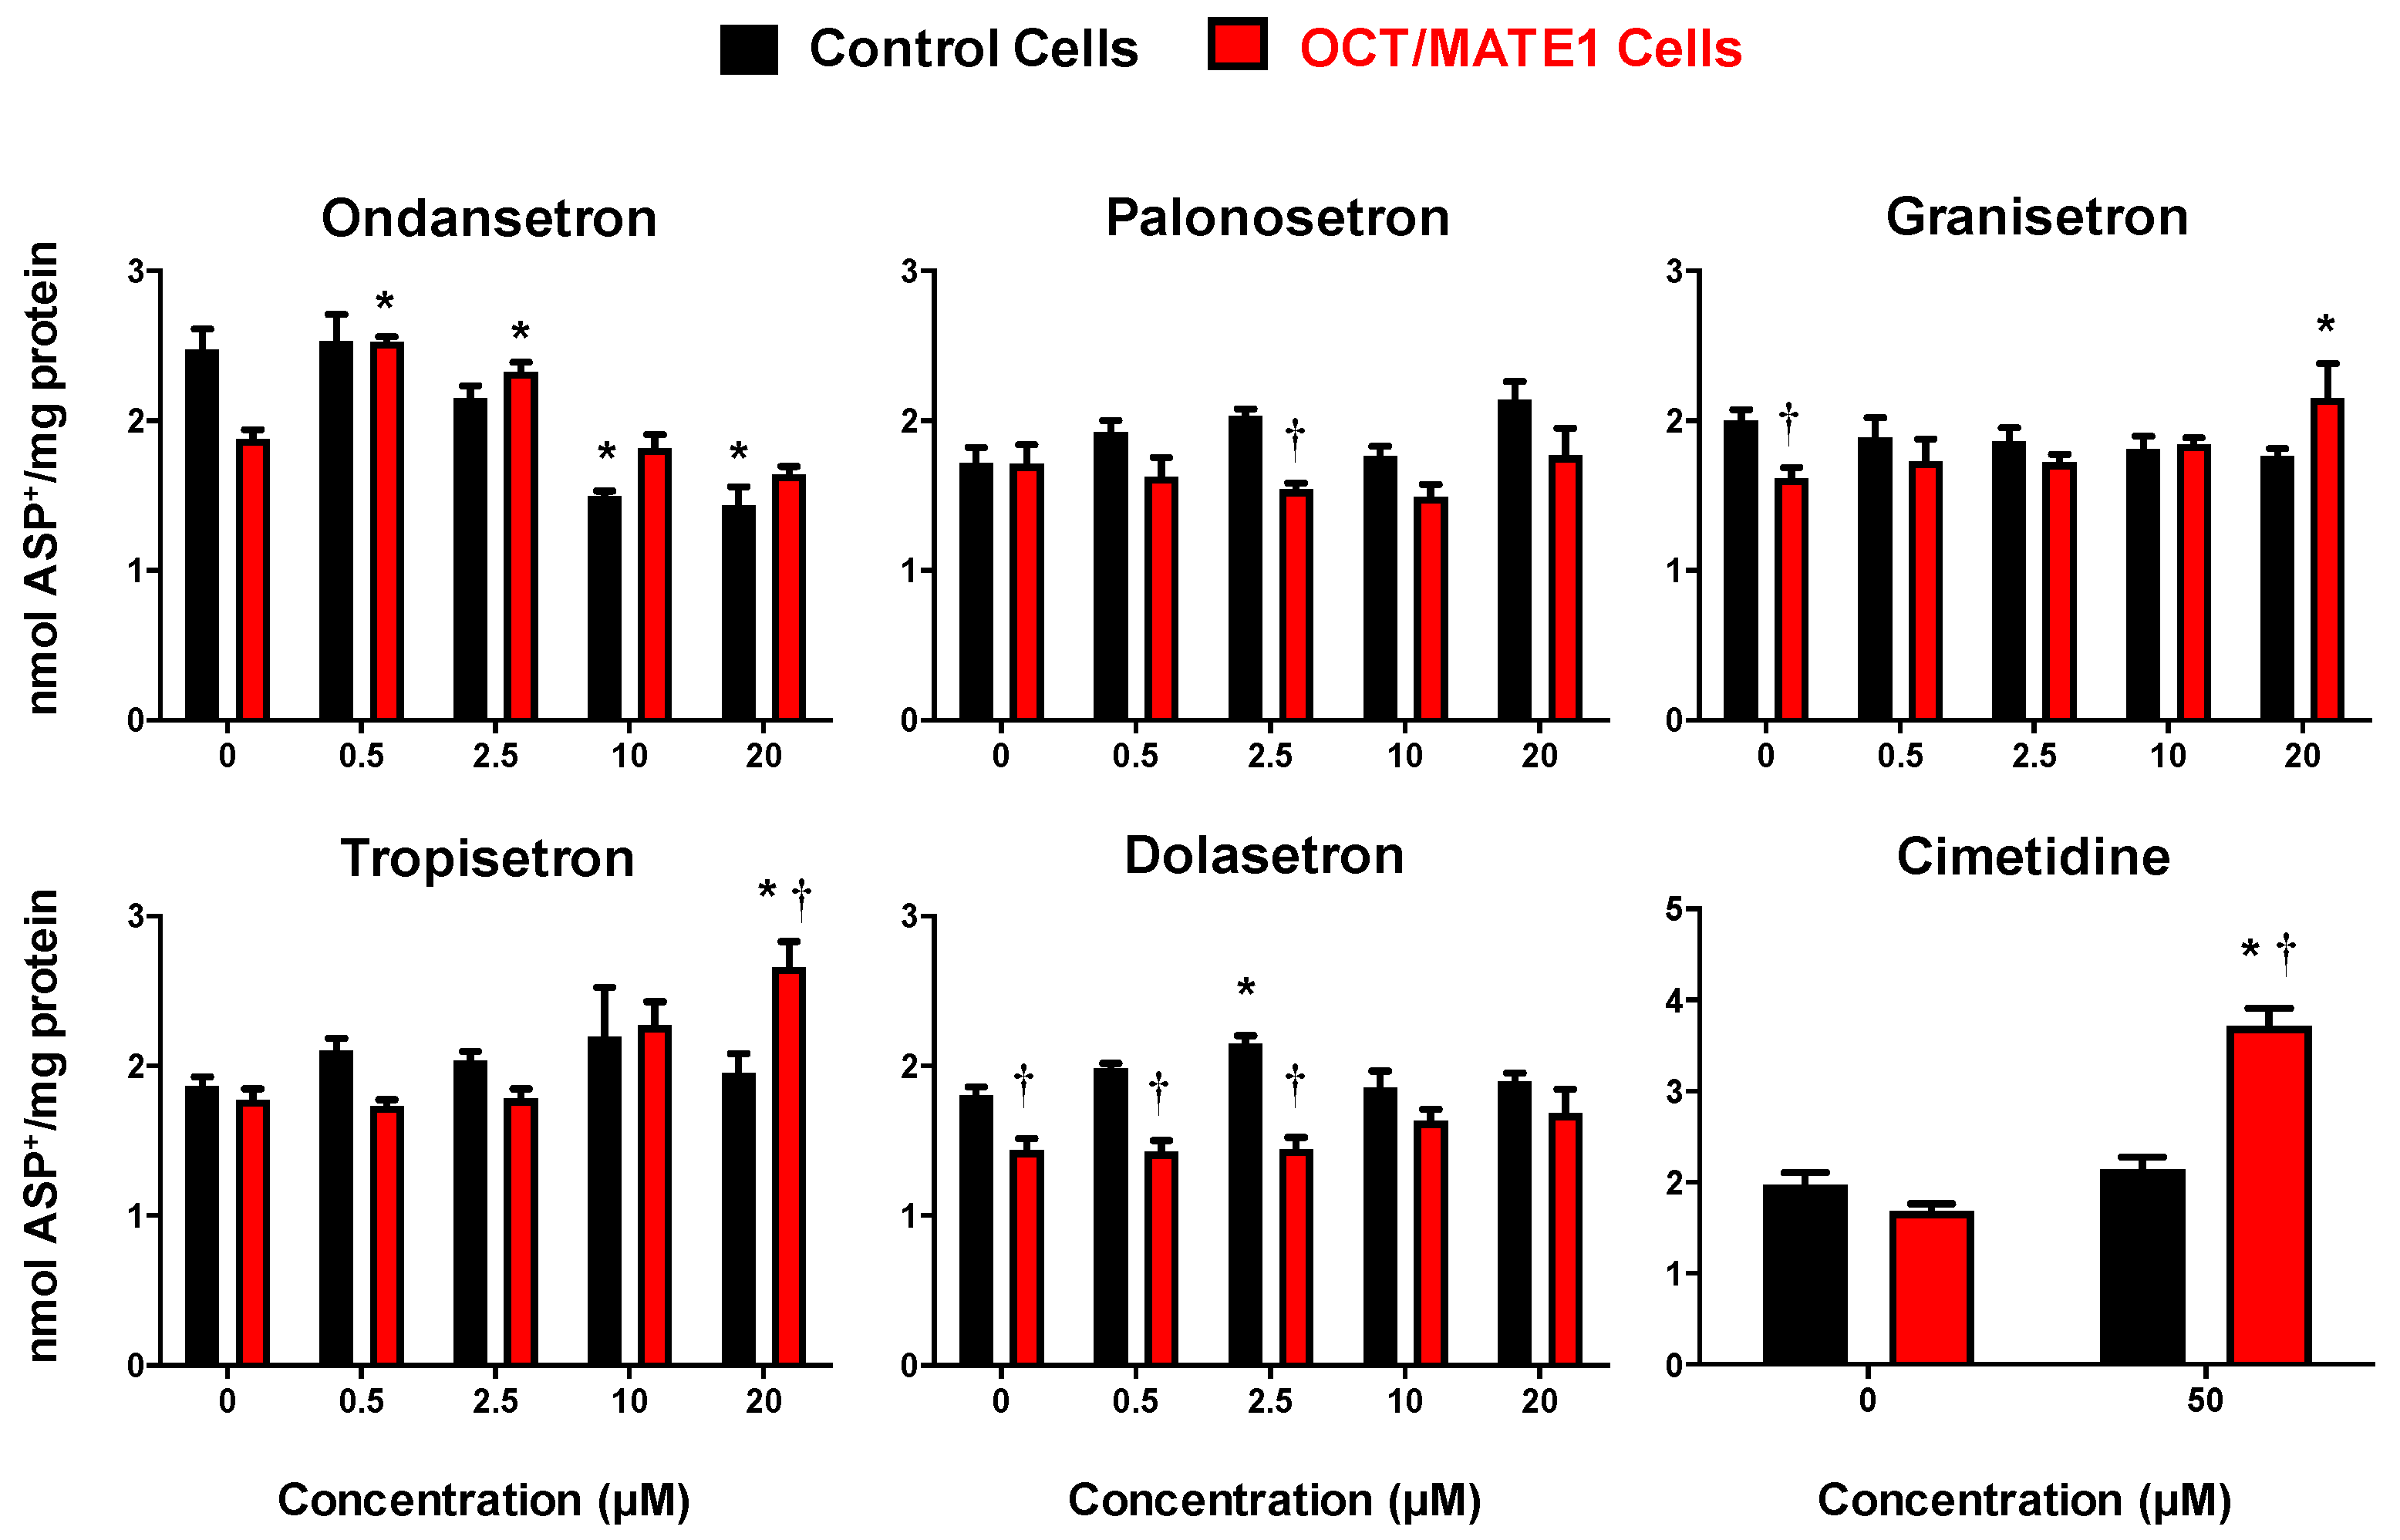
2.5. ASP+ Intracellular Accumulation in OCT2/MATE1-Expressing MDCK Cells Following Treatment with 5-HT3 Antagonists
3. Discussion
4. Materials and Methods
4.1. Chemicals
4.2. Cell Lines and Cell Culture
4.3. Uptake and Efflux Inhibition Assays in HEK293 Cells
4.4. Transwell Studies in MDCK-OCT2/MATE1 Cells
4.5. Statistical Analysis
Supplementary Materials
Author Contributions
Funding
Institutional Review Board Statement
Informed Consent Statement
Data Availability Statement
Acknowledgments
Conflicts of Interest
References
- Acara, M.; Rennick, B. The biphasic effect of organic cations on the excretion of other organic cations. J. Pharmacol. Exp. Ther. 1976, 199, 32–40. [Google Scholar] [PubMed]
- Holohan, P.D.; Ross, C.R. Mechanisms of organic cation transport in kidney plasma membrane vesicles: 1. Countertransport studies. J. Pharmacol. Exp. Ther. 1980, 215, 191–197. [Google Scholar]
- Kinsella, J.L.; Holohan, P.D.; Pessah, N.I.; Ross, C.R. Transport of organic ions in renal cortical luminal and antiluminal membrane vesicles. J. Pharmacol. Exp. Ther. 1979, 209, 443–450. [Google Scholar]
- Wold, J.S.; Miller, B.L. Inhibition of the efflux of organic ions from renal cortical slices. Experientia 1978, 34, 630–631. [Google Scholar] [CrossRef] [PubMed]
- Gessner, A.; König, J.; Fromm, M.F. Clinical Aspects of Transporter-Mediated Drug-Drug Interactions. Clin. Pharmacol. Ther. 2019, 105, 1386–1394. [Google Scholar] [CrossRef]
- Smith, H.S.; Cox, L.R.; Smith, E.J. 5-HT3 receptor antagonists for the treatment of nausea/vomiting. Ann. Palliat. Med. 2012, 1, 115–120. [Google Scholar] [CrossRef] [PubMed]
- Costall, B.; Gunning, S.J.; Naylor, R.J.; Tyers, M.B. The effect of GR38032F, novel 5-HT3-receptor antagonist on gastric emptying in the guinea-pig. Br. J. Pharmacol. 1987, 91, 263–264. [Google Scholar] [CrossRef]
- Kris, M.G.; Gralla, R.J.; Clark, R.A.; Tyson, L.B. Dose-ranging evaluation of the serotonin antagonist GR-C507/75 (GR38032F) when used as an antiemetic in patients receiving anticancer chemotherapy. J. Clin. Oncol. 1988, 6, 659–662. [Google Scholar] [CrossRef]
- Tricco, A.C.; Blondal, E.; Veroniki, A.A.; Soobiah, C.; Vafaei, A.; Ivory, J.; Strifler, L.; Cardoso, R.; Reynen, E.; Nincic, V.; et al. Comparative safety and effectiveness of serotonin receptor antagonists in patients undergoing chemotherapy: A systematic review and network meta-analysis. BMC Med. 2016, 14, 216. [Google Scholar] [CrossRef]
- Boelig, R.C.; Barton, S.J.; Saccone, G.; Kelly, A.J.; Edwards, S.J.; Berghella, V. Interventions for treating hyperemesis gravidarum: A Cochrane systematic review and meta-analysis. J. Matern. Fetal Neonatal Med. 2018, 31, 2492–2505. [Google Scholar] [CrossRef]
- Haque, N.; Naqvi, R.M.; Dasgupta, M. Efficacy of Ondansetron in the Prevention or Treatment of Post-operative Delirium-a Systematic Review. Can. Geriatr. J. 2019, 22, 1–6. [Google Scholar] [CrossRef] [PubMed]
- McParlin, C.; O’Donnell, A.; Robson, S.C.; Beyer, F.; Moloney, E.; Bryant, A.; Bradley, J.; Muirhead, C.R.; Nelson-Piercy, C.; Newbury-Birch, D.; et al. Treatments for Hyperemesis Gravidarum and Nausea and Vomiting in Pregnancy: A Systematic Review. JAMA 2016, 316, 1392–1401. [Google Scholar] [CrossRef] [PubMed]
- Wang, W.; Zhou, L.; Sun, L. Ondansetron for neuraxial morphine-induced pruritus: A meta-analysis of randomized controlled trials. J. Clin. Pharm. Ther. 2017, 42, 383–393. [Google Scholar] [CrossRef]
- Yokoi, A.; Mihara, T.; Ka, K.; Goto, T. Comparative efficacy of ramosetron and ondansetron in preventing postoperative nausea and vomiting: An updated systematic review and meta-analysis with trial sequential analysis. PLoS ONE 2017, 12, e0186006. [Google Scholar] [CrossRef]
- Morse, B.L.; Kolur, A.; Hudson, L.R.; Hogan, A.T.; Chen, L.H.; Brackman, R.M.; Sawada, G.A.; Fallon, J.K.; Smith, P.C.; Hillgren, K.M. Pharmacokinetics of Organic Cation Transporter 1 (OCT1) Substrates in Oct1/2 Knockout Mice and Species Difference in Hepatic OCT1-Mediated Uptake. Drug Metab. Dispos. 2020, 48, 93–105. [Google Scholar] [CrossRef] [PubMed]
- Tzvetkov, M.V.; Saadatmand, A.R.; Bokelmann, K.; Meineke, I.; Kaiser, R.; Brockmoller, J. Effects of OCT1 polymorphisms on the cellular uptake, plasma concentrations and efficacy of the 5-HT(3) antagonists tropisetron and ondansetron. Pharmacogenom. J. 2012, 12, 22–29. [Google Scholar] [CrossRef] [PubMed]
- Zhu, P.; Ye, Z.; Guo, D.; Xiong, Z.; Huang, S.; Guo, J.; Zhang, W.; Polli, J.E.; Zhou, H.; Li, Q.; et al. Irinotecan Alters the Disposition of Morphine Via Inhibition of Organic Cation Transporter 1 (OCT1) and 2 (OCT2). Pharm. Res. 2018, 35, 243. [Google Scholar] [CrossRef]
- Kido, Y.; Matsson, P.; Giacomini, K.M. Profiling of a prescription drug library for potential renal drug-drug interactions mediated by the organic cation transporter 2. J. Med. Chem. 2011, 54, 4548–4558. [Google Scholar] [CrossRef] [PubMed]
- Li, Q.; Guo, D.; Dong, Z.; Zhang, W.; Zhang, L.; Huang, S.M.; Polli, J.E.; Shu, Y. Ondansetron can enhance cisplatin-induced nephrotoxicity via inhibition of multiple toxin and extrusion proteins (MATEs). Toxicol. Appl. Pharmacol. 2013, 273, 100–109. [Google Scholar] [CrossRef]
- Wittwer, M.B.; Zur, A.A.; Khuri, N.; Kido, Y.; Kosaka, A.; Zhang, X.; Morrissey, K.M.; Sali, A.; Huang, Y.; Giacomini, K.M. Discovery of potent, selective multidrug and toxin extrusion transporter 1 (MATE1, SLC47A1) inhibitors through prescription drug profiling and computational modeling. J. Med. Chem. 2013, 56, 781–795. [Google Scholar] [CrossRef] [PubMed]
- Li, Q.; Yang, H.; Guo, D.; Zhang, T.; Polli, J.E.; Zhou, H.; Shu, Y. Effect of Ondansetron on Metformin Pharmacokinetics and Response in Healthy Subjects. Drug Metab. Dispos. 2016, 44, 489–494. [Google Scholar] [CrossRef]
- Prasad, B.; Johnson, K.; Billington, S.; Lee, C.; Chung, G.W.; Brown, C.D.; Kelly, E.J.; Himmelfarb, J.; Unadkat, J.D. Abundance of Drug Transporters in the Human Kidney Cortex as Quantified by Quantitative Targeted Proteomics. Drug Metab. Dispos. 2016, 44, 1920–1924. [Google Scholar] [CrossRef]
- Ito, S.; Kusuhara, H.; Kuroiwa, Y.; Wu, C.; Moriyama, Y.; Inoue, K.; Kondo, T.; Yuasa, H.; Nakayama, H.; Horita, S.; et al. Potent and specific inhibition of mMate1-mediated efflux of type I organic cations in the liver and kidney by pyrimethamine. J. Pharmacol. Exp. Ther. 2010, 333, 341–350. [Google Scholar] [CrossRef] [PubMed]
- Koepsell, H. Organic Cation Transporters in Health and Disease. Pharmacol. Rev. 2020, 72, 253–319. [Google Scholar] [CrossRef] [PubMed]
- Goh, L.B.; Spears, K.J.; Yao, D.; Ayrton, A.; Morgan, P.; Roland Wolf, C.; Friedberg, T. Endogenous drug transporters in in vitro and in vivo models for the prediction of drug disposition in man. Biochem. Pharmacol. 2002, 64, 1569–1578. [Google Scholar] [CrossRef]
- Babaoglu, M.O.; Bayar, B.; Aynacioglu, A.S.; Kerb, R.; Abali, H.; Celik, I.; Bozkurt, A. Association of the ABCB1 3435C>T polymorphism with antiemetic efficacy of 5-hydroxytryptamine type 3 antagonists. Clin. Pharmacol. Ther. 2005, 78, 619–626. [Google Scholar] [CrossRef]
- Belzer, M.; Morales, M.; Jagadish, B.; Mash, E.A.; Wright, S.H. Substrate-dependent ligand inhibition of the human organic cation transporter OCT2. J. Pharmacol. Exp. Ther. 2013, 346, 300–310. [Google Scholar] [CrossRef]
- Hacker, K.; Maas, R.; Kornhuber, J.; Fromm, M.F.; Zolk, O. Substrate-Dependent Inhibition of the Human Organic Cation Transporter OCT2: A Comparison of Metformin with Experimental Substrates. PLoS ONE 2015, 10, e0136451. [Google Scholar] [CrossRef]
- Sandoval, P.J.; Zorn, K.M.; Clark, A.M.; Ekins, S.; Wright, S.H. Assessment of Substrate-Dependent Ligand Interactions at the Organic Cation Transporter OCT2 Using Six Model Substrates. Mol. Pharmacol. 2018, 94, 1057–1068. [Google Scholar] [CrossRef]
- Martínez-Guerrero, L.J.; Morales, M.; Ekins, S.; Wright, S.H. Lack of Influence of Substrate on Ligand Interaction with the Human Multidrug and Toxin Extruder, MATE1. Mol. Pharmacol. 2016, 90, 254–264. [Google Scholar] [CrossRef] [PubMed]
- Yin, J.; Duan, H.; Shirasaka, Y.; Prasad, B.; Wang, J. Atenolol Renal Secretion Is Mediated by Human Organic Cation Transporter 2 and Multidrug and Toxin Extrusion Proteins. Drug Metab. Dispos. 2015, 43, 1872–1881. [Google Scholar] [CrossRef] [PubMed]
- Nakamura, K.; Hirayama-Kurogi, M.; Ito, S.; Kuno, T.; Yoneyama, T.; Obuchi, W.; Terasaki, T.; Ohtsuki, S. Large-scale multiplex absolute protein quantification of drug-metabolizing enzymes and transporters in human intestine, liver, and kidney microsomes by SWATH-MS: Comparison with MRM/SRM and HR-MRM/PRM. Proteomics 2016, 16, 2106–2117. [Google Scholar] [CrossRef]
- Thompson, A.J.; Lummis, S.C. 5-HT3 receptors. Curr. Pharm. Des. 2006, 12, 3615–3630. [Google Scholar] [CrossRef]
- Isoherranen, N.; Hachad, H.; Yeung, C.K.; Levy, R.H. Qualitative analysis of the role of metabolites in inhibitory drug-drug interactions: Literature evaluation based on the metabolism and transport drug interaction database. Chem. Res. Toxicol. 2009, 22, 294–298. [Google Scholar] [CrossRef]
- U.S. Food and Drug Administration. In Vitro Drug Interaction Studies—Cytochrome P450 Enzyme- and Transporter-Mediated Drug Interactions Guidance for Industry; U.S. Food and Drug Administration: Silver Springs, FL, USA, 2020; pp. 1–43. [Google Scholar]
- Nakada, T.; Kudo, T.; Kume, T.; Kusuhara, H.; Ito, K. Estimation of changes in serum creatinine and creatinine clearance caused by renal transporter inhibition in healthy subjects. Drug Metab. Pharmacokinet. 2019, 34, 233–238. [Google Scholar] [CrossRef] [PubMed]
- Aamdal, S. Can ondansetron hydrochloride (Zofran) enhance the nephrotoxic potential of other drugs? Ann. Oncol. 1992, 3, 774. [Google Scholar] [CrossRef]
- Coates, A.S.; Childs, A.; Cox, K.; Forsyth, C.; Joshua, D.E.; McNeil, E.; Grygiel, J.J. Severe vascular adverse effects with thrombocytopenia and renal failure following emetogenic chemotherapy and ondansetron. Ann. Oncol. 1992, 3, 719–722. [Google Scholar] [CrossRef]
- Kou, W.; Qin, H.; Hanif, S.; Wu, X. Nephrotoxicity Evaluation on Cisplatin Combined with 5-HT3 Receptor Antagonists: A Retrospective Study. Biomed. Res. Int. 2018, 2018, 1024324. [Google Scholar] [CrossRef] [PubMed]
- Avdeef, A. Leakiness and size exclusion of paracellular channels in cultured epithelial cell monolayers-interlaboratory comparison. Pharm. Res. 2010, 27, 480–489. [Google Scholar] [CrossRef]


| 5-HT3 Antagonist | OCT2 IC50 (µM) | MATE1 IC50 (µM) |
|---|---|---|
| Ondansetron | 2.6 ± 0.9 | 0.1 ± 0.1 |
| Palonosetron | 2.2 ± 0.3 | 1.6 ± 0.6 |
| Granisetron | 3.8 ± 1.6 | 5.0 ± 1.1 |
| Tropisetron | 31.3 ± 6.6 | 1.6 ± 0.9 |
| Dolasetron | 85.4 ± 3.4 | 27.4 ± 2.8 |
| Cimetidine | 24.5 ± 4.0 | 0.23 ± 0.2 |
Publisher’s Note: MDPI stays neutral with regard to jurisdictional claims in published maps and institutional affiliations. |
© 2021 by the authors. Licensee MDPI, Basel, Switzerland. This article is an open access article distributed under the terms and conditions of the Creative Commons Attribution (CC BY) license (https://creativecommons.org/licenses/by/4.0/).
Share and Cite
George, B.; Wen, X.; Jaimes, E.A.; Joy, M.S.; Aleksunes, L.M. In Vitro Inhibition of Renal OCT2 and MATE1 Secretion by Antiemetic Drugs. Int. J. Mol. Sci. 2021, 22, 6439. https://doi.org/10.3390/ijms22126439
George B, Wen X, Jaimes EA, Joy MS, Aleksunes LM. In Vitro Inhibition of Renal OCT2 and MATE1 Secretion by Antiemetic Drugs. International Journal of Molecular Sciences. 2021; 22(12):6439. https://doi.org/10.3390/ijms22126439
Chicago/Turabian StyleGeorge, Blessy, Xia Wen, Edgar A. Jaimes, Melanie S. Joy, and Lauren M. Aleksunes. 2021. "In Vitro Inhibition of Renal OCT2 and MATE1 Secretion by Antiemetic Drugs" International Journal of Molecular Sciences 22, no. 12: 6439. https://doi.org/10.3390/ijms22126439
APA StyleGeorge, B., Wen, X., Jaimes, E. A., Joy, M. S., & Aleksunes, L. M. (2021). In Vitro Inhibition of Renal OCT2 and MATE1 Secretion by Antiemetic Drugs. International Journal of Molecular Sciences, 22(12), 6439. https://doi.org/10.3390/ijms22126439