Article

The Effect of Chronic Mild Stress and Escitalopram on the Expression and Methylation Levels of Genes Involved in the Oxidative and Nitrosative Stresses as Well as Tryptophan Catabolites Pathway in the Blood and Brain Structures

1
Laboratory of Medical Genetics, Faculty of Biology and Environmental Protection, University of Lodz, 90-136 Lodz, Poland
2
Department of Cytobiochemistry, Faculty of Biology and Environmental Protection, University of Lodz, 90-136 Lodz, Poland
3
Department of Medical Biochemistry, Medical University of Lodz, 90-647 Lodz, Poland
4
Biohazard Prevention Centre, Faculty of Biology and Environmental Protection, University of Lodz, 90-136 Lodz, Poland
5
Institute of Pharmacology, Polish Academy of Sciences, 31-343 Krakow, Poland
*
Author to whom correspondence should be addressed.
Int. J. Mol. Sci. 2021, 22(1), 10; https://doi.org/10.3390/ijms22010010
Submission received: 21 October 2020 / Revised: 2 December 2020 / Accepted: 18 December 2020 / Published: 22 December 2020
(This article belongs to the Special Issue Tryptophan in Nutrition and Health)

Abstract

:
Previous studies suggest that depression may be associated with reactive oxygen species overproduction and disorders of the tryptophan catabolites pathway. Moreover, one-third of patients do not respond to conventional pharmacotherapy. Therefore, the study investigates the molecular effect of escitalopram on the expression of Cat, Gpx1/4, Nos1/2, Tph1/2, Ido1, Kmo, and Kynu and promoter methylation in the hippocampus, amygdala, cerebral cortex, and blood of rats exposed to CMS (chronic mild stress). The animals were exposed to CMS for two or seven weeks followed by escitalopram treatment for five weeks. The mRNA and protein expression of the genes were analysed using the TaqMan Gene Expression Assay and Western blotting, while the methylation was determined using methylation-sensitive high-resolution melting. The CMS caused an increase of Gpx1 and Nos1 mRNA expression in the hippocampus, which was normalised by escitalopram administration. Moreover, Tph1 and Tph2 mRNA expression in the cerebral cortex was increased in stressed rats after escitalopram therapy. The methylation status of the Cat promoter was decreased in the hippocampus and cerebral cortex of the rats after escitalopram therapy. The Gpx4 protein levels were decreased following escitalopram compared to the stressed/saline group. It appears that CMS and escitalopram influence the expression and methylation of the studied genes.

1. Introduction

Depression is a serious mental illness which is believed to affect 350 million people worldwide, according to the WHO. It has also been recognized as the third leading cause of disability in 2015 [1]. Although the condition affects both sexes, women are approximately twice as likely to develop symptoms [2]. If untreated, depression can lead to suicide attempts, and approximately one million people commit suicide every year [3,4]. In addition, depression is associated with high economic costs, constituting about 60% of the total cost of treating all mental conditions [5]. Unfortunately, more than a third of patients suffer from treatment-resistant depression [6].
Despite being such a serious health problem, the pathogenesis of depression remains unclear. However, previous studies suggest that disorders of the tryptophan catabolites (TRYCATs) pathway and associated overproduction of reactive oxygen species (ROS) may contribute to depression development [7,8]. Patients with depression are characterised by a decreased level of tryptophan and increased activity of IDO1 and TDO2, which converts tryptophan into kynurenine. The following stages of the TRYCATs pathway generate quinolinic acid, 3-hydroxykynurenine and 3-hydroxyanthranilic acid; these may induce the production of ROS, such as hydrogen peroxide, and increase lipid oxidation [9,10,11,12,13,14,15,16]. Indeed, patients with depression are frequently characterised by an increased level of free radicals and a decreased level of nonenzymatic antioxidants, including zinc, glutathione, and vitamins E, C, and A [17]. However, more contradictory results have been obtained with enzymatic antioxidants such as glutathione peroxidase and superoxide dismutase [18,19,20,21,22].
Depression is also associated with changes in specific parts of the brain. Interestingly, the previous study used with magnetic resonance imaging showed that depressed patients were characterised by smaller volumes of the amygdala, hippocampus, inferior anterior cingulate, and the orbital prefrontal cortex (OPFC), components of the limbic-cortico-thalamic circuit [23]. Frodl et al. (2008) confirmed that the brain of patients with depression showed more decline in grey matter density of the hippocampus, anterior cingulum, left amygdala, and right dorsomedial prefrontal cortex [24]. In addition, animal studies suggest that increased level of glucocorticoid observed in patients with depression may negatively affect neurogenesis and lead to excitotoxic damage or be associated with reduced levels of key neurotrophins in the hippocampus. Antidepressants may neutralise these effects by the increase of the neurogenesis in the hippocampus and brain-derived neurotrophic factor levels [25]. Moreover, increased levels of free radicals may cause cell death and atrophy of the neurons in the hippocampus and cortex [26]. Therefore, antidepressant drugs may exert their effectiveness by acting as antioxidants. For example, the antidepressant escitalopram, a selective serotonin reuptake inhibitor (SSRI). Escitalopram inhibits the serotonin transporter protein and is widely accepted as first-line antidepressant therapy. Escitalopram is characterized by favorable safety profile and has been shown efficacious for both acute and long-term treatments. Interestingly, escitalopram may have antioxidant properties, indicated by increased GABA levels in the frontal cortices of rats exposed to chronic mild stress (CMS) [27]. Moreover, subchronic treatment with escitalopram caused the reduced plasma SOD, CAT, malondialdehyde (MDA) and NO levels in depressed patients. However, Sarandol et al. (2007) found no difference in the levels of polyunsaturated fatty acid peroxidation products in depressed patients before and after antidepressant therapy [28]. Interestingly, the parameters came close to the results of healthy controls [29].
Therefore, the aim of the present study was to investigate the effect of chronic mild stress and antidepressant treatment with escitalopram in peripheral blood mononuclear cells (PBMCs), hippocampus, amygdala and cerebral cortex of rats. The study evaluates mRNA and protein expression, and the methylation status of gene promoters involved in oxidative stress (Gpx1, Gpx4, Cat, Nos1, Nos2) and the tryptophan catabolites pathway (Tph1, Tph2, Ido1, Kmo, Kynu). All studied gene products are presented in Table 1.

2. Results

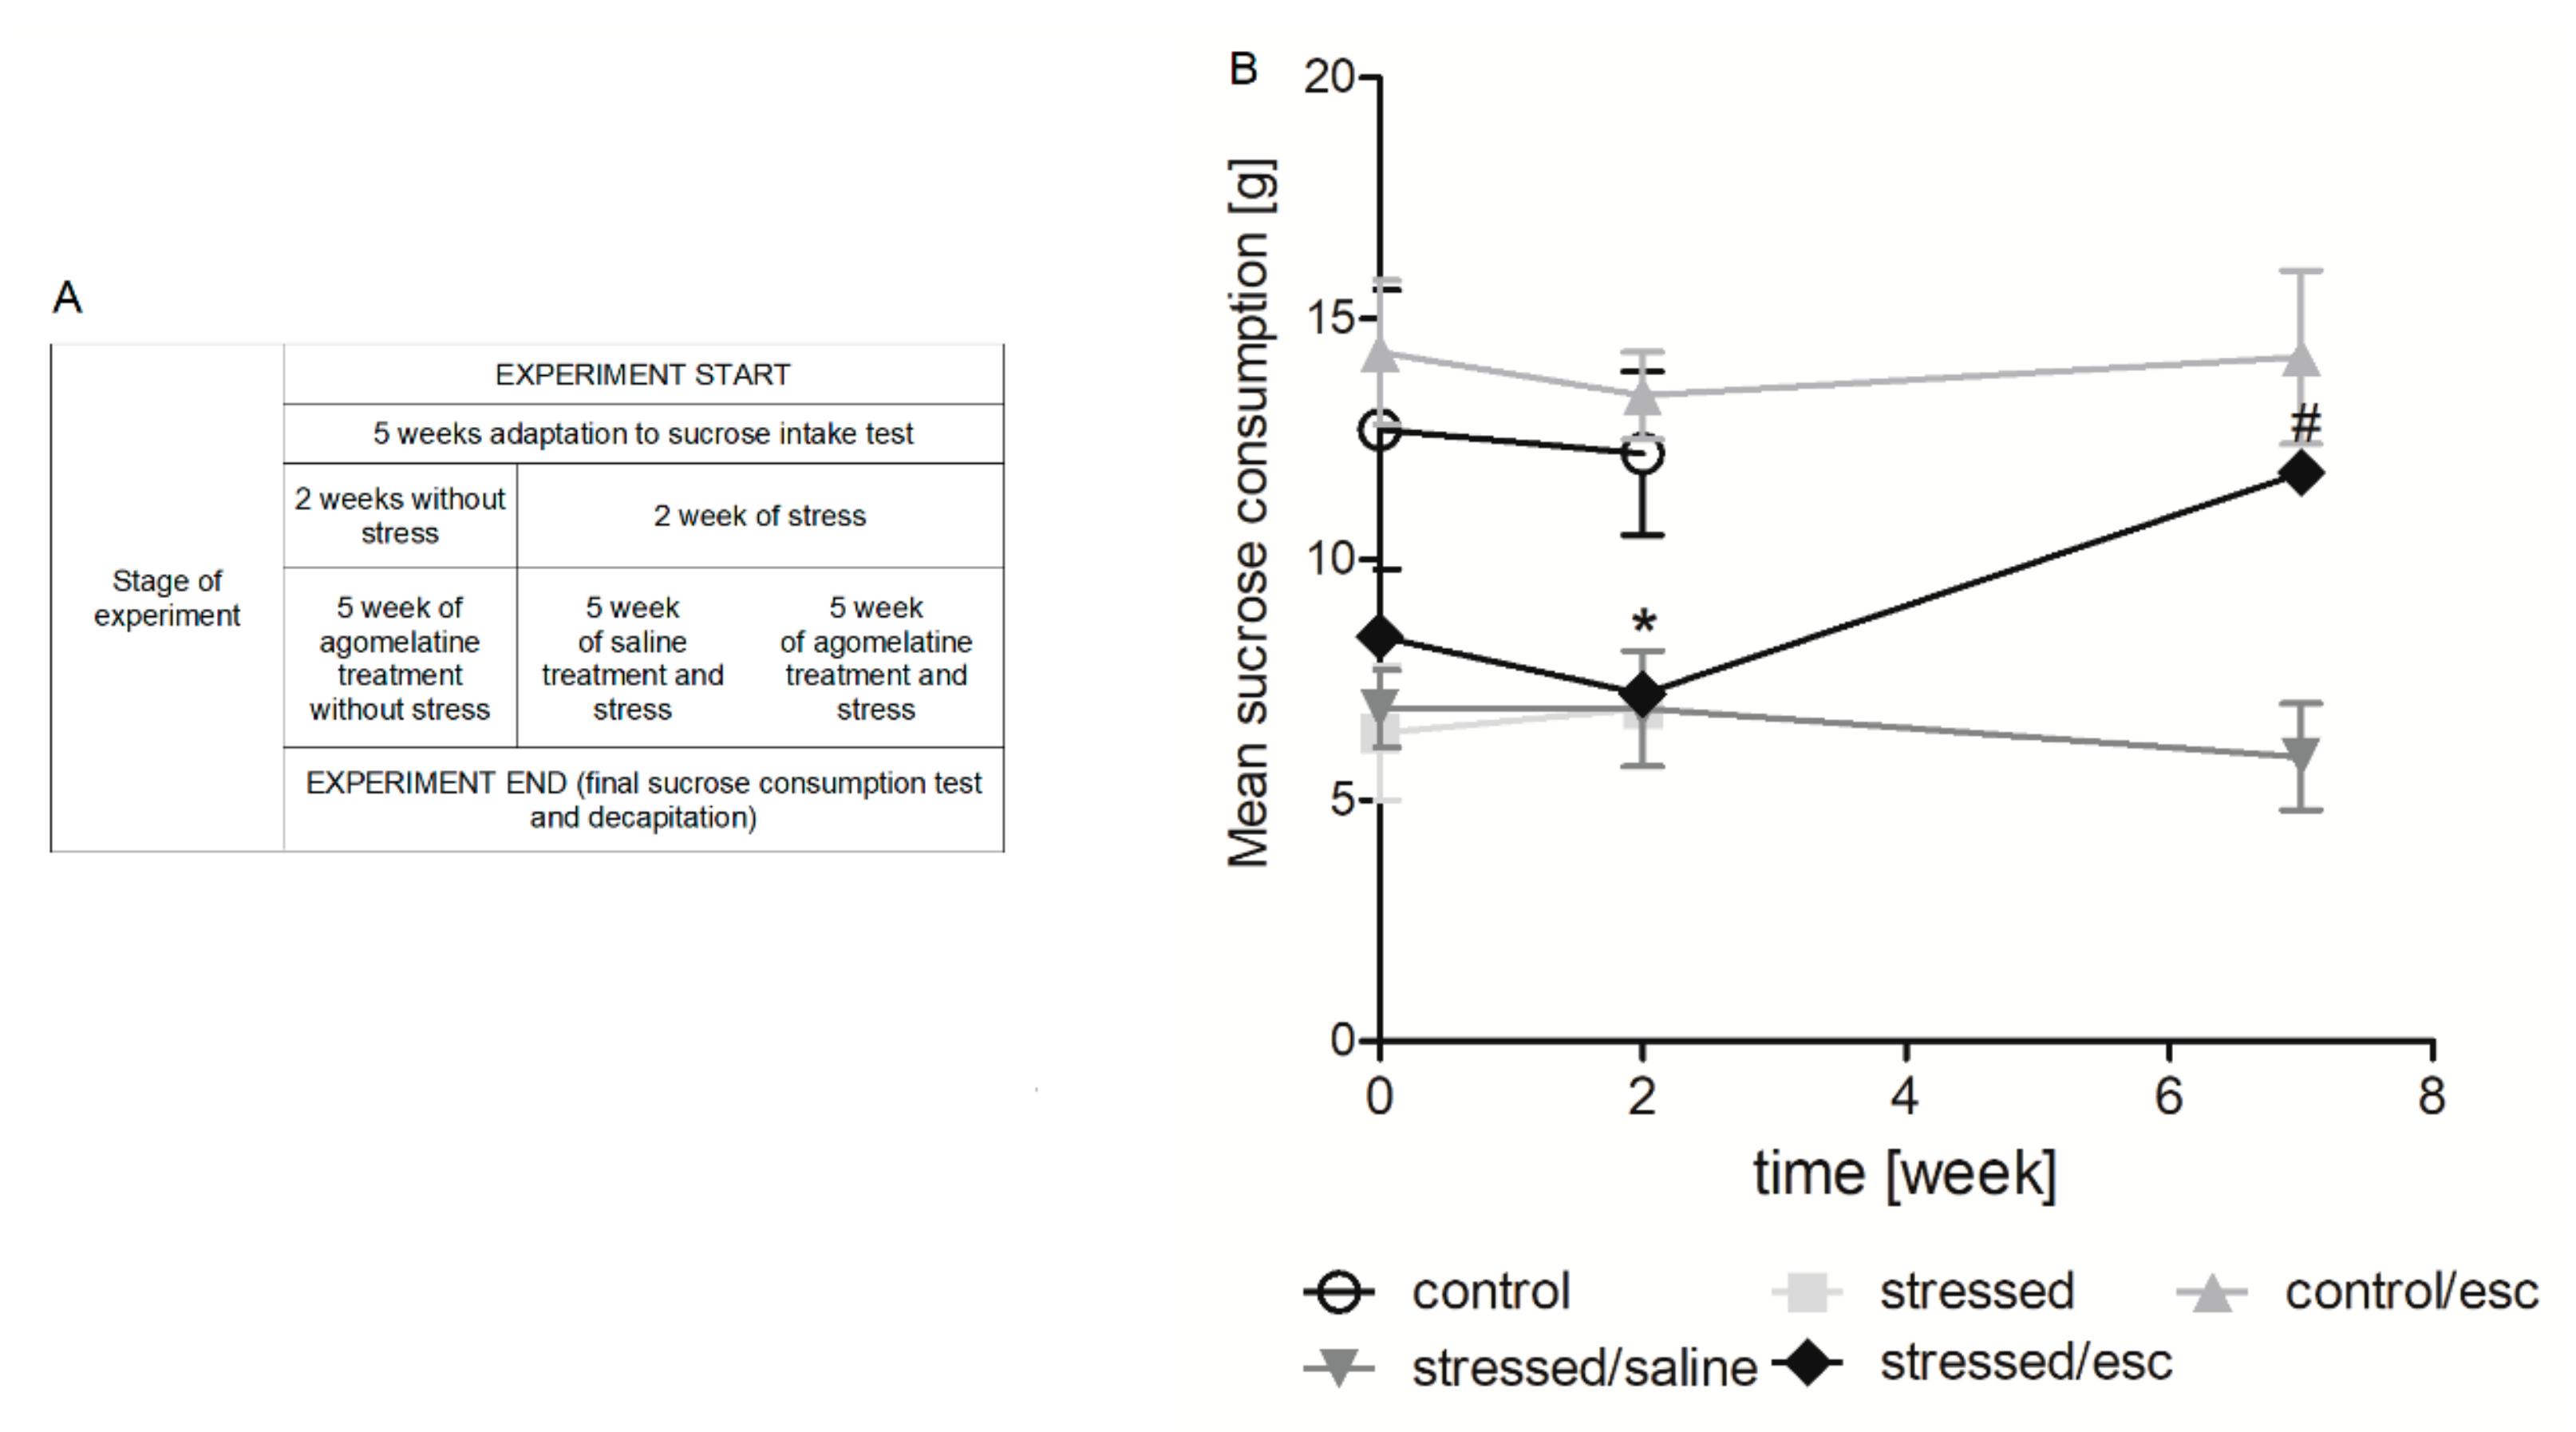
2.1. The Effect of CMS Procedure and Escitalopram Treatment on Sucrose Intake

As shown in Figure 1B, after two weeks of initial stress, the stressed rats were characterised by a decrease in sucrose intake (p < 0.05), whereas the escitalopram-treated stressed animals showed an approximately 60% increase in sucrose intake (Week 7).

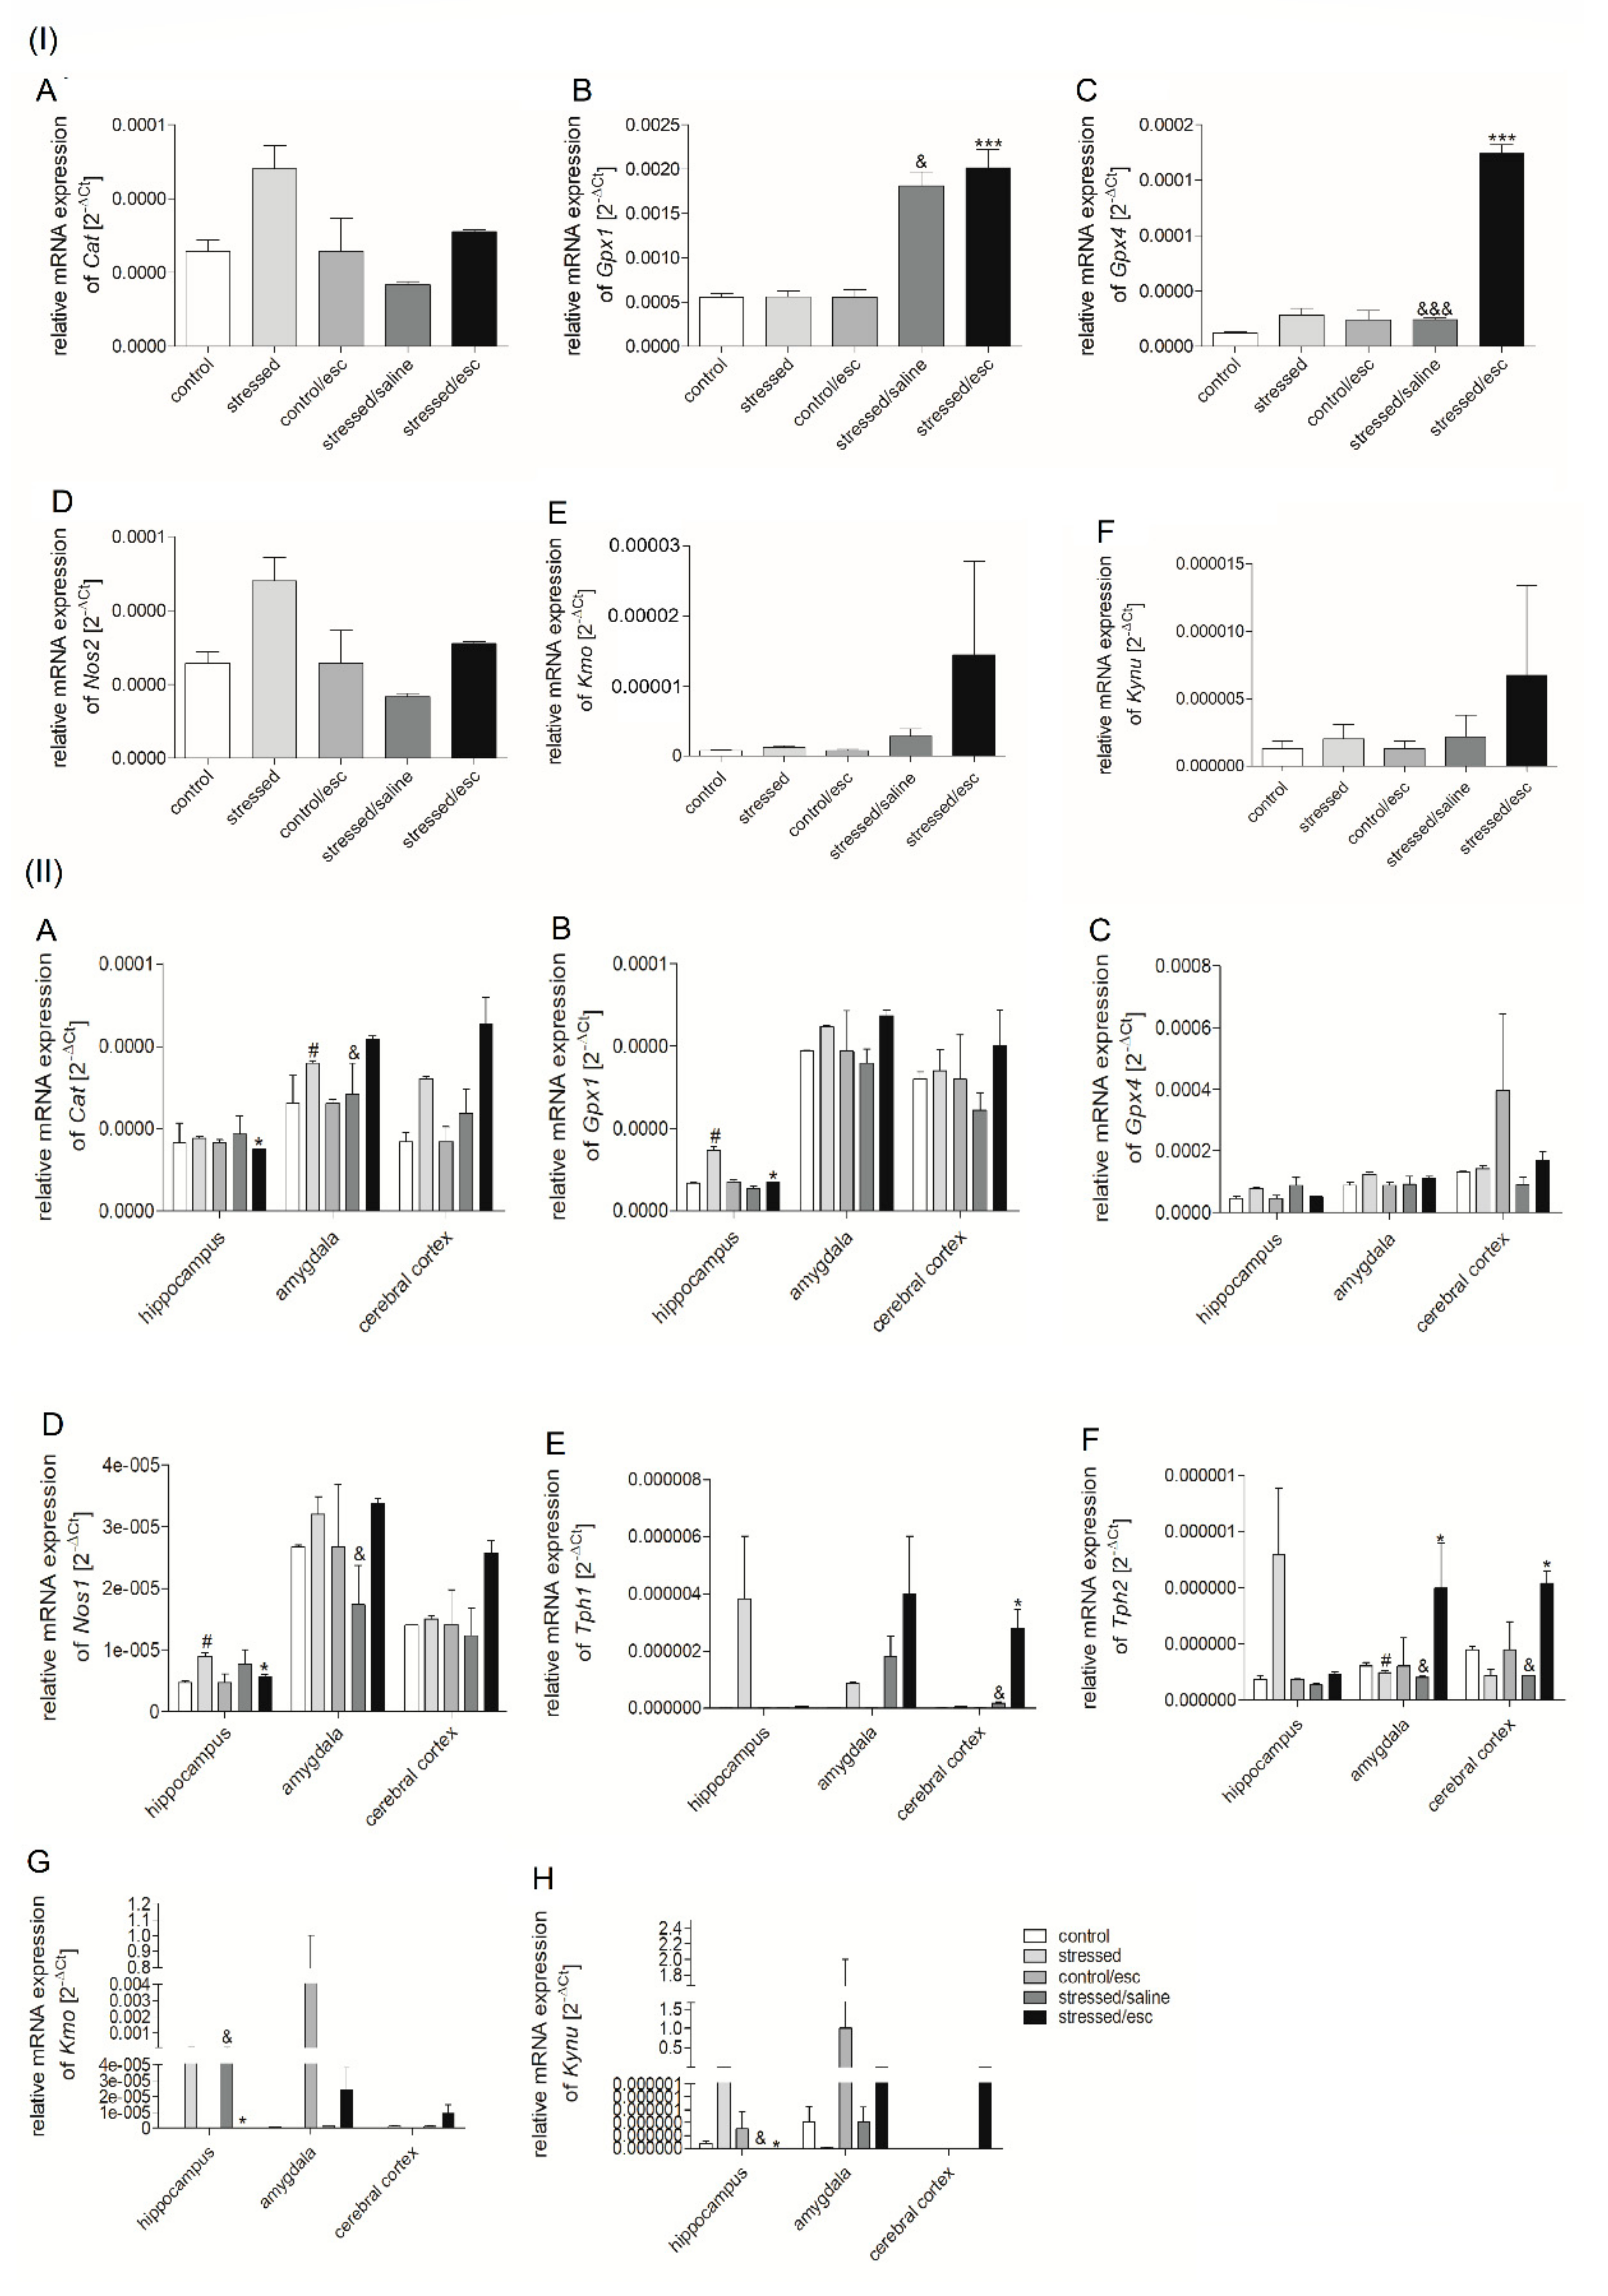
2.2. mRNA Expression

2.2.1. Gene Expression in PBMCs

The changes in mRNA expression are presented in Figure 2. The stressed rats receiving chronic administration of escitalopram demonstrated increased Gpx1 (H = 12.130, df = 4, p = 0.016, Tukey test p < 0.05; H = 12.130, df = 4, p = 0.016, Tukey test p < 0.001, respectively) and Gpx4 expression in PBMCs as compared to the stressed rats and the stressed rats after chronic administration of saline (F = 129.836, df = 4, p < 0.001, Tukey test p < 0.001; F = 129.836, df = 4, p < 0.001, Tukey test p < 0.001, respectively). In the case of the Cat, Nos2, and genes involved in TRYCATs pathway, no significant differences were observed between any studied groups.

2.2.2. Gene Expression in Brain Structures

As shown in Figure 2, the effect of CMS procedure and chronic escitalopram administration on the expression of the studied genes varied according to brain structure. Reduced levels of Cat mRNA were observed in the hippocampus of the stressed rats after escitalopram therapy as compared to stressed animals (H = 12.233, df = 4, p = 0.016, Tukey test p < 0.05). In addition, increased Cat mRNA expression was observed in the amygdala after CMS (H = 12.100, df = 4, p = 0.017, Tukey test p < 0.05), as well as after chronic escitalopram administration, as compared to the stressed saline group (H = 12.100, df = 4, p = 0.017, Tukey test p < 0.05). Similarly, elevated Gpx1 mRNA expression was recorded in the hippocampus of the stressed animals (H = 11.433, df = 4, p = 0.022, Tukey test p < 0.05), and this effect was normalised after chronic administration of escitalopram (H = 11.433, df = 4, p = 0.022, Tukey test p < 0.05). Additionally, Nos1 mRNA expression was elevated in the hippocampus following CMS (p < 0.05) and this effect was normalized in stressed rats after escitalopram treatment (H = 9.462, df = 4, p = 0.024, Tukey test p < 0.05). In addition, Nos1 was also elevated in the amygdala of stressed rats after antidepressant therapy compared to the stressed rats after saline therapy (H = 9.462, df = 4, p = 0.024, Tukey test p < 0.05).
In the case of genes involved in TRYCATs pathway, Tph1 expression in the cerebral cortex was elevated following escitalopram treatment compared to the stressed group (H = 12.433, df = 4, p = 0.014, Tukey test p < 0.05) and the stressed group receiving saline treatment (H = 12.433, df = 4, p = 0.014, Tukey test p < 0.05). In contrast, Tph2 mRNA expression in the amygdala fell following CMS. However, this effect was normalised by chronic administration of escitalopram (H = 8.692, df = 4, p = 0.034, Tukey test p < 0.05). In addition, higher Tph2 mRNA expression was observed in the amygdala of rats after antidepressant therapy than in those after saline treatment (H = 8.692, df = 4, p = 0.034, Tukey test p < 0.05). Elevated Tph2 expression was also observed in the cerebral cortex of animals after escitalopram treatment as compared to stressed group and animals after saline treatment (F = 7.123, df = 4, p = 0.006, Tukey test p < 0.05). The chronic administration of escitalopram caused a decrease of Kmo (H = 9.688, df = 4, p = 0.046, Tukey test p < 0.05) and Kynu mRNA (H = 10.937, df = 4, p = 0.027, Tukey test p < 0.05) expression in the hippocampus as compared to saline treatment.

2.2.3. The Effect of Escitalopram Treatment on Gene Expression in PBMCs and Brain Structures

Escitalopram caused an increase in Tph2 expression in the amygdala and cerebral cortex compared to PBMCs (p < 0.001) (Supplementary Figure S1). No significant differences were found between any of the studied groups regarding the effect of escitalopram treatment on the expression of the other studied genes involved in oxidative stress and the TRYCATs pathway.

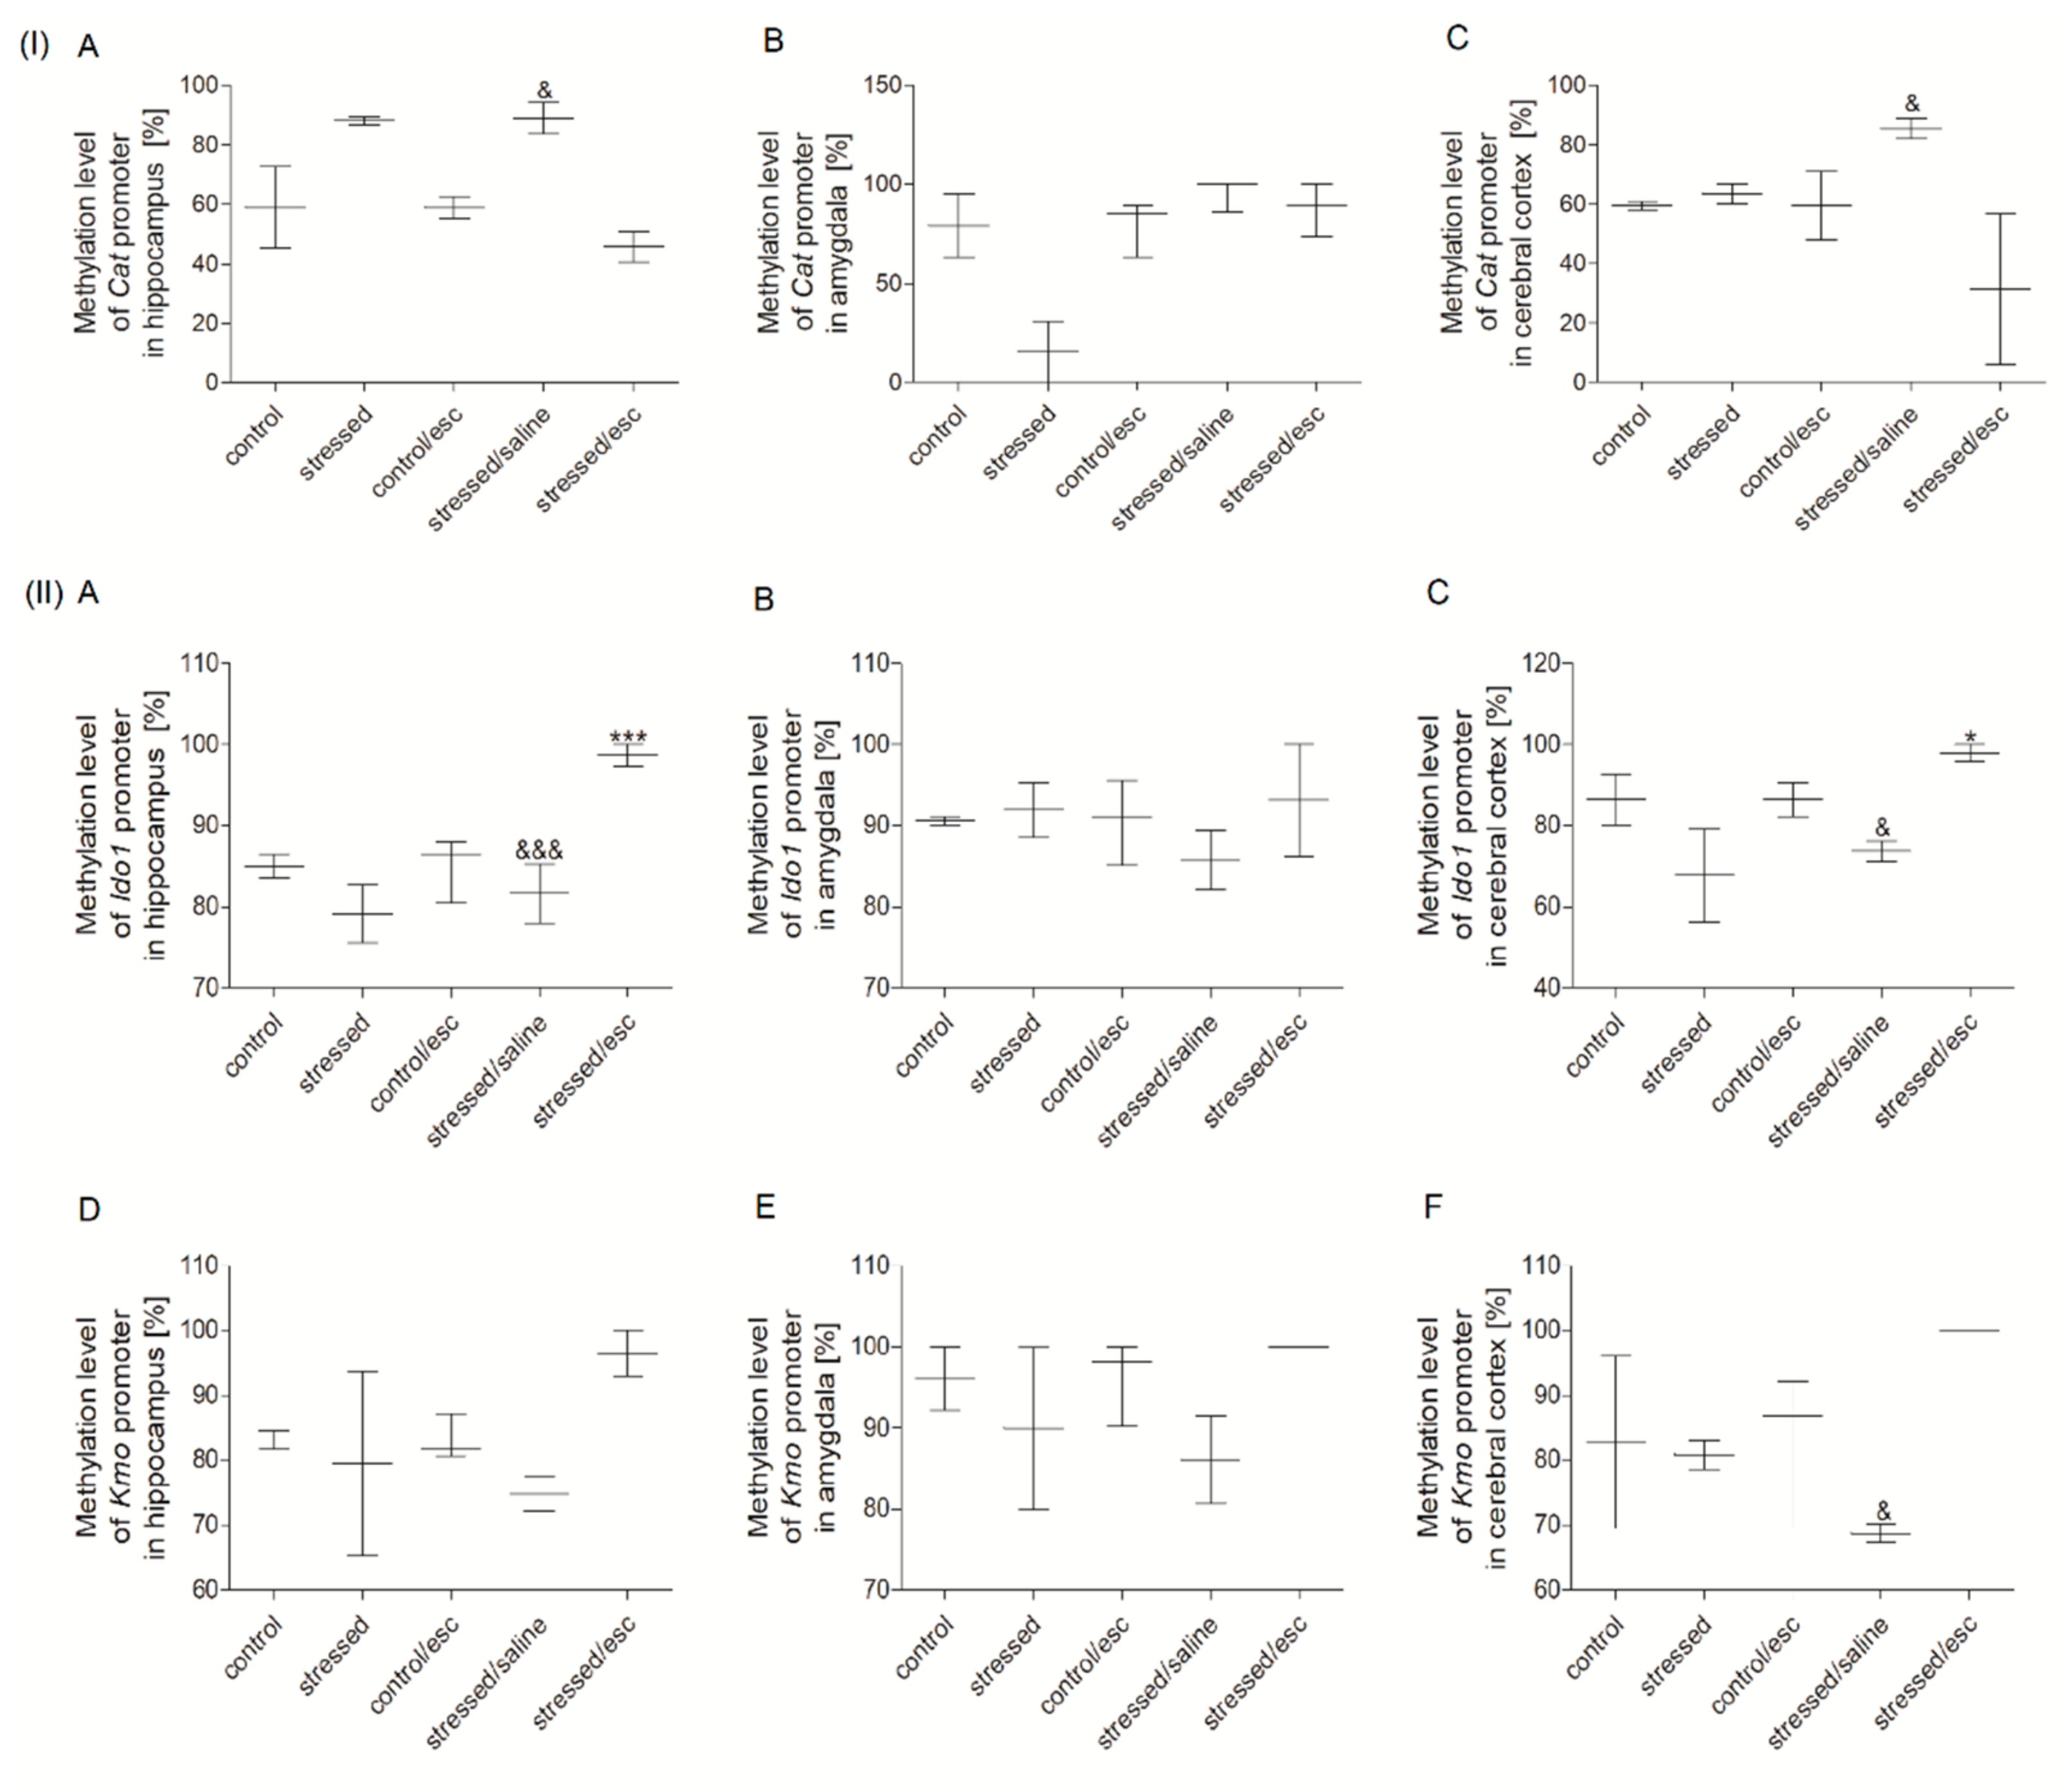
2.3. Methylation Status

2.3.1. Methylation Status of Promoter Regions in PBMCs

Interestingly, no significant change in the methylation status of the promoter regions of the studied genes was observed between the studied groups following CMS and escitalopram therapy (Supplementary Table S1).

2.3.2. Methylation Status of Promoter Regions in Brain Structures

The methylation status of the Cat promoter region was reduced in the hippocampus and the cerebral cortex of the stressed group after escitalopram treatment as compared to the stressed group after saline administration (H = 11.412, df = 4, p = 0.022, Tukey test p < 0.05) (Figure 3). Moreover, the methylation status of the Ido1 promoter region in the hippocampus and the cerebral cortex was increased in the escitalopram-treated group compared to the stressed group and saline-treated group (F = 18.681, df = 4, p < 0.001, Tukey test p < 0.001; H = 12.247, df = 4, p = 0.016, Tukey test p < 0.05, respectively). In addition, the Kmo promoter region demonstrated increased methylated status in the cerebral cortex of stressed animals after escitalopram treatment compared to the stressed rats after saline therapy (H = 9.829, df = 4, p = 0.043, Tukey test p < 0.05). No significant changes in the methylation status of promoter regions were observed for the other studied genes (Supplementary Table S1).

2.3.3. The Effect of Escitalopram Treatment on the Methylation Status of Promoter Regions in PBMCs and Brain Structures

No significant differences were found between the studied groups with regard to the effect of escitalopram treatment on methylation status of the promoter regions of all studied genes involved in oxidative stress and the TRYCATs pathway (Supplementary Figure S2).

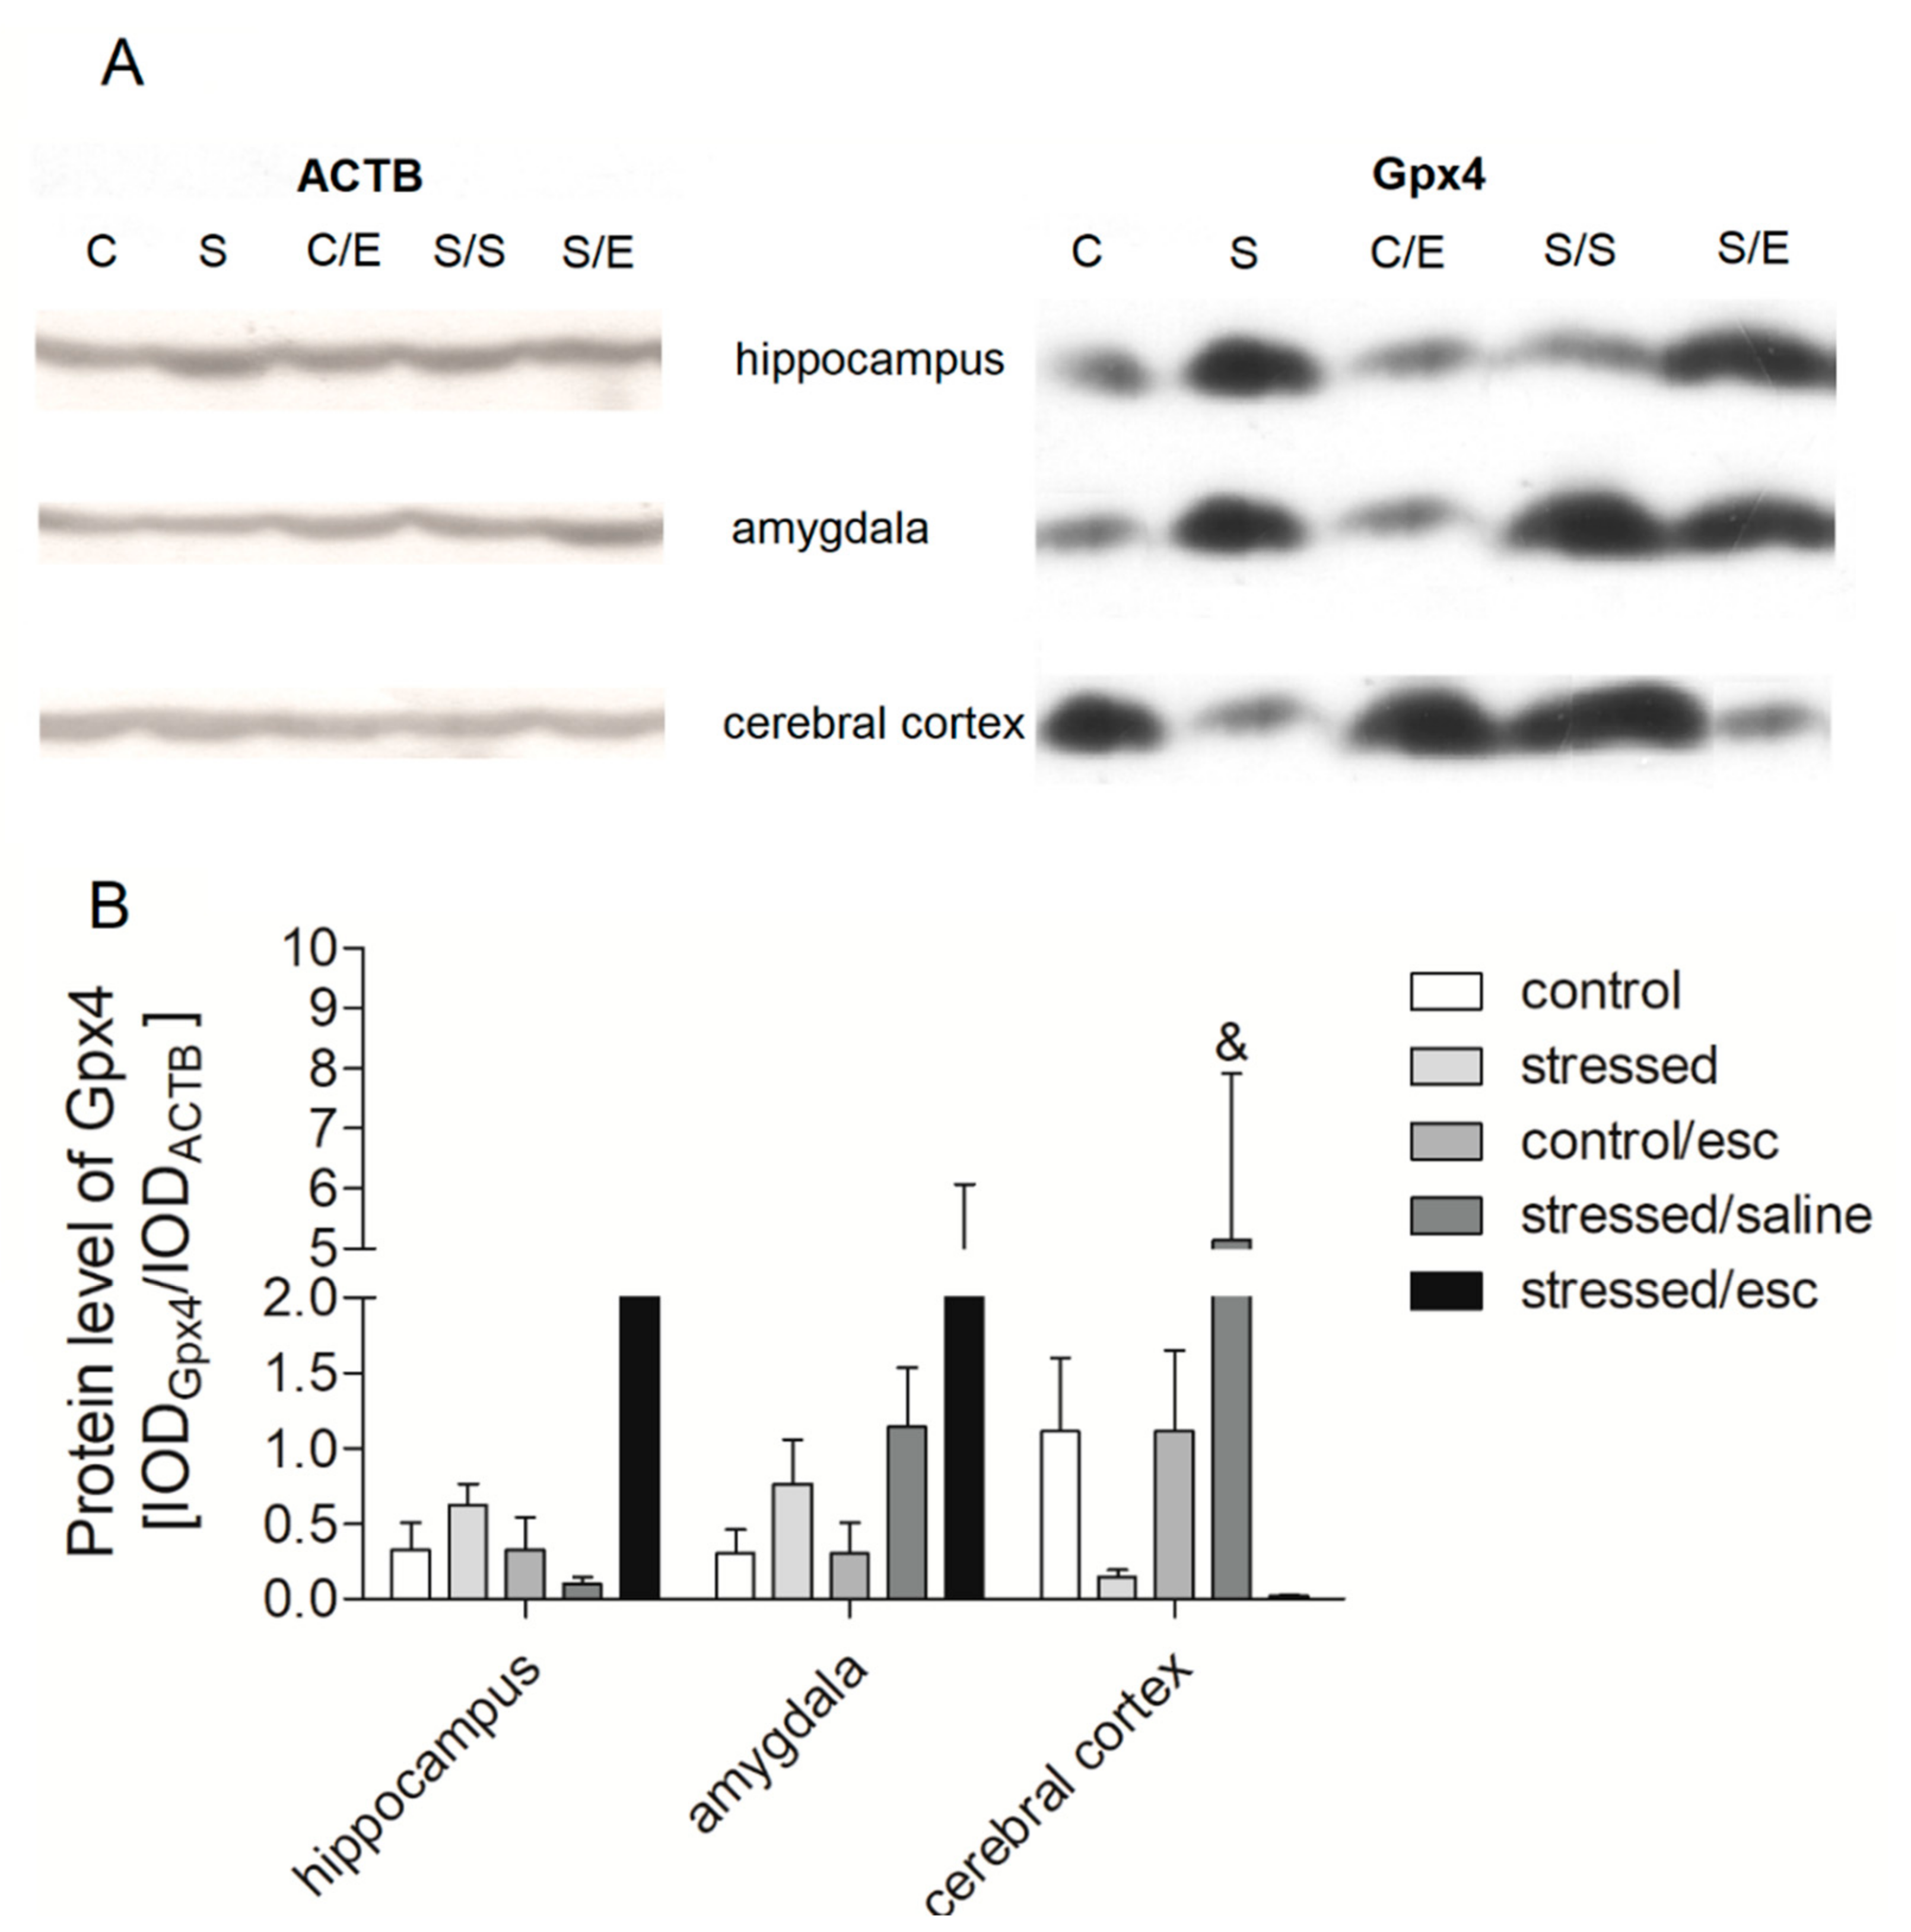
2.4. Protein Expression in Brain Structures

In the brain structures, the only change observed in protein expression associated with escitalopram treatment was observed in the cerebral cortex, where the level of Gpx4 protein was reduced compared to stressed animals after saline treatment (H = 11.445, df = 4, p = 0.022, Tukey test p < 0.05) (Figure 4; Supplementary Figure S3). No other significant differences were observed between the studied groups regarding the other genes involved in oxidative stress and the TRYCATs pathway.

3. Discussion

Our findings demonstrate the impact of CMS and antidepressant treatment with escitalopram on the level of protein and mRNA expression in PBMCs and the hippocampus, amygdala and cerebral cortex. We also elucidate the methylation status of the promoter regions of the genes involved in oxidative and nitrosative stress, as well as the TRYCATs pathway. However, we didn’t evaluate any oxidative and nitrosative stress markers, including MDA, 8-oxoguanine, and 8-iso-prostaglandin F2α. The increased levels of the above-mentioned markers have been repeatedly confirmed in studies involving humans and animals. Therefore, we focused our research on an attempt to explain the molecular causes of changes in the levels of oxidative stress markers, i.e., changes in methylation and expression of genes encoding antioxidant defence enzymes [30,31,32,33].
In the presented study, the chronic mild stress was used as an animal depression model. Previous studies have shown that the CMS model is associated with the development of depression-like behaviour; one such form of behaviour is anhedonia, which is manifested in a reduction of 1% saccharose solution consumption [34,35,36,37,38]. Similarly, the present results indicate that the stressed rats demonstrated decreased consumption of sucrose solution and were hence deficient in sensitivity to rewards. On the other hand, five-week antidepressant therapy with escitalopram caused this effect to be normalised in the stressed rats. Unfortunately, there is no ideal animal model for depression and also the one used in this study has its limitations and disadvantages. The CMS model used in the presented research is based on the reflection of only one symptom of depression, anhedonia. Thus, the model is rated low in terms of the face validity whereas the criteria of the construct validity and predictive validity are highly rated. Moreover, in the case of animal models of depression, it should be remembered that some symptoms cannot be obtained in rats, e.g., suicidal thoughts. Due to the multifactorial nature of depression and the variety of psychological symptoms, each animal model used has some imperfections. In the future, the presented study results may be used to develop new animal models that better reflect depression [39].
As well as changes in sensitivity to reward, the application of CMS and escitalopram therapy resulted in changes in the expression and methylation status of promoter regions of genes involved in oxidative and nitrosative stress, as well as the TRYCATs pathway. Similarly, previous animal studies suggest that such disorders may contribute to the development of depression [40,41,42,43]. In addition, patients with depression also demonstrate exacerbation of the oxidative process and insufficient antioxidant response, as well as overproduction of neurotoxic tryptophan metabolites such as quinolinic acid and 3-hydroxykynurenine [44,45]. Interestingly, the metabolites of the TRYCATs pathway may also induce the generation of reactive oxygen species [9,10,11,12,13,14,15,16]. In addition, CMS and venlafaxine treatment, an antidepressant belonging to the serotonin–norepinephrine reuptake inhibitor group, has also been found to influence the expression and methylation of genes involved in the TRYCATs pathway, and on oxidative stress and nitrosative stress [43]. The present study continues this line of research on the impact of antidepressant treatment on changes at the molecular level.
The first key finding of the current study is that escitalopram treatment increased Gpx1, Gpx4, and Nos2 mRNA expression in PBMCs. Enzymes encoded by Gpx1 and Gpx4 genes catalyse the reduction of hydrogen peroxide to water whereas Nos1 and Nos2 takes part in NO synthesis [46,47]. Thus, the results suggest that antidepressant treatment with escitalopram may be associated with the reduction of intensifying of the oxidative stress process or elevated expression of genes encoding antioxidant enzymes in PBMCs. In contrast, Cat, Gpx1, and Nos1 mRNA expression was increased in the hippocampus of rats after CMS, and this effect was normalised by chronic administration of escitalopram. Moreover, the stressed animals were found to demonstrate decreased protein expression of Gpx4 in the cerebral cortex after escitalopram treatment. Similarly, stressed rats were previously found to display decreased Gpx1 mRNA expression in the hippocampus after antidepressant therapy with venlafaxine [37]. In addition, superoxide generation was found to be increased in the cerebral cortex and hippocampus of stressed rats [48]. Such intensification of oxidative stress has been found to cause increased lipid peroxidation in the cerebral cortex and hippocampus and protein peroxidation in the cortex of stressed animals [49]. Therefore, the increased mRNA expression of Gpx1 observed in the hippocampus of rats after CMS observed in the present study may be associated with an intensification of antioxidant defence in response to the development of oxidative stress, as indicated previously [42]. Elsewhere, Nos1 and Gpx1 mRNA expression in the midbrain and basal ganglia were found to be increased in stressed rats, while this effect was normalised by antidepressant therapy with venlafaxine [42].
Another animal study found that an oxidative imbalance causes an increase of ROS levels, resulting in disturbed Tph1/2 mRNA expression and the reduction of serotonin synthesis [50]. Similarly, our study confirmed that CMS caused a decrease of Tph2 mRNA expression in the amygdala. Tph converts tryptophan into 5-hydroxytryptophan and determines the concentration of serotonin [51,52]. Thus, increased expression of Tph1 and Tph2 can provide an adequate level of serotonin synthesis [53]. Our data confirms that antidepressant therapy with escitalopram caused an increase of Tph1 mRNA expression in the cerebral cortex of the stressed rats, as well as Tph2 mRNA in the amygdala. This is an important finding in the light of the “serotonin hypothesis” of clinical depression, first proposed 50 years ago. Previous studies have found an impairment of serotonin function to play a crucial role in the pathophysiology of depression.
Depression may also be associated with elevated levels of the neurotoxic metabolites of the TRYCATs pathway, such as quinolinic acid, 3-hydroxykynurenine, and 3-hydroxyanthranilic acid. The former is a toxic compound that may induce the generation of ROS oxidation [9,10,11,12,13,14,15,16]. 3-hydroxykynurenine is a product of the reaction catalysed by Kmo while 3-hydroxyanthranilic acid is formed in a reaction catalysed by Kynu [54]. Thus, depression may be associated with increased levels of Kmo and Kynu, which may act as target for antidepressant therapy [55]. Moreover, our present study confirmed that the mRNA expression of Kmo and Kynu is decreased, while the methylation status of the Kmo promoter region is increased, in the cerebral cortex of stressed rats after escitalopram treatment.
Regarding Ido1, the gene encoding the rate-limiting enzyme of tryptophan metabolism and catalysed the oxidation of L-tryptophan to N-formylkynurenine [56], increased activity has been observed in the plasma of patients with depression and rats with anhedonia [57]. Our present findings indicate that the stressed rats demonstrated increased methylation status in the Ido1 promoter region after escitalopram therapy, which can limit Ido1 mRNA expression.

4. Conclusions

Our findings confirm that the depression and antidepressant therapy may be associated with the disorders of the interrelated biochemical pathways, including oxidative and nitrosative stress, as well as the TRYCATs pathway. Disorders in the TRYCATs pathway may induce oxidative stress processes and vice versa. In addition, it was found that the changes in mRNA and protein expression and methylation status of promoter regions appear to be dependent on the type of the tissue or brain structure. Our observations demonstrate that analyses of mRNA and protein expression, and promoter methylation status, can shed light on the mechanisms of depression development and the action of drugs for antidepressant therapy. Unfortunately, our study has some limitations. First, our research focused only on the expression and methylation of selected genes related to oxidative stress. Therefore, it cannot be conclusively assessed if escitalopram has any effects on oxidative stress and damage. Further analyses should be performed to support this hypothesis. Secondly, it has to be stressed that the depression model used is based only on anhedonia, expressed by reducing sucrose intake. Therefore, studies with other animal models of depression should also be conducted in the future.

5. Materials and Methods

5.1. Animals

Male Wistar Han rats (Charles River, Lindau/Bodensee, Germany), weighing approximately 200–220 g, were individually housed under standard conditions, i.e., room temperature (22 °C) with twelve-hour cycles of day and night, with unlimited access to food and water. Each studied group consisted of six animals. All experimental procedures were carried out in accordance with the rules of the 86/609/EEC Directive and were approved by the Local Bioethics Commission of the Institute of Pharmacology, Polish Academy of Sciences in Krakow.

5.2. CMS

In the first stage, rats were trained to consume a 1% solution of sucrose for lasted 1 h following 14 h water and food deprivation. After the adaptation and training period, the animals were divided into two matched groups and the sucrose intake test was performed weekly until the end of the experiment. One group of rats was exposed to a CMS procedure for two or seven weeks. The stress stimuli consisted of two periods of food or water deprivation, two periods of low-intensity stroboscopic illumination (150 flashes/min), two periods of 45° cage tilt, one period of paired housing, two periods of soiled cage (250 mL water in sawdust bedding), two periods of intermittent illumination (lights on and off every two hours), and three periods of no stress. The stressors were used individually and continuously, day and night, for 10–14 h periods. Non-stressed animals had unlimited access to food and water and were individually housed in cages without contact with the stressed animals. After two weeks of the CMS procedure, the animals were divided into two groups: one group was sacrificed and decapitated and the other was further divided into matched subgroups. The latter received daily administration of either vehicle (1 mL/kg, IP) or escitalopram (10 mg/kg, IP) for five weeks. After this five-week period and tha last sucrose intake test, all animals were sacrificed and decapitated. The scheme of the CMS procedure was presented in the Figure 1A.

5.3. Drug

Escitalopram (Carbosynth Ltd., Compton, Berkshire, United Kingdom), obtained commercially, was dissolved in 0.9% sterile saline and then injected at a dose of 10 mg/kg, IP (1 mL/kg of body weight).

5.4. Collection of PBMCs and Brain Structure Specimens

Blood samples were taken into vacutainer tubes with anticoagulants. PBMCs were isolated using Gradisol L (Aqua-Med, Lodz, Poland) and centrifugation and 400× g for 30 min at 4 °C. After PBMC isolation, the cell pellets were stored at −80 °C until required. In the case of the brain structures, the samples were frozen in liquid nitrogen and stored at −80 °C until required. The frozen brain samples were then suspended in PBS and manually homogenised using a FastGene® Tissue Grinder (Nippon Genetics Europe, Düren, Germany). The samples of PBMC pellets and brain homogenates were used for later experiments, including RNA and DNA isolation.

5.5. Determination of mRNA Expression Level in PBMCs and Brain Structures

The total RNA samples were isolated from PBMCs pellets and frozen brain structures using commercial kits (GenElute Mammalian Total RNA Miniprep Kit, Sigma-Aldrich, ISOLATE II RNA/DNA/Protein Kit, Bioline, respectively) according to the manufacturer’s protocol. The quantity and purity of RNA samples were confirmed spectrophotometrically using a Synergy HTX Multi-Mode Microplate Reader, equipped with a Take3 Micro-Volume Plate (BioTek Instruments, Inc., Winooski, VT, USA).
The RNA samples were diluted to 5 ng/µl and transcribed into cDNA using a High-Capacity cDNA Reverse Transcription Kit (Applied Biosystems, Foster City, CA, USA) according to the manufacturer’s recommendations. mRNA expression was determined by real-time PCR using a TaqMan Universal Master Mix, no UNG and species-specific TaqMan Gene Expression Assay–assay ID: Rn00560930_m1 (Cat), Rn00577994_g1 (Gpx1), Rn00820818_g1 (Gpx4), Rn00583793_m1 (Nos1) and Rn00561646_m1 (Nos2) (Thermo Fisher Scientific, Waltham, Massachusetts, USA) according to the manufacturer’s instructions. Real-time PCR runs were performed using a CFX96TM Real-Time PCR Detection System Thermal Cycler (Bio Rad Laboratories Inc., Hercules, CA, USA).
The relative levels of mRNA expression of all studied genes were estimated as fold = 2−ΔCt, where ΔCt sample = Ct target gene − Ct reference gene, with the 18S (18S ribosomal RNA) gene being used as the reference gene. Additionally, the 2−ΔΔCt method was also used to estimate the fold change in expression caused by antidepressant administration [58].

5.6. Determination of Methylation Status in PBMCs and Brain Structures

The DNA samples were extracted from PBMCs using QIAamp DNA Mini Kit (Qiagen, Hilden, Germany) and from brain structures using ISOLATE II RNA/DNA/Protein Kit (Bioline Ltd., London, UK) following the manufacturer’s instructions. The quantity and purity of DNA samples were estimated spectrophotometrically using a Synergy HTX Multi-Mode Microplate Reader, equipped with a Take3 Micro-Volume Plate (BioTek Instruments, Inc., Winooski, VT, USA). The DNA was then modified by bisulfite using a CiTi Converter DNA Methylation Kit (A&A Biotechnology, Gdynia, Poland) as indicated by the manufacturer. The primers for promoter regions that included CpG islands were designed using MethPrimer (http://www.urogene.org/methprimer2/) according Wojdacz et al. [59].
PCR amplification and MS-HRM assay were performed on the Bio-Rad CFX96 Real-Time PCR Detection System (BioRad Laboratories Inc., Hercules, CA, USA) equipped with Bio-Rad Precision Melt Analysis Software (BioRad Laboratories Inc., Hercules, CA, USA) to analyse the methylation status of all studied genes. The PCR reactions contained 5 × HOT FIREPol® EvaGreen® HRM Mix (no ROX) (Solis BioDyne Tartu, Estonia), 500 nM of forward and reverse primers, DNA samples (10 ng/µL) after bisulphite modification and PCR-grade water. The sequences of the primers and conditions of reaction are presented in Table 2. Finally, the methylation status of the studied samples was estimated based on HRM profiles obtained from the amplification of methylated template DNA (CpGenomeTM Rat Methylated Genomic DNA Standard, Merck Millipore Burlington, MA, USA) and unmethylated DNA (CpGenomeTM Rat Unmethylated Genomic DNA Standard, Merck Millipore Burlington, MA, USA). Therefore, serial dilutions of template DNA were prepared: 0%, 10%, 25%, 50%, 75%, and 100% methylated DNA.

5.7. Determination of Protein Expression in the Tested Brain Structures

The frozen brain tissue samples were lysed and sonicated in RIPA buffer containing serine protease inhibitor (1mM phenylmethylsulfonyl fluoride), and then centrifuged for 5 min at 5000 rpm in 4 °C. The concentration of protein samples was determined by the Lowry procedure using a Synergy HTX Multi-Mode Microplate Reader, equipped with a Take3 Micro-Volume Plate (BioTek Instruments, Inc., Winooski, VT, USA). Following this, 25 µg of the protein samples were separated by 10% SDS polyacrylamide gels electrophoresis and transferred onto Immobilon-P membrane (Millipore, Bedford, MA, USA). After transfer, the membranes were blocked in 5% non-fat dry milk solution and incubated with primary antibodies. Next, horseradish peroxidase-conjugated secondary antibodies were used to detect primary antibodies. A fuller description of the antibodies and incubation conditions is presented in Table 3. Finally, peroxidase substrate solution (Thermo Fisher Scientific, Waltham, MA, USA) was used for X-ray film visualization by enhanced chemiluminescence. The density of the bands was analysed using Gel-Pro® Analyzer Software (Media Cybernetics Inc., Rockville, MD, USA) and normalized to β-actin levels.

5.8. Statistical Analysis

All statistical analyses were performed using Statistica 12 (Statsoft, Tulsa, OK, USA) and SigmaPlot 11.0 (Systat Software Inc., San Jose, CA, USA). The data were expressed as the mean ± standard error of the mean. The statistical analysis was started with the Shapiro–Wilk test which was used to evaluate data normality. Then, the one-way analysis of variance (ANOVA) was used to detect significant differences between samples with normal distribution whereas differences between probes with non-normal distribution were confirmed by the Kruskal–Wallis test. Finally, the Tukey test was used as post-hoc test. A value of p < 0.05 was considered to be significant.

Supplementary Materials

Included the addition results about methylation and expression level: The following are available online at https://www.mdpi.com/1422-0067/22/1/10/s1, Figure S1: mRNA expression of Cat (A), Gpx1 (B), Gpx4 (C), Tph2 (D), Kmo (E) and Kynu (F) in PBMCs and in the brain structures of animals exposed to CMS for two weeks (control, stressed) and in animals exposed to CMS for seven weeks and administered vehicle (1 mL/kg) or escitalopram (10 mg/kg) for five weeks (control/esc, stressed/saline, stressed/esc). The effects are presented as fold change (2−ΔΔCt method; Schmittgen and Livak, 2008). Data represent means ± SEM. n = 6. *** p < 0.001 for differences between blood and all studied brain structures. Figure S2. The methylation level of Tph1 (A), Ido1 (B), Kmo (C), Cat (D), Gpx1 (E), Gpx4 (F) promoter regions, Nos1 promoter 3 region (G), Nos1 promoter 7 region (H) between brain structures and PBMCs of animals exposed to CMS for two weeks control, stressed) and in animals exposed to CMS for seven weeks and treated vehicle (1 mL/kg) or escitalopram (10 mg/kg) for five weeks (control/esc, stressed/saline, stressed/esc). Data represent as means ± SEM. n = 6. Figure S3. Protein expression of Cat (A), Nos1 (B), Tph1 (C), Tph2 (D), Ido1 (E) and Kynu (F) in brain structures of animals exposed to CMS for two weeks (control, stressed) and in animals exposed to CMS for seven weeks and administered vehicle (1 mL/kg) or escitalopram (10 mg/kg) for five weeks (control/esc, stressed/saline, stressed/esc). Levels of Cat (A), Nos1 (B), Tph1 (C), Tph2 (D), Ido1 (E) and Kynu (F) proteins measured in hippocampus, amygdala and cerebral cortex. Samples containing 25 μg of proteins were resolved by SDS-PAGE. The intensity of bands corresponding to Gpx4 was analysed by densitometry. Integrated optical density (IOD) was normalized by protein content and a reference sample (see the Methods section for details). The graphs show the mean IODs of the bands from all analysed samples. The IODgene/IODACTB method was used to estimate the relative protein expression levels in the analysed samples. Data represent means ± SEM. n = 6. No significant changes were found between any groups. Table S1. Methylation level of, Gpx1 promoter (A), Gpx4 promoter 3 (B), Nos1 promoter 3 (C), Nos1 promoter 7 (D), Tph1 promoter (E), Ido1 promoter (F) Kmo promoter (G) in the hippocampus, amygdala, cerebral cortex and PBMCs of animals exposed to CMS for two weeks (control, stressed) and in animals exposed to CMS for seven weeks and administered vehicle (1 mL/kg) or escitalopram (10 mg/kg) for five weeks (control/esc, stressed/saline, stressed/esc). Data represents means ± SEM. n = 6. No significant changes were found between any groups.

Author Contributions

Conceptualization, T.S. and M.P.; Methodology, P.W., E.S., P.J., P.C., P.G. and M.P.; Validation, P.W., E.S., P.J., P.G. and M.P.; Formal Analysis, P.W., E.S.; Investigation, P.W., E.S., P.J., P.C., K.B., M.B., P.G. and M.P.; Data Curation, T.S.; Writing—Original Draft Preparation, P.W.; Writing—Review & Editing, J.S., M.P., T.S.; Supervision, T.S.; Project Administration, T.S.; Funding Acquisition, T.S. All authors have read and agreed to the published version of the manuscript.

Funding

Source of support: This study was funded by the National Science Centre of Poland grant (2015/19/BNZ7/00410) and grant (No. 1.01.01.000.XX) from the University of Lodz (funding for young scientists).

Conflicts of Interest

The authors declare no conflict of interest. All experimental procedures were carried out in accordance with the rules of the 86/609/EEC Directive and were approved by the Local Bioethics Commission of the Institute of Pharmacology, Polish Academy of Sciences in Krakow.

References

  1. Vos, T.; Allen, C.; Arora, M.; Barber, R.M.; Bhutta, Z.A.; Brown, A.; Carter, A.; Casey, D.C.; Charlson, F.J.; Chen, A.Z.; et al. Global, regional, and national incidence, prevalence, and years lived with disability for 310 diseases and injuries, 1990–2015: A systematic analysis for the Global Burden of Disease Study 2015. Lancet 2016, 388, 1545–1602. [Google Scholar]
  2. Seedat, S.; Scott, K.M.; Angermeyer, M.C.; Berglund, P.; Bromet, E.J.; Brugha, T.S.; Demyttenaere, K.; De Girolamo, G.; Haro, J.M.; Jin, R.; et al. Cross-National Associations Between Gender and Mental Disorders in the World Health Organization World Mental Health Surveys. Arch. Gen. Psychiatry 2009, 66, 785–795. [Google Scholar] [CrossRef]
  3. Marcus, M.; Yasamy, M.T.; Van Van Ommeren, M.; Chisholm, D.; Saxena, S. Depression: A Global Public Health Concern. Social Psychiatry Psychiatr. Epidemiol. 2012, 1, 6–8. [Google Scholar]
  4. Depression. Available online: http://www.who.int/news-room/fact-sheets/detail/depression (accessed on 1 March 2020).
  5. Di Luca, M.; Olesen, J. The Cost of Brain Diseases: A Burden or a Challenge? Neuron 2014, 82, 1205–1208. [Google Scholar] [CrossRef] [Green Version]
  6. Al-Harbi, K.S. Treatment-resistant depression: Therapeutic trends, challenges, and future directions. Patient Prefer. Adherence 2012, 6, 369–388. [Google Scholar] [CrossRef] [Green Version]
  7. Wigner, P.; Czarny, P.; Galecki, P.; Su, K.-P.; Śliwiński, T. The molecular aspects of oxidative & nitrosative stress and the tryptophan catabolites pathway (TRYCATs) as potential causes of depression. Psychiatry Res. 2018, 262, 566–574. [Google Scholar] [CrossRef] [PubMed]
  8. Wigner, P.; Czarny, P.; Galecki, P.; Sliwinski, T. Oxidative and nitrosative stress as well as the tryptophan catabolites pathway in depressive disorders. Psychiatr. Danub. 2017, 29, 394–400. [Google Scholar] [CrossRef] [Green Version]
  9. Dykens, J.A.; Sullivan, S.G.; Stern, A. Oxidative reactivity of the tryptophan metabolites 3-hydroxyanthranilate, cinnabarinate, quinolinate and picolinate. Biochem. Pharmacol. 1987, 36, 211–217. [Google Scholar] [CrossRef]
  10. Ríos, C.; Santamaría, A. Quinolinic acid is a potent lipid peroxidant in rat brain homogenates. Neurochem. Res. 1991, 16, 1139–1143. [Google Scholar] [CrossRef] [PubMed]
  11. Okuda, S.; Nishiyama, N.; Saito, H.; Katsuki, H. 3-Hydroxykynurenine, an Endogenous Oxidative Stress Generator, Causes Neuronal Cell Death with Apoptotic Features and Region Selectivity. J. Neurochem. 2002, 70, 299–307. [Google Scholar] [CrossRef] [PubMed]
  12. Guidetti, P.; Schwarcz, R. 3-Hydroxykynurenine potentiates quinolinate but not NMDA toxicity in the rat striatum. Eur. J. Neurosci. 1999, 11, 3857–3863. [Google Scholar] [CrossRef] [PubMed]
  13. Goldstein, L.E.; Leopold, M.C.; Huang, X.; Atwood, C.S.; Saunders, A.J.; Hartshorn, M.; Lim, J.T.; Faget, K.Y.; Muffat, J.A.; Scarpa, R.C.; et al. 3-Hydroxykynurenine and 3-Hydroxyanthranilic Acid Generate Hydrogen Peroxide and Promote α-Crystallin Cross-Linking by Metal Ion Reduction. Biochemistry 2000, 39, 7266–7275. [Google Scholar] [CrossRef] [PubMed]
  14. Murakami, K.; Haneda, M.; Yoshino, M. Prooxidant action of xanthurenic acid and quinoline compounds: Role of transition metals in the generation of reactive oxygen species and enhanced formation of 8-hydroxy-2′-deoxyguanosine in DNA†. BioMetals 2006, 19, 429–435. [Google Scholar] [CrossRef] [PubMed]
  15. Santamaría, A.; Galván-Arzate, S.; Lisý, V.; Ali, S.F.; Duhart, H.M.; Osorio-Rico, L.; Rıos, C.; Sut’Astný, F. Quinolinic acid induces oxidative stress in rat brain synaptosomes. NeuroReport 2001, 12, 871–874. [Google Scholar] [CrossRef] [PubMed]
  16. Smith, A.J.; Smith, R.A.; Stone, T.W. 5-Hydroxyanthranilic Acid, a Tryptophan Metabolite, Generates Oxidative Stress and Neuronal Death via p38 Activation in Cultured Cerebellar Granule Neurones. Neurotox. Res. 2009, 15, 303–310. [Google Scholar] [CrossRef] [PubMed]
  17. Pandya, C.D.; Howell, K.R.; Pillai, A. Antioxidants as potential therapeutics for neuropsychiatric disorders. Prog. Neuro Psychopharmacol. Biol. Psychiatry 2013, 46, 214–223. [Google Scholar] [CrossRef] [Green Version]
  18. Bilici, M.; Efe, H.; Köroğlu, M.; Uydu, H.A.; Bekaroğlu, M.; Değer, O. Antioxidative enzyme activities and lipid peroxidation in major depression: Alterations by antidepressant treatments. J. Affect. Disord. 2001, 64, 43–51. [Google Scholar] [CrossRef]
  19. Herken, H.; Gurel, A.; Selek, S.; Armutcu, F.; Ozen, M.E.; Bulut, M.; Kap, O.; Yumru, M.; Savas, H.A.; Akyol, O. Adenosine Deaminase, Nitric Oxide, Superoxide Dismutase, and Xanthine Oxidase in Patients with Major Depression: Impact of Antidepressant Treatment. Arch. Med Res. 2007, 38, 247–252. [Google Scholar] [CrossRef]
  20. Galecki, P.; Szemraj, J.; Bienkiewicz, M.; Florkowski, A.; Galecka, E. Lipid peroxidation andantioxidant protection in patients during acute depressive episodes and in remission after fluoxetine treatment. Pharmacol. Rep. 2009, 61, 436–447. [Google Scholar] [CrossRef]
  21. Kodydková, J.; Vávrová, L.; Zeman, M.; Jirák, R.; Macásek, J.; Stanková, B.; Tvrzická, E.; Zák, A. Antioxidative enzymes and increased oxidative stress in depressive women. Clin. Biochem. 2009, 42, 1368–1374. [Google Scholar] [CrossRef]
  22. Kotan, V.O.; Sarandol, E.; Kirhan, E.; Ozkaya, G.; Kirli, S. Effects of long-term antidepressant treatment on oxidative status in major depressive disorder: A 24-week follow-up study. Prog. Neuro Psychopharmacol. Biol. Psychiatry 2011, 35, 1284–1290. [Google Scholar] [CrossRef] [PubMed]
  23. Hastings, R.S.; Parsey, R.V.A.; Oquendo, M.; Arango, V.; Mann, J.J. Volumetric Analysis of the Prefrontal Cortex, Amygdala, and Hippocampus in Major Depression. Neuropsychopharmacology 2003, 29, 952–959. [Google Scholar] [CrossRef] [PubMed]
  24. Jain, S. Faculty Opinions recommendation of Depression-related variation in brain morphology over 3 years: Effects of stress? Fac. Opin. Post Publ. Peer Rev. Biomed. Lit. 2008, 65, 1156–1165. [Google Scholar] [CrossRef]
  25. Campbell, S.; MacQueen, G. The role of the hippocampus in the pathophysiology of major depression. J. Psychiatry Neurosci. 2004, 29, 417–426. [Google Scholar]
  26. Pulschen, D.; Thome, J. The Role of Oxidative Stress in Depressive Disorders. Curr. Pharm. Des. 2012, 18, 5890–5899. [Google Scholar] [CrossRef] [Green Version]
  27. Shalaby, A.; Kamal, S. Effect of Escitalopram on GABA level and anti-oxidant markers in prefrontal cortex and nucleus accumbens of chronic mild stress-exposed albino rats. Int. J. Physiol. Pathophysiol. Pharmacol. 2009, 1, 154–161. [Google Scholar]
  28. Sarandol, A.; Sarandol, E.; Eker, S.S.; Erdinc, S.; Vatansever, E.; Kirli, S. Major depressive disorder is accompanied with oxidative stress: Short-term antidepressant treatment does not alter oxidative–antioxidative systems. Hum. Psychopharmacol. Clin. Exp. 2007, 22, 67–73. [Google Scholar] [CrossRef]
  29. Cimen, A.P.B.; Gumus, C.B.; Cetin, A.P.I.; Ozsoy, A.P.S.; Aydin, M.; Cimen, L. The Effects of Escitalopram Treatment on Oxidative/ Antioxidative Parameters in Patients with Depression. Klinik Psikofarmakol. Bülteni Bull. Clin. Psychopharmacol. 2015, 25, 272–279. [Google Scholar] [CrossRef]
  30. Duda, W.; Curzytek, K.; Kubera, M.; Iciek, M.; Kowalczyk-Pachel, D.; Bilska-Wilkosz, A.; Lorenc-Koci, E.; Leskiewicz, M.; Basta-Kaim, A.; Budziszewska, B.; et al. The Effect of Chronic Mild Stress and Imipramine on the Markers of Oxidative Stress and Antioxidant System in Rat Liver. Neurotox. Res. 2016, 30, 173–184. [Google Scholar] [CrossRef] [Green Version]
  31. Liu, T.; Zhong, S.; Liao, X.; Chen, J.; He, T.; Lai, S.; Jia, Y. A Meta-Analysis of Oxidative Stress Markers in Depression. PLoS ONE 2015, 10, e0138904. [Google Scholar] [CrossRef]
  32. Ahmadimanesh, M.; Abbaszadegan, M.R.; Rad, D.M.; Moallem, S.M.H.; Mohammadpour, A.H.; Ghahremani, M.H.; Hosseini, F.F.; Behdani, F.; Manteghi, A.A.; Jowsey, P.; et al. Effects of selective serotonin reuptake inhibitors on DNA damage in patients with depression. J. Psychopharmacol. 2019, 33, 1364–1376. [Google Scholar] [CrossRef] [PubMed]
  33. Tohid, H.; Aleem, D.; Jackson, C. Major Depression and Psoriasis: A Psychodermatological Phenomenon. Ski. Pharmacol. Physiol. 2016, 29, 220–230. [Google Scholar] [CrossRef] [PubMed]
  34. Gamaro, G.D.; Streck, E.L.; Matté, C.; Prediger, M.E.; Wyse, A.T.S.; Dalmaz, C. Reduction of hippocampal Na+, K+-ATPase activity in rats subjected to an experimental model of depression. Neurochem. Res. 2003, 28, 1339–1344. [Google Scholar] [CrossRef] [PubMed]
  35. Bekris, S.; Antoniou, K.; Daskas, S.; Papadopoulou-Daifoti, Z. Behavioural and neurochemical effects induced by chronic mild stress applied to two different rat strains. Behav. Brain Res. 2005, 161, 45–59. [Google Scholar] [CrossRef]
  36. Papp, M. Models of Affective Illness: Chronic Mild Stress in the Rat. Curr. Protoc. Pharmacol. 2012, 57, 5–9. [Google Scholar] [CrossRef]
  37. Papp, M.; Gruca, P.; Lason-Tyburkiewicz, M.; Litwa, E.; Niemczyk, M.; Tota-Glowczyk, K.; Willner, P. Dopaminergic mechanisms in memory consolidation and antidepressant reversal of a chronic mild stress-induced cognitive impairment‘. Psychopharmacology 2017, 234, 2571–2585. [Google Scholar] [CrossRef] [Green Version]
  38. Papp, M.; Gruca, P.; Lason, M.; Niemczyk, M.; Willner, P. The role of prefrontal cortex dopamine D2 and D3 receptors in the mechanism of action of venlafaxine and deep brain stimulation in animal models of treatment-responsive and treatment-resistant depression. J. Psychopharmacol. 2019, 33, 748–756. [Google Scholar] [CrossRef]
  39. Wang, Q.; Timberlake, M.A., 2nd; Prall, K.; Dwivedi, Y. The recent progress in animal models of depression. Prog. Neuropsychopharmacol. Biol. Psychiatry 2017, 77, 99–109. [Google Scholar] [CrossRef]
  40. Tanke, M.A.C.; Alserda, E.; Doornbos, B.; Van Der Most, P.J.; Goeman, K.; Postema, F.; Korf, J. Low tryptophan diet increases stress-sensitivity, but does not affect habituation in rats. Neurochem. Int. 2008, 52, 272–281. [Google Scholar] [CrossRef]
  41. Jacobsen, J.P.R.; Siesser, W.B.; Sachs, B.D.; Peterson, S.; Cools, M.J.; Setola, V.; Folgering, J.H.A.; Flik, G.; Caron, M.G. Deficient serotonin neurotransmission and depression-like serotonin biomarker alterations in tryptophan hydroxylase 2 (Tph2) loss-of-function mice. Mol. Psychiatry 2011, 17, 694–704. [Google Scholar] [CrossRef] [Green Version]
  42. Wigner, P.; Synowiec, E.; Czarny, P.; Bijak, M.; Jóźwiak, P.; Szemraj, J.; Gruca, P.; Papp, M.; Śliwiński, T. Effects of venlafaxine on the expression level and methylation status of genes involved in oxidative stress in rats exposed to a chronic mild stress. J. Cell. Mol. Med. 2020, 24, 5675–5694. [Google Scholar] [CrossRef] [PubMed] [Green Version]
  43. Wigner, P.; Synowiec, E.; Jóźwiak, P.; Czarny, P.; Bijak, M.; Białek, K.; Szemraj, J.; Gruca, P.; Papp, M.; Śliwiński, T. The Effect of Chronic Mild Stress and Venlafaxine on the Expression and Methylation Levels of Genes Involved in the Tryptophan Catabolites Pathway in the Blood and Brain Structures of Rats. J. Mol. Neurosci. 2020, 70, 1425–1436. [Google Scholar] [CrossRef] [PubMed]
  44. Moylan, S.; Berk, M.; Dean, O.M.; Samuni, Y.; Williams, L.J.; O’Neil, A.; Hayley, A.C.; Pasco, J.A.; Anderson, G.M.; Jacka, F.N.; et al. Oxidative & nitrosative stress in depression: Why so much stress? Neurosci. Biobehav. Rev. 2014, 45, 46–62. [Google Scholar] [CrossRef] [PubMed]
  45. Myint, A.-M. Kynurenines: From the perspective of major psychiatric disorders. FEBS J. 2012, 279, 1375–1385. [Google Scholar] [CrossRef] [PubMed] [Green Version]
  46. Lubos, E.; Loscalzo, J.; Handy, D.E. Glutathione Peroxidase-1 in Health and Disease: From Molecular Mechanisms to Therapeutic Opportunities. Antioxid. Redox Signal. 2011, 15, 1957–1997. [Google Scholar] [CrossRef] [Green Version]
  47. Knowles, R.G.; Moncada, S. Nitric oxide synthases in mammals. Biochem. J. 1994, 298, 249–258. [Google Scholar] [CrossRef]
  48. Lucca, G.; Comim, C.M.; Valvassori, S.S.; Réus, G.Z.; Vuolo, F.; Petronilho, F.; Gavioli, E.C.; Dal-Pizzol, F.; Quevedo, J. Increased oxidative stress in submitochondrial particles into the brain of rats submitted to the chronic mild stress paradigm. J. Psychiatr. Res. 2009, 43, 864–869. [Google Scholar] [CrossRef]
  49. Liu, J.; Wang, X.; Shigenaga, M.K.; Yeo, H.C.; Mori, A.; Ames, B.N. Immobilization stress causes oxidative damage to lipid, protein, and DNA in the brain of rats. FASEB J. 1996, 10, 1532–1538. [Google Scholar] [CrossRef]
  50. Qiu, H.-M.; Yang, J.-X.; Jiang, X.-H.; Hu, X.-Y.; Liu, D.; Zhou, Q.-X. Enhancing tyrosine hydroxylase and tryptophan hydroxylase expression and improving oxidative stress involved in the antidepressant effect of sodium valproate on rats undergoing chronic unpredicted stress. NeuroReport 2015, 26, 1145–1150. [Google Scholar] [CrossRef]
  51. Muller, C.P.; Jacobs, B.L. Handbook of the Behavioral Neurobiology of Serotonin; Academic Press: London, UK, 2010. [Google Scholar]
  52. Nakamura, K.; Hasegawa, H. Developmental role of tryptophan hydroxylase in the nervous system. Mol. Neurobiol. 2007, 35, 45–53. [Google Scholar] [CrossRef]
  53. Cowen, P.J.; Browning, M. What has serotonin to do with depression? World Psychiatry 2015, 14, 158–160. [Google Scholar] [CrossRef] [PubMed] [Green Version]
  54. Phillips, R.S.; Iradukunda, E.C.; Hughes, T.; Bowen, J.P. Modulation of Enzyme Activity in the Kynurenine Pathway by Kynurenine Monooxygenase Inhibition. Front. Mol. Biosci. 2019, 6, 3. [Google Scholar] [CrossRef] [PubMed] [Green Version]
  55. Laumet, G.; Zhou, W.; Dantzer, R.; Edralin, J.D.; Huo, X.; Budac, D.P.; O’Connor, J.C.; Lee, A.W.; Heijnen, C.J.; Kavelaars, A. Upregulation of neuronal kynurenine 3-monooxygenase mediates depression-like behavior in a mouse model of neuropathic pain. Brain Behav. Immun. 2017, 66, 94–102. [Google Scholar] [CrossRef] [PubMed]
  56. Prendergast, G.C.; Emetz, R.; Muller, A.J.; Merlo, L.M.F.; Emandik-Nayak, L. IDO2 in Immunomodulation and Autoimmune Disease. Front. Immunol. 2014, 5, 585. [Google Scholar] [CrossRef] [Green Version]
  57. Kim, H.; Chen, L.; Lim, G.; Sung, B.; Wang, S.; McCabe, M.F.; Rusanescu, G.; Yang, L.; Tian, Y.; Mao, J. Brain indoleamine 2,3-dioxygenase contributes to the comorbidity of pain and depression. J. Clin. Investig. 2012, 122, 2940–2954. [Google Scholar] [CrossRef] [Green Version]
  58. Schmittgen, T.D.; Livak, K.J. Analyzing real-time PCR data by the comparative C(T) method. Nat. Protoc. 2008, 3, 1101–8110. [Google Scholar] [CrossRef] [PubMed]
  59. Wojdacz, T.K.; Borgbo, T.; Hansen, L.L. Primer design versus PCR bias in methylation independent PCR amplifications. Epigenetics 2009, 4, 231–234. [Google Scholar] [CrossRef] [PubMed] [Green Version]
Figure 1. The course of the experiment of chronic mild stress and escitalopram therapy (A). Sucrose intake test in rats exposed to CMS for two weeks (week 2) and in animals exposed to CMS for seven weeks (week 7) and administered vehicle (1 mL/kg) or escitalopram (10 mg/kg) for five weeks (B). The consumption of 1.0% sucrose solution was measured in a 1-h test by weighing pre-weighed bottles. The data represents means ± SEM. n = 6. * p < 0.01 control group relative to the stressed group; # p < 0.05 stressed group relative to the stressed/esc group.
Ijms 22 00010 g001
Figure 2. (I) mRNA expression of Cat (A), Gpx1 (B), Gpx4 (C), Nos2 (D) Kmo (E), Kynu (F) in PBMCs and (II) mRNA expression of CAT (A), Gpx1 (B), Gpx4 (C), Nos1 (D), Tph1 (E), Tph2 (F), Kmo (G), Kynu (H) in the brain structures (hippocampus, amygdala, cerebral cortex) of animals exposed to CMS for two weeks (control, stressed) and in animals exposed to CMS for seven weeks and administered vehicle (1 mL/kg) or escitalopram (10 mg/kg) for five weeks (control/esc, stressed/saline, stressed/esc). Relative gene expression levels were estimated using a 2−ΔCt (Ctgene–Ct18S) method. Data represent means ± SEM. n = 6. * p < 0.05, *** p < 0.001 stressed group relative to stressed/esc group; # p < 0.05 stressed group relative to control group; & p < 0.05, &&& p < 0.001 stressed/esc group relative to stressed/saline group.
Ijms 22 00010 g002
Figure 3. Methylation status of Cat promoter region (I) in the hippocampus (A), amygdala (B) and cerebral cortex (C) Ido1 and Kmo promoter regions (II) in the hippocampus (A,D), amygdala (B,E) and cerebral cortex (C,F) of animals exposed to CMS for two weeks (control, stressed) and in animals exposed to CMS for seven weeks and administered vehicle (1 mL/kg) or escitalopram (10 mg/kg) for five weeks (control/esc, stressed/saline, stressed/esc). Data represents median and maxiumum-minimum values. n = 6. * p < 0.05, *** p < 0.001 stressed/esc group relative to stressed group; & p < 0.05, &&& p < 0.001 stressed/esc group relative to stressed/saline group.
Ijms 22 00010 g003
Figure 4. Protein expression of Gpx4 in brain structures of animals exposed to CMS for two weeks (control, stressed) and in animals exposed to CMS for seven weeks and administered vehicle (1 mL/kg) or escitalopram (10 mg/kg) for five weeks (control/esc, stressed/saline, stressed/esc). (A) Representative western blot analysis in midbrain and cerebral cortex. C–controls, S–stressed for two weeks, C/E–control/escitalopram, S/S–stressed/saline, S/E–stressed/escitalopram. (B) Levels of Gpx4 proteins measured in hippocampus, amygdala and cerebral cortex. Samples containing 25 μg of proteins were resolved by SDS-PAGE. The intensity of bands corresponding to Gpx4 was analysed by densitometry. Integrated optical density (IOD) was normalized by protein content and a reference sample (see the Methods Section for details). The graphs show the mean IODs of the bands from all analysed samples. The IODgene/IODACTB method was used to estimate the relative protein expression levels in the analysed samples. Data represent means ± SEM. n = 6. & p < 0.05 for the difference between stressed/saline and stressed/escitalopram groups.
Ijms 22 00010 g004
Table 1. Characteristic of all studied genes in the presented paper.
Oxidative and Nitrosative Stresses
GeneEnzymeGene LocationFunction of the EnzymeTissue mRNA Expression
Gpx1Glutathione peroxidase 18q32Enzyme catalyses the reduction of organic hydroperoxides and hydrogen peroxide by glutathione, and thereby protect cells against oxidative damage.Detected in all tissue
Gpx4Glutathione peroxidase 47q11Enzyme which catalyses the reduction of hydrogen peroxide, organic hydroperoxides and lipid hydroperoxides, and thereby protect cells against oxidative damage. Essential antioxidant peroxidase that directly reduces phospholipid hydroperoxide even if they are incorporated in membranes and lipoproteins (By similarity). Can also reduce fatty acid hydroperoxide, cholesterol hydroperoxide and thymine hydroperoxide.Detected in all tissue
CatCatalase3q32The key antioxidant enzyme in the bodies defence against oxidative stress. Catalase is a heme enzyme that is present in the peroxisome of nearly all aerobic cells. Catalase converts the reactive oxygen species hydrogen peroxide to water and oxygen and thereby mitigates the toxic effects of hydrogen peroxide.Detected in all tissue, however tissue enhanced–blood and liver
Nos1Nitric oxide synthetase 112q16Enzyme, which synthesize nitric oxide from L-arginine.Brain, skeletal muscle
Nos2Nitric oxide synthetase 210q25Enzyme, which synthesize nitric oxide from L-arginine.Detected in many tissue, however tissue enhanced–intestine, lymphoid tissue
Tryptophan catabolites pathway
GeneEnzymeGene locationFunction of the enzymeTissue mRNA expression
Tph1Tryptophan hydroxylase 11q22The enzyme catalyses the first and rate limiting step in the biosynthesis of serotonin, an important hormone and neurotransmitter.Brain, intestine, pituitary gland, stomach
Tph2Tryptophan hydroxylase 27q22The encoded protein catalyses the first and rate limiting step in the biosynthesis of serotonin, an important hormone and neurotransmitter.Brain
Ido1Indolamine 2,3-dioxygenasse16q12.5Ido1 is heme enzyme that catalyses the first and rate-limiting step in tryptophan catabolism to N-formyl-kynurenine. This enzyme acts on multiple tryptophan substrates including D-tryptophan, L-tryptophan, 5-hydroxy-tryptophan, tryptamine, and serotonin.Blood, placenta
KmoKynurenine 3-monooxygenase13q25The enzyme catalyses the hydroxylation of L-kynurenine to form 3-hydroxy-L-kynurenine. It is Required for synthesis of quinolinic acid, a neurotoxic NMDA receptor antagonist and potential endogenous inhibitor of NMDA receptor signalling.Blood, liver, placenta
KynuKynureninase3q12It is enzyme that catalyses the cleavage of L-kynurenine and L-3-hydroxykynurenine into anthranilic and 3-hydroxyanthranilic acids, respectively. Kynureninase is involved in the biosynthesis of NAD cofactors from tryptophan through the kynurenine pathwayDetected in all tissue, however tissue enhanced–blood, liver, placenta
Table 2. Characteristic of primer and conditions of the MS-HRM protocol.
Oxidative and Nitrosative Stresses
GeneStarter Sequence (5′->3′)Product Size [bp]The Condition of the Reaction
The Initial Activation of the PolymeraseDenaturationAnnealingElongationThe HRM Analysis
Temperature [°C]Time [min]Temperature [°C]Time [s]Temperature [°C]Time [s]Temperature [°C]Time [s]
CatF: TTTGAGATTATTGTGTTTGAAA
R: TACCTACACCCAAAAAAAAATA
1489512951559207220Denaturation at 95 °C for 15 s, reannealing at 60 °C for 1 min and melting from 60 to 95 °C at a ramp rate of 0.2 °C
Gpx1F: GTTGTTTTAGGTTTTGTTGTTG
R: AAAACTAAAATCCTCCAACTCT
10265
Gpx4 (promotor 2)F: AGGTTGGAGGTTTAGAGGTTTA
R: TCCCCTAAATACAAAAATCTCT
11859
Gpx4 (promotor 3)F: AGGTTGGAGGTTTAGAGGTTTA
R: AAAACATAACAAAATCATCTCCC
14765
Nos1 (promotor 5)F: GGGTTTTTAATTTTTTTATTGTG
R: CAACCCTCATTAAAAAAACC
12459
Nos1 (promotor 7)F: GTTTGAGATTGGAATTTTTTGG
R: CCAAAACATCCAAAAATACACA
12459
Tryptophan catabolites pathway
GeneStarter sequence (5′->3′)Product size [bp]The condition of the reaction
The initial activation of the polymeraseDenaturationAnnealingElongationThe HRM analysis
Temperature [°C]Time [min]Temperature [°C]Time [s]Temperature [°C]Time [s]Temperature [°C]Time [s]
Tph1F: GGGAGTTTTGTTTTGGTTTTTA
R: TCCTCAACCACAAAAAATCTAA
1329512951555207220Denaturation at 95 °C for 15 s, reannealing at 60 °C for 1 min and melting from 60 to 95 °C at a ramp rate of 0.2 °C
Ido1F: TTTGAGTTTTAGTGATTTTGGG
R: TTAATATCTAATCCCAATCTCTAAAAC
10059
Tdo2 (promoter 1)F: GATGATTTAGGTGGTTTGAGGT
R: CAAAAAAAACAAAATTCATCCA
12359
Tdo2 (promoter 2)F: ATGATTTAGGTGGTTTGAGGTT
R: ACCCAATCTACCTAACTAACAAC
18761.4
KmoF: TTGGTTTAGGGAAGGAAATR: ATAAAAAACTAAACCCAAAACAC15055.7
Table 3. Characteristics of antibody used in Western Blot.
Oxidative Stress
ProteinPrimary AntibodySecondary Antibody
ProducentThe Origin of AntibodiesDilutionCondition of Incubation [h]ProducentThe Origin of AntibodiesDilutionCondition of Incubation [h]
β-actin
(a reference protein)
Santa Cruz Biotechnology Inc, Dallas, Texas, USAMouse1:10001 h at room temperatureCell Signalling Technologies Inc., Danvers, Massachusetts, USAAnti-mouse1:60001 h at room temperature
catalaseSanta Cruz Biotechnology Inc, Dallas, Texas, USAMouse1:1000overnight at 4 °CCell Signalling Technologies Inc., Danvers, Massachusetts, USAAnti-mouse1:60001 h at room temperature
glutathione peroxidase 4Abcam, Cambridge, United Kingdom,Rabbit1:6000overnight at 4 °CCell Signalling Technologies Inc., Danvers, Massachusetts, USAAnti-rabbit1:60001 h at room temperature
superoxide dismutase 1Santa Cruz Biotechnology Inc, Dallas, Texas, USAMouse1:60002 h at room temperatureCell Signalling Technologies Inc., Danvers, Massachusetts, USAAnti-mouse1:60001 h at room temperature
Tryptophan catabolites pathway
ProteinPrimary antibodySecondary antibody
ProducentThe origin of antibodiesDilutionCondition of incubation [h]ProducentThe origin of antibodiesDilutionCondition of incubation [h]
Tryptophan hydroxylase 1Cell Signalling Technologies Inc., Danvers, Massachusetts, USARabbit1:1000overnight at 4 °CCell Signalling Technologies Inc., Danvers, Massachusetts, USAAnti-rabbit1:60001 h at room temperature
Tryptophan hydroxylase 2Cell Signalling Technologies Inc., Danvers, Massachusetts, USARabbit1:6000overnight at 4 °CCell Signalling Technologies Inc., Danvers, Massachusetts, USAAnti-rabbit1:60001 h at room temperature
Indoleamine 2,3-dioxygenaseSanta Cruz Biotechnology Inc, Dallas, Texas, USAMouse1:1000overnight at 4 °CCell Signalling Technologies Inc., Danvers, Massachusetts, USAAnti-rabbit1:60001 h at room temperature
Kynurenine aminotransferasesSanta Cruz Biotechnology Inc, Dallas, Texas, USAMouse1:1000overnight at 4 °CCell Signalling Technologies Inc., Danvers, Massachusetts, USAAnti-rabbit1:60001 h at room temperature
KynureninaseSanta Cruz Biotechnology Inc, Dallas, Texas, USAMouse1:1000overnight at 4 °CCell Signalling Technologies Inc., Danvers, Massachusetts, USAAnti-rabbit1:60001 h at room temperature
Publisher’s Note: MDPI stays neutral with regard to jurisdictional claims in published maps and institutional affiliations.

