Article

Predictive Potential of Circulating Ube2h mRNA as an E2 Ubiquitin-Conjugating Enzyme for Diagnosis or Treatment of Alzheimer’s Disease

Neurodegenerative Diseases Research Group, Korea Brain Research Institute, Daegu 41062, Korea
*
Author to whom correspondence should be addressed.
Int. J. Mol. Sci. 2020, 21(9), 3398; https://doi.org/10.3390/ijms21093398
Submission received: 9 April 2020 / Revised: 5 May 2020 / Accepted: 7 May 2020 / Published: 11 May 2020
(This article belongs to the Special Issue Proteolytic Control of Deubiquitinating Enzymes in Health and Disease)

Abstract

:
Neurodegenerative disorders are caused by neuronal cell death, miscommunications between synapse, and abnormal accumulations of proteins in the brain. Alzheimer’s disease (AD) is one of the age-related disorders, which are the most common degenerative disorders today, and strongly affects memory consolidation and cognitive function in the brain. Amyloid-β and tau proteins are triggers for AD pathogenesis, and usually used as AD candidate biomarkers in the clinical research. Especially, clinical exam, brain imaging and molecular biological methods are being used to diagnosis for AD. Genome-wide association study (GWAS) is a new biomedical method, and its use contributes to understanding many human diseases, including brain diseases. Here, we identified ubiquitin conjugating enzyme E2 (Ube2) gene expression in neurons through GWAS. The subfamilies of Ube2’s genetic expression and inborn errors affect the ubiquitin proteasome system (UPS), leading to protein degradation in the brain. We found that only Ube2h mRNA transcription was significantly increased in the blood from AD, however we did not find any change of Ube2 subfamily genes’ expression in the blood and brain tissue. These data may provide information for diagnosis or clinical approach, and suggest that cell-free circulating Ube2h mRNA is a novel potential biomarker for AD.

1. Introduction

Alzheimer’s disease (AD) is a genetically inherited disease, and is also caused by multifactorial factors, which has become a very well-appreciated neurodegenerative disorder model, recently [1]. Clinically, hallmarks of AD are mutations of the early-onset of amyloid precursors, Presenilin-1 (PS1) and Presenilin-2 (PS2), as integral membrane proteins [2]. However, various mutations of late-onset hallmarks, which have no inheritance of AD, are also reported in many clinical cases [1]. Although identification of apolipoprotein E (APOE) was added as a new major component of AD, and is increased in AD, specific populations, such as in Africa, have no mutation of APOE genes [3]. This surprising genetical finding can be explained by the high-throughput genomic approach, known as Genome-wide association study (GWAS). Because retinal and intestinal systems can also share various genes between AD and Parkinson’s disease (PD), identification of new specific players which have intracellular toxicity and quantification through GWAS may be a very useful system for the application of the clinical diagnosis of AD [4,5]. Given that AD and PD as neurodegenerative disorders have much cross-talk in the gene expression network, the finding of a new specific maker will suggest the way for diagnosis or treatment of AD. Despite the substantial progress with GWAS, which has revealed the mutation or expression of target genes in various diseases including AD, there remains considerable questions as to whether the genetic code can affect the level of translated protein, and these advances would be approachable in the clinical trial [6].
Most proteins undergo posttranslational modifications (PTMs) to regulate maintaining of homeostasis [7]. Ubiquitination is a PTM that enables attachment of the ubiquitin to target proteins through E1 (activating), E2 (conjugating), and E3 (ligating) enzyme cascade [7]. Ubiquitination is initiated by activation of ubiquitin through E1s, in an ATP-dependent reaction, and transferred to E2s. Finally, E2s and E3s make a specific complex with its targeted substrates, and carboxyl terminus of ubiquitin is conjugated to the ε-amino group of lysine residues on the target protein [7]. This reaction also serves to assemble the ubiquitin chains through seven lysine residues, such as K6, K11, K27, K29, K33, K48, and K63, on ubiquitin [7]. Early biochemical studies have shown that K11 and K48 ubiquitin chains lead to 26S proteasomal degradation, and K63 is associated with various intracellular functions, such as autophagy, DNA repairand controlling of cell cycle [8]. In addition, structural studies revealed that ubiquitin chains make many types of branched form on target proteins, and suggested that they may have a central role in ubiquitin-dependent pathways [9].
Since less than 40 E2s are encoded in mammals, it has been regarded that the E2s are orchestrated with E3s through making a ubiquitin transferring complex [10]. Ubiquitin-conjugation (UBC) domain was found in all E2s, and this domain is required for its own activation and binding of E3s [11]. Structural analysis suggests that extension of the amino- or carboxyl-terminus on each E2s showed distinct functions in their enzymatic activity [11]. Ube2h is identified in yeast (named as Ubc8) and human placenta, and belongs to the family of E2s which are structurally and functionally conserved [12,13,14]. In humans, expression of UBE2H is found in skeletal and cardiac muscles, and controlled by tumor necrosis factor-alpha/nuclear factor kappa B (TNF-α/NF-κB) as a cytokine signaling [15]. Furthermore, mutations of Ube2h were found in the patients who have amyotrophic lateral sclerosis (ALS), a motor neuron disease in old ages [16,17]. This clinical data indicated that Ube2h may be associated with neurodegenerative disorders [16,17]. Moreover, recent genetic studies reported that Ube2h is a meaningful gene in brain development and human brain diseases, such as autistic disorder [16,18]. These results indicated that Ube2h is highly polymorphic, and mutations affect neurodegenerative disorder. This phenotype is shaped by genotype–phenotype relationships.
Blood contains various type of RNAs, such as messenger RNA (mRNA), micro RNA (miRNA) and other non-coding RNA (ncRNA). Theses circulating RNAs play a crucial role in disease and are important potential biomarkers [19,20]. We here identified Ube2h mRNA, which is an AD specific cell-free circulating mRNA using high-throughput total RNA-sequencing (RNA-seq) from blood. Moreover, we present a quantitative analysis of E2 enzyme expression, that reveals Ube2h-dependent regulation in AD model. We validate the protein level in tissues and cells on functional levels, to explain the molecular linkage of transcription to translation consequences on Ube2h, and suggest the possibility of circulating Ube2h mRNA as a target of AD for clinical diagnosis and treatment.

2. Results

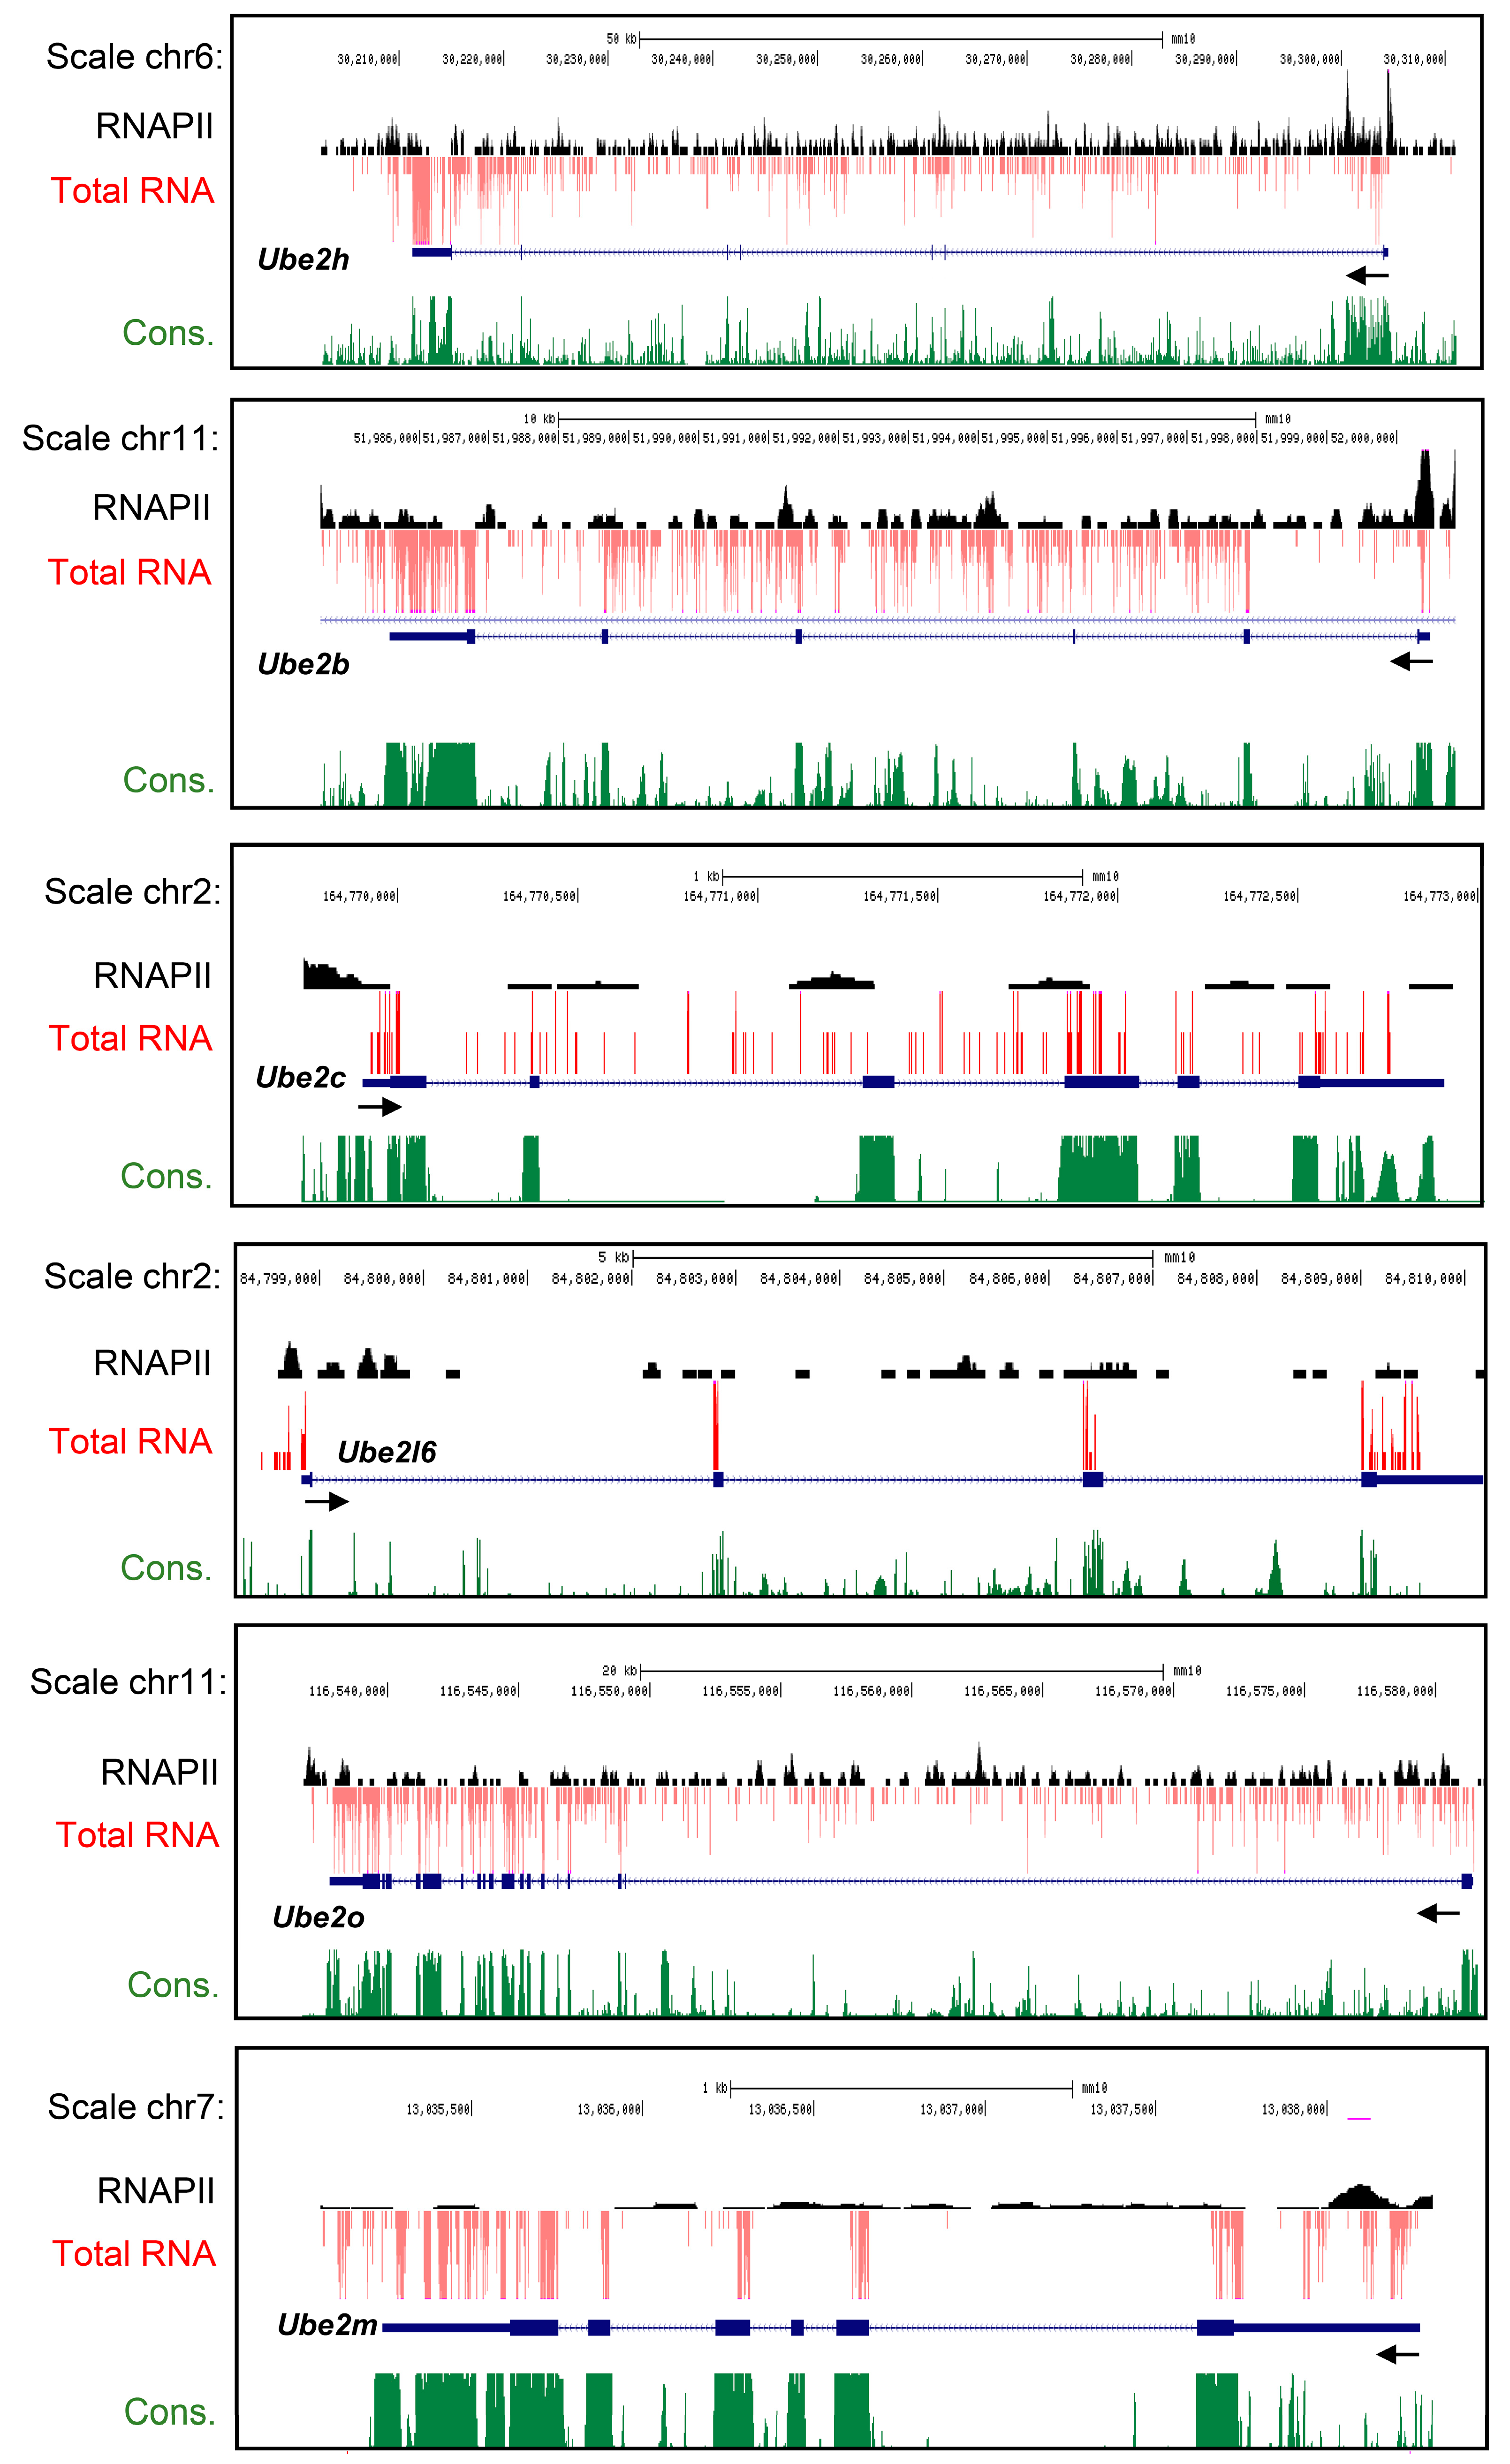
2.1. Characterization of Ube2 Subfamily Genes Expression in the Primary Cortical Neurons from RNA-Seq Data Base

We first applied the mRNA expression and fragments per kilobase of transcript per million (FPKM) value, and then mapped each gene distribution in the neurons. To confirm whether Ube2 subfamilies were well expressed in the neurons, we reanalyzed the published total RNA-seq data. Ube2 subfamilies’ gene expression profiles were adapted from the data generated by Kim et al. (2010) [21]. In silico mining of total RNA-seq analysis revealed that the Ube2h, Ube2l6, Ube2b, Ube2c, Ube2o and Ube2m genes were highly expressed in the primary cortical neurons (Figure 1 A–F). Taken together, these results suggest that at least six Ube2 subfamily gene expressions were well conserved in the cortical neurons.

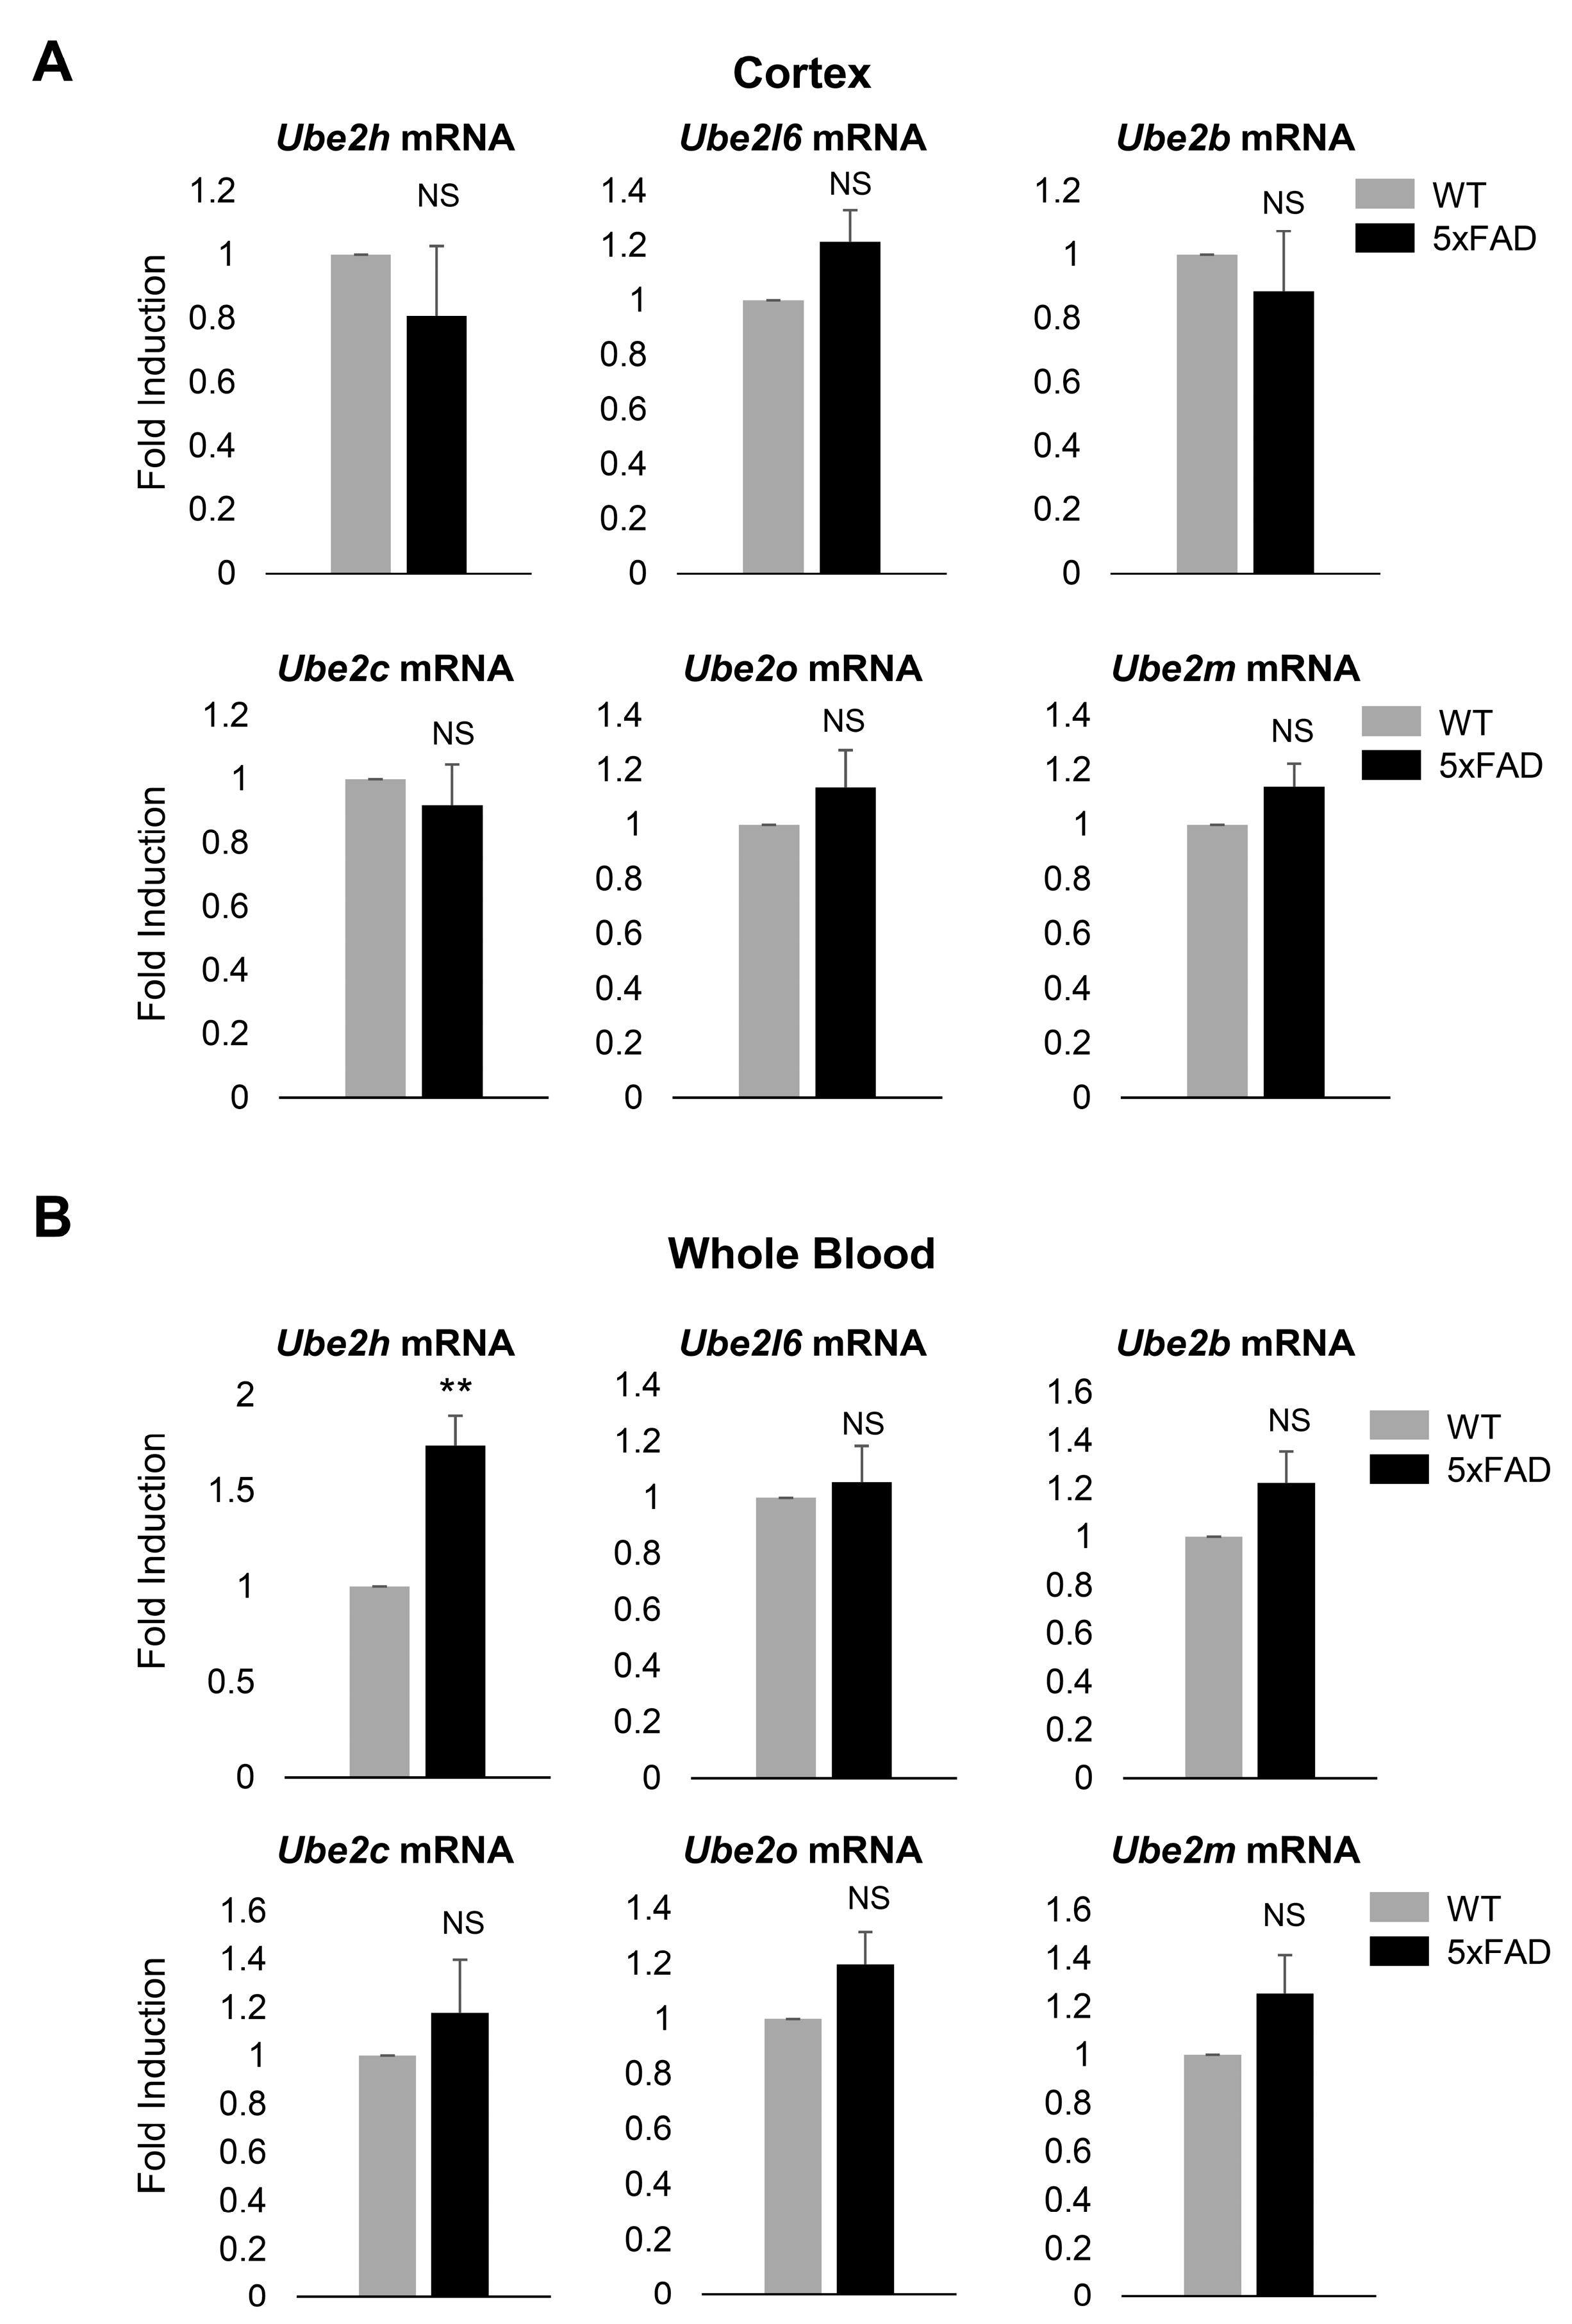
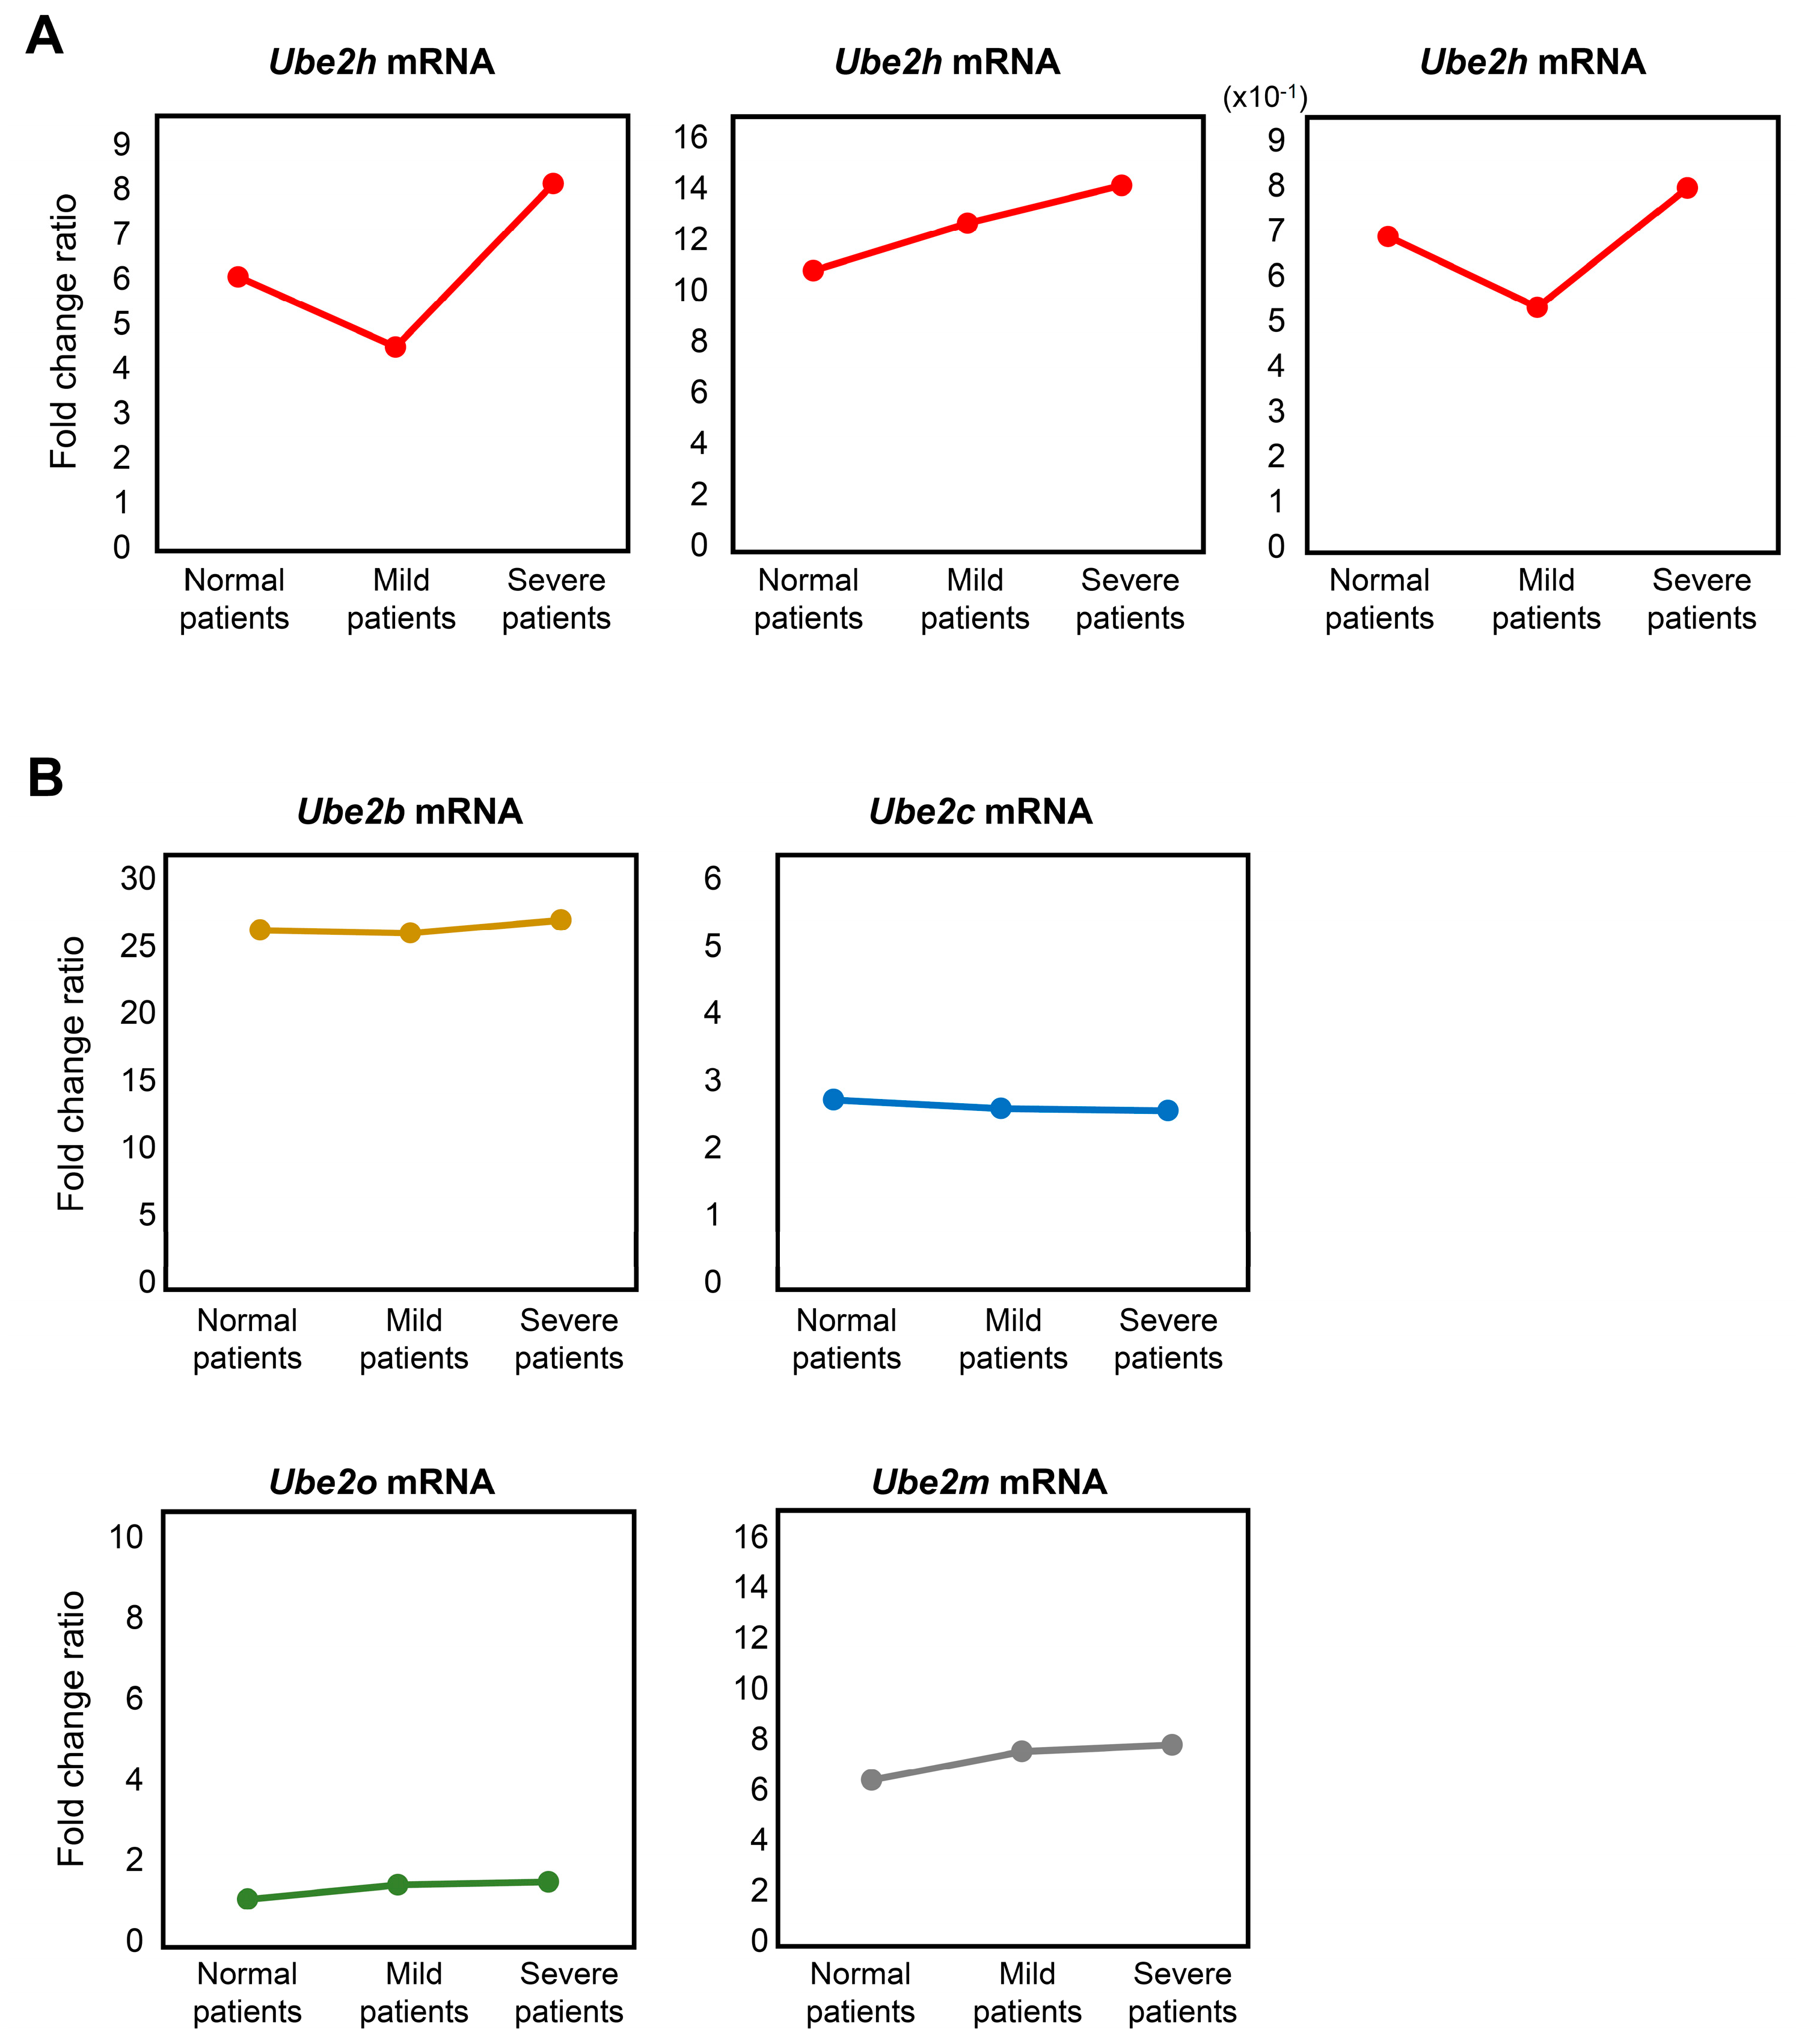
2.2. Ube2h mRNA is Abundantly Expressed in the Blood from AD

Recent studies have suggested that the ubiquitin-proteasome system (UPS) was dysfunctional in brain diseases such as schizophrenia [22]. Ube2k enzyme and mRNA transcription levels are increased in blood and brain tissue from post-mortem schizophrenia patients. Six Ube2 subfamily genes expression were confirmed by total RNA-seq data from cortical neurons. To determine whether the expression of Ube2 subfamily genes was AD specific, we performed quantitative reverse transcription PCR (RT-qPCR) from whole cortex and blood. We designed six different primers to amplify the specific region of each Ube2 subfamily genes. The expression levels of the Ube2l6, Ube2b, Ube2c, Ube2o and Ube2m mRNA did not show significant changes in both wild type (WT) and 5xFAD in the cortex and whole blood (Figure 2A). In the contrast to Ube2l6, Ube2b, Ube2c, Ube2o and Ube2m mRNA, Ube2h mRNA expression levels were only elevated in 5xFAD in whole blood. However, there was no significant change of the Ube2h mRNA expression level in the cortex (Figure 2B). Taken together, these results suggest that the Ube2h mRNA was highly expressed in blood at 5xFAD.

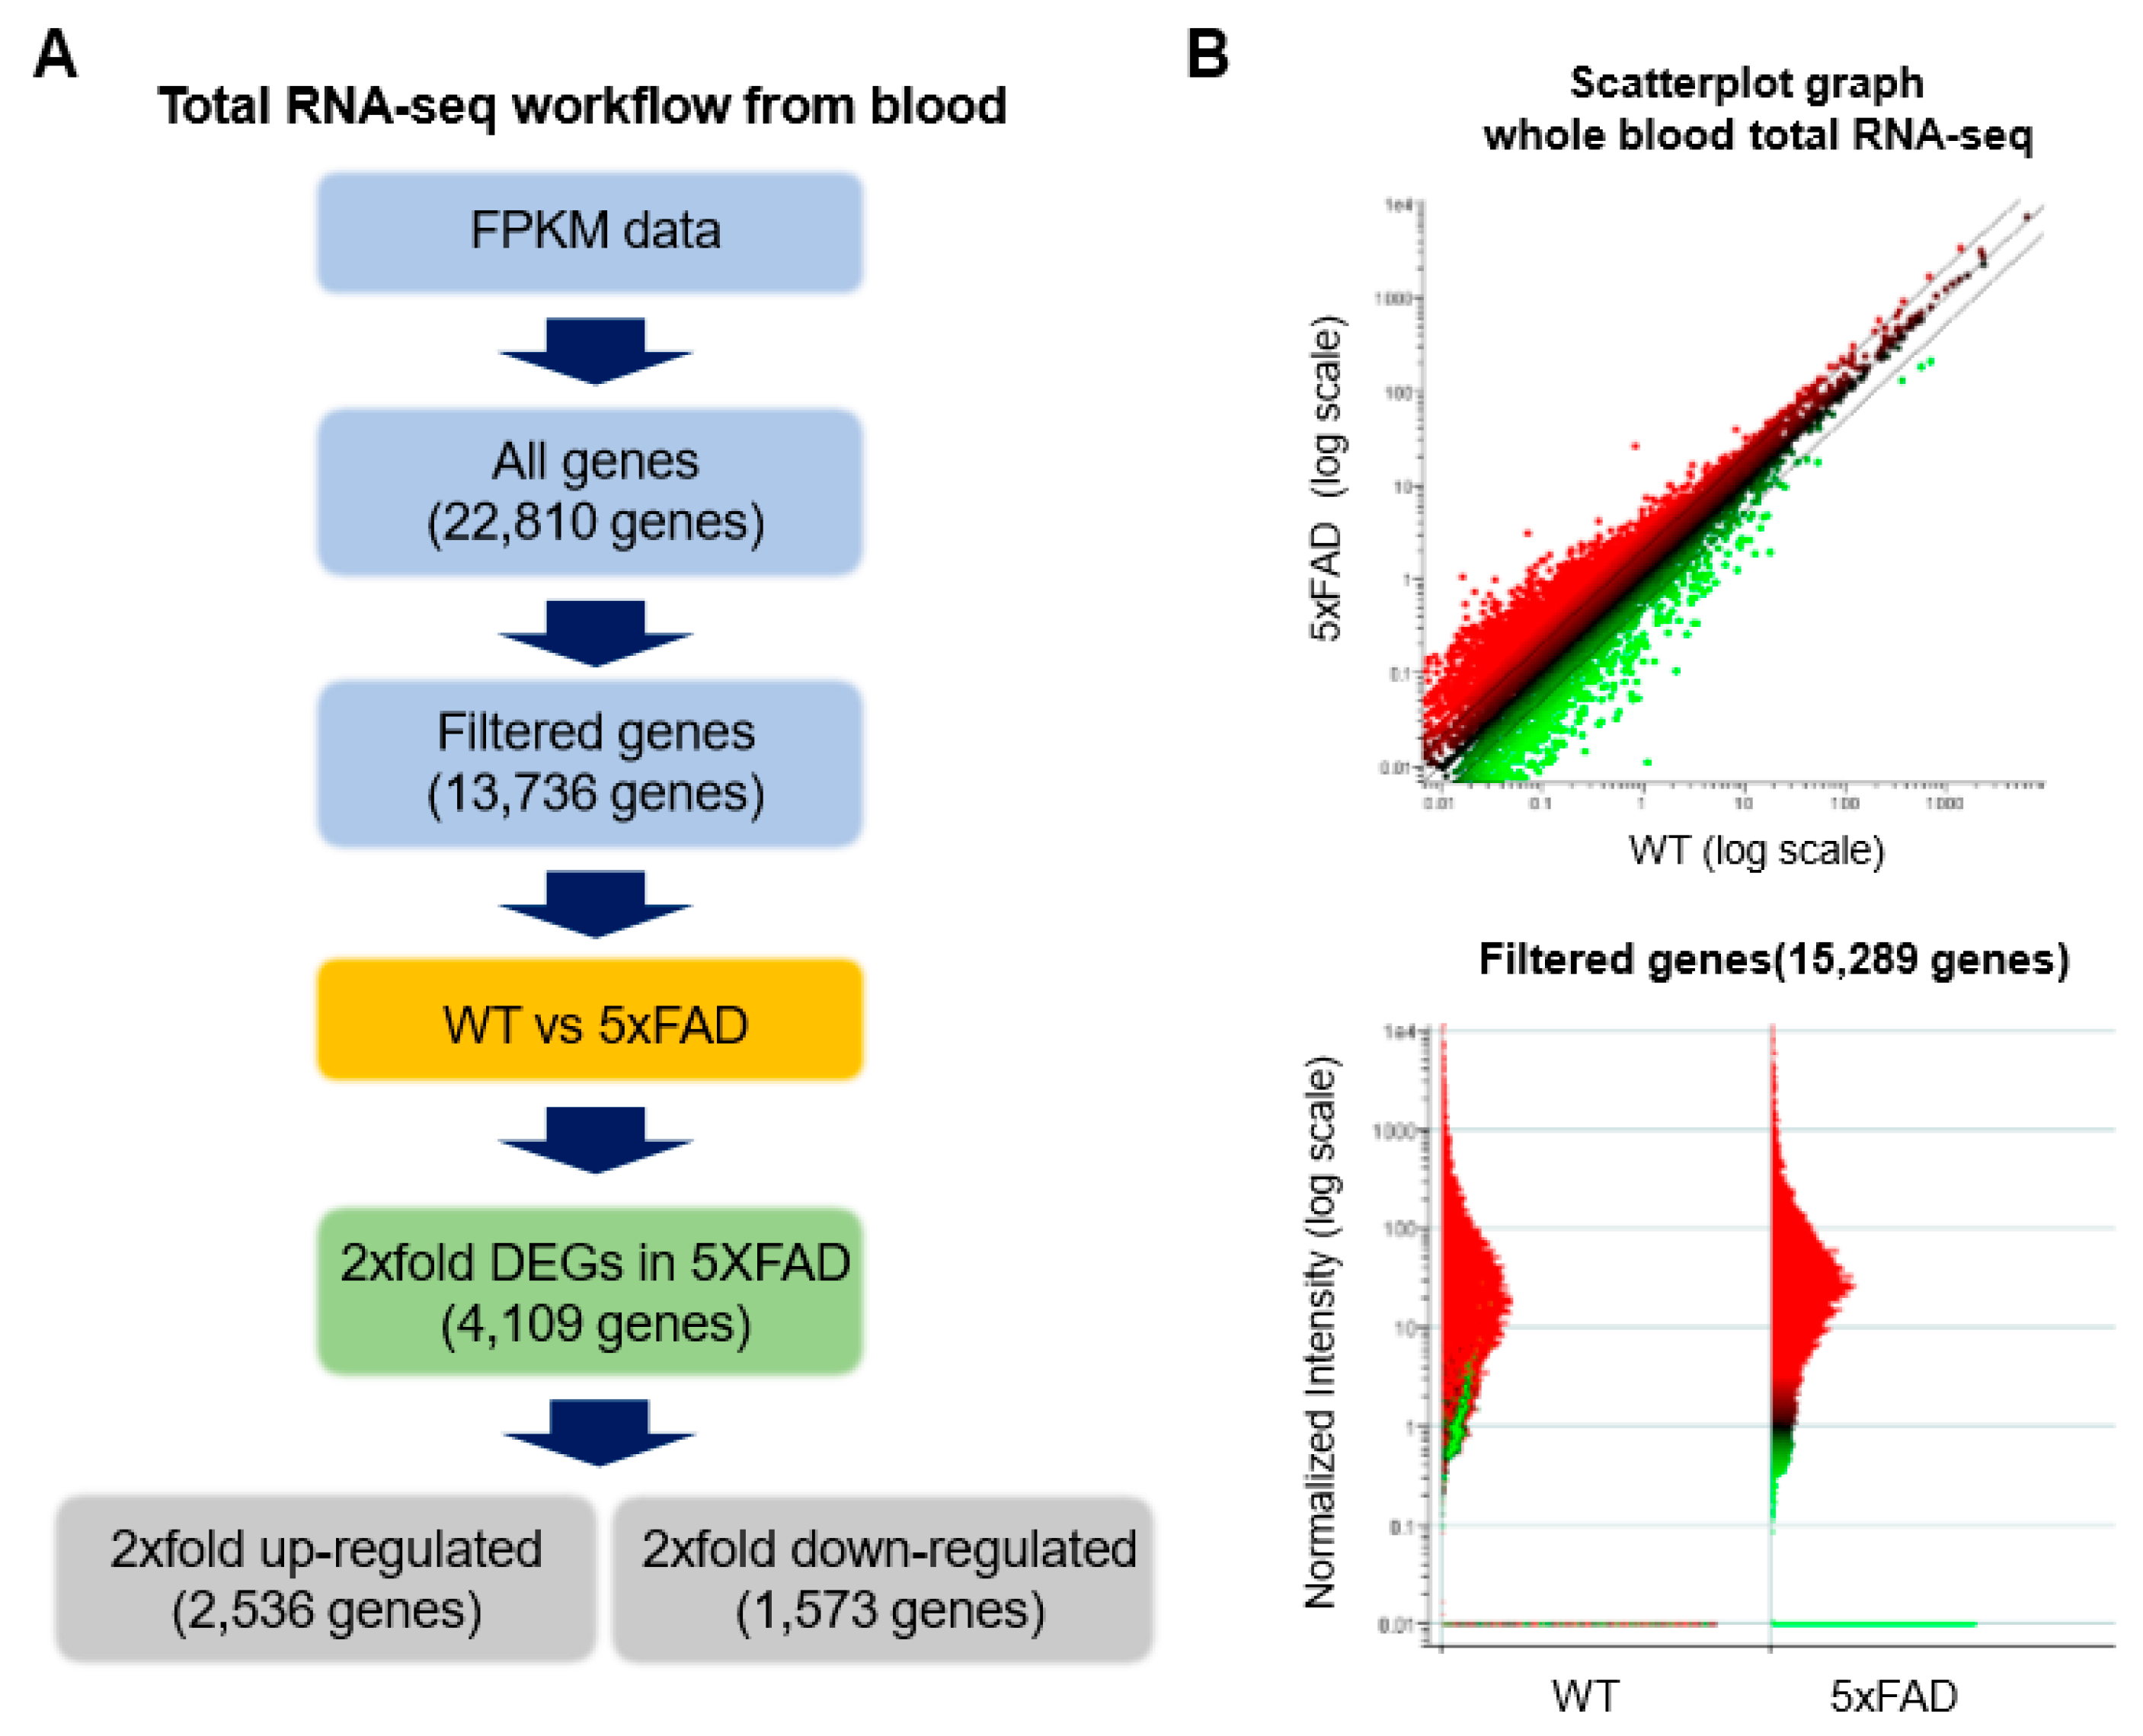
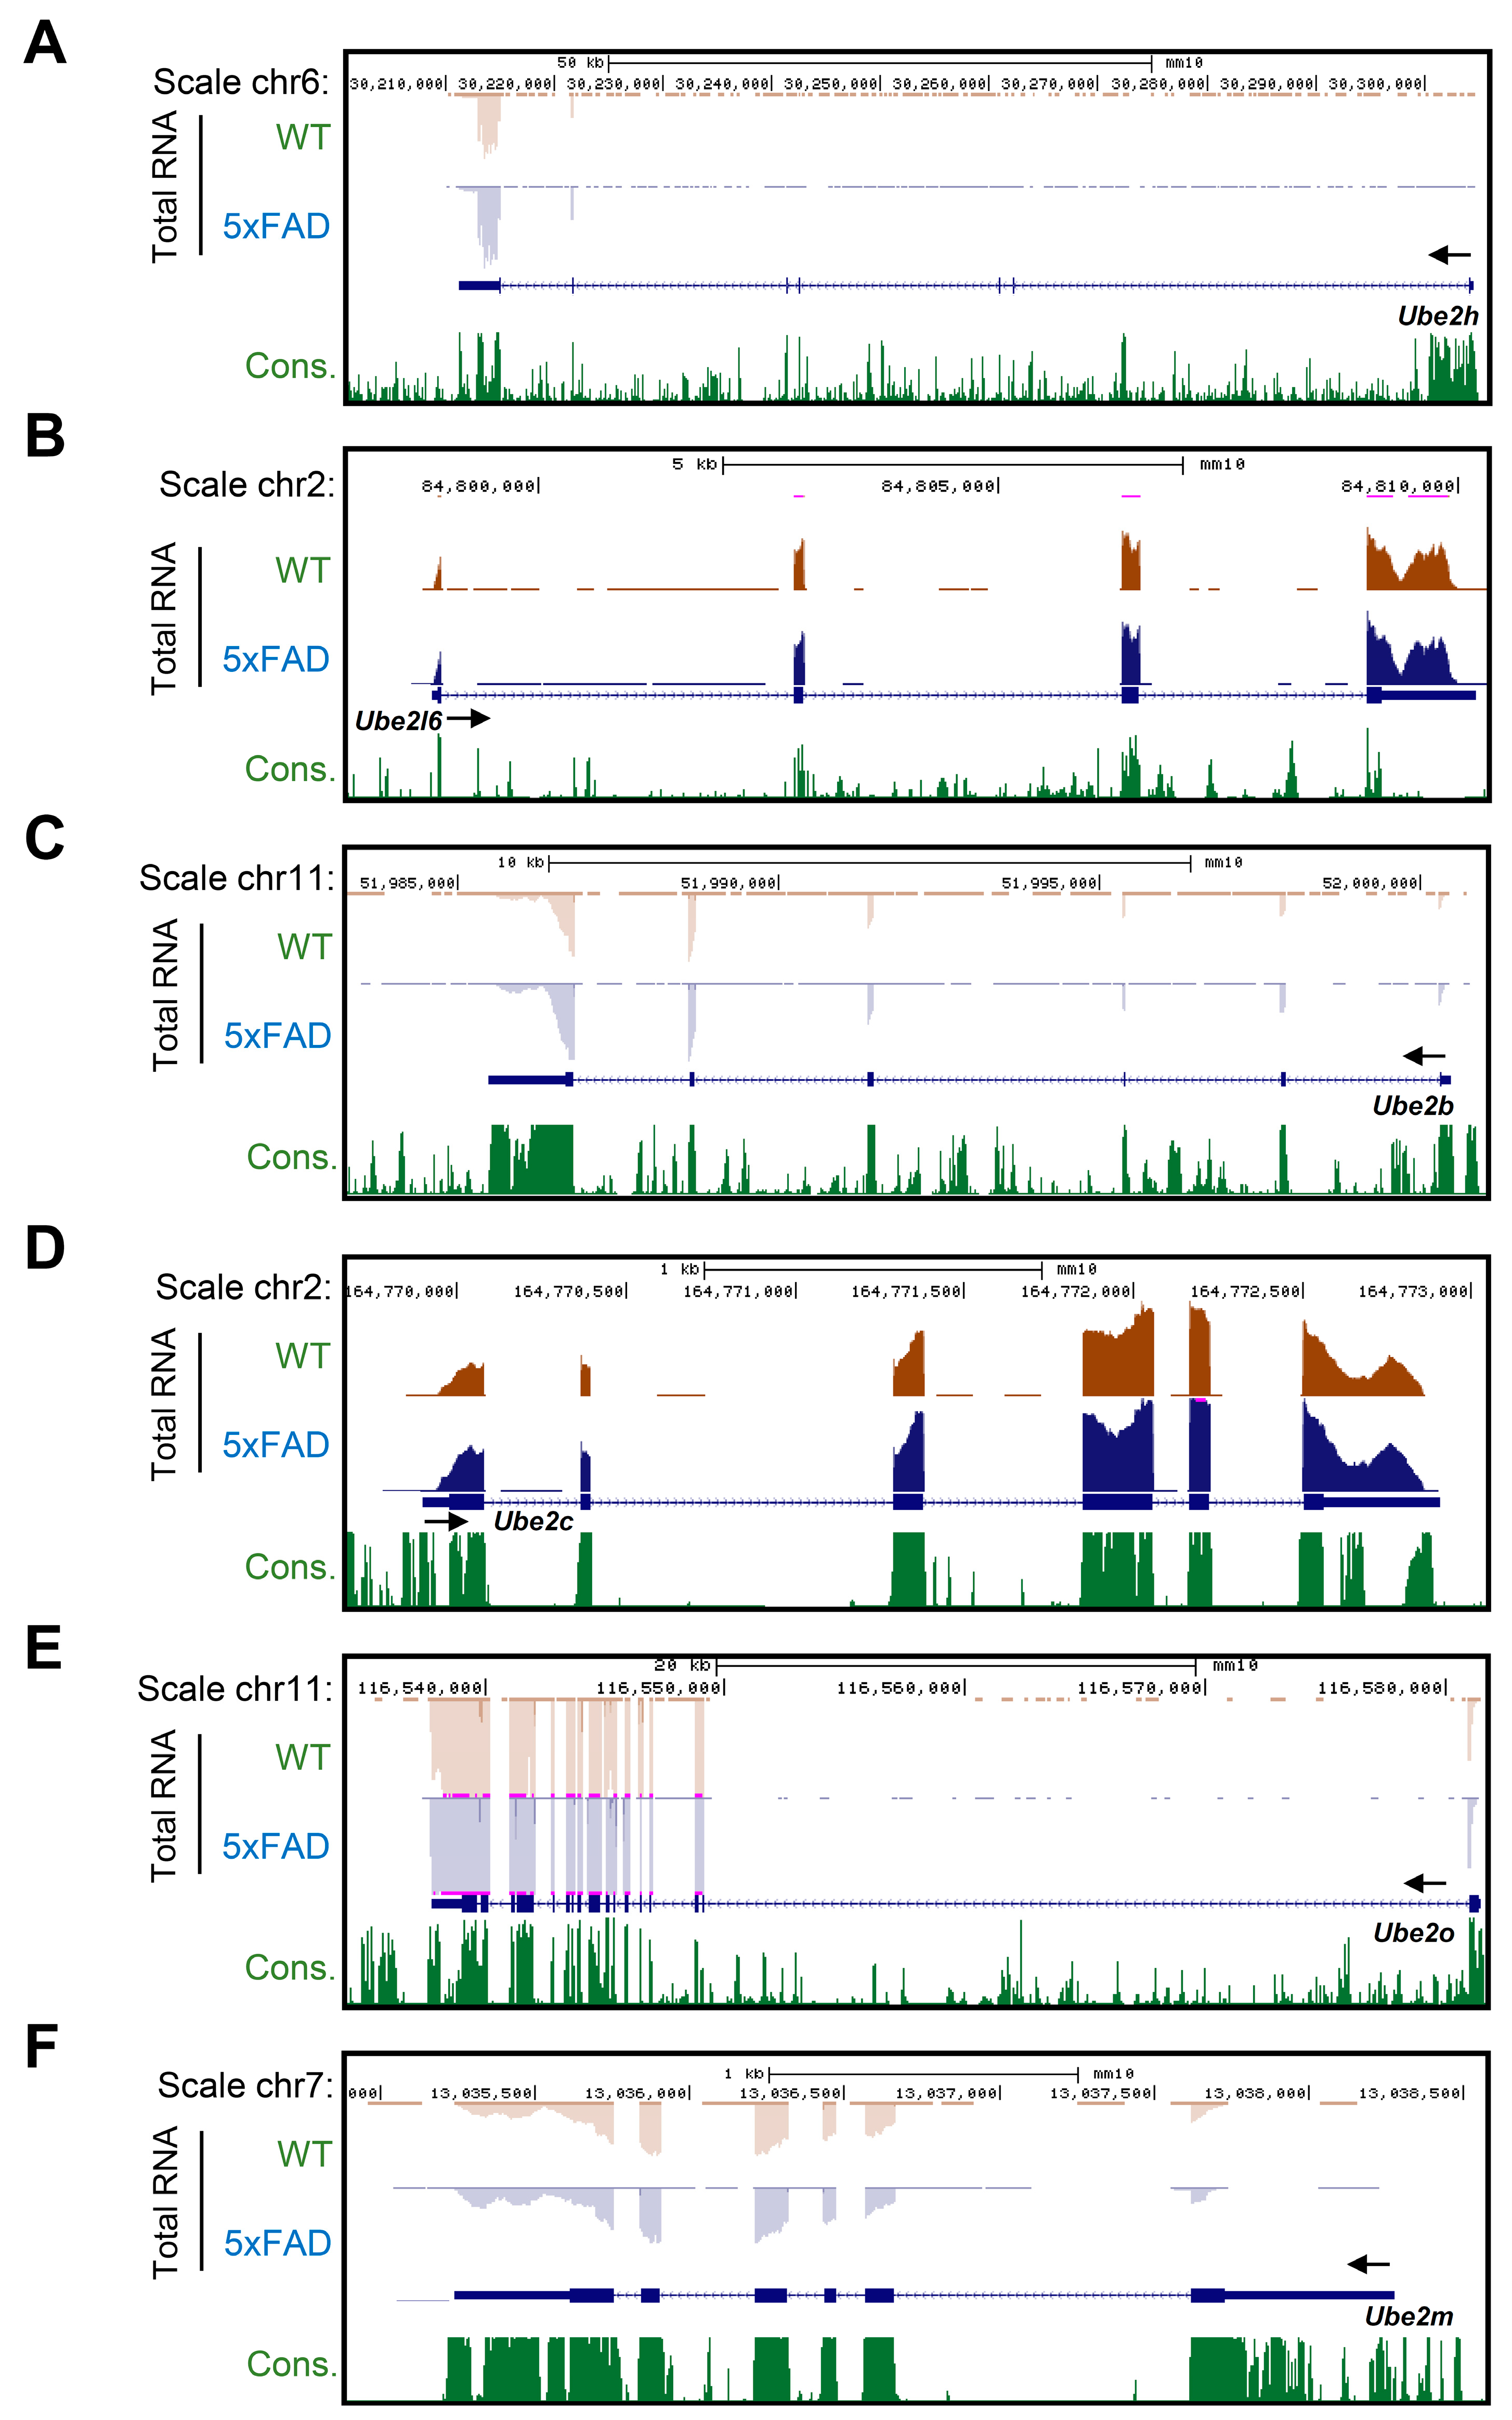
2.3. Accurate Prediction of Gene Expression Change through Total RNA-Seq for AD from Whole Blood

RNA-seq is an approach to gene expression profiling that uses high-throughput sequencing technology, developed around the last decade. The aim of total RNA-seq is to quantify the changing gene expression levels of each gene’s transcription in the cell, tissue or blood, and so on. Annotate gene expression profiling method is based on Agilent GeneSpring analysis, and the image was generated by FASTQ illumine package bcl2faseq. Each gene’s FPKM value was calculated through Cufflinks package, and we then collected 22,810 genes from whole blood. For further validation, we sorted 4109 genes, which were two-fold change DEG (differentially expressed genes), between WT and 5xFAD. To identify AD-dependent specific gene expression, we subsequently performed the Gene Ontology (GO) functional classification protocol. 2536 and 1573 genes were up- or down-regulated in whole blood (Supplementary Tables S1 and S2). We therefore considered that around 4109 genes were dynamically expressed in the whole blood, and these genes might play an important role for AD pathology (Figure 3A,B; Supplementary Figure S1). We next explored whether Ube2 subfamily genes are AD-specifically expressed in cortex and whole blood. First, we monitored the mRNA level of the Ube2 subfamily genes Ube2h, Ube2l6, Ube2b, Ube2c, Ube2o and Ube2m by RT-qPCR (Figure 2), and then we normalized the total RNA-seq data based on six types of Ube2 subfamily genes expression in WT whole blood. We found Ube2h mRNA’s expression level was increased in comparison to WT (Figure 4A). By contrast, there was no change in Ube2l6, Ube2b, Ube2c, Ube2o and Ube2m mRNA expression level between WT and AD in whole blood (Figure 4B–F). Interestingly, this total RNA-seq data was correlated with RT-qPCR (Figure 2B).

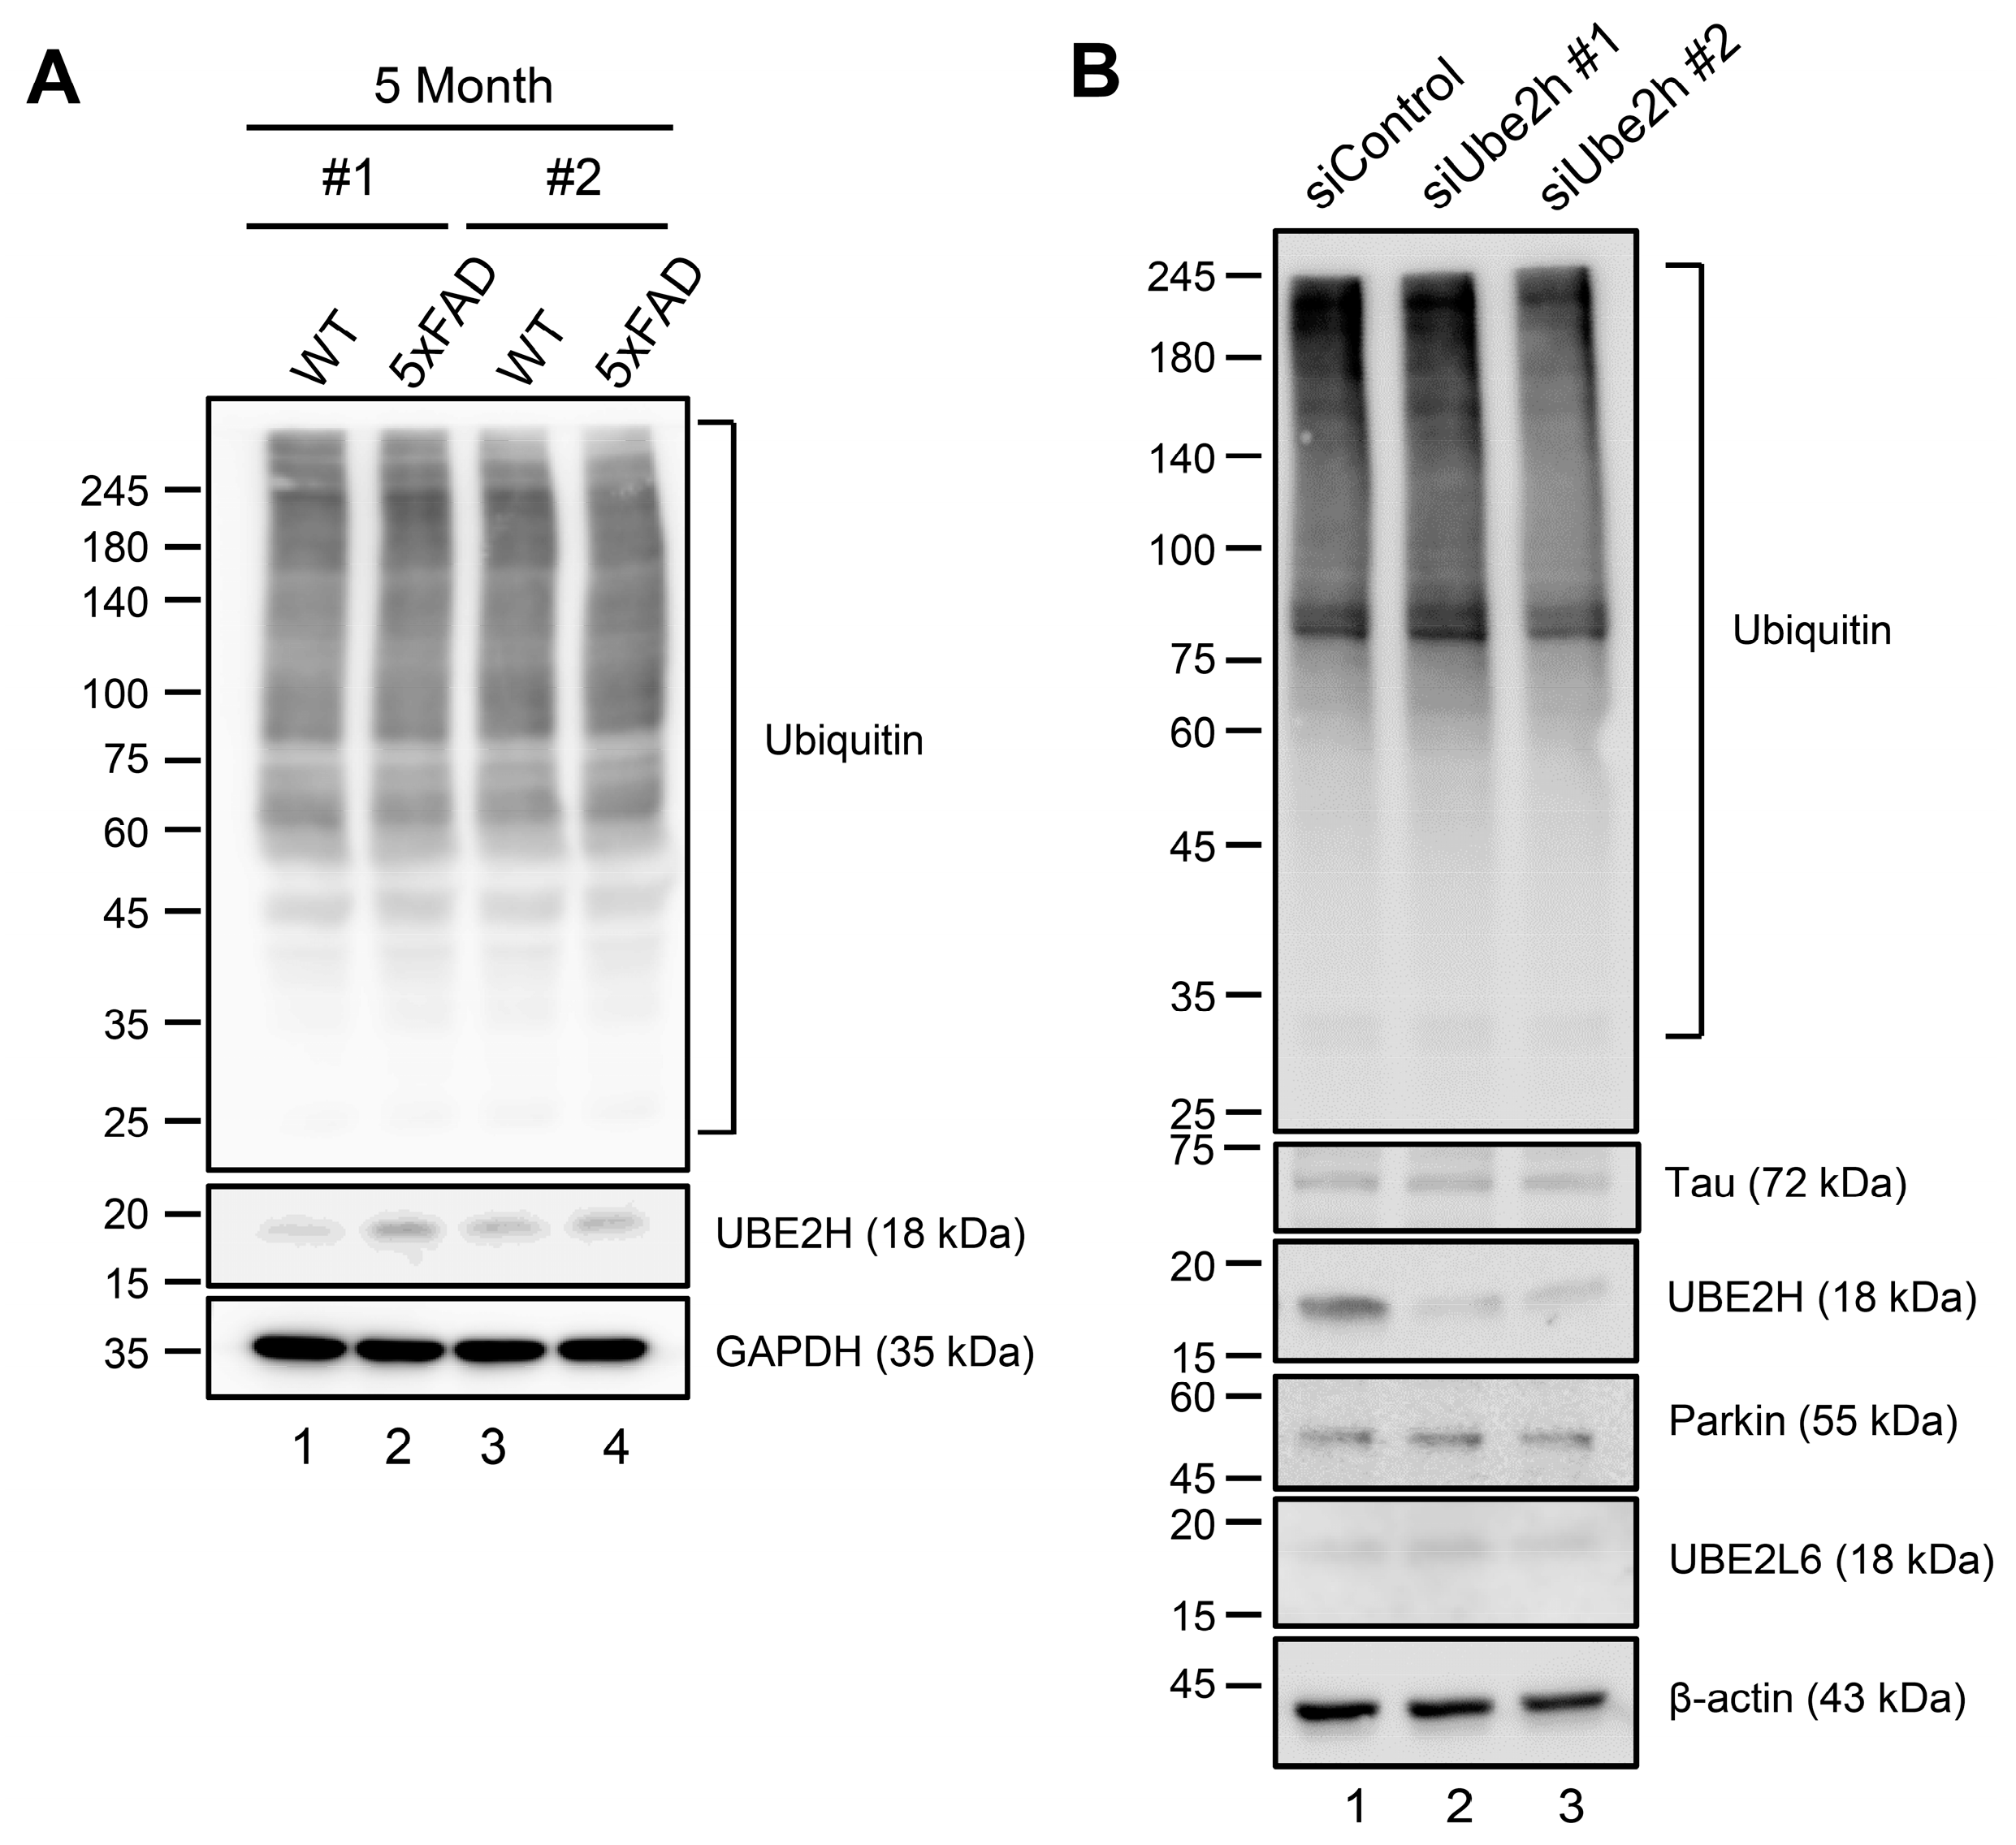
2.4. Biochemical Characterization of UBE2H on AD in Cortex

We speculate that abundant expression of Ube2h may be associated with an accumulation of proteolysis-related protein, and lead to neurodegenerative disorder. Therefore, we next evaluated whether Ube2h is enriched for protein expression in AD, given the main role of this protein in regulation of the ubiquitin-dependent process. We first tested the expression levels of UBE2H and ubiquitin in both WT and 5xFAD. As we expected, UBE2H was increased in AD compared to WT (Figure 5A, lane 2 and 4). However, as we did not find any changes in the level of endogenous ubiquitinated proteins caused by increments of UBE2H (Figure 5A), we reasoned that ubiquitinated proteins existed most abundantly in the tissues. To investigate the effects on AD-related proteins and the UBE2 family by the level of expression for UBE2H, we depleted UBE2H using siRNA (Figure 5B). Depletion of UBE2H led to significantly decreased endogenous expression for UBE2H, but did not affect the expression of Tau and Parkin as neurodegeneration disorder proteins, or UBE2L6 as a UBE2 family (Figure 5B, lane 2 and 3). Collectively, our results implicate that the UBE2H is increased in AD, thereby it is contributing to the AD development gradually.

2.5. Analysis of Ube2 Subfamilies’ Gene Expression Profiles in AD Patients from Peripheral Blood Mononuclear Cells (PBMCs) Microarray Dataset

Having found a change of gene expression for Ube2 subfamilies in AD in whole blood, we next analyzed the human Ube2 subfamilies’ gene expression profiles in AD patients through PBMC’s microarray data set [23]. In order to confirm the target Ube2 subfamilies’ gene expression profiles, we compared the severe AD patients’ PBMCs gene expression with normal and mild patients. Gene difference analysis revealed that there were five differential Ube2 subfamilies’ mRNA in patients’ PBMCs. To correlate the Ube2h gene expression result in 5xFAD whole blood, we then selectively compared the level of fold change ratio from three different probe sets in AD patients’ PBMCs. Interestingly, we found that Ube2h mRNA expression levels are elevated in severe AD patients (Figure 6A). On the other hand, Ube2b, Ube2c, Ube2o and Ube2m mRNA expression levels are not changed between normal and severe AD patients (Figure 6B). These results strongly suggest that the Ube2h gene is AD-specifically elevated in both 5xFAD and human AD patients.

3. Discussion

The AD pathology is mainly characterized in the cerebral cortex and hippocampus, and extensively connected with other neurodegenerative disorders such as PD [24,25]. Traditionally, clinical examinations, including blood tests, brain structural imaging and family history, have been used to determine the symptoms for AD. In addition, the diagnosis of AD is dependent on the disease progression and biomarker profiles. However, the onset and progression of AD in patients is clinically variable, and biomarker assessment and the molecular mechanisms remain poorly understood [26]. Most of all, the limitations of these approaches are due to the lack of knowledge about AD. Therefore, a better understanding of the molecular pathogenesis, with identification of simple and certain biomarkers, is required in improving the treatment of AD.
GWAS is the most powerful approach to genetic variation and gene function discovery of various human diseases [27,28,29,30]. This technique has revealed that eukaryotic gene expression is extensively regulated by long- and short-ncRNA [31,32,33]. We previously characterized neuronal enhancer activation, and suggested an understanding of the physiological and functional mechanism of gene expression in relation to various neural activity-dependent plasticity, with GWAS in cortical neurons [34,35]. In this study, we firstly sorted Ube2 subfamily genes through GWAS in cortex and whole blood, then identified cell-free circulating Ube2h mRNA as a new specific marker for diagnosis of AD. Although mRNA of Ube2 subfamilies were highly transcribed in both cortex and primary cortical neurons, interestingly, only Ube2h mRNA was significantly increased in whole blood from AD models and AD patients’ PBMCs (Figure 2, Figure 3 and Figure 6). Even though we did not show any information concerning why the blood included high Ube2h mRNA in the AD model, we suggest that stable biofluids, which included specific circulating miRNAs or mRNAs, could be changed upon some damage to various organs [36,37]. Gene expression profiling in blood is an important method in clinical approach and molecular study. The human blood circulation system plays an important role in the cell to cell network, such as transport of nutrients, and reception or exchange of external information. Cell-free RNAs were identified in serum from malignant melanoma patients around two decades ago [38]. Previous studies have shown that the cell-free transcript was strongly correlated with many human diseases, and specific circulating RNAs were suggested as potential biomarkers for diagnosis of various human diseases. Indeed, the use of circulating mRNA from patient-derived blood has been essential for diagnostic tests of various human diseases [39,40,41,42,43,44,45,46]. Recently, the blood samples were employed in vascular pathology, leading to a suggestion for the landscape of blood-based biomarkers in AD [47]. Therefore, our AD model-derived analysis, including bloods with the respective circular Ube2 mRNA, could be used to investigate AD pathological phenotypes. However, using a gene-based assay to quantify the frequency of target gene expression often showed unexpected features of the protein translation [48]. Although the expression of UBE2H is greatly increased (Figure 5A), similar to other Ube2 genes, Ube2h mRNA did not show a difference of transcription in the AD cortex (Figure 2B). It is not clear how E2 family genes allow this phenomenon. Moreover, the function of Ube2h in AD is not known so far. One model poses that so-called extracellular vesicles (EV) are required to concentrate Ube2h from blood to cortex, where the presence of this EV somehow activates the expression of Ube2h [49].
Part of the molecular mechanism of AD is the accumulation of amyloid beta (Aβ) and Tau, associated with mitochondrial dysfunction and mitophagy [50]. In the previous study, Ube2 subfamilies were found to be a co-factor for Parkin-dependent mitophagy. Most notably, knockdown of Ube2 subfamilies did not lead to degradation of Parkin proteins that make reductions of mitochondrial polyubiquitination [51]. Interestingly, depletion of Ube2h lacked the expression of polyubiquitination, and did not affect the levels of Tau and Parkin (Figure 5B), suggesting that UBE2H also may contribute to the ubiquitin-dependent system in the cortex, excluding Parkin and Tau as the well-known AD biomarkers. The exact mechanism by which UBE2H regulates AD-related ubiquitination is currently unknown. UBE2H may directly accumulate the enzymatic activity of E3s or its binding proteins. The UBC domain on UBE2 subfamilies may mediate the interaction with unknown AD-related factors, and increments of this interaction could lead to ubiquitination processes in AD. Suppression of Ube2h by siRNAs supports this possibility (Figure 5).
Transcription and translation processes are closely linked, resulting in expression of proteins to regulate homeostasis in organs. The translation and expression of UBE2H, a known E2s for the ubiquitin-dependent system in the posttranslational modification, promotes target protein ubiquitination [51]. This is believed as E2s result from the UBE2H-mediated ubiquitin-conjugating enzymatic activity [17]. Likewise, we observed that depletion of UBE2H decreased intracellular polyubiquitination. Although Ube2 subfamilies have integrated in AD, the function of these proteins remains largely unexplored. Given the role of the ubiquitin-conjugating enzyme, possibly a strong association of AD, the existence of the Ube2h gene in various tissue, including blood, is expected to be a new potential biomarker for prediction and diagnosis of AD without brain biopsy or cerebrospinal fluid (CSF) detection. Indeed, specific expression of circulating Ube2h mRNA in blood could be essential for AD patients, and could contribute to rapid diagnosis or prognosis with high specificity (Figure 6). The growing list of E2s characterized by powerful genetic system, as revealed in this study, greatly improve the isolation or identification of the potential proteins which have fundamental cellular functions in the treatment of AD.

4. Materials and Methods

4.1. Animals

5xFAD transgenic mice were used as models of Alzheimer’s disease. 5xFAD mice were obtained from the Jackson Laboratory. All animal experiments performed in this study were reviewed and approved by the IACUC committee at Korea Brain Research Institute (IACUC-20-00018).

4.2. RNA-Seq

Total RNA was isolated from mouse whole blood using conventional TRIzol method (Invitrogen). To profile gene expression from mouse whole blood, mouse blood (0.8 mL) was used for purification of the total RNA. Libraries were prepared using TruSeq Stranded Total RNA LT Sample Prep Kit (Human Mouse Rat, Illumina Inc., San Diego, CA, USA), according to the Illumina’s protocol. Briefly, fragmentation buffer was added to mRNA for short fragments first. Taking these short fragments as templates, oligo dT-primer was used to synthesize the first-strand cDNA. The second-strand cDNA was synthesized using buffer, dNTPs (containing dUTP instead of dTTP), RNaseH and DNA polymerase I, respectively. Double-stranded cDNA was purified with QIAQuick PCR extraction kit (Qiagen, Hilden, Germany) and resolved with elution buffer. Following the synthesis of second strand, end repair, addition of single A base, and adaptor ligation, cDNAs were connected with sequencing adaptors. The concentration of each library was measured by real-time PCR. Agilent 2100 Bioanalyzer (Santa Clara, CA, USA) was used for profiling the distribution of insert size. Constructed libraries were sequenced by Illumina HiSeq™ 4000, based on the manufacturer’s instructions which were sequenced for 100 cycles. The HiSeq Control Software HCS (v3.3) with RTA (v2.7.3) (Illumina Inc.), was used to provide the management and execution of the HiSeq™ 4000 experiment runs.

4.3. Sequencing Data Analysis

Images generated by HiSeq™ 4000 were converted into nucleotide sequences by base calling, and stored in FASTQ format utilizing Illumina package bcl2faseq (v2.16.0.10). By filtering the dirty reads, which contained adaptors, unknown or low Phred quality scored bases, from raw reads, clean reads were generated. Clean reads were mapped to reference UCSC hg19 genome and gene sequences using Tophat2 (v2.1.0). Mismatches of no more than 5 bases were allowed in the alignment. To annotate gene expression, fragments per kb per million reads (FPKM) values of each gene were calculated using Cufflinks package (v2.2.1). To analyze differentially expressed genes (DEGs), fold-change analysis was performed using Agilent GeneSpring (v7.3). For the expression pattern analysis, hierarchical clustering analysis was performed using Agilent GeneSpring (v7.3). Functional enrichment analysis was done using Gene Ontology (GO) functional classification system (www.geneontology.org) and DAVID website (http://david.ncifcrf.gov). Raw reads and data are accessible in the Gene Expression Omnibus (GSE 147792)

4.4. Microarray Data

Microarray datasets GSE18309 were downloaded from EMBL-ENA website (www.ebi.ac.uk/ena). The GSE18309 datasets were derived from human PBMCs, and their microarray experiments were performed using Affymetrix Human Genome U133 Plus 2.0 Array (Affymetrix, Santa Clara, CA, USA).

4.5. Data Analysis

The obtained raw data were analyzed through a series of python commands, and visualized using Agilent GeneSpring 7.3. Briefly, 9 raw datasets were normalized by dividing each gene’s intensity values by each sample’s 50% percentile value. Secondly, all genes in samples of the same group (control, mid, AD) were averaged, and finally, to calculate the differentially expressed genes, the averaged value in mid and AD group were normalized by that of the control group. The genes with fold change ratio >2 or <0.5 were considered as DEGs.

4.6. RT-qPCR

Total RNA was extracted from mouse cortex or whole blood using the TRIzol method. cDNA synthesis was done using High-Capacity reverse transcription kit (Applied Biosystems) according to the manufacturer protocols. Primers employed were: Ube2h coding forward, 5′-CCATAGATCCTCTCAATGGTG-3′, reverse, 5′-CTCTTCCGTTGCGTACTTCT-3′; Ube2l6 coding forward, 5′-CTCAAAGCCTTCCAAGTGCG-3′, reverse, 5′-CAGGCACACCAGACCATCCT-3′; Ube2b coding forward, 5′-GAATGGAAGTTAAGATGGAAGA-3′, reverse, 5′-GCTGATGGTAGCATATGTTTAG-3′; Ube2o coding forward, 5′-CCAATCCAGGTACCTAGGAG-3′, reverse, 5′-CCCCACTTTTGCTACCTCTC-3′; Ube2m coding forward, 5′-CATTTAAGAAATACCTGCAAGAA-3′, reverse, 5′-ATCAGGGATCTTGGCTGGAG-3′; Ube2c coding forward, 5′-GAGGATGTTGAGGCAGACGT-3′, reverse, 5′-GGGACAGGGTTACCCACAT-3′. Statistical significance was evaluated by an unpaired two-tailed t-test.

4.7. Cell Culture, siRNA Transfection and Immunoblotting

Human embryonic kidney (HEK) 293T cells were cultured in Dulbecco’s Modified Eagles Medium (DMEM, Hyclone) supplemented with 1% penicillin/streptomycin (P/S) and 10% fetal bovine serum (Hyclone). Predesigned siRNA duplexes were purchased from Bioneer, and 10 nM siRNA transfection was carried out using RNAiMAX (Invitrogen, Waltham, MA, USA). Cells and tissues were lysed with N-PER™ and T-PER™ lysis buffer (Thermo Scientific, Waltham, MA, USA) supplemented with protease inhibitor cocktail (Roche, Hoffmann-La Roche AG, Basel, Switzerland), respectively. Lysates were resolved by SDS-PAGE gels and transferred onto nitrocellulose (NC) membranes (Merck Millipore, Burlington, MA, USA), and then antibodies were detected using the D-Plus ECL Femto System (Dongin Bio, Seoul, Korea) and the ImageQuant LAS4000 (GE Healthcare, Chicago, IL, USA). Antibodies used for immunoblotting included the following: anti-Ubiquitin (P4D1, Santa Cruz, Santa Cruz Biotechnology, Dallas, TX, USA), anti-UBE2H (18-Z, Santa Cruz), anti-Parkin (PRK8, Santa Cruz), anti-GAPDH (0411, Santa Cruz), anti-β-actin (C4, Santa Cruz), anti-Tau (Abcam, Cambridge, UK), and anti-UBE2L6 (MyBioSource, San Diego, CA, USA).

Supplementary Materials

The following are available online at https://www.mdpi.com/1422-0067/21/9/3398/s1, Figure S1. Dynamic gene expression from whole blood RNA-seq data in AD model. Table S1. GO analysis result from WT and 5xFAD in whole blood. Table S1. GO analysis result from WT and 5xFAD in whole blood. Table S2. Profile of upregulated or downregulated genes in 5xFAD whole blood through Kyoto Encyclopedia of Gene and Genomes (KEGG) pathway analysis.

Author Contributions

J.-Y.J. designed the project. J.-Y.J. performed total RNA-seq, mRNA expression analysis in vivo and in vitro. J.-Y.J. performed reanalysis of microarray data. K.-H.L. performed transfection, siRNA design, western blot. K.-H.L. and J.-Y.J. wrote the manuscript. All authors discussed the results and commented on the manuscript. All authors have read and agreed to the published version of the manuscript.

Funding

This work was supported by Korea Brain Research Institute (KBRI) basic research program through KBRI funded by the Ministry of Science and ICT (20-BR-02-13), and Basic Science Research Program through the National Research Foundation of Korea (NRF) funded by the Ministry of Education (2019R1F1A1059595, 2017R1D1A1B03030741).

Acknowledgments

We would like to thank Sun-Woo Lee for assistance of bioinformatics analysis. We thank Hyang-Sook Hoe for kindly providing 5xFAD mice.

Conflicts of Interest

The authors declare no competing financial interests.

References

  1. Bellenguez, C.; Grenier-Boley, B.; Lambert, J.C. Genetics of Alzheimer’s disease: Where we are, and where we are going. Curr. Opin. Neurobiol. 2019, 61, 40–48. [Google Scholar] [CrossRef] [PubMed]
  2. Cacace, R.; Sleegers, K.; Van Broeckhoven, C. Molecular genetics of early-onset Alzheimer’s disease revisited. Alzheimers Dement. 2016, 12, 733–748. [Google Scholar] [CrossRef] [PubMed] [Green Version]
  3. Farrer, L.A.; Cupples, L.A.; Haines, J.L.; Hyman, B.; Kukull, W.A.; Mayeux, R.; Myers, R.H.; Pericak-Vance, M.A.; Risch, N.; van Duijn, C.M. Effects of age, sex, and ethnicity on the association between apolipoprotein E genotype and Alzheimer disease. A meta-analysis. APOE and Alzheimer Disease Meta Analysis Consortium. JAMA 1997, 278, 1349–1356. [Google Scholar] [CrossRef] [PubMed]
  4. Yap, T.E.; Balendra, S.I.; Almonte, M.T.; Cordeiro, M.F. Retinal correlates of neurological disorders. Ther. Adv. Chronic Dis. 2019, 10, 2040622319882205. [Google Scholar] [CrossRef]
  5. Fu, P.; Gao, M.; Yung, K.K.L. Association of intestinal disorders with Parkinson’s disease and Alzheimer’s disease: A systematic review and meta-analysis. ACS Chem. Neurosci. 2019, 11, 395–405. [Google Scholar] [CrossRef]
  6. Davis, L.; Chin, J.W. Designer proteins: Applications of genetic code expansion in cell biology. Nat. Rev. Mol. Cell Biol. 2012, 13, 168–182. [Google Scholar] [CrossRef]
  7. Lim, K.H.; Song, M.H.; Baek, K.H. Decision for cell fate: Deubiquitinating enzymes in cell cycle checkpoint. Cell Mol. Life Sci. 2016, 73, 1439–1455. [Google Scholar] [CrossRef]
  8. Vandenabeele, P.; Bertrand, M.J. The role of the IAP E3 ubiquitin ligases in regulating pattern-recognition receptor signalling. Nat. Rev. Immunol. 2012, 12, 833–844. [Google Scholar] [CrossRef]
  9. Haakonsen, D.L.; Rape, M. Branching Out: Improved Signaling by Heterotypic Ubiquitin Chains. Trends Cell Biol. 2019, 29, 704–716. [Google Scholar] [CrossRef]
  10. Zheng, N.; Shabek, N. Ubiquitin Ligases: Structure, Function, and Regulation. Annu. Rev. Biochem. 2017, 86, 129–157. [Google Scholar] [CrossRef]
  11. Stewart, M.D.; Ritterhoff, T.; Klevit, R.E.; Brzovic, P.S. E2 enzymes: More than just middle men. Cell Res. 2016, 26, 423–440. [Google Scholar] [CrossRef] [PubMed] [Green Version]
  12. Qin, S.; Nakajima, B.; Nomura, M.; Arfin, S.M. Cloning and characterization of a Saccharomyces cerevisiae gene encoding a new member of the ubiquitin-conjugating protein family. J. Biol. Chem. 1991, 266, 15549–15554. [Google Scholar]
  13. Kaiser, P.; Seufert, W.; Hofferer, L.; Kofler, B.; Sachsenmaier, C.; Herzog, H.; Jentsch, S.; Schweiger, M.; Schneider, R. A human ubiquitin-conjugating enzyme homologous to yeast UBC8. J. Biol. Chem. 1994, 269, 8797–8802. [Google Scholar] [PubMed]
  14. Kaiser, P.; Mandl, S.; Schweiger, M.; Schneider, R. Characterization of functionally independent domains in the human ubiquitin conjugating enzyme UbcH2. FEBS Lett. 1995, 377, 193–196. [Google Scholar] [CrossRef] [Green Version]
  15. Li, Y.P.; Lecker, S.H.; Chen, Y.; Waddell, I.D.; Goldberg, A.L.; Reid, M.B. TNF-alpha increases ubiquitin-conjugating activity in skeletal muscle by up-regulating UbcH2/E220k. FASEB J. 2003, 17, 1048–1057. [Google Scholar] [CrossRef] [PubMed]
  16. Vourc’h, P.; Martin, I.; Bonnet-Brilhault, F.; Marouillat, S.; Barthelemy, C.; Pierre Muh, J.; Andres, C. Mutation screening and association study of the UBE2H gene on chromosome 7q32 in autistic disorder. Psychiatr. Genet. 2003, 13, 221–225. [Google Scholar] [CrossRef]
  17. Martin, I.; Vourc’h, P.; Mahe, M.; Thepault, R.A.; Antar, C.; Vedrine, S.; Praline, J.; Camu, W.; Andres, C.R.; Corcia, P.; et al. Association study of the ubiquitin conjugating enzyme gene UBE2H in sporadic ALS. Amyotroph. Lateral. Scler. 2009, 10, 432–435. [Google Scholar] [CrossRef]
  18. Sokolowski, M.; Wasserman, J.; Wasserman, D. Gene-level associations in suicide attempter families show overrepresentation of synaptic genes and genes differentially expressed in brain development. Am. J. Med. Genet. B Neuropsychiatr. Genet. 2018, 177, 774–784. [Google Scholar] [CrossRef]
  19. Kim, K.M.; Abdelmohsen, K.; Mustapic, M.; Kapogiannis, D.; Gorospe, M. RNA in extracellular vesicles. Wiley Interdiscip. Rev. RNA 2017, 8, e1413. [Google Scholar] [CrossRef]
  20. Chen, X.; Ba, Y.; Ma, L.; Cai, X.; Yin, Y.; Wang, K.; Guo, J.; Zhang, Y.; Chen, J.; Guo, X.; et al. Characterization of microRNAs in serum: A novel class of biomarkers for diagnosis of cancer and other diseases. Cell Res. 2008, 18, 997–1006. [Google Scholar] [CrossRef] [Green Version]
  21. Kim, T.K.; Hemberg, M.; Gray, J.M.; Costa, A.M.; Bear, D.M.; Wu, J.; Harmin, D.A.; Laptewicz, M.; Barbara-Haley, K.; Kuersten, S.; et al. Widespread transcription at neuronal activity-regulated enhancers. Nature 2010, 465, 182–187. [Google Scholar] [CrossRef] [PubMed] [Green Version]
  22. Meiklejohn, H.; Mostaid, M.S.; Luza, S.; Mancuso, S.G.; Kang, D.; Atherton, S.; Rothmond, D.A.; Weickert, C.S.; Opazo, C.M.; Pantelis, C.; et al. Blood and brain protein levels of ubiquitin-conjugating enzyme E2K (UBE2K) are elevated in individuals with schizophrenia. J. Psychiatr. Res. 2019, 113, 51–57. [Google Scholar] [CrossRef] [PubMed]
  23. Ma, G.; Liu, M.; Du, K.; Zhong, X.; Gong, S.; Jiao, L.; Wei, M. Differential Expression of mRNAs in the Brain Tissues of Patients with Alzheimer’s Disease Based on GEO Expression Profile and Its Clinical Significance. Biomed. Res. Int. 2019, 2019, 8179145. [Google Scholar] [CrossRef] [PubMed] [Green Version]
  24. Masters, C.L.; Bateman, R.; Blennow, K.; Rowe, C.C.; Sperling, R.A.; Cummings, J.L. Alzheimer’s disease. Nat. Rev. Dis. Primers 2015, 1, 15056. [Google Scholar] [CrossRef]
  25. Kim, Y.S.; Jung, H.M.; Yoon, B.E. Exploring glia to better understand Alzheimer’s disease. Anim. Cells Syst. 2018, 22, 213–218. [Google Scholar] [CrossRef] [PubMed] [Green Version]
  26. Zhao, Y.; Zhang, Y.; Zhang, L.; Dong, Y.; Ji, H.; Shen, L. The Potential Markers of Circulating microRNAs and long non-coding RNAs in Alzheimer’s Disease. Aging Dis. 2019, 10, 1293–1301. [Google Scholar] [CrossRef] [Green Version]
  27. Arning, A.; Hiersche, M.; Witten, A.; Kurlemann, G.; Kurnik, K.; Manner, D.; Stoll, M.; Nowak-Gottl, U. A genome-wide association study identifies a gene network of ADAMTS genes in the predisposition to pediatric stroke. Blood 2012, 120, 5231–5236. [Google Scholar] [CrossRef] [Green Version]
  28. Tam, V.; Patel, N.; Turcotte, M.; Bosse, Y.; Pare, G.; Meyre, D. Benefits and limitations of genome-wide association studies. Nat. Rev. Genet. 2019, 20, 467–484. [Google Scholar] [CrossRef]
  29. Visscher, P.M.; Wray, N.R.; Zhang, Q.; Sklar, P.; McCarthy, M.I.; Brown, M.A.; Yang, J. 10 Years of GWAS Discovery: Biology, Function, and Translation. Am. J. Hum. Genet. 2017, 101, 5–22. [Google Scholar] [CrossRef] [Green Version]
  30. Shim, J.E.; Lee, T.; Lee, I. From sequencing data to gene functions: Co-functional network approaches. Anim. Cells Syst. 2017, 21, 77–83. [Google Scholar] [CrossRef]
  31. Guttman, M.; Amit, I.; Garber, M.; French, C.; Lin, M.F.; Feldser, D.; Huarte, M.; Zuk, O.; Carey, B.W.; Cassady, J.P.; et al. Chromatin signature reveals over a thousand highly conserved large non-coding RNAs in mammals. Nature 2009, 458, 223–227. [Google Scholar] [CrossRef] [PubMed]
  32. Marques, A.C.; Ponting, C.P. Catalogues of mammalian long noncoding RNAs: Modest conservation and incompleteness. Genome Biol. 2009, 10, R124. [Google Scholar] [CrossRef] [PubMed] [Green Version]
  33. Zhao, J.; Ohsumi, T.K.; Kung, J.T.; Ogawa, Y.; Grau, D.J.; Sarma, K.; Song, J.J.; Kingston, R.E.; Borowsky, M.; Lee, J.T. Genome-wide identification of polycomb-associated RNAs by RIP-seq. Mol. Cell 2010, 40, 939–953. [Google Scholar] [CrossRef] [PubMed] [Green Version]
  34. Joo, J.Y.; Schaukowitch, K.; Farbiak, L.; Kilaru, G.; Kim, T.K. Stimulus-specific combinatorial functionality of neuronal c-fos enhancers. Nat. Neurosci. 2016, 19, 75–83. [Google Scholar] [CrossRef] [Green Version]
  35. Schaukowitch, K.; Joo, J.Y.; Liu, X.; Watts, J.K.; Martinez, C.; Kim, T.K. Enhancer RNA facilitates NELF release from immediate early genes. Mol. Cell 2014, 56, 29–42. [Google Scholar] [CrossRef] [Green Version]
  36. Siddeek, B.; Inoubli, L.; Lakhdari, N.; Rachel, P.B.; Fussell, K.C.; Schneider, S.; Mauduit, C.; Benahmed, M. MicroRNAs as potential biomarkers in diseases and toxicology. Mutat. Res. Genet. Toxicol. Environ. Mutagen. 2014, 764–765, 46–57. [Google Scholar] [CrossRef]
  37. Yu, H.W.; Cho, W.C. The role of microRNAs in toxicology. Arch. Toxicol. 2015, 89, 319–325. [Google Scholar] [CrossRef]
  38. Kopreski, M.S.; Benko, F.A.; Kwak, L.W.; Gocke, C.D. Detection of tumor messenger RNA in the serum of patients with malignant melanoma. Clin. Cancer Res. 1999, 5, 1961–1965. [Google Scholar]
  39. Hampel, H.; O’Bryant, S.E.; Molinuevo, J.L.; Zetterberg, H.; Masters, C.L.; Lista, S.; Kiddle, S.J.; Batrla, R.; Blennow, K. Blood-based biomarkers for Alzheimer disease: Mapping the road to the clinic. Nat. Rev. Neurol. 2018, 14, 639–652. [Google Scholar] [CrossRef]
  40. Song, Y.; Liu, Y.; Wu, P.; Zhang, F.; Wang, G. Genome-wide mRNA expression analysis of peripheral blood from patients with obsessive-compulsive disorder. Sci. Rep. 2018, 8, 12583. [Google Scholar] [CrossRef] [Green Version]
  41. Wang, T.; Yu, D.R.; Huang, J.; Liu, Q.; Wang, D.X.; Luo, N.; Jia, H.; Fan, H.F.; Liu, Q.B. Multimodal Rehabilitation Program Promotes Motor Function Recovery of Rats After Ischemic Stroke by Upregulating Expressions of GAP-43, SYN, HSP70, and C-MYC. J. Stroke Cerebrovasc. Dis. 2018, 27, 2829–2839. [Google Scholar] [CrossRef] [PubMed]
  42. Gliddon, H.D.; Herberg, J.A.; Levin, M.; Kaforou, M. Genome-wide host RNA signatures of infectious diseases: Discovery and clinical translation. Immunology 2018, 153, 171–178. [Google Scholar] [CrossRef] [PubMed] [Green Version]
  43. Souza, M.F.; Kuasne, H.; Barros-Filho, M.C.; Ciliao, H.L.; Marchi, F.A.; Fuganti, P.E.; Paschoal, A.R.; Rogatto, S.R.; Colus, I.M.S. Circulating mRNAs and miRNAs as candidate markers for the diagnosis and prognosis of prostate cancer. PLoS ONE 2017, 12, e0184094. [Google Scholar] [CrossRef] [PubMed]
  44. Miura, N.; Nakamura, H.; Sato, R.; Tsukamoto, T.; Harada, T.; Takahashi, S.; Adachi, Y.; Shomori, K.; Sano, A.; Kishimoto, Y.; et al. Clinical usefulness of serum telomerase reverse transcriptase (hTERT) mRNA and epidermal growth factor receptor (EGFR) mRNA as a novel tumor marker for lung cancer. Cancer Sci. 2006, 97, 1366–1373. [Google Scholar] [CrossRef] [PubMed]
  45. Barzon, L.; Boscaro, M.; Pacenti, M.; Taccaliti, A.; Palu, G. Evaluation of circulating thyroid-specific transcripts as markers of thyroid cancer relapse. Int. J. Cancer 2004, 110, 914–920. [Google Scholar] [CrossRef] [PubMed]
  46. Viereck, J.; Thum, T. Circulating Noncoding RNAs as Biomarkers of Cardiovascular Disease and Injury. Circ. Res. 2017, 120, 381–399. [Google Scholar] [CrossRef]
  47. Fenouil, T.; Fourier, A.; Quadrio, I.; Streichenberger, N.; Bernardini, S.; Zima, T.; Perret-Liaudet, A.; Meyronet, D. The standardization of cerebrospinal fluid markers and neuropathological diagnoses brings to light the frequent complexity of concomitant pathology in Alzheimer’s disease: The next challenge for biochemical markers? Clin. Biochem. 2019, 72, 15–23. [Google Scholar] [CrossRef]
  48. Liu, Y.; Beyer, A.; Aebersold, R. On the Dependency of Cellular Protein Levels on mRNA Abundance. Cell 2016, 165, 535–550. [Google Scholar] [CrossRef] [Green Version]
  49. Pulliam, L.; Sun, B.; Mustapic, M.; Chawla, S.; Kapogiannis, D. Plasma neuronal exosomes serve as biomarkers of cognitive impairment in HIV infection and Alzheimer’s disease. J. Neurovirol. 2019, 25, 702–709. [Google Scholar] [CrossRef]
  50. Reddy, P.H.; Oliver, D.M. Amyloid Beta and Phosphorylated Tau-Induced Defective Autophagy and Mitophagy in Alzheimer’s Disease. Cells 2019, 8, 488. [Google Scholar] [CrossRef] [Green Version]
  51. Geisler, S.; Vollmer, S.; Golombek, S.; Kahle, P.J. The ubiquitin-conjugating enzymes UBE2N, UBE2L3 and UBE2D2/3 are essential for Parkin-dependent mitophagy. J. Cell Sci. 2014, 127, 3280–3293. [Google Scholar] [CrossRef] [PubMed] [Green Version]
Figure 1. Genome-wide gene expression profile for ubiquitin conjugating enzyme E2 (Ube2) subfamily in the cortical neurons at days in vitro (DIV) 6. (AF) Genome browser view of the Ube2 subfamilies genes genomic locus, with total RNA-seq data expression of Ube2h, Ube2l6, Ube2b, Ube2c, Ube2o, and Ube2m mRNA in cortical neurons. Those Ube2 subfamily genes are well expressed in the cultured E16.5 cortical neurons.
Ijms 21 03398 g001
Figure 2. Ube2 subfamilies’ mRNA transcription profile from AD model mouse cortex and whole blood. (A) RT-qPCR analysis of Ube2h, Ube2l6, Ube2b, Ube2c, Ube2o and Ube2m mRNA expression in mouse cortex from WT and AD model. Data are mean ± standard error of the mean (s.e.m.) from n = 3 mice per group; unpaired two-tailed t-test. (B) RT-qPCR analysis of Ube2h, Ube2l6, Ube2b, Ube2c, Ube2o and Ube2m mRNA expression in mouse whole blood from WT and AD model. Data are mean ± s.e.m. from n = 3 mice per group; unpaired two-tailed t-test.
Ijms 21 03398 g002
Figure 3. Total RNA-seq workflow from mouse whole blood. (A) Total RNA-seq analysis. Single and paired-end reads calculated from NGS sequencing. Mapping with preprocessing from Ras sequencing data, and then filtered with differently expressed genes from WT and 5xFAD. 4,109 genes are two-fold change of DEG between WT and 5xFAD. (B) Assessing normalization of total RNA-seq using scatterplot matrices from WT and AD model. X-axis indicates gene expression of WT, Y-axis indicates gene expression of AD.
Ijms 21 03398 g003
Figure 4. Gene expression change profile through total RNA-seq for AD from whole blood. (AF) Genome browser view of the genomic locus for Ube2 subfamily genes, with total RNA-seq data expression of Ube2h, Ube2l6, Ube2b, Ube2c, Ube2o, and Ube2m mRNA in whole blood from WT and AD model. Expression of Ube2h mRNA was increased in AD model. On the other hand, there was no change of Ube2l6, Ube2b, Ube2c, Ube2o, and Ube2m gene expression level between WT and AD model.
Ijms 21 03398 g004
Figure 5. UBE2H was up-regulated in the whole cortex of AD (A) UBE2H was increased in AD model. Cortex tissues were obtained from 5XFAD mouse, and lysates were analyzed by immunoblotting with the indicated antibodies. (B) Knockdown of Ube2h did not affect a UBE2 family and AD related protein expression. HEK 293T cells transfected with indicated siRNAs for 48 h and harvested. Endogenous proteins, including UBE2H levels, were analyzed by immunoblotting.
Ijms 21 03398 g005
Figure 6. Gene expression profile of Ube2 subfamilies from AD patients in PBMC. (A) Ube2h mRNA expression in AD patients through PBMCs microarray data set. (B) Differential Ube2 subfamilies’ mRNA expression in PBMCs of AD patients.
Ijms 21 03398 g006

